Article

Broadly Targeted Metabolomics Analysis of Differential Metabolites Between Bupleurum chinense DC. and Bupleurum scorzonerifolium Willd.

1
State Key Laboratory of Quality Research in Chinese Medicine, Faculty of Chinese Medicine, Macau University of Science and Technology, Macau 999078, China
2
College of Pharmacy, Shandong University of Traditional Chinese Medicine, Jinan 250355, China
3
Key Laboratory of Traditional Chinese Medicine Classical Theory, Ministry of Education, Shandong University of Traditional Chinese Medicine, Jinan 250355, China
4
Institute of Crop Germplasm Resources, Shandong Academy of Agricultural Sciences, Jinan 250131, China
*
Authors to whom correspondence should be addressed.
These authors have contributed equally to this work and share first authorship.
Metabolites 2025, 15(2), 119; https://doi.org/10.3390/metabo15020119
Submission received: 9 January 2025 / Revised: 4 February 2025 / Accepted: 7 February 2025 / Published: 11 February 2025
(This article belongs to the Section Advances in Metabolomics)

Abstract

:
Background/Objectives: Bupleuri Radix is a plant in the Apiaceae family Bupleurum Chinense DC. or Bupleurum scorzonerifolium Willd. root. The dissimilarities in the metabolite profiles of plants directly correlate with the disparities in their clinical efficacy. Methods: Therefore, the wild Bupleurum Chinense DC. (YBC) and wild Bupleurum scorzonerifolium Willd. (YNC) were used as research materials. They were analyzed using the UPLC-MS/MS and the similarities and differences were uncovered based on differential metabolites. Results: Our results proved that the differences in clinical efficacy between YBC and YNC may be attributed to their distinct metabolite profiles, as follows: (1) a total of 12 classes of 2059 metabolites were identified in the roots, with phenolic acids, terpenoids, and flavonoids being the most abundant metabolic products, with 2026 shared components between the two, 2045 in YBC, and 2040 in YNC; (2) a total of 718 differential metabolites were identified, accounting for 35.44% of the shared metabolites. Among them, YBC had 452 metabolites with higher content relative to YNC, representing 62.95%, and 266 components with lower content, representing 37.05%; (3) the KEEG enrichment analysis results show that the differential metabolic pathways are flavone and flavonol biosynthesis, linoleic acid metabolism, arachidonic acid metabolism, sesquiterpenoid and triterpenoid biosynthesis, and linolenic acid metabolism. Conclusions: These new findings will serve as a foundation for further study of the BR biosynthetic pathway and offer insights into the practical use of traditional Chinese medicine in clinical settings.

1. Introduction

Bupleuri Radix (BR, or Chaihu in Chinese) is a plant in the Apiaceae family Bupleurum Chinense DC. (BC) or Bupleurum scorzonerifolium Willd. (NC) dried root. According to their different characters, they were called “Northern Bupleurum” and “Southern Bupleurum” and had a medicinal history of more than 2000 years [1]. BR contains saponins, flavonoids, volatile oils, polysaccharides, lignans and other components [2]. It has the effect of clearing heat deficiency [3], soothing the liver and relieving depression [4], and lifting Yang Qi [5], and was often used for cold fever, cold and heat exchanges, chest and hypochondriac pain, uterine prolapse, menstrual irregularity, insomnia, and dreaminess [6,7]. On the other hand, it has anti-tumor, anti-depression [8], anti-inflammatory, anti-viral, and other effects [9]. It was a commonly used clinical medication for relieving exterior symptoms and has a large market demand.
In the clinical application, BC is mainly used to treat typhoid fever and NC is mainly used to clear liver fever [10]. Over the past decade, in most areas of our country, there was no distinction and there was confusion about its use. Some parts of China, such as Beijing, required that when using two kinds of BR, the doctors should prescribe them separately as needed. It is traditionally believed that NC has better quality than BC because of its medicinal material properties, color, odor, and habitat [11,12,13]. However, the quality of medicinal materials is uneven, high-quality BR resources were relatively scarce, and BC was the mainstream in the north of commodity circulation. Currently, the medicinal materials mainly come from cultivated bupleurum, mainly from Gansu, Shanxi, and Shaanxi provinces.
Studies have shown that there were differences in pharmacological effects between them. Through the study of the saikosaponin (SS) content in NC and BC, the results showed that the total SS in BC and SSa were more than those in NC, and some studies showed that the total SS in BC was about four times that in NC [14]. In addition, through the study of the volatile oil components in BR, it was found that the volatile oil content of BC was much lower than that of NC, and there were obvious differences in the chemical composition [15]. Not only were there many differences in the proportion of common components, but NC also contained some unique sesquiterpene components, such as piperene, A-cedrene, b-elemene, etc. Guo et al. [16] compared the antidepressant efficacy of different varieties of Xiao Yao powder composed of BR to explore its influence on the changes in endogenous metabolites in rats, and found that both had obvious antidepressant effects, but the antidepressant effect and onset time of Xiaoyao powder composed of NC was slightly better than that of BC, indicating that NC had a unique advantage in pharmacological activity.
Metabolomics technology can comprehensively analyze metabolites in organisms, provide strong technical support for the study of natural products, and provide a more comprehensive perspective for the study of natural products [17]. It’s a newly developed important subject of bioomics and also is an important component of systems biology [18,19,20]. In this study, we selected the wild Bupleurum chinense DC. (YBC) and Bupleurum scorzonerifolium Willd. (YNC) as research materials, and the metabolite types of them were detected by using widely targeted metabolomics methods and ultra-high-performance liquid chromatography tandem mass spectrometry (UPLC/ESI-Q TRAP-MS/MS) technology, and their differences were compared and analyzed. From the perspective of different metabolites, the similarities and differences between them were revealed, which provided references for the development and utilization of BR.

2. Materials and Methods

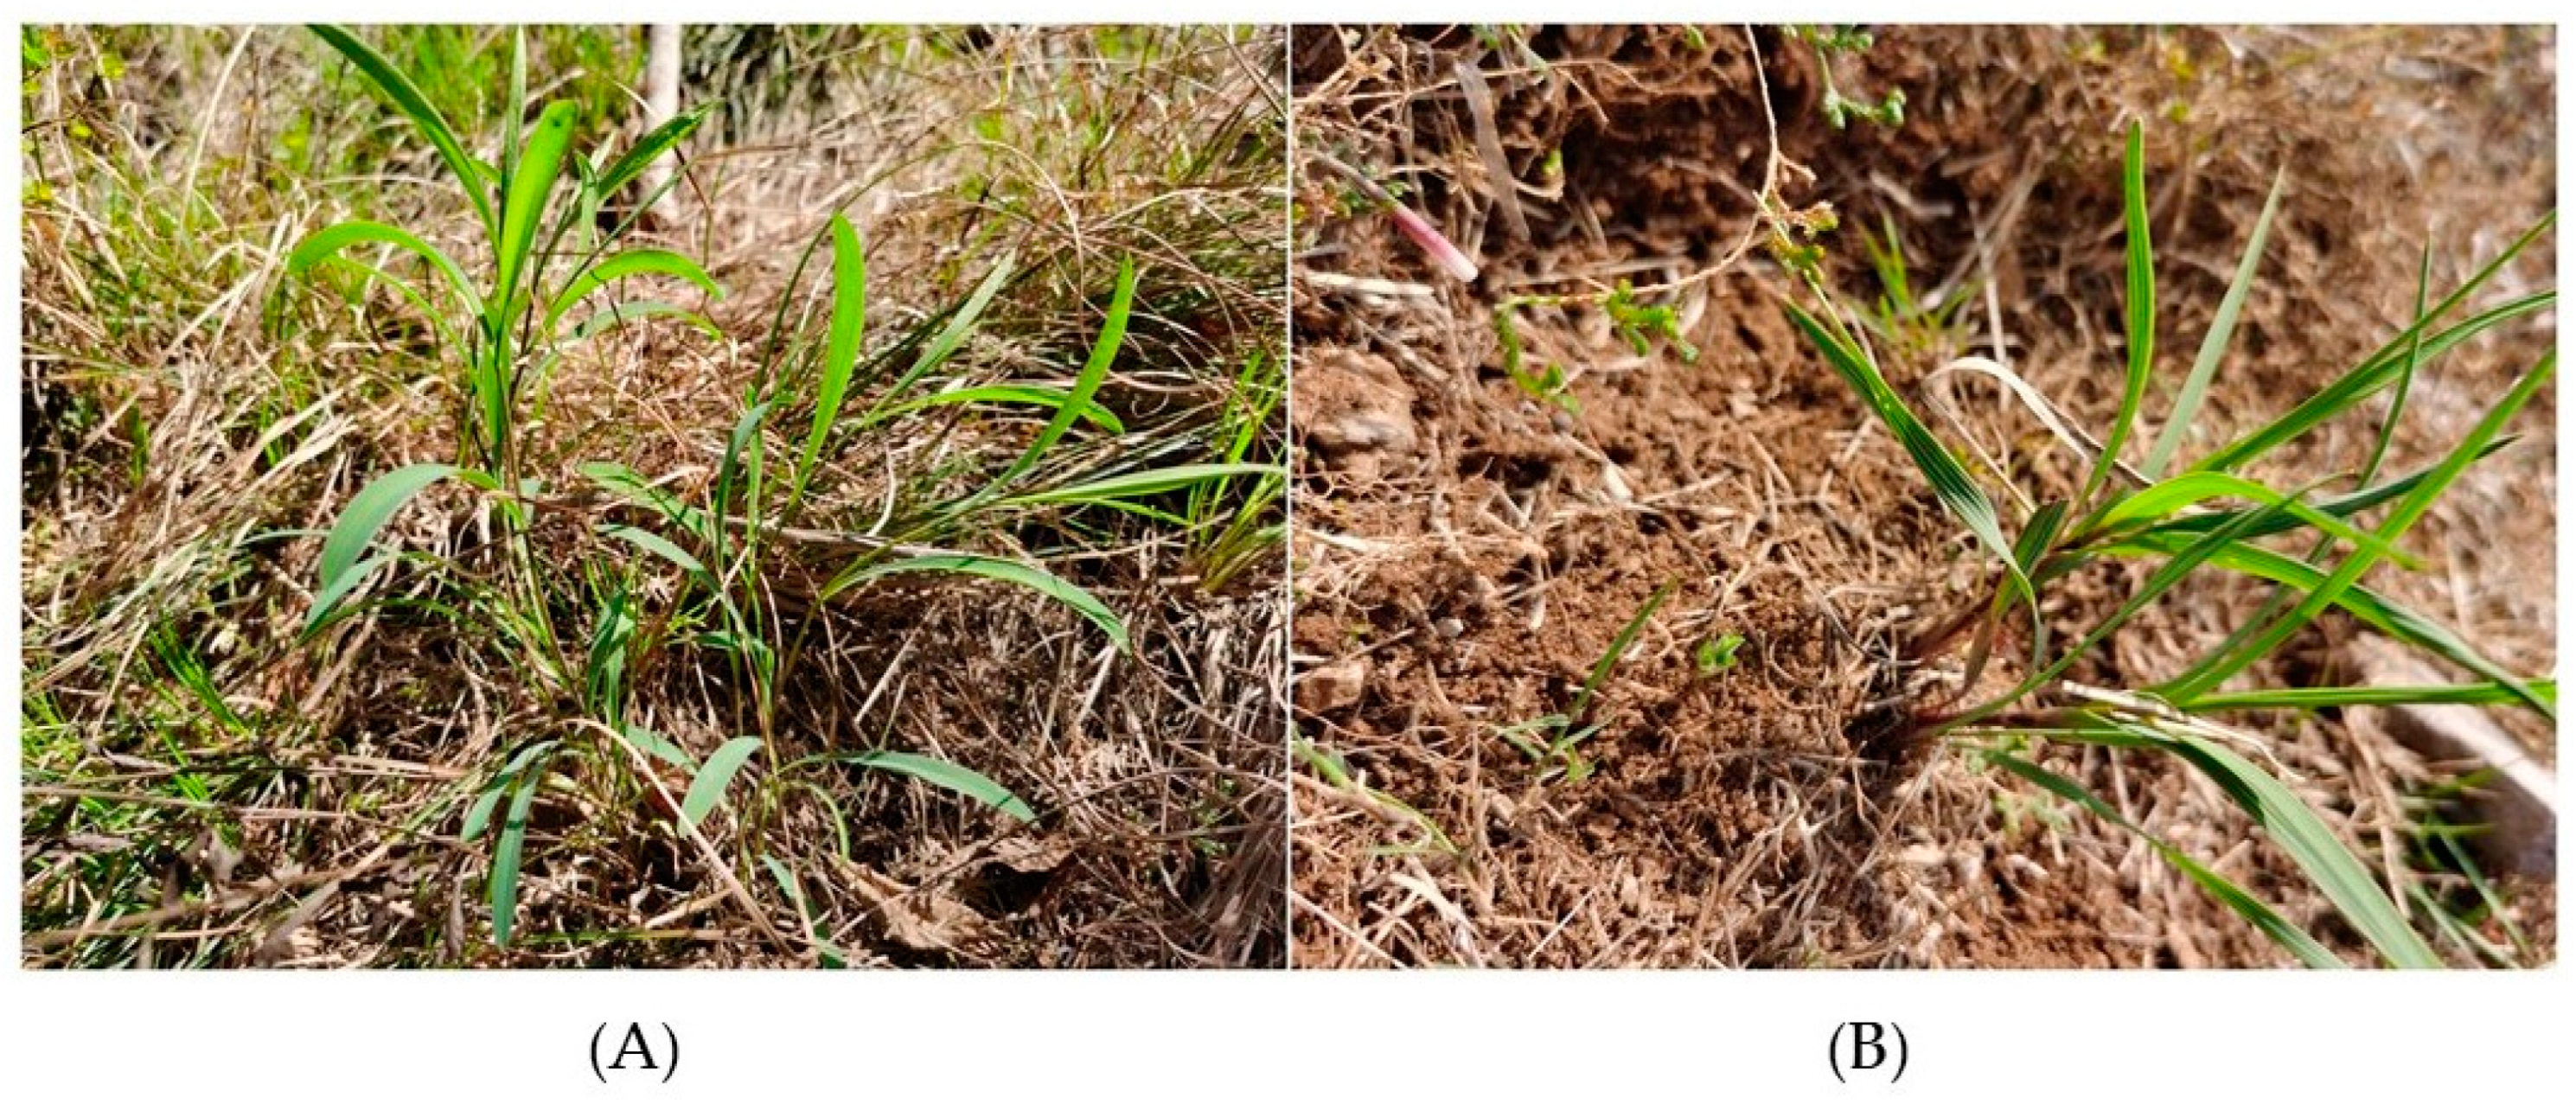
2.1. Plant Materials

In this study, all the selected samples were two-year-old wild resources from the suburban mountains areas of Yiyuan County [Zibo, Shandong, China (Lat. 36°09′ N, 118°34′ E/36°20′ N, 118°28′ E)] in April 2023 (Figure 1). The original plants of the samples were identified as umbelliferae plants Bupleurum chinense DC. (YBC) and Bupleurum scorzonerifolium Willd. (YNC) [21,22]. The work was carried out by Professor Yongqing Zhang from Shandong University of Traditional Chinese Medicine, and the samples were stored in the ultra-low temperature refrigerator of Shandong Academy of Agricultural Sciences. Materials were taken for 3 repetitions with each 5 mL freezer tube, then quickly placed in liquid nitrogen. In addition, all samples were transferred to an ultra-low-temperature refrigerator at −80 °C for storage.

2.2. Sample Preparation and Extraction

Sample preparation and extraction were performed based on the methods which were provided by the Metware Biotechnology Co., Ltd. (Wuhan, China) exactly as previously described [23]. In total, 6 samples are dehydrated using a vacuum freeze-drying apparatus ((Scientz-100F, Ningbo, China). The freeze-dried samples were crushed using a mixer mill ((MM400, Retsch, Haan, Germany) with a zirconia bead for 1.5 min at 30 Hz. Then, 50 mg lyophilized powder of each sample was weighed and was dissolved in 1.2 mL 70% methanol solution, vortexed for 30 s at 30 min intervals, totaling 6 vortexing sessions, and the samples were placed in a refrigerator at 4 °C overnight. After extraction, the mixtures were centrifuged at 16,260 g for 10 min, and then the supernatant was collected and filtered through a micropore filter membrane (SCAA-104, 0.22 μm pore size; ANPEL, Shanghai, China). The obtained filtrates were stored in a vial for ultra-high-performance liquid chromatography tandem mass spectrometry (UPLC-MS/MS) analysis.

2.3. UPLC Conditions

Sample extract solutions were analyzed in the UPLC-ESI-MS/MS system (HPLC, Shim-pack UFLC SHIMADZU CBM30A system; MS, Applied Biosystems 6500 QTRAP). The analysis conditions were as follows: UPLC, column, Agilent SB-C18 (1.8 µm, 2.1 mm × 100 mm); mobile phase, solvent A (pure water with 0.1% formic acid) and solvent B (acetonitrile with 0.1% formic acid); gradient elution, 95–5% A at 0–9 min, 5% A at 9–10 min, 5–95% A at 10–11.1 min, and 95% A at 11.1–14 min; flow rate, 0.35 mL per minute; temperature, 40 °C; and injection volume, 4 μL. The effluent was alternatively connected to an ESI-triple quadrupole-linear ion trap (QTRAP)-MS.

2.4. ESI-Q TRAP-MS/MS

ESI source operational parameters, included the source temperature of 500 °C; ion spray voltage (IS) 5500 V (positive ion mode)/−4500 V (negative ion mode); ion source gas I (GSI), gas II (GSII), and curtain gas (CUR) were set at 50, 60, and 25 psi, respectively; the collision-activated dissociation (CAD) was high. QQQ scans were acquired as MRM experiments with collision gas (nitrogen) set to medium. DP (declustering potential) and CE (collision energy) for individual MRM transitions were conducted with further DP and CE optimization. A specific set of MRM transitions was monitored for each period according to the metabolites eluted within the respective period.

2.5. Qualitative and Quantitative Determination of Metabolites

For the identification and characterization of metabolites, the primary and secondary MS data were used to annotate metabolites based on the self-built metware database (MWDB) (Wuhan Metware Biotechnology Co., Ltd., Wuhan, China) [24]. To ensure the accuracy of the experimental results, the isotopic signal included the repeated signals of K+, Na+, and NH4+ ions. Additionally, during the analysis, the recurring signals from fragments of ions with higher molecular weight were eliminated. Metabolite quantification was performed using multiple reaction monitoring (MRM) by triple quadrupole mass spectrometry. In the MRM model, the four-pole first screens the precursor ions (parent ions) of the target substance and excludes the ions corresponding to other molecular weight substances to preliminarily eliminate the interference. After ionization induced by the collision chamber, the precursor ion breaks to form a lot of fragment ions, and then a characteristic fragment ion is selected through the triple-quadrupole filtering to remove the interference from non-target ions, thereby enhancing the accuracy of quantification and improving repeatability [25].

2.6. Quality Control Sample Analysis

The quality control (QC) samples were created by combining equal amounts of ex-tracts from YNC and YBC, with three replicates. The same method was used for processing and testing as for the analysis samples. During the instrument testing process, one quality control sample was introduced into every ten detection analysis samples to oversee the repeatability of the entire analysis process. By comparing the total ion current (TIC) chromatograms of different quality control samples obtained through mass spectrometry analysis, the repeatability of metabolite extraction and detection can be determined, this can also be considered as technical repeatability. Therefore, the high stability of the instrument serves as a crucial safeguard for the repeatability and reliability of the data.

2.7. Statistical Analysis

After the metabolic mass spectrometry data of different samples were obtained, the peak area integral of all chromatographic peaks was performed, and the mass spectrum peak of the same metabolite in different samples was integrated and corrected. The mass spectrometry data were processed using Analyst 1.6.3 software, and principal component analysis (PCA) and cluster analysis of the two sample groups were performed using multivariate statistical analysis methods. The stability and reliability of the model were assessed through partial least squares discriminant analysis (PLS-DA) and orthogonal partial least squares discriminant analysis (OPLS-DA). Different metabolites were screened by variable importance in project (VIP) values, unidimensional statistical p-values, and differential multiples. The heatmap program in R (v3.3.2) was used for cluster analysis of the selected differential metabolic components, and a heatmap was drawn [26]. The differential metabolites of the samples were selected by stratigraphy cluster, and the results were uploaded to the Kyoto Encyclopedia of Genes and Genomes (KEGG) database website for pertinent pathway analysis.

3. Results

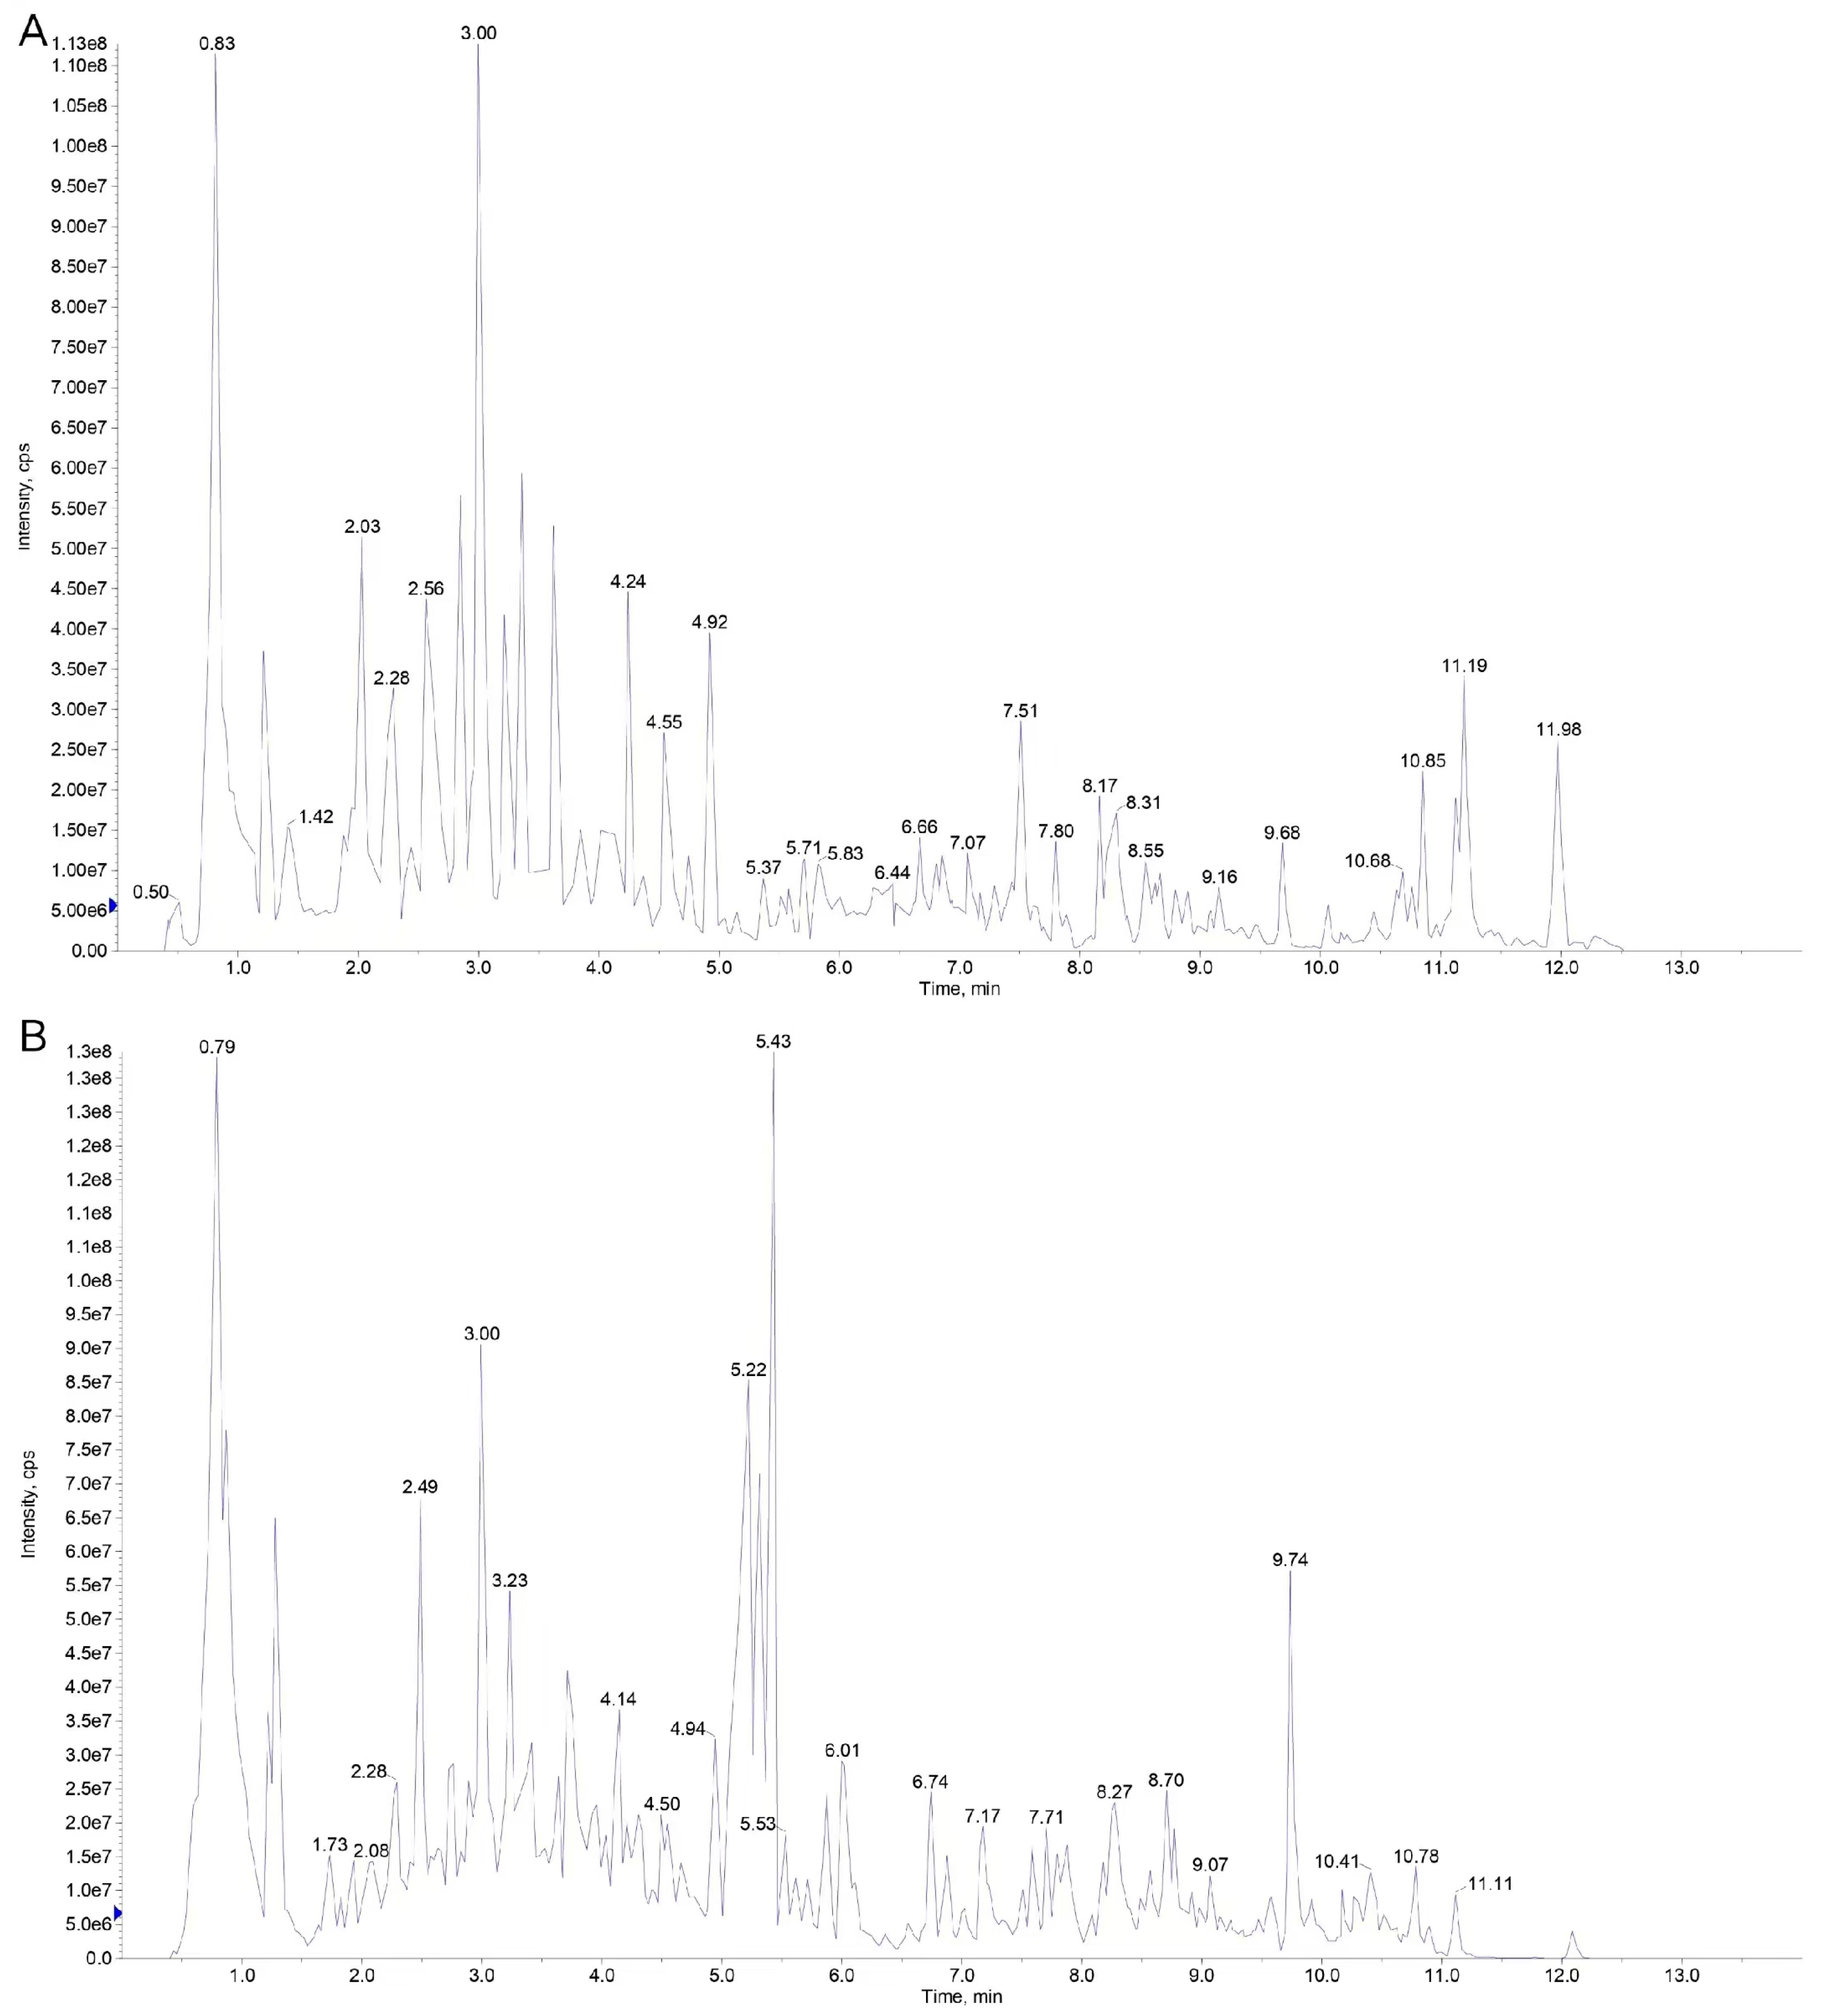
3.1. Quality Control Sample Analysis

According to the (+) and (−) total ion flow diagram of the quality control sample (Figure 2), under this detection condition, the peak shape distribution of the total ion current (TIC) chromatogram of the quality control sample under positive and negative ion modes is relatively uniform and in good shape, indicating that the detection process is relatively stable and the detection results are authentic and reliable.

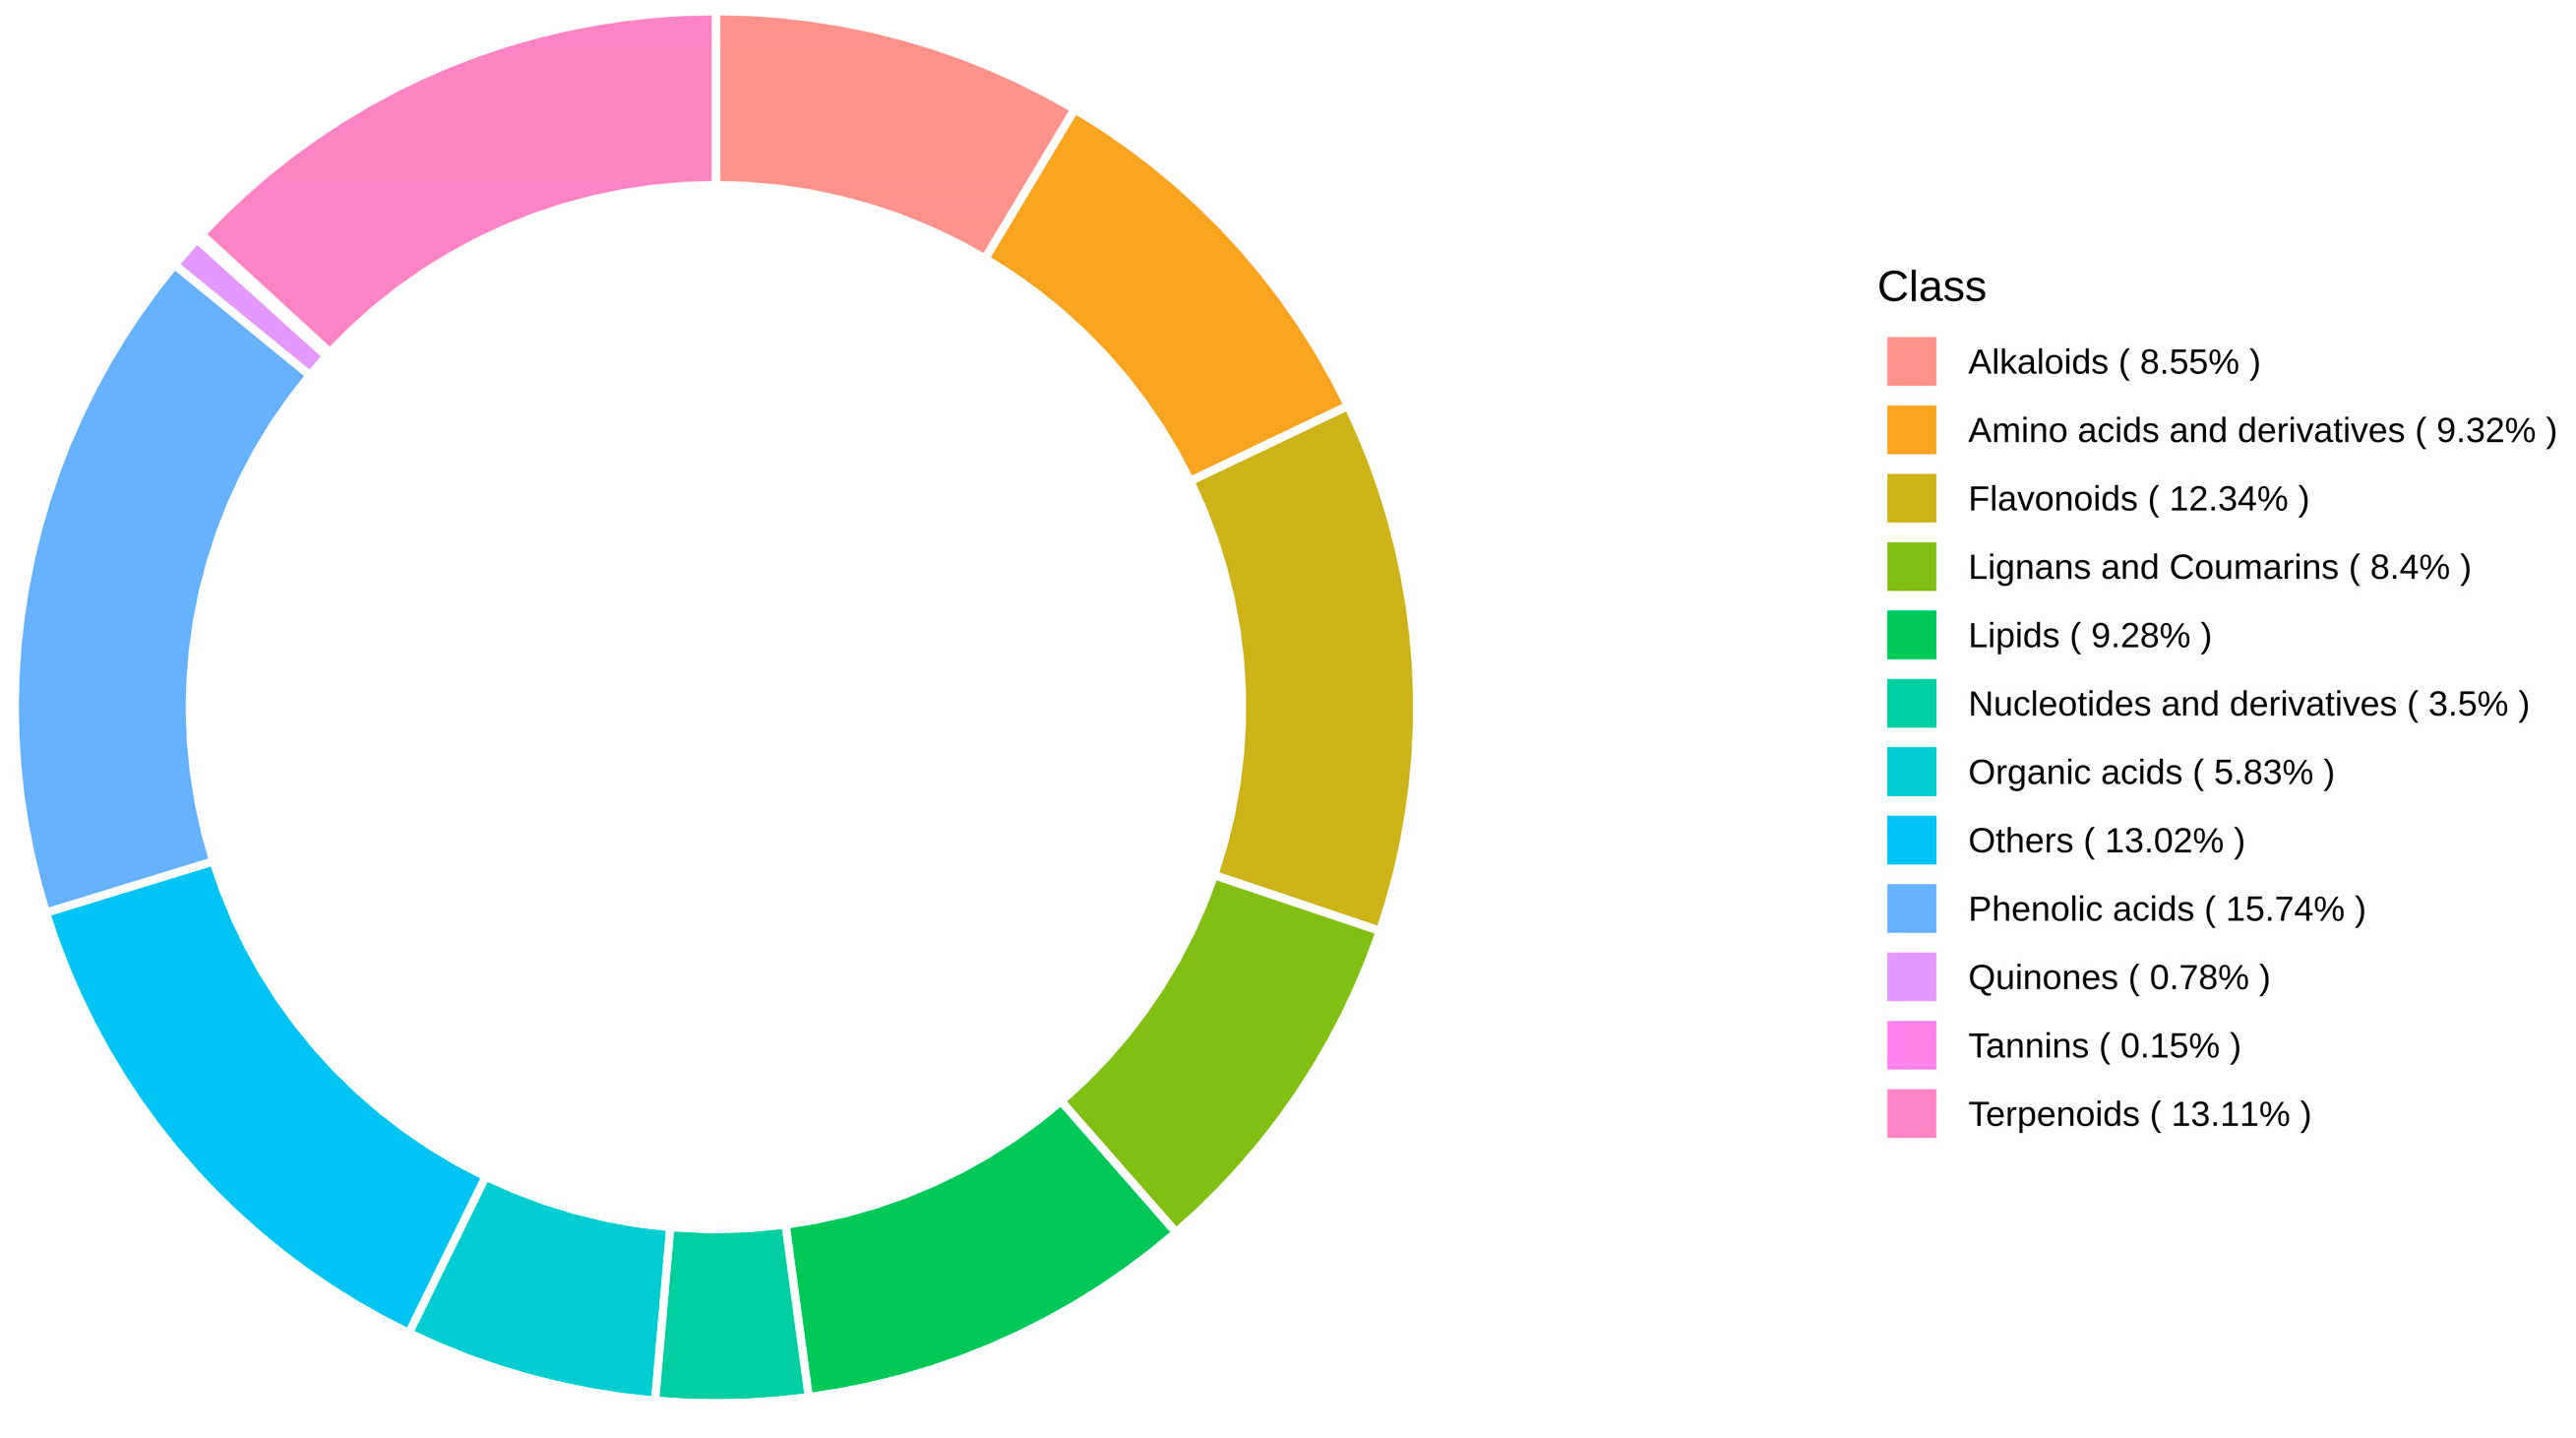
3.2. Metabolite Detection

In this study, a total of 2059 metabolites of 12 classes were identified (Table 1), which included 324 phenolic acids, 270 terpenoids, 254 flavonoids, 192 amino acids and derivatives, 191 lipids, 176 alkaloids, 173 lignans and coumarins, 120 organic acids, 72 nucleotides and derivatives, 16 quinones, 3 tannins, and 268 other metabolites.
The number of metabolites was far more than the previous identified metabolite numbers. A circular diagram of metabolite classes is shown in Figure 3; these suggest that the UHPLC-QQQ-MS based targeted metabolomics method was a widely effective method for the comprehensive identification of metabolites in plants. In general, among these metabolites, 2026 existed in both, mainly phenolic acids, terpenes, flavonoids, amino acids, and their derivatives. These metabolites were listed in Table 1.

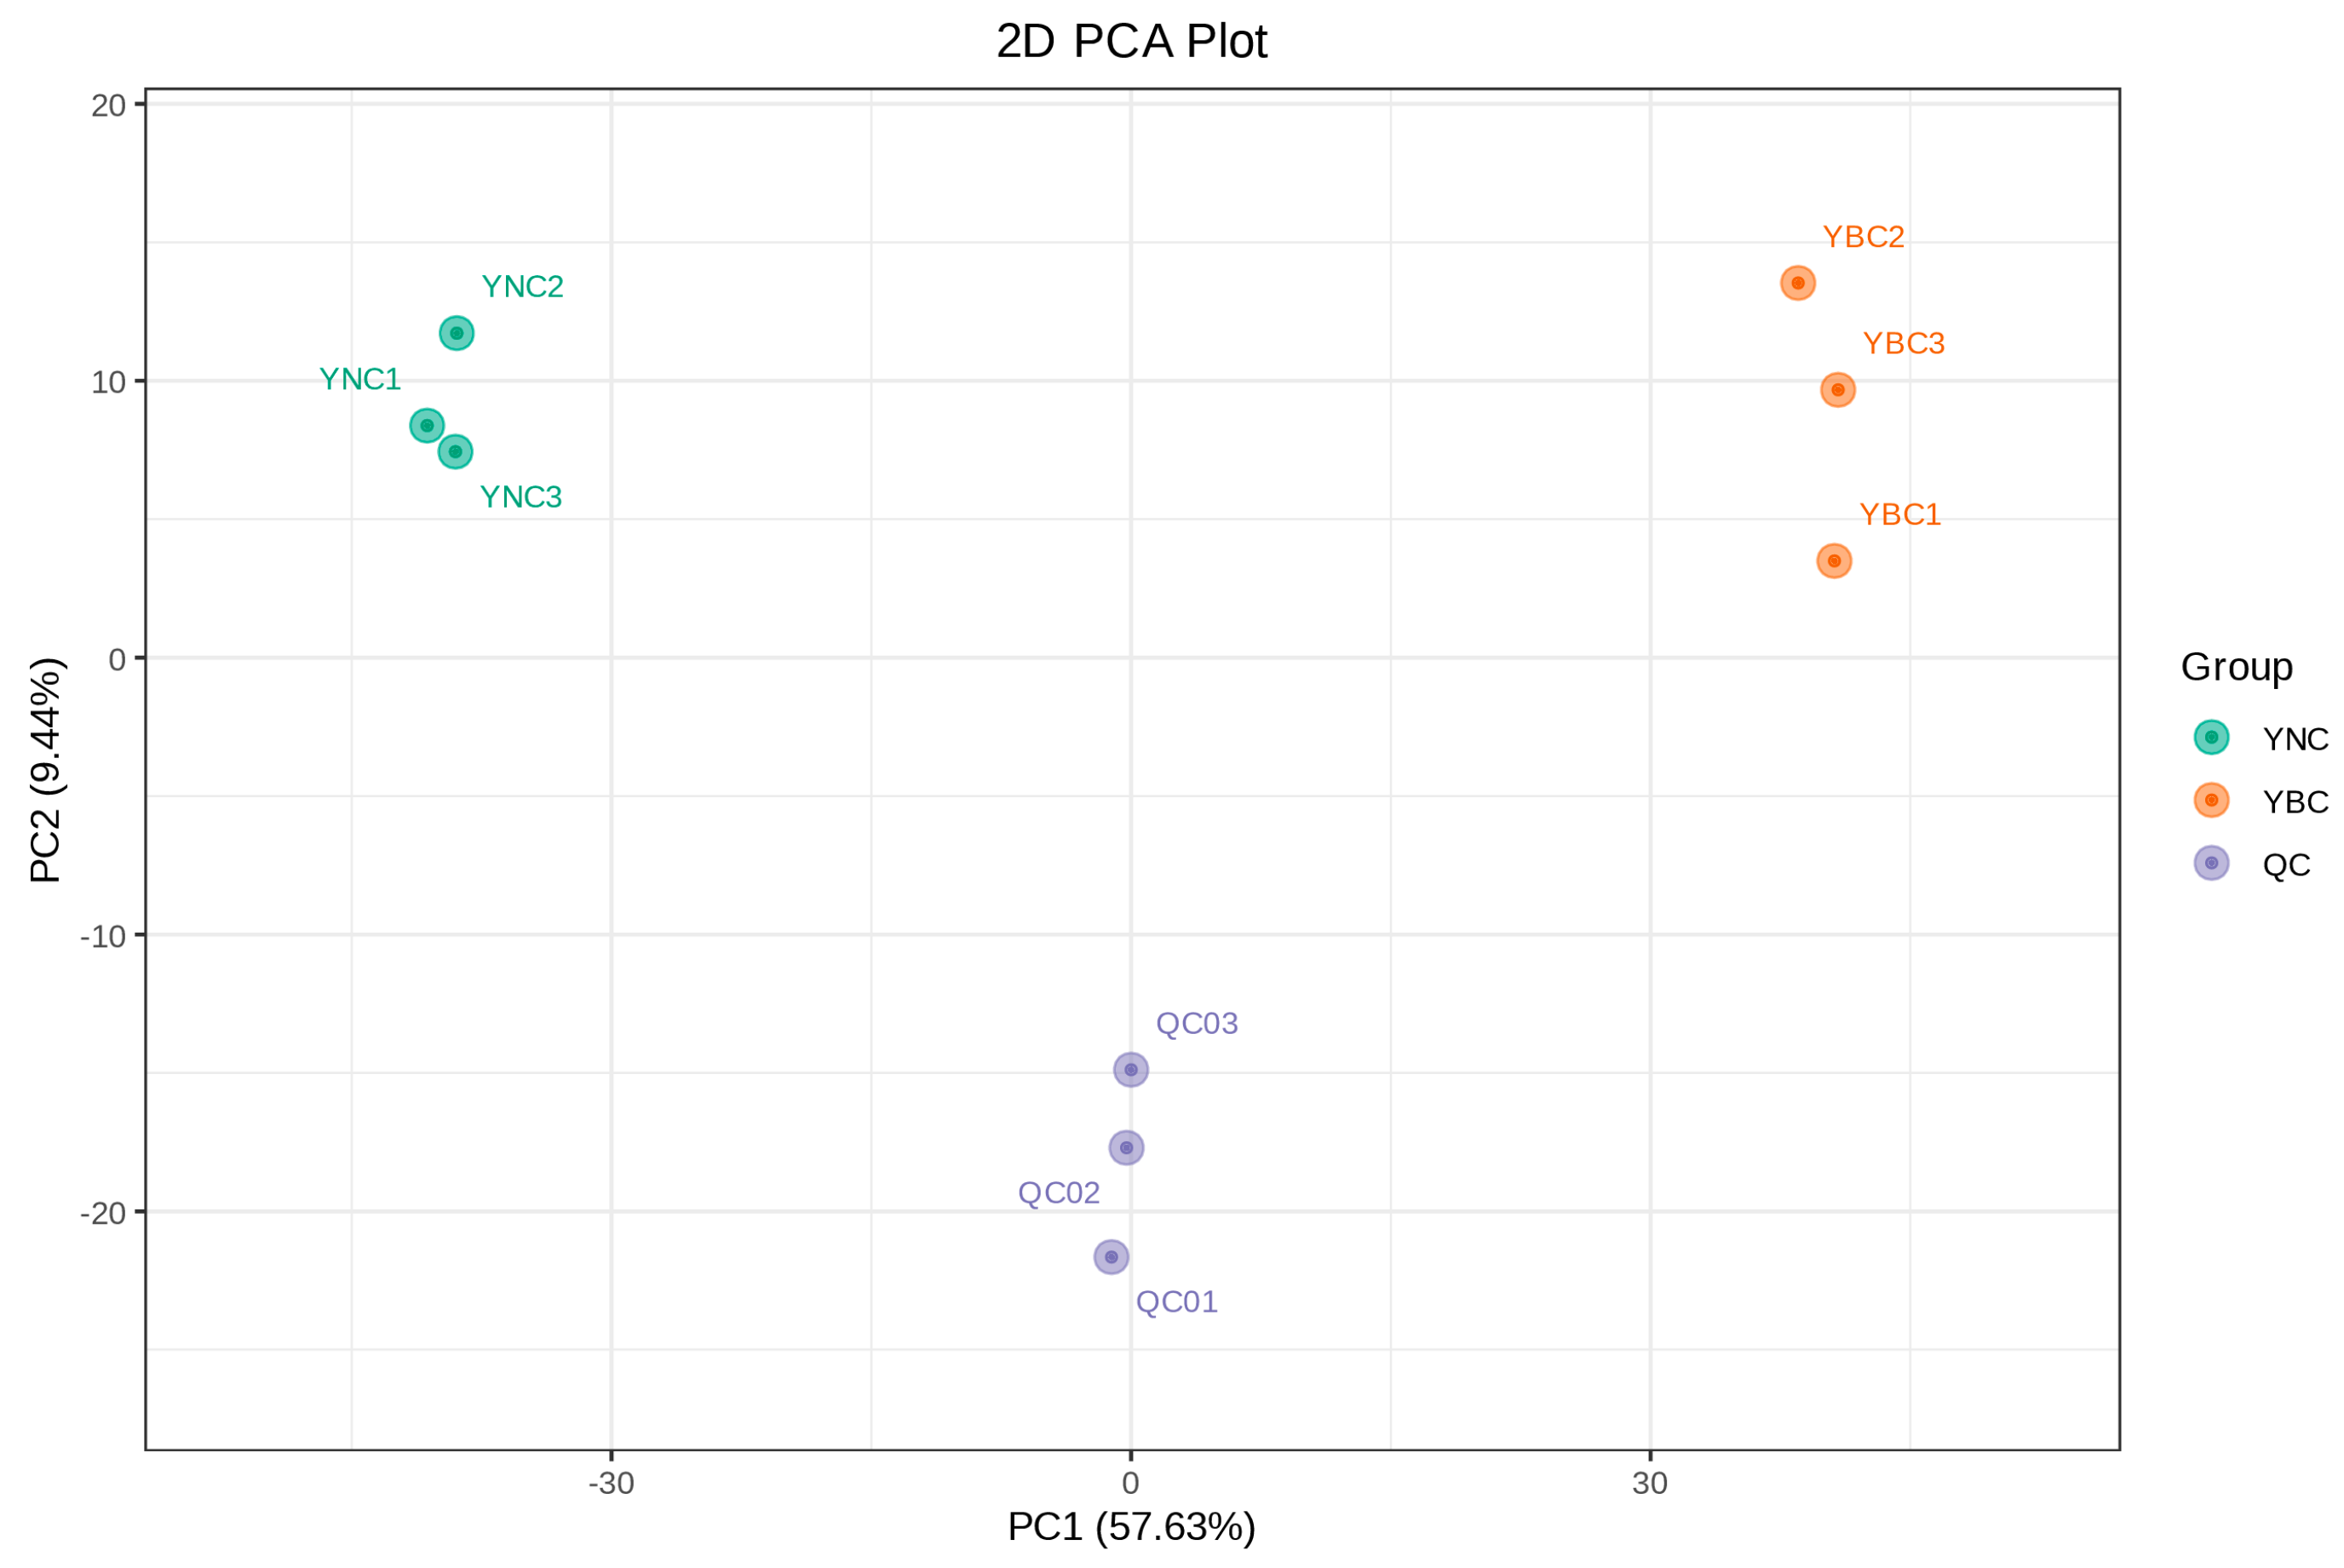
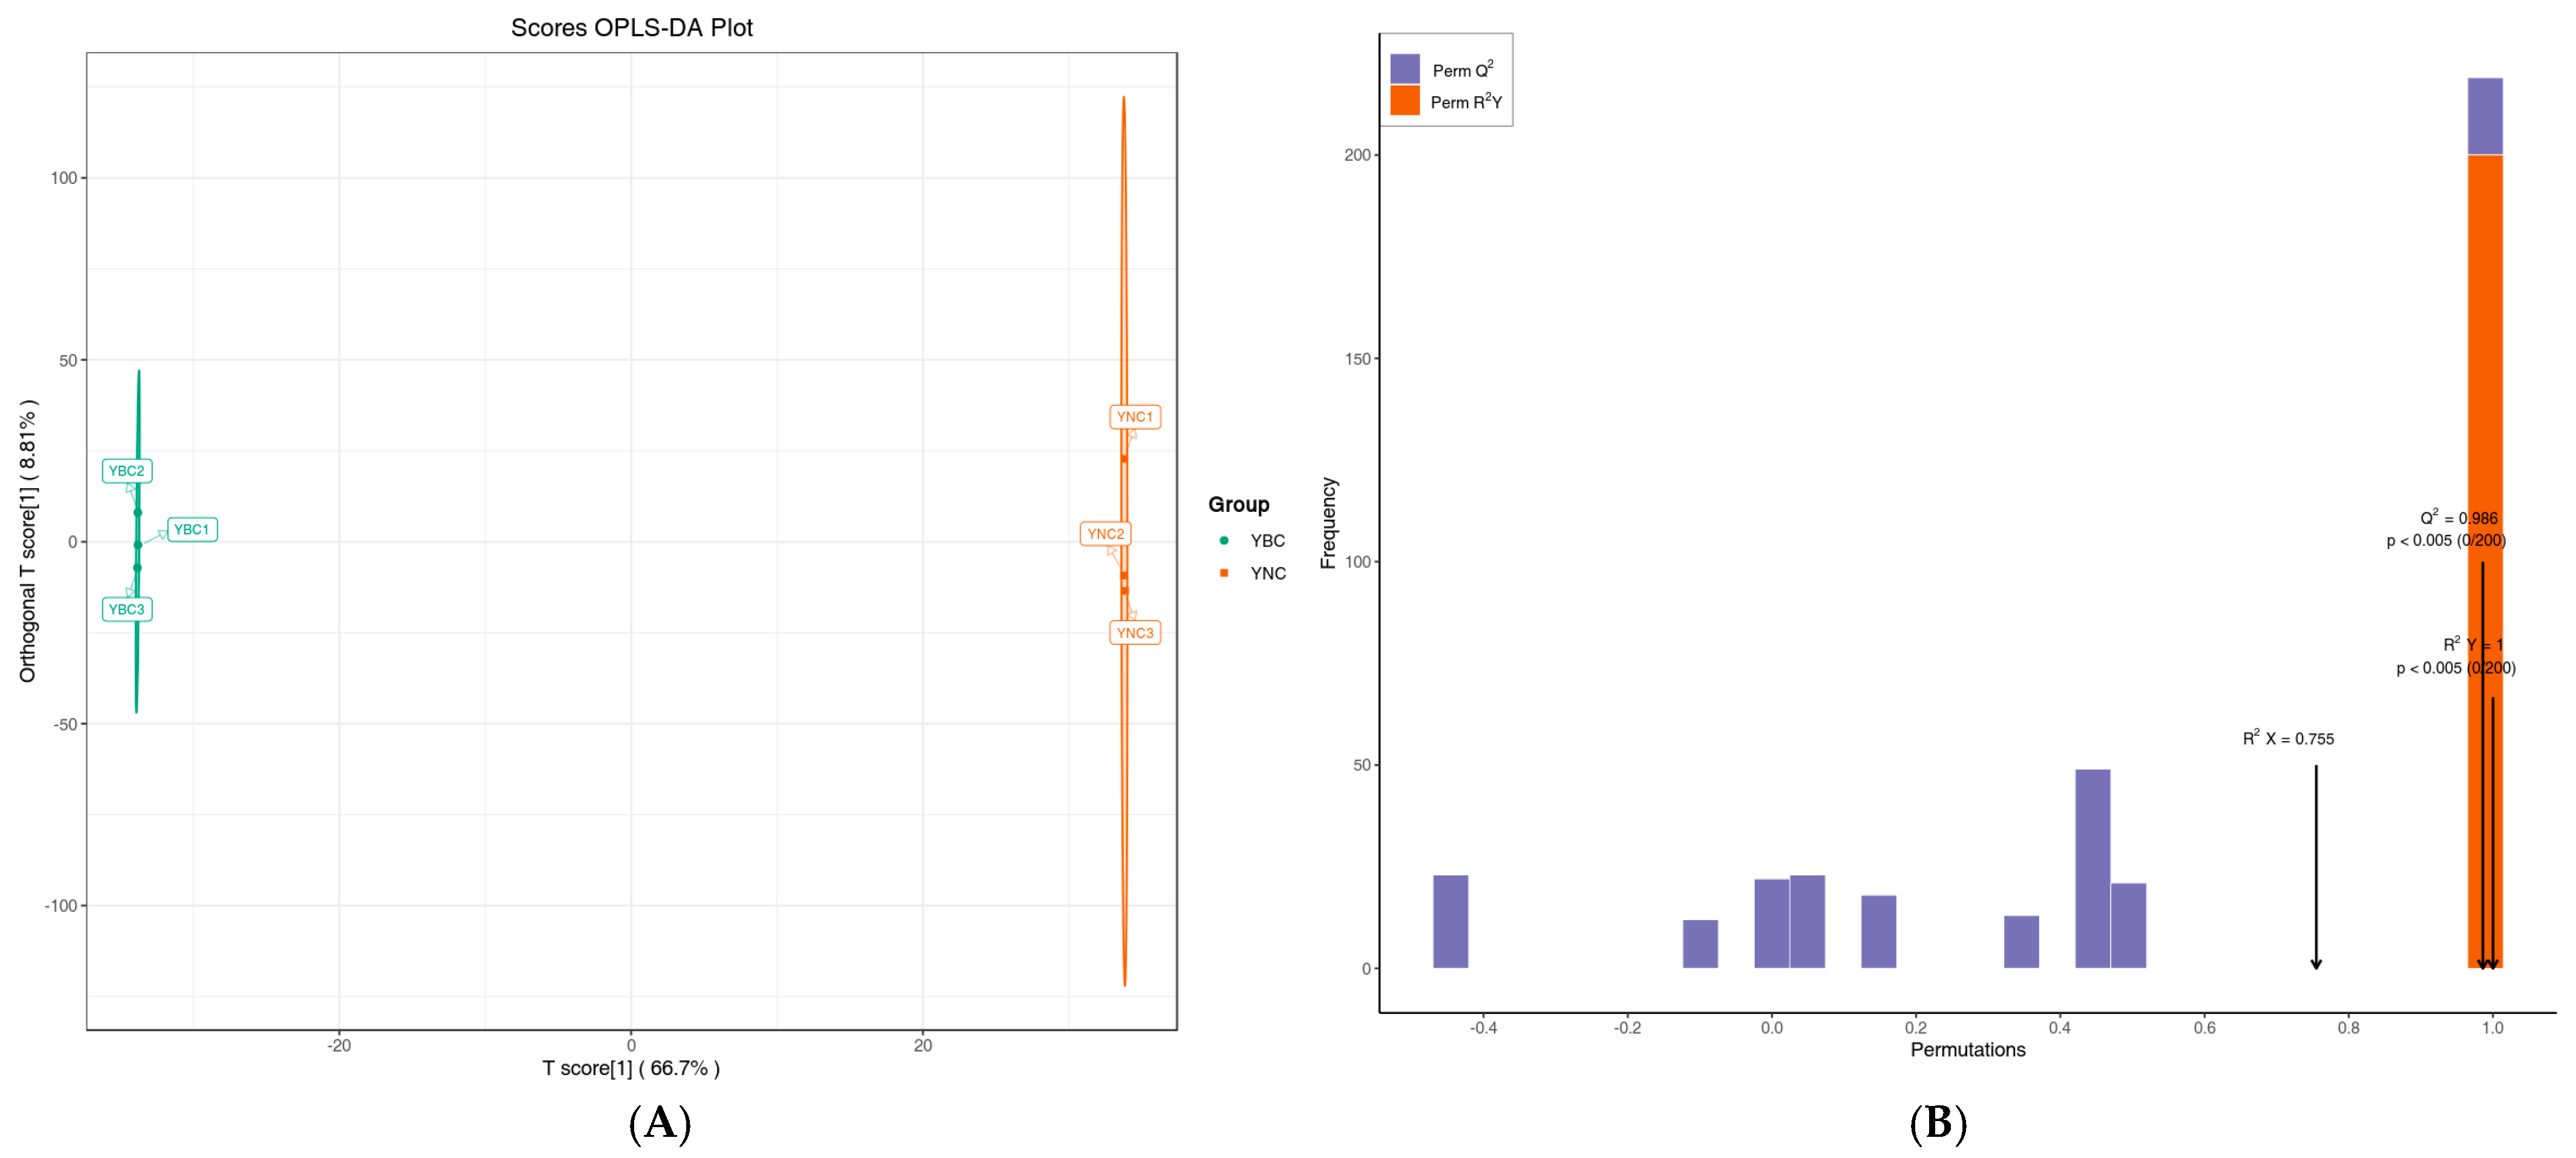
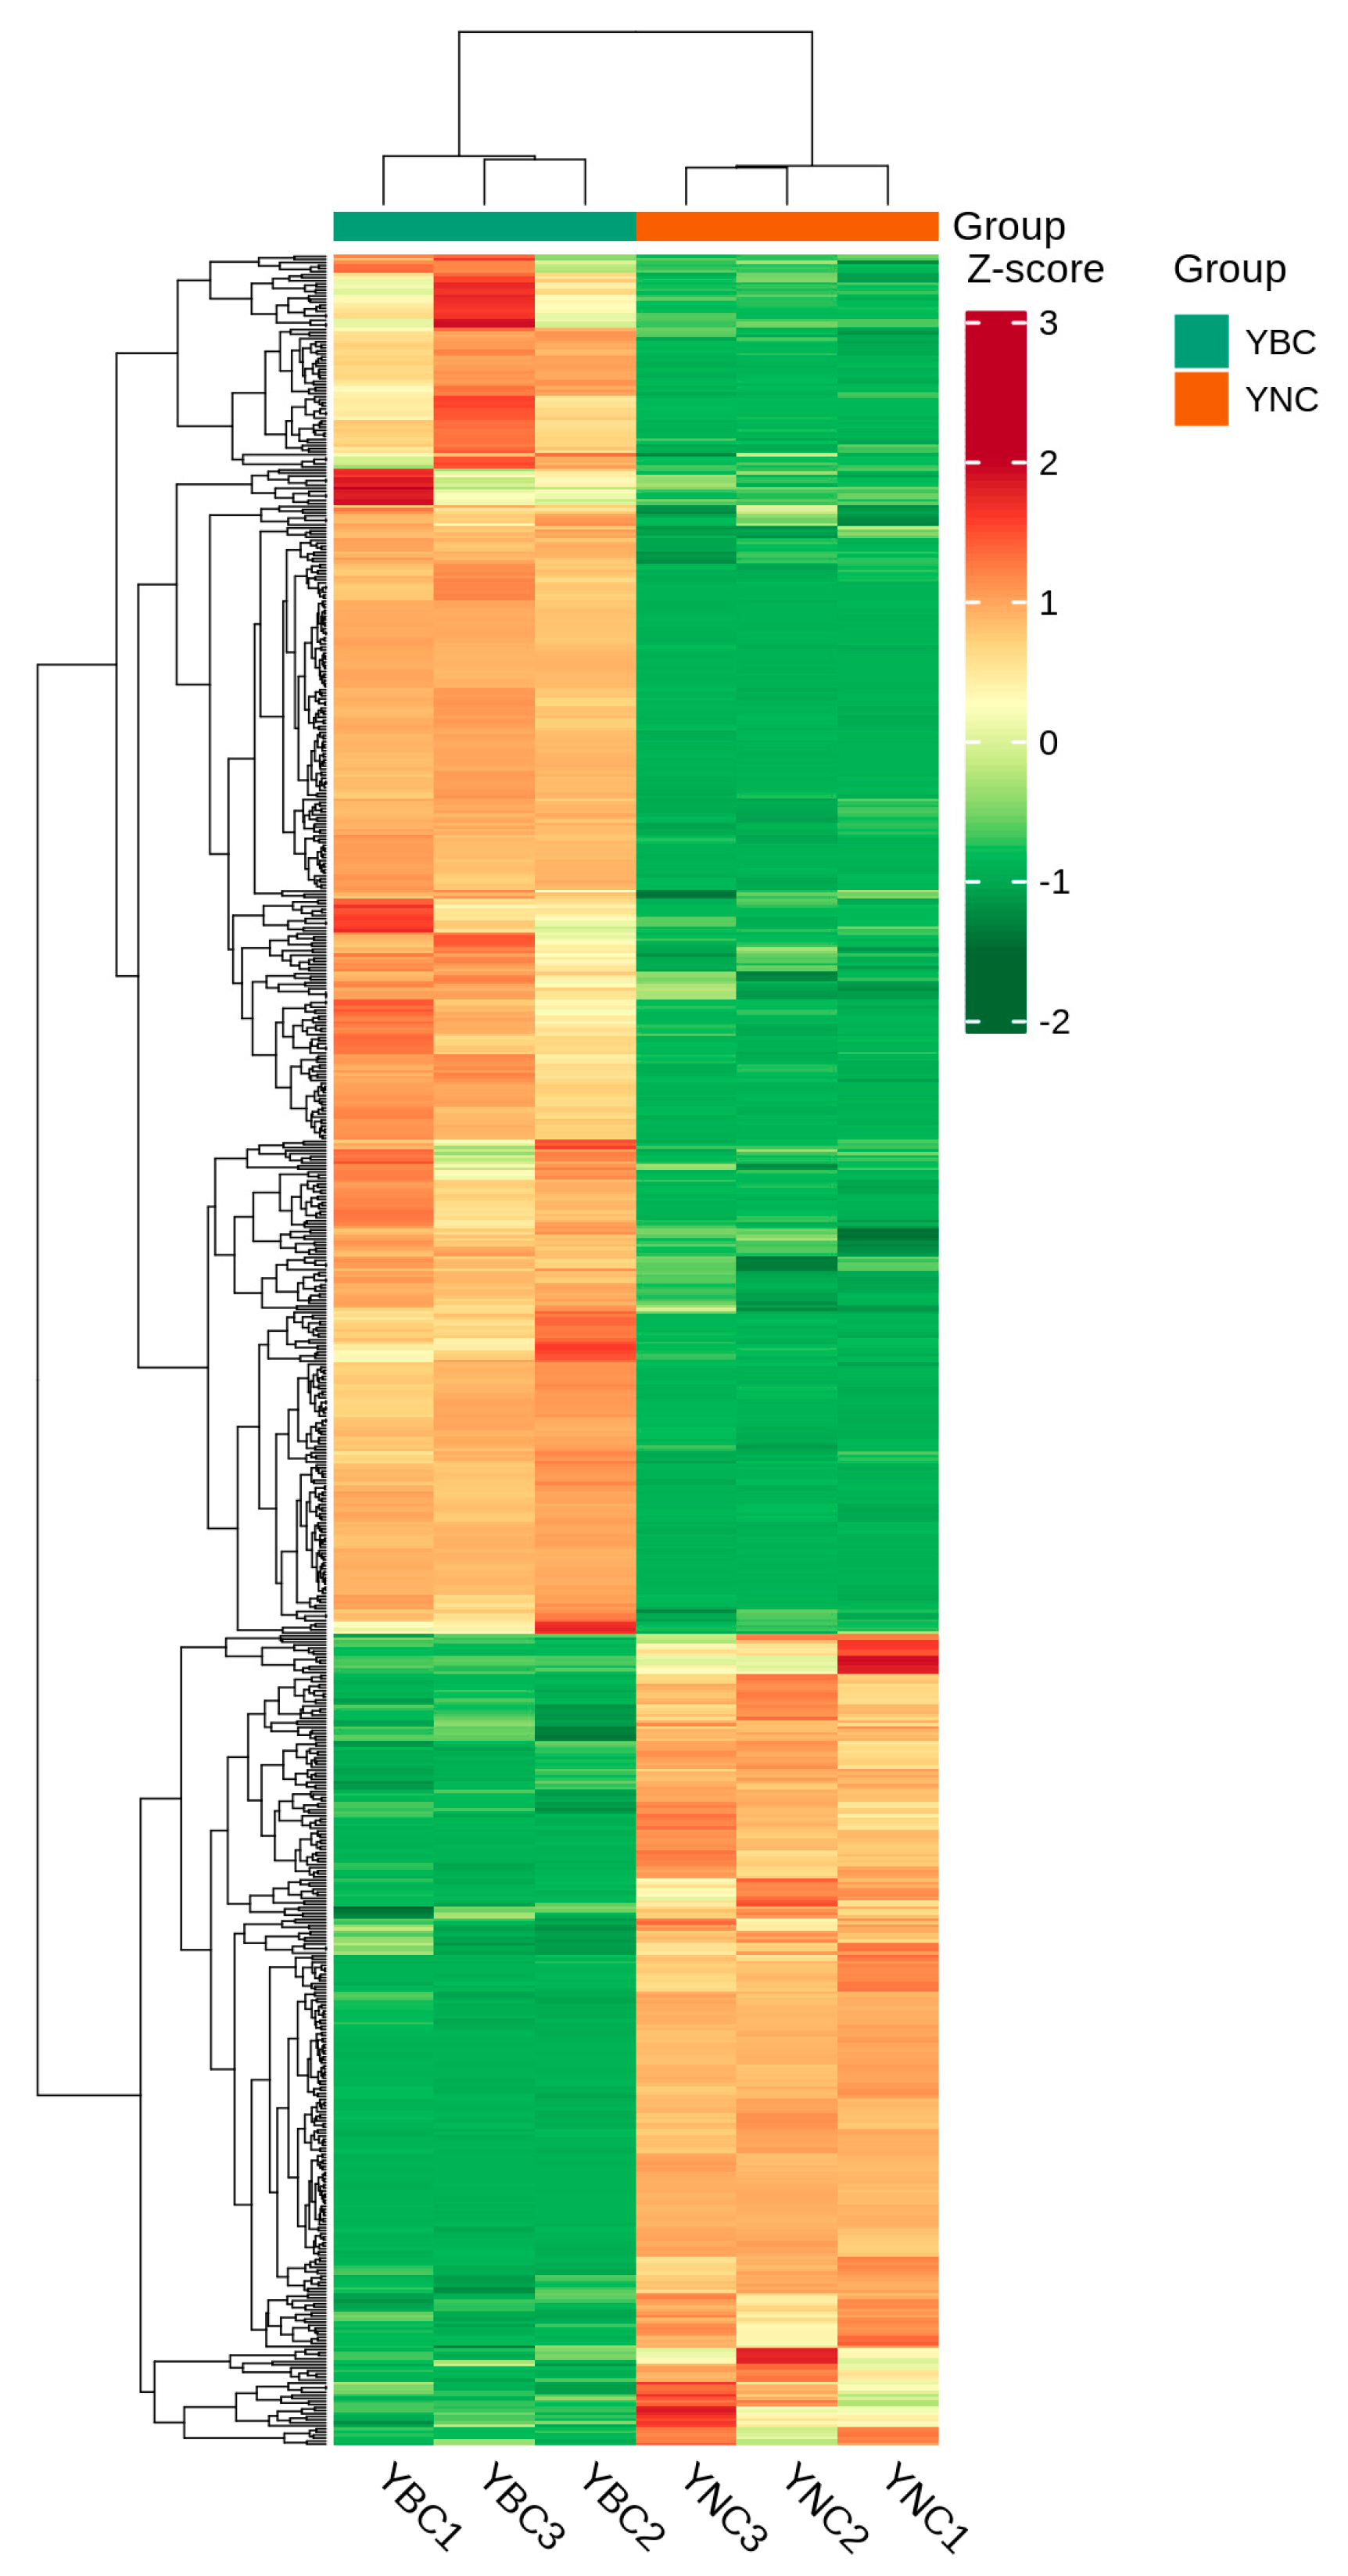
3.3. Analysis of Metabolomics Difference Between YBC and YNC by Multivariate Analysis

Principal component analysis (PCA) can reflect the abundance of metabolites in samples. The closer the location, the greater the similarity, and the farther away, the smaller the similarity [27]. Through PCA analysis of the samples, the variation degree between the samples of YBC and YNC and between the samples in the group was determined. Five principal components were obtained, in which the contribution rate of PC1 was 57.63% and that of PC2 was 9.44%. The two groups of samples showed an obvious separation trend (Figure 4), and the separation of YBC was slightly greater than that of YNC. This may be due to their different living environments, which lead to differences in metabolites. The medicinal materials grown in the wild have a different quality and composition of medicinal materials, and the clinical treatment effect is better [28]. PCA clearly grouped these samples into distinct clusters, which indicates the significant differences in metabolites between the YBC and YNC.
PCA was capable of efficiently extracting primary information, yet it lacked sensitivity to variables that have low correlation. In contrast, partial least squares discriminant analysis (PLS-DA) addresses this issue and optimizes the separation between different groups; therefore, it is beneficial in searching for differential metabolites [29]. Orthogonal partial least squares discriminant analysis (OPLS-DA) integrates orthogonal signal correction (OSC) with PLS-DA, enabling the identification of differential variables by eliminating uncorrelated variations. Based on the OPLS-DA model (Figure 5A), 2059 metabolomics were analyzed: YBC was distributed on the left side of the confidence interval, and YNC was distributed on the right. The difference between the two samples was very obvious. The contribution rate of PC1 obtained by OPLS-DA was 66.7%, that of PC2 was 8.81%, R2X = 0.755, R2Y = 1, Q2 = 0.986, in which Q2 > 0.9, was an excellent model, which was better than the PCA model. For OPLS-DA, the arrangement verification (n = 200) was carried out. In the model verification (Figure 5B), the horizontal coordinate represented the values of R2Y and Q2 of the model, and the vertical coordinate was the frequency of the model classification effect in 200 random arrangement and combination experiments. The findings indicate that the model was significant, and its differential metabolites could be assessed and selected based on the VIP value.
Based on the results of the OPLS-DA model, the differential metabolites in YBC and YNC were screened. The screening criteria were as follows: (1) metabolites with VIP values > 1 were selected. The VIP value reflects the impact of the differences among the corresponding metabolites on the classification and discrimination of each group within the model. It is generally believed that metabolites with VIP value > 1 are significantly different; (2) a fold-change score ≥ 2 or ≤0.5 among the metabolites with a VIP value > 1 was used to identify differential metabolites. If the difference in metabolites between the control group and the experimental group is more than 2 times or less than 0.5 times, the difference is considered significant. A total of 11 types of metabolites with 718 significant differences were identified (Table 1); of these, differential metabolites accounted for 35.44% of the total metabolic components (2026 types), indicating that there were differences in metabolites between YBC and YNC. Flavonoids, phenolic acids, terpenoids, lignans, and coumarins were significantly different; the proportions were 19.22%, 18.52%, 16.30%, and 11.28%, respectively.

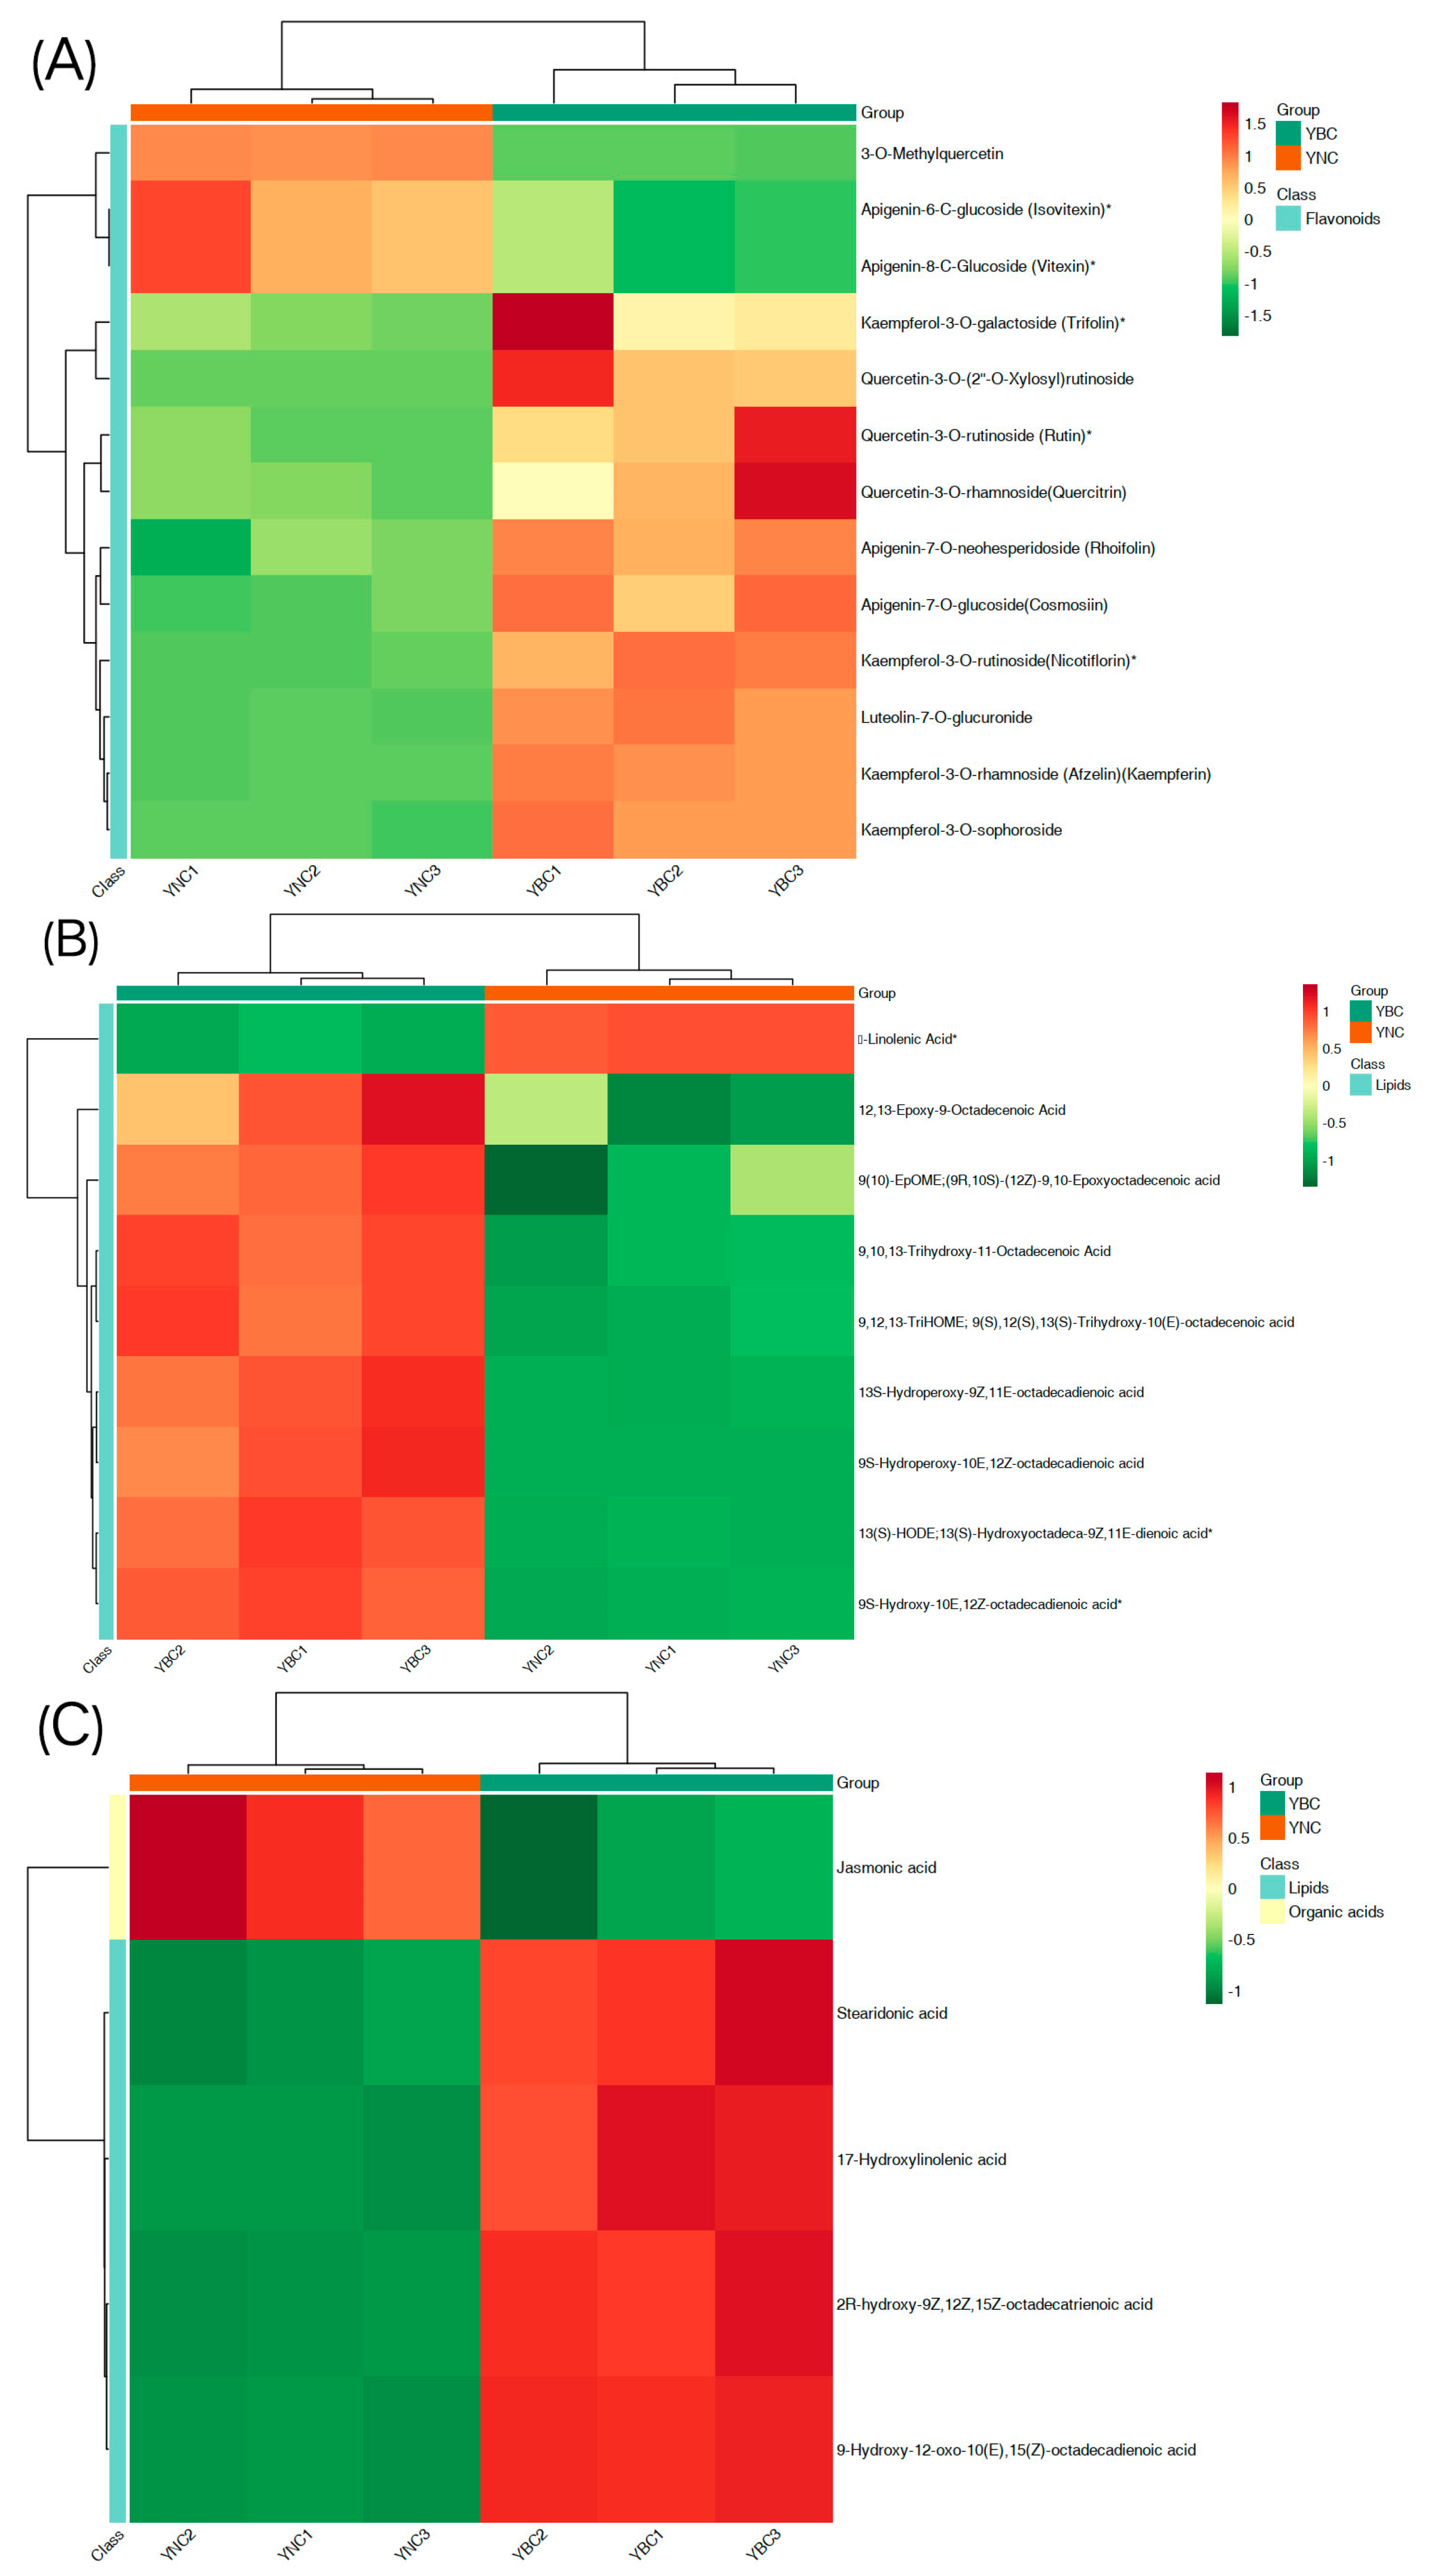
3.4. Different Metabolite Analyses

To better visualize the patterns of metabolite changes, metabolites showing significant differences were normalized, and a clustering heatmap was generated. The results of all detected metabolites are shown in a heatmap (Figure 6). Which simply and intuitively reflects the changes in metabolites. Among the 718 differential metabolic components, 266 substances of YBC were down-regulated compared with YNC; that is, the relative content of YBC was decreased, and the decreased metabolic components accounted for 37.05% of the differential metabolic components; 452 substances were up-regulated; that is, the relative content increased, and the increased metabolic components accounted for 62.95% of the differential metabolic components. The difference in metabolite type and content between YBC and YNC resulted in the difference in pharmacodynamic composition.
The fold changes in the quantitative data of metabolic constituents in YBC and YNC were compared and the difference multiples were processed (log2FC). The top 20 differentially expressed metabolic components with changes are shown in Table 2. Compared with YNC, the relative contents of five flavonoids (Kaempferol-3-O-rhamnoside(Afzelin) (Kaempferin), 8-Methoxykaempferol-7-O-rhamnoside, Kaempferol-7-O-rhamnoside, Hispidulin-7-O-(6″-O-p-Coumaroyl)Glucoside,Quertin-3,7-Di-O-rhamnoside),3phenolicacids(3,5-dihydroxy-4-{[(2s,3r,4s,5s,6r)-3,4,5-trihydroxy-6-[(sulfooxy)methyl]oxan-2-yl]oxy}benzoic acid,3,5-dihydroxy-4-[(2S,3R,4S,5S,6R)-3,4,5-trihydroxy-6-(sulfooxymethyl)oxan-2-yl]oxybenzoic acid, 5-O-Feruloylquinic acid), three lignans and coumarins (5,7-Dimethoxycoumarin (Limettin) (Citropten), 6,7Dimethoxy-4-methylcoumarin, 3-Methyl-6-methoxy-8-hydroxy-3,4-dihydroisocoumarin), and three other substances (Eugenin, Leptorumol, and 30-O-Aangeloylhamaudol) in YBC root were significantly increased. The relative contents of two alkaloids (Hydroxystemofoline and Cinnamoyltyramine), two terpenoids (Ajugamacrin C* and Ajugamacrin D*), one phenolic acid (Vanillin acetate), and one quinone (6-Methylaloe emodin) were significantly reduced.

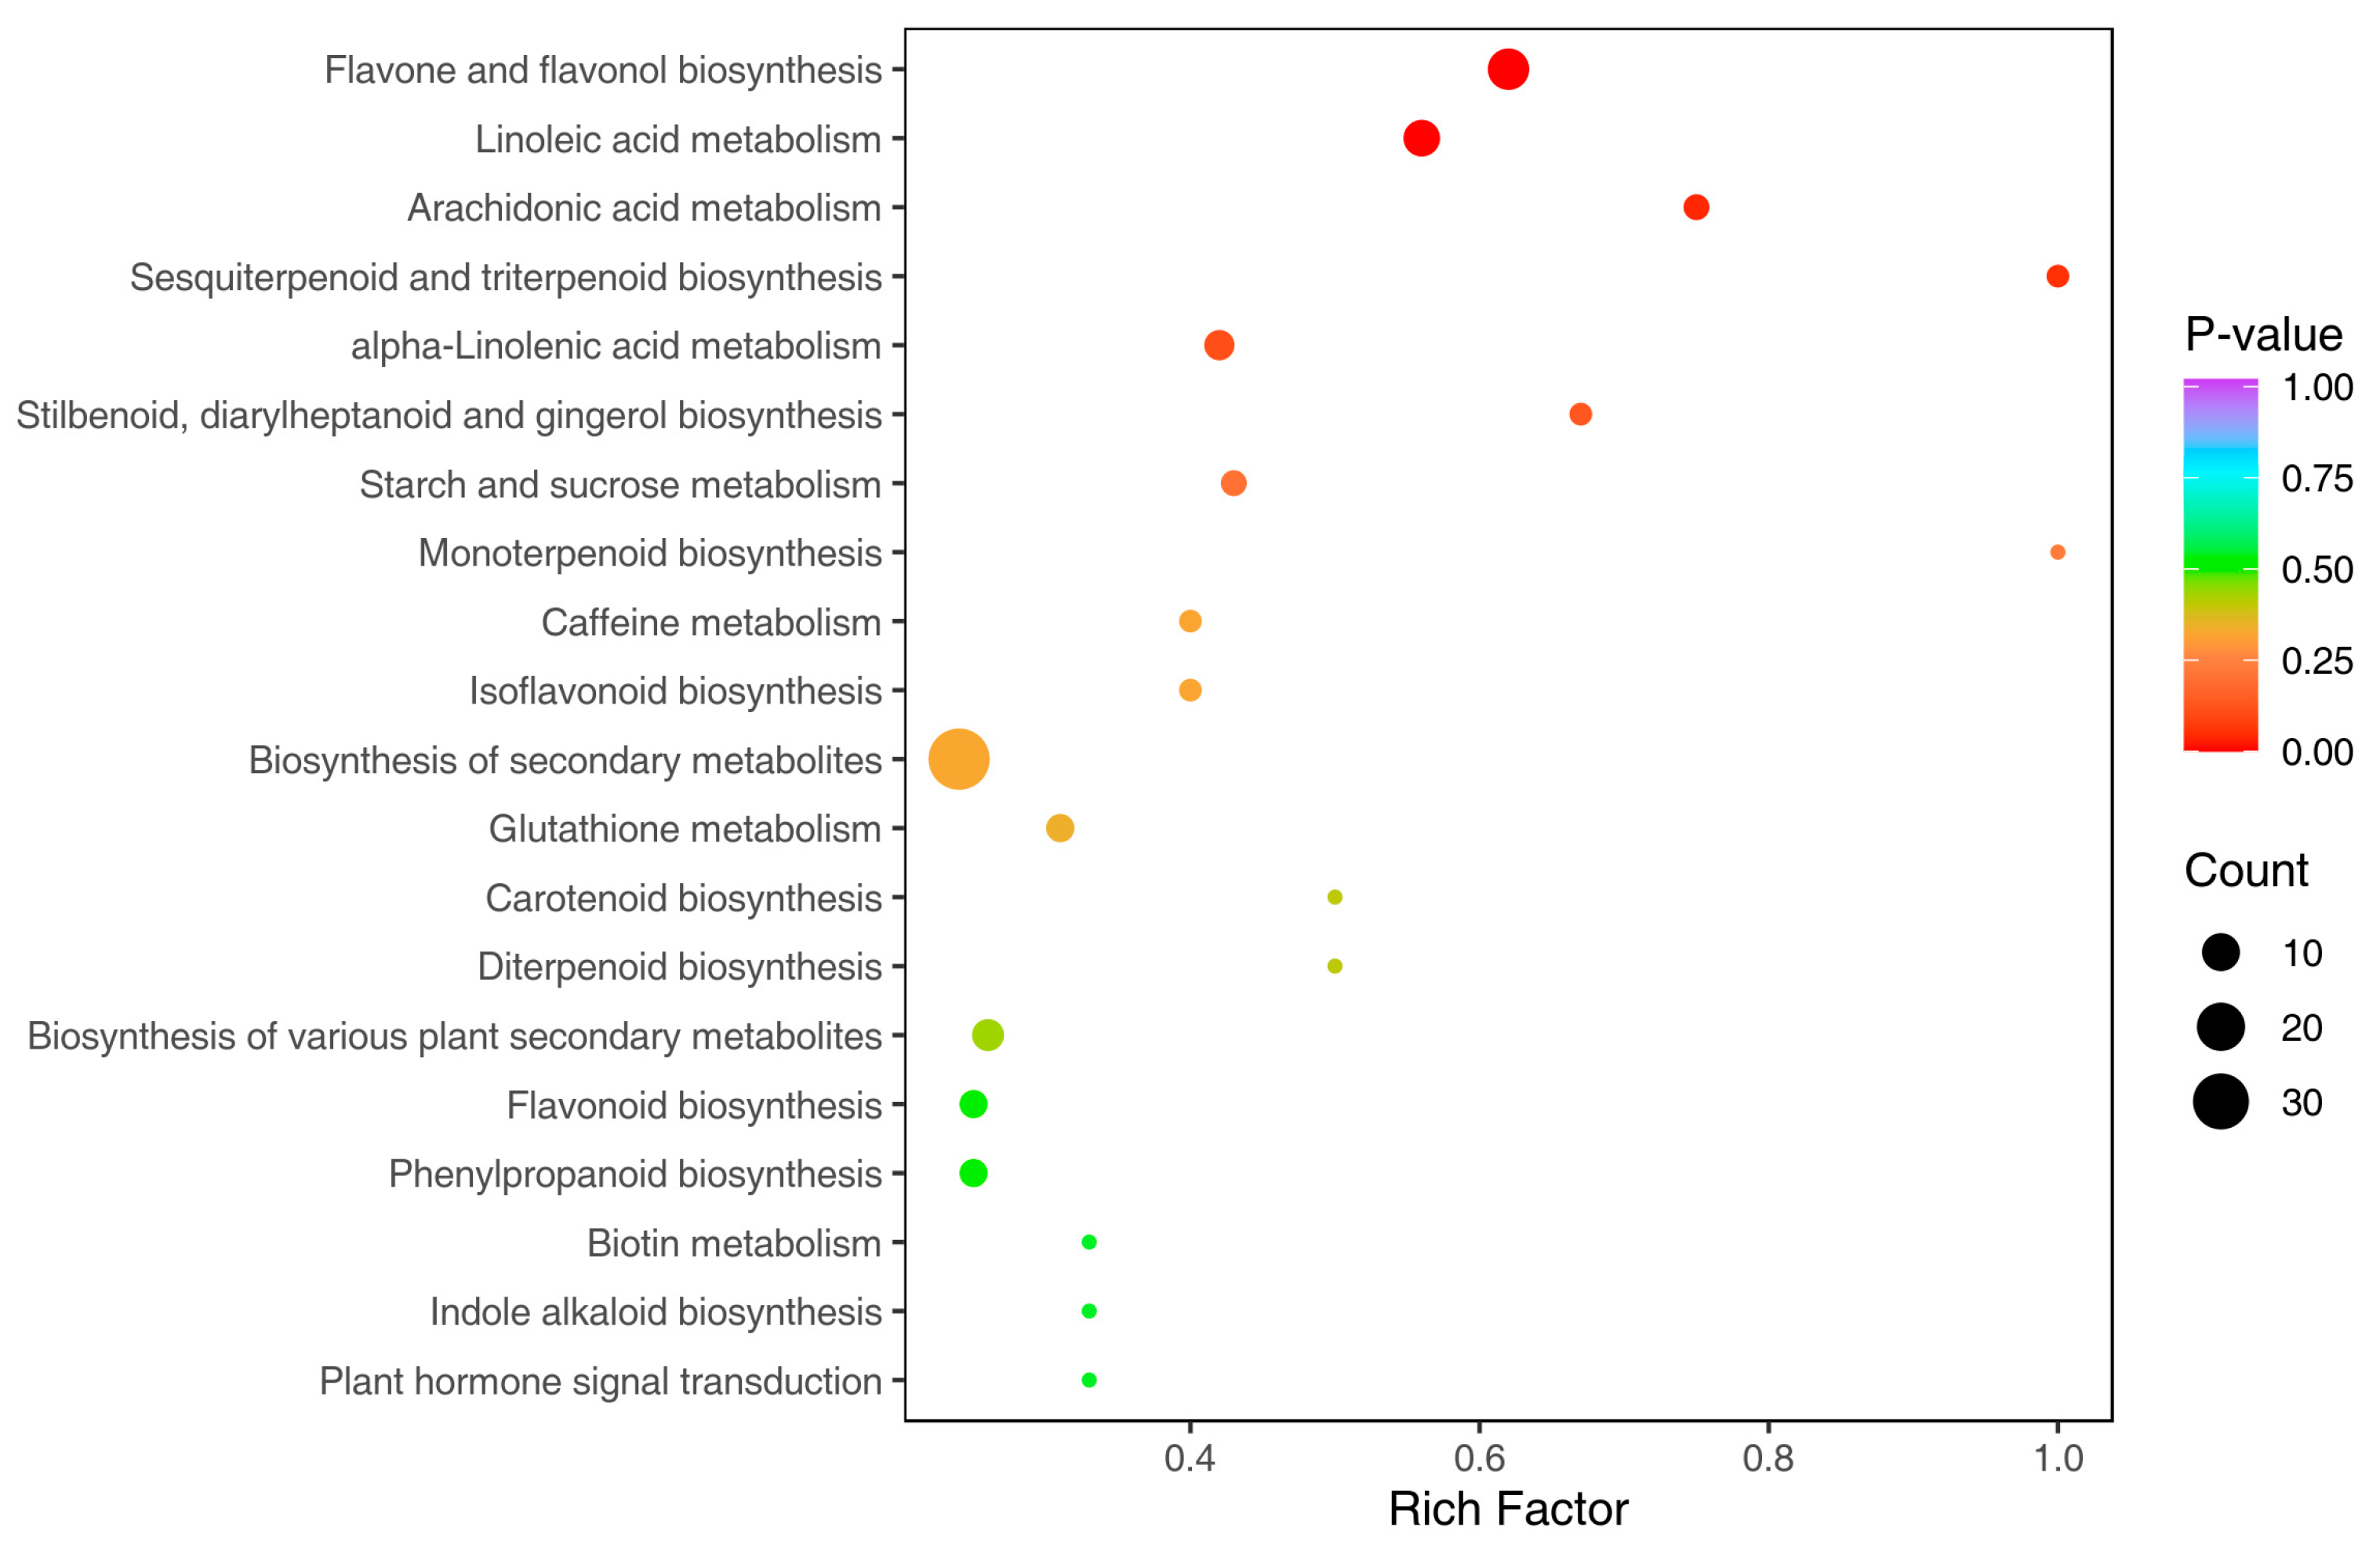
3.5. Kyoto Encyclopedia of Genes and Genomes Annotation and Enrichment Analysis

The KEGG database was employed to carry out pathway enrichment analysis of differential metabolites; significant metabolic pathways can be mined [30]. The results are shown in Figure 7, in which 20 enrichment pathways with the lowest p value are shown (Figure 7, Table 3), among which, 93 metabolites with significant differences have been noted. The metabolic pathways with significant differences are flavonoid and flavanol biosynthesis, linoleic acid metabolism, arachidonic acid metabolism synthesis, sesquiterpenoid and triterpenoid biosynthesis, and linolenic acid metabolic synthesis pathways. A total of 32 metabolites are involved in these five pathways, mainly costunolide are γ-Linolenic Acid,3-O-Methylquercetin, 8,9-Dihydroxy-5Z,11Z,14Z-eicosatrienoic acid, and Jasmonic acid (Figure 8).

4. Discussion

In recent years, BR has been a wide concern, and large-scale cultivation has been carried out in Gansu, Shanxi, Inner Mongolia and other regions. Nowadays, the research on BR mainly focuses on BC, but there was little focus on NC [31]. In this study, the metabolites of YBC and YNC were compared and analyzed using widely targeted metabolomics technology. In total, 2059 metabolites were recognized in the two BRs, among 324 phenolic acids, 270 terpenes, 254 flavonoids, 192 amino acids and their derivatives, and other compounds. Among them, 718 differential metabolites were screened out, and the differential metabolites (718) accounted for 35.44% of the total metabolites (2026), indicating that the metabolite profiles of the two groups were distinct. The major differences were in flavonoids, phenolic acids, terpenes, lignans, and coumarins, accounting for 19.22%, 18.52%, 16.30% and 11.28%, respectively, the differences in these metabolites may be related to the differences in the efficacy of the two drugs. Studies have shown that the differential metabolites in the aboveground parts were primarily associated with monoterpenoid biosynthesis pathways, whereas those in the roots were mainly linked to sesquiterpenoid and triterpenoid biosynthesis pathways [32]. And the superior anti-inflammatory properties of NC can be attributed to its distinct chemical composition compared to BC, as revealed by GC-MS analysis. To put it briefly, the study primarily concentrates on cultivated varieties, whereas research on wild resources remains minimal and represents a gap in the current research on BR.
With the development of molecular biology, it has become possible to explain the phylogeny and quality formation characteristics of authentic medicinal materials from the molecular level; especially, the development and application of genomics has become a powerful tool to decode the genetic causes of authentic medicinal materials. In recent years, the number of wild medicinal materials has gradually declined, especially YBC and YNC, which have become basically extinct in the market, and cultivated BR has become the main source of commercial BR. However, there are serious interspecific and intraspecific type-confounding phenomena, resulting in low yields and quality of BR. Therefore, it was necessary to domesticate wild understory Chinese medicinal materials manually and implement an ecological planting model [33,34,35]. In the process of a resource survey, the author found that there were large areas of YBC and YNC in Yiyuan County, Zibo City, Shandong Province. YBC was distributed in the shadow slope forest, and YNC was distributed in the sun slope. The growth environment of the two was quite different, and the growth rate was good. Based on this, we carried out extensive targeted metabolomics analysis based on UPLC-MS and GC-MS, systematically compared and identified metabolites in the two, and initially screened the different active components in YBC and YNC. The results show that there are significant differences in metabolite composition between the two, and these differences may affect their clinical application and efficacy. Understanding these differences is of great significance for guiding clinical drug use. The results provide a scientific basis for the biosynthesis pathway and related biological activities of BR components used in traditional Chinese medicine, which is of great significance for the utilization of wild BR medicinal resources and can promote the scientific utilization and sustainable development of traditional Chinese medicine resources [36]. This study found that the different metabolites of YBC and YNC were mainly flavonoids, phenolic acids, terpenes, etc., and provides a new way to study the wild resources of BR. The results of KEEG enrichment analysis showed that the different metabolic pathways were flavonoid and flavanol biosynthesis, linoleic acid metabolism, arachidonic acid metabolism synthesis, sesquiterpenoid and triterpenoid biosynthesis, and linolenic acid metabolism synthesis. This is also the main reason why flavonoids, phenolic acids, and terpenes are different in their metabolites.
To sum up, it was crucial to investigate the functional significance of metabolites in terms of pharmacological effects or clinical performance [37]. SS was considered to be the main active component of BR. In order to further improve the scientific and reliability of the study, we plan to further study the pharmacological mechanism of flavonoids and terpenoids by combining multi-omics techniques, such as transcriptomics, proteomics, and metabolomics, in subsequent studies. In future studies, we will consider included plant samples from different age stages to more fully assess the effects of age on metabolite distribution. At the same time, this study has certain limitations because the quality of medicinal materials was affected by many factors. In future work, it will be essential to increase the sample size and take into account factors such as expanding the origins and harvesting periods.

5. Conclusions

In this study, we conducted a broadly targeted metabolomics analysis to elucidate the differential metabolites between Bupleurum chinense DC. and Bupleurum scorzoneraefolium Willd., two closely related species with distinct pharmacological properties. In the meantime, this is the first attempt to report the metabolomics of the wild resource BR in Shandong province, and provides a reference for the study of wild resources. We used YBC and YNC as research materials. The metabolite differences between them caused the differences in their clinical efficacy. Our findings provide valuable insights into the metabolic profiles of these plants, which can aid in understanding their therapeutic differences and guide future research and development. In conclusion, this study provides a comprehensive metabolomics analysis of YBC and YNC, revealing their distinct metabolic profiles and potential therapeutic applications. The results not only contribute to the understanding of these important medicinal plants, but also pave a way for future research and development in the field of traditional medicine.

Author Contributions

Conceptualization, data curation, and writing—original draft preparation, M.L.; data curation, T.Z., G.L. and Y.C.; formal analysis, data curation, writing—review and editing, W.C., X.B., Z.Z. and Q.Z.; supervision, Y.Z. All authors have read and agreed to the published version of the manuscript.

Funding

This work was supported by the Open Project of the Key Laboratory of Classical Chinese Medicine Theory of the Ministry of Education, the Shandong Provincial Collaborative Innovation Center for Quality Control and Construction of the Whole Industrial Chain of Traditional Chinese Medicine (CYLXTCX2020), the Innovative Public Service Platform in Shandong Province (2018JGX111), and the Shandong Academy of Agricultural Sciences’ “3237” Qilu Agricultural Science Talent Project.

Institutional Review Board Statement

Not applicable.

Informed Consent Statement

Not applicable.

Data Availability Statement

The original contributions presented in the study are included in the article. Further inquiries can be directed to the corresponding authors.

Conflicts of Interest

The authors declare no conflicts of interest.

References

  1. Pharmacopoeia of the People’s Republic of China: Part I, 2020 ed.; China Medical Science Press: Beijing, China, 2015; pp. 156–157.
  2. Sun, P.; Li, Y.; Wei, S.; Zhao, T.; Wang, Y.; Song, C.; Xue, L.; Wang, F.; Xiao, L.; Wu, J. Pharmacological effects and chemical constituents of bupleurum. Mini Rev. Med. Chem. 2019, 19, 34–55. [Google Scholar] [CrossRef] [PubMed]
  3. Jiang, H.; Yang, L.; Hou, A.; Zhang, J.; Wang, S.; Man, W.; Zheng, S.; Yu, H.; Wang, X.; Yang, B.; et al. Botany, traditional uses, phytochemistry, analytical methods, processing, pharmacology and pharmacokinetics of Bupleuri Radix: A systematic review. Biomed. Pharmacother. 2020, 131, 110679. [Google Scholar] [CrossRef]
  4. Li, L.; Chen, L.; Hu, X.; Chen, C.; Zheng, X. Research Progress on Chemical Components and Pharmacological Effects of Radix Bupleuri. Acta Chin. Med. Pharmacol. 2023, 51, 109–112. [Google Scholar] [CrossRef]
  5. Xia, Z.; Liu, X.; Tong, L.; Wang, H.; Qin, X. Comparison of chemical constituents of Bupleurum marginatum var. stenophyllum and Bupleurum chinense DC. using UHPLC–Q-TOF–MS based on a metabonomics approach. Biomed. Chromatogr. 2021, 35, e5133. [Google Scholar] [CrossRef] [PubMed]
  6. Huang, H.; Zhang, X.; Lin, M.; Shen, Y.; Yan, S.; Zhang, W. Characterization and identification of saikosaponins in crude extracts from three Bupleurum species using LC-ESI-MS. J. Sep. Sci. 2008, 31, 3190–3201. [Google Scholar] [CrossRef]
  7. Xia, Z.; Liu, X. Research Progress on Chemical Composition and Quality Control Methods of Bupleurum chinense. Mod. Chin. Med. 2021, 23, 940–949. [Google Scholar]
  8. Yuan, B.; Yang, R.; Ma, Y.; Zhou, S.; Zhang, X.; Liu, Y. A systematic review of the active saikosaponins and extracts isolated from Radix Bupleuri and their applications. Pharm. Biol. 2017, 55, 620. [Google Scholar] [CrossRef]
  9. Chen, S.; Wang, K.; Wang, H.; Gao, Y.; Nie, K.; Jiang, X. The therapeutic effects of saikosaponins on depression through the modulation of neuroplasticity: From molecular mechanisms to potential clinical applications. Pharmacol. Res. 2024, 201, 107090. [Google Scholar] [CrossRef] [PubMed]
  10. Feng, J.; Gao, X.; Qin, X. To investigate the difference, clinical application and toxicity of Bupleurum. J. Chin. Med. Mater. 2019, 42, 2200–2205. [Google Scholar]
  11. Zhang, G. Survey and Identification of Cultivated Bupleurum spp. Germplasm Resources in China. Ph.D. Thesis, Peking Union Medical College, Beijing, China, 2020. [Google Scholar]
  12. Wang, W.; Du, X.; Hou, B.; Zhu, H.; Yu, D. Correlations between appearance traits and internal quality of Bupleurum scorzonerifolium roots based on theory of “quality evaluation through morphological identification”. China J. Chin. Mater. Medica 2023, 48, 1815–1823. [Google Scholar]
  13. Liang, Z.; Liu, L.; Chao, Z. Investigation of Medicinal Bupleurum Resources and Current situation of Chaihu Production. Lishizhen Med. Mater. Medica Res. 2012, 23, 2011–2013. [Google Scholar]
  14. Sun, R.; Wang, L.; Ren, H.; Lv, L.; Yin, J. Experimental Research of Influences on Acute Toxicity and Saponins Substances Caused by Different Original of Bupleurum chinense. Chin. J. Pharmacovigil. 2009, 6, 705–708. [Google Scholar]
  15. Zhang, S.; Xing, J.; Li, Z.; Qin, X. Metabolic Essential Oil of Different Radix Bupleuri by GC-MS. Chin. J. Exp. Tradit. Med. Formulae 2014, 20, 84–87. [Google Scholar]
  16. Guo, X.Q.; Tian, J.S.; Shi, B.Y.; Xing, J.; Jia, J.P.; Zhang, L.Z. 1H-NMR metabonomics on antidepression of Xiaoyao Powder composed of Bupleurum scorzonerifolium or Bupleurum chinense. Chin. Tradit. Herb. Drugs 2012, 43, 2209–2216. [Google Scholar]
  17. Kim, S.; Lim, S.-W.; Choi, J. Drug discovery inspired by bioactive small molecules from nature. Anim. Cell Syst. 2022, 26, 254–265. [Google Scholar] [CrossRef] [PubMed]
  18. Qu, X.; Hu, S.; Li, T.; Zhang, J.; Wang, B.; Liu, C. Metabolomics Analysis Reveals the Differences Between Bupleurum chinense DC. and Bupleurum scorzonerifolium Willd. Front Plant Sci. 2022, 13, 933849. [Google Scholar] [CrossRef] [PubMed]
  19. Yu, M.; Chen, H.; Liu, S.; Li, Y.; Sui, C.; Hou, D.; Wei, J. Differential Expression of Genes Involved in Saikosaponin Biosynthesis Between Bupleurum chinense DC. and Bupleurum scorzonerifolium Willd. Front. Genet. 2020, 11, 1–7. [Google Scholar] [CrossRef] [PubMed]
  20. Chen, Z.; Hu, C.; Wu, Z.; Jin, Y.; Cao, D.; Wu, S. Overview on Application of Metabonomics in Study on Processing Mechanism of Traditional Chinese Materia Medica. Chin. Arch. Tradit. Chin. Med. 2018, 36, 275–279. [Google Scholar]
  21. Chen, L. Study on Quality Evaluation of Bupleurum chinensis. Ph.D. Thesis, Harbin University of Commerce, Harbin, China, 2024. [Google Scholar]
  22. Zhou, X.; Yang, G.; Zhou, L.; Shao, A.; Wei, Y.; Chi, X.; Li, X. Study on Characteristics and Microscopic identification of Fruits of Bupleurum chinense and Bupleurum scorzonerifolium. Mod. Chin. Med. 2018, 20, 1251–1254. [Google Scholar]
  23. Zou, S.; Wu, J.; Shahid, M.; He, Y.; Lin, S.; Liu, Z.; Yang, X. Identification of key taste components in loquat using widely targeted metabolomics. Food Chem. 2020, 323, 126822. [Google Scholar] [CrossRef]
  24. Chen, W.; Gong, L.; Guo, Z.; Wang, W.; Zhang, H.; Liu, X.; Liu, H.; Yu, S.; Xiong, L.; Luo, J. A novel integrated method for large-scale detection, identification, and quantification of widely targeted metabolites. Mol. Plant 2013, 6, 1769–1780. [Google Scholar] [CrossRef] [PubMed]
  25. Fraga, C.; Clowers, B.; Moore, R.; Zink, E. Signature-discovery approach for sample matching of a nerve-agent precursor using liquid chromatography-mass spectrometry, XCMS, and chemometrics. Anal. Chem. 2010, 82, 4165–4173. [Google Scholar] [CrossRef] [PubMed]
  26. Chong, J.; Xia, J. MetaboAnalystR: An R package for flexible and reproducible analysis of metabolomics data. Bioinformatics 2018, 34, 4313–4314. [Google Scholar] [CrossRef] [PubMed]
  27. Eriksson, L.; Kettanehwold, N.; Trygg, J. Multi and Megavariate Data Analysis: Part I: Basic Principles and Applications; Umetrics Inc.: Umeaa, Sweden, 2006. [Google Scholar]
  28. Wang, Y.; Yuan, C.; Qian, J.; Wang, Y.; Liu, Y.; Liu, Y.; Nan, T.; Kang, L.; Zhan, Z.; Guo, L.; et al. Reviews and Recommendations in Comparative Studies on Quality of Wild and Cultivated Chinese Crude Drugs. Chin. J. Exp. Tradit. Med. Formulae 2024, 30, 1–20. [Google Scholar]
  29. Thévenot, E.; Roux, A.; Xu, Y.; Ezan, E.; Junot, C. Analysis of the Human Adult Urinary Metabolome Variations with Age, Body Mass Index, and Gender by Implementing a Comprehensive Workflow for Univariate and OPLS Statistical Analyses. J. Proteome Res. 2015, 14, 3322–3335. [Google Scholar] [CrossRef] [PubMed]
  30. Ogata, H.; Goto, S.; Sato, K.; Fujibuchi, W.; Kanehisa, M. KEGG: Kyoto encyclopedia of genes and genomes. Nucleic Acids Res. 1999, 27, 29–34. [Google Scholar] [CrossRef]
  31. Zhu, L.; Liang, Z.; Yi, T.; Ma, Y.; Zhao, Z.; Guo, B.; Zhang, J.; Chen, H. Comparison of chemical profiles between the root and aerial parts from three Bupleurum species based on a UHPLC-QTOF-MS metabolomics approach. BMC Complement. Altern. Med. 2017, 17, 305. [Google Scholar] [CrossRef]
  32. Zhang, Q.; Li, M.; Chen, X.; Liu, G.; Zhang, Z.; Tan, Q.; Hu, Y.; Fan, Y.; Liu, Y.; Zhu, T.; et al. Chromosome-Level Genome Assembly of Bupleurum chinense DC Provides Insights into the Saikosaponin Biosynthesis. Front. Genet. 2022, 13, 878431. [Google Scholar] [CrossRef]
  33. Li, P.; Song, J.; Guan, H.; Zhang, Y.; Zhou, G. Analysis and Countermeasures on Use of Endangered Wild Fauna and Floran Resources in Traditional Chinese Medicine. Food Drug 2021, 23, 168–172. [Google Scholar]
  34. Zhang, C.; Sun, J.; Wang, Y.; Wang, H.; Guo, X.; Yan, B.; Sun, Z.; Wang, S.; Guo, L. Research progress in microevolutionary process of excellent traits and quality of Dao-di herbs. China J. Chin. Mater. Medica 2023, 48, 6021–6029. [Google Scholar]
  35. Wang, C.; Zhao, H.; Yan, Y.; Shi, J.; Chen, S.; Tan, M.; Chen, J.; Liu, Z.; Chen, C.; Zou, L.; et al. Thoughts of omics research on quality formation in Dao-di herbs. China J. Chin. Mater. Medica 2018, 43, 2407–2412. [Google Scholar]
  36. Zhao, M.; Xiao, L.; Ke, G.; Zhao, G.; Chen, Q.; Shen, L.; Parsa, D.; Chen, M.; Hu, Y.; Zhang, J.; et al. Comprehensive comparison on the anti-inflammation and GC-MS-based metabolomics discrimination between Bupleuri chinense DC. and B. scorzonerifolium Willd. Front. Pharmacol. 2022, 13, 1005011. [Google Scholar] [CrossRef]
  37. Moghadam, A.; Taghizadeh, M.; Haghi, R.; Tahmasebi, A.; Niazi, A.; Ebrahimie, E. Exploring novel insights: Methyl jasmonate treatment reveals novel lncRNA-mediated regulation of secondary metabolite biosynthesis pathways in Echinacea purpurea. Food Biosci. 2023, 52, 103457. [Google Scholar] [CrossRef]
Figure 1. The living environment of YNC and YBC at the time of sample collection ((A):YBC; (B):YNC).
Metabolites 15 00119 g001
Figure 2. Total ion current plot for quality control. Note: (A) negative ion mode; (B) positive ion mode.
Metabolites 15 00119 g002
Figure 3. Circular diagram of metabolite class composition.
Metabolites 15 00119 g003
Figure 4. PCA score plot of the metabolites in the YBC and YNC.
Metabolites 15 00119 g004
Figure 5. The score chart (A) and verification chart (B) of OPLS-DA.
Metabolites 15 00119 g005
Figure 6. Heat map for differential metabolites.
Metabolites 15 00119 g006
Figure 7. KEGG enrichment map for differential metabolites Note: The color of the points is a p-value; the redder the color, the more significant the enrichment. The size of the points represents the number of enriched differentiated metabolites.
Metabolites 15 00119 g007
Figure 8. Heat map depicting the differential metabolite content within related metabolic pathways. Note: (A) Flavone and flavanol biosynthesis; (B) linoleic acid metabolism; (C) alpha-linolenic acid metabolism. If there are less than 5 differential metabolites in the pathway, the pathway is not displayed.
Metabolites 15 00119 g008
Table 1. Statistics of YBC and YNC metabolites.
TotalCommonDifferenceYBCYNC
Phenolic acids3243191332(p-Coumaroylcaffeoyltartaric acid, 2,4,6-Trihydroxybenzoic acid)3(Acropyrone, Leonoside F, 3,5-Dicaffeoylquinic acid)
Dx rTerpenoids2702561176(Shanzhiside methyl eter,3-Hydroxy-11-oxoolean-12-en-30-oic acid (18α-Glycyrrhetinic acid), 27,28-Dicarboxyl ursolicaid, Clerodendrin I, Achyranthoside D, Armatoside)8(Ceanothenicaid, Semiaquilegin A, 13-Methyl-27-norolean-14-en-3-ol (Taraxerol),
Nootkatol, Icariside B1, Lupane-20(29)-en-3-on- 28-oic acid, lada-8(17), 12-diene-15,16-dial, [6-[acetyloxy-[1-(furan-3-yl)-5-hydroxy-8a-methyl-3,6-dioxo-7,8-dihydro-1H-isochromen-5-yl]methyl]-3-(2-methoxy-2-oxoethyl)-2,2,4-trimethyl-5-oxocyclohexyl]2-methylbutanoate)
Flavonoids2542471385(Quercetin-5-O-glucuronide, Dihydrocharcone-4′-O-glucoside,
Genistein-8-C-glucoside-O-apiosyl, Luteolin-7-O-(6″-sinapoyl)glucoside,
Quercetin-3-O-(2″-O-Xylosyl rutinoside)
2(Diosmetin-8-C(2″-Orhamnosyl) glucosde, Luteolin-3′-O-glucoside)
Amino acids and derivatives19219238
Lipids19119141
Alkaloids176173423(Ethy11,2-dihydro-1-methyl-2-oxoquinoline-4-carboxylate,
Caffeoylcholine-3-O-glucoside,
Caffeoylcholine-4-O-glucoside)
Lignans and Coumarins173172811(5′-Methoxylariciresino1)
Organic acids120118281(Pyrrole-2-carboxylic acid)1(Dihydrojasmonic acid)
Nucleotides and derivatives727210
Quinones16168
Tannins33
Others268267821(Senkyunolide I)
Total205920267181914
Table 2. Metabolites in the top 20 of YBC and YNC roots with different multiples.
No.CompoundsClass IClass IIFormulalog2FCType
13,5-dihydroxy-4-{[(2s,3r,4s,5s,6r)-3,4,5-trihydroxy-6-[(sulfooxy)methyl]oxan-2-yl]oxy}benzoic acidPhenolic acidsPhenolic acidsC13H16O13S12.45up
23,5-dihydroxy-4-[(2S,3R,4S,5S,6R)-3,4,5-trih-droxy-6-(sulfooxymethyl)oxan-2-yl]oxybenzoic acidPhenolic acidsPhenolic acidsC13H16O13S12.89up
35-O-Feruloylquinic acidPhenolic acidsPhenolic acidsC17H20O97.21up
4Kaempferol-3-O-rhamnoside (Afzelin)(Kaempferin)FlavonoidsFlavonoidsC21H20O108.32up
58-Methoxykaempferol-7-O-rhamnosideFlavonoidsFlavonoidsC22H22O117.17up
6Kaempferol-7-O-rhamnosideFlavonoidsFlavonoidsC21H20O108.48up
7Hispidulin-7-O-(6″-O-p-Coumaroyl)GlucosideFlavonoidsFlavonoidsC31H28O137.02up
8Quercetin-3,7-Di-O-rhamnosideFlavonoidsFlavonoidsC27H30O156.82up
95,7-Dimethoxycoumarin (Limettin)(Citropten)Lignans and CoumarinsCoumarinsC11H10O47.98up
106,7-Dimethoxy-4-methylcoumarinLignans and CoumarinsCoumarinsC12H12O49.81up
113-Methyl-6-methoxy-8-hydroxy-3,4-dihydroisocoumarinLignans and CoumarinsCoumarinsC11H12O48.21up
12EugeninOthersOthersC11H10O48.67up
13leptorumolOthersOthersC11H10O48.23up
1430-O-AangeloylhamaudolOthersChromoneC20H22O68.40up
15Vanillin acetatePhenolic acidsPhenolic acidsC10H10O4−7.62down
166-Methylaloe emodinQuinonesAnthraquinoneC16H12O5−6.28down
17HydroxystemofolineAlkaloidsPyrrole alkaloidsC22H29NO6−7.52down
18CinnamoyltyraminAlkaloidsPhenolamineC17H17NO2−6.35down
19Ajugamacrin C*TerpenoidsDiterpenoidsC34H50O11−6.60down
20Ajugamacrin D*TerpenoidsDiterpenoidsC34H50O11−7.17down
Table 3. Statistical information table of KEGG pathway enrichment in the group.
KEGG PathwayKo_IDNumber of Metabolitesp-Value
Flavone and flavanol biosynthesisko00944130.0001
Linoleic acid metabolismko0059190.0033
Arachidonic acid metabolismko0059030.0388
Sesquiterpenoid and triterpenoid biosynthesisko0090920.0518
alpha-Linolenic acid metabolismko0059250.1133
Stilbene, diarylheptanoid and gingerol biosynthesisko0094520.1321
Starch and sucrose metabolismko0050030.1988
Monoterpenoid biosynthesisko0090210.2285
Caffeine metabolismko0023220.3217
Isoflavonoid biosynthesisko0094320.3217
Biosynthesis of secondary metabolitesko01110380.3249
Glutathione metabolismko0048040.3429
Carotenoid biosynthesisko0090610.4052
Diterpenoid biosynthesisko0090410.4052
Biosynthesis of various plant secondary metabolitesko0099960.4341
Flavonoid biosynthesisko0094140.5166
Phenylpropanoid biosynthesisko0094040.5166
Biotin metabolismko0078010.5418
Indole alkaloid biosynthesisko0090110.5418
Plant hormone signal transductionko0407510.5418
Disclaimer/Publisher’s Note: The statements, opinions and data contained in all publications are solely those of the individual author(s) and contributor(s) and not of MDPI and/or the editor(s). MDPI and/or the editor(s) disclaim responsibility for any injury to people or property resulting from any ideas, methods, instructions or products referred to in the content.

