
Beta-Glucan Alters Gut Microbiota and Plasma Metabolites in Pre-Weaning Dairy Calves

 , , , and
Abstract
:
1. Introduction
2. Materials and Methods
2.1. Animal Management
2.2. Experimental Treatments and Sample Collection
2.3. Serum Analysis
2.4. Fecal Microbiome Analysis
2.5. Plasma Metabolites Analyses
2.6. Statistical Analyses
3. Results
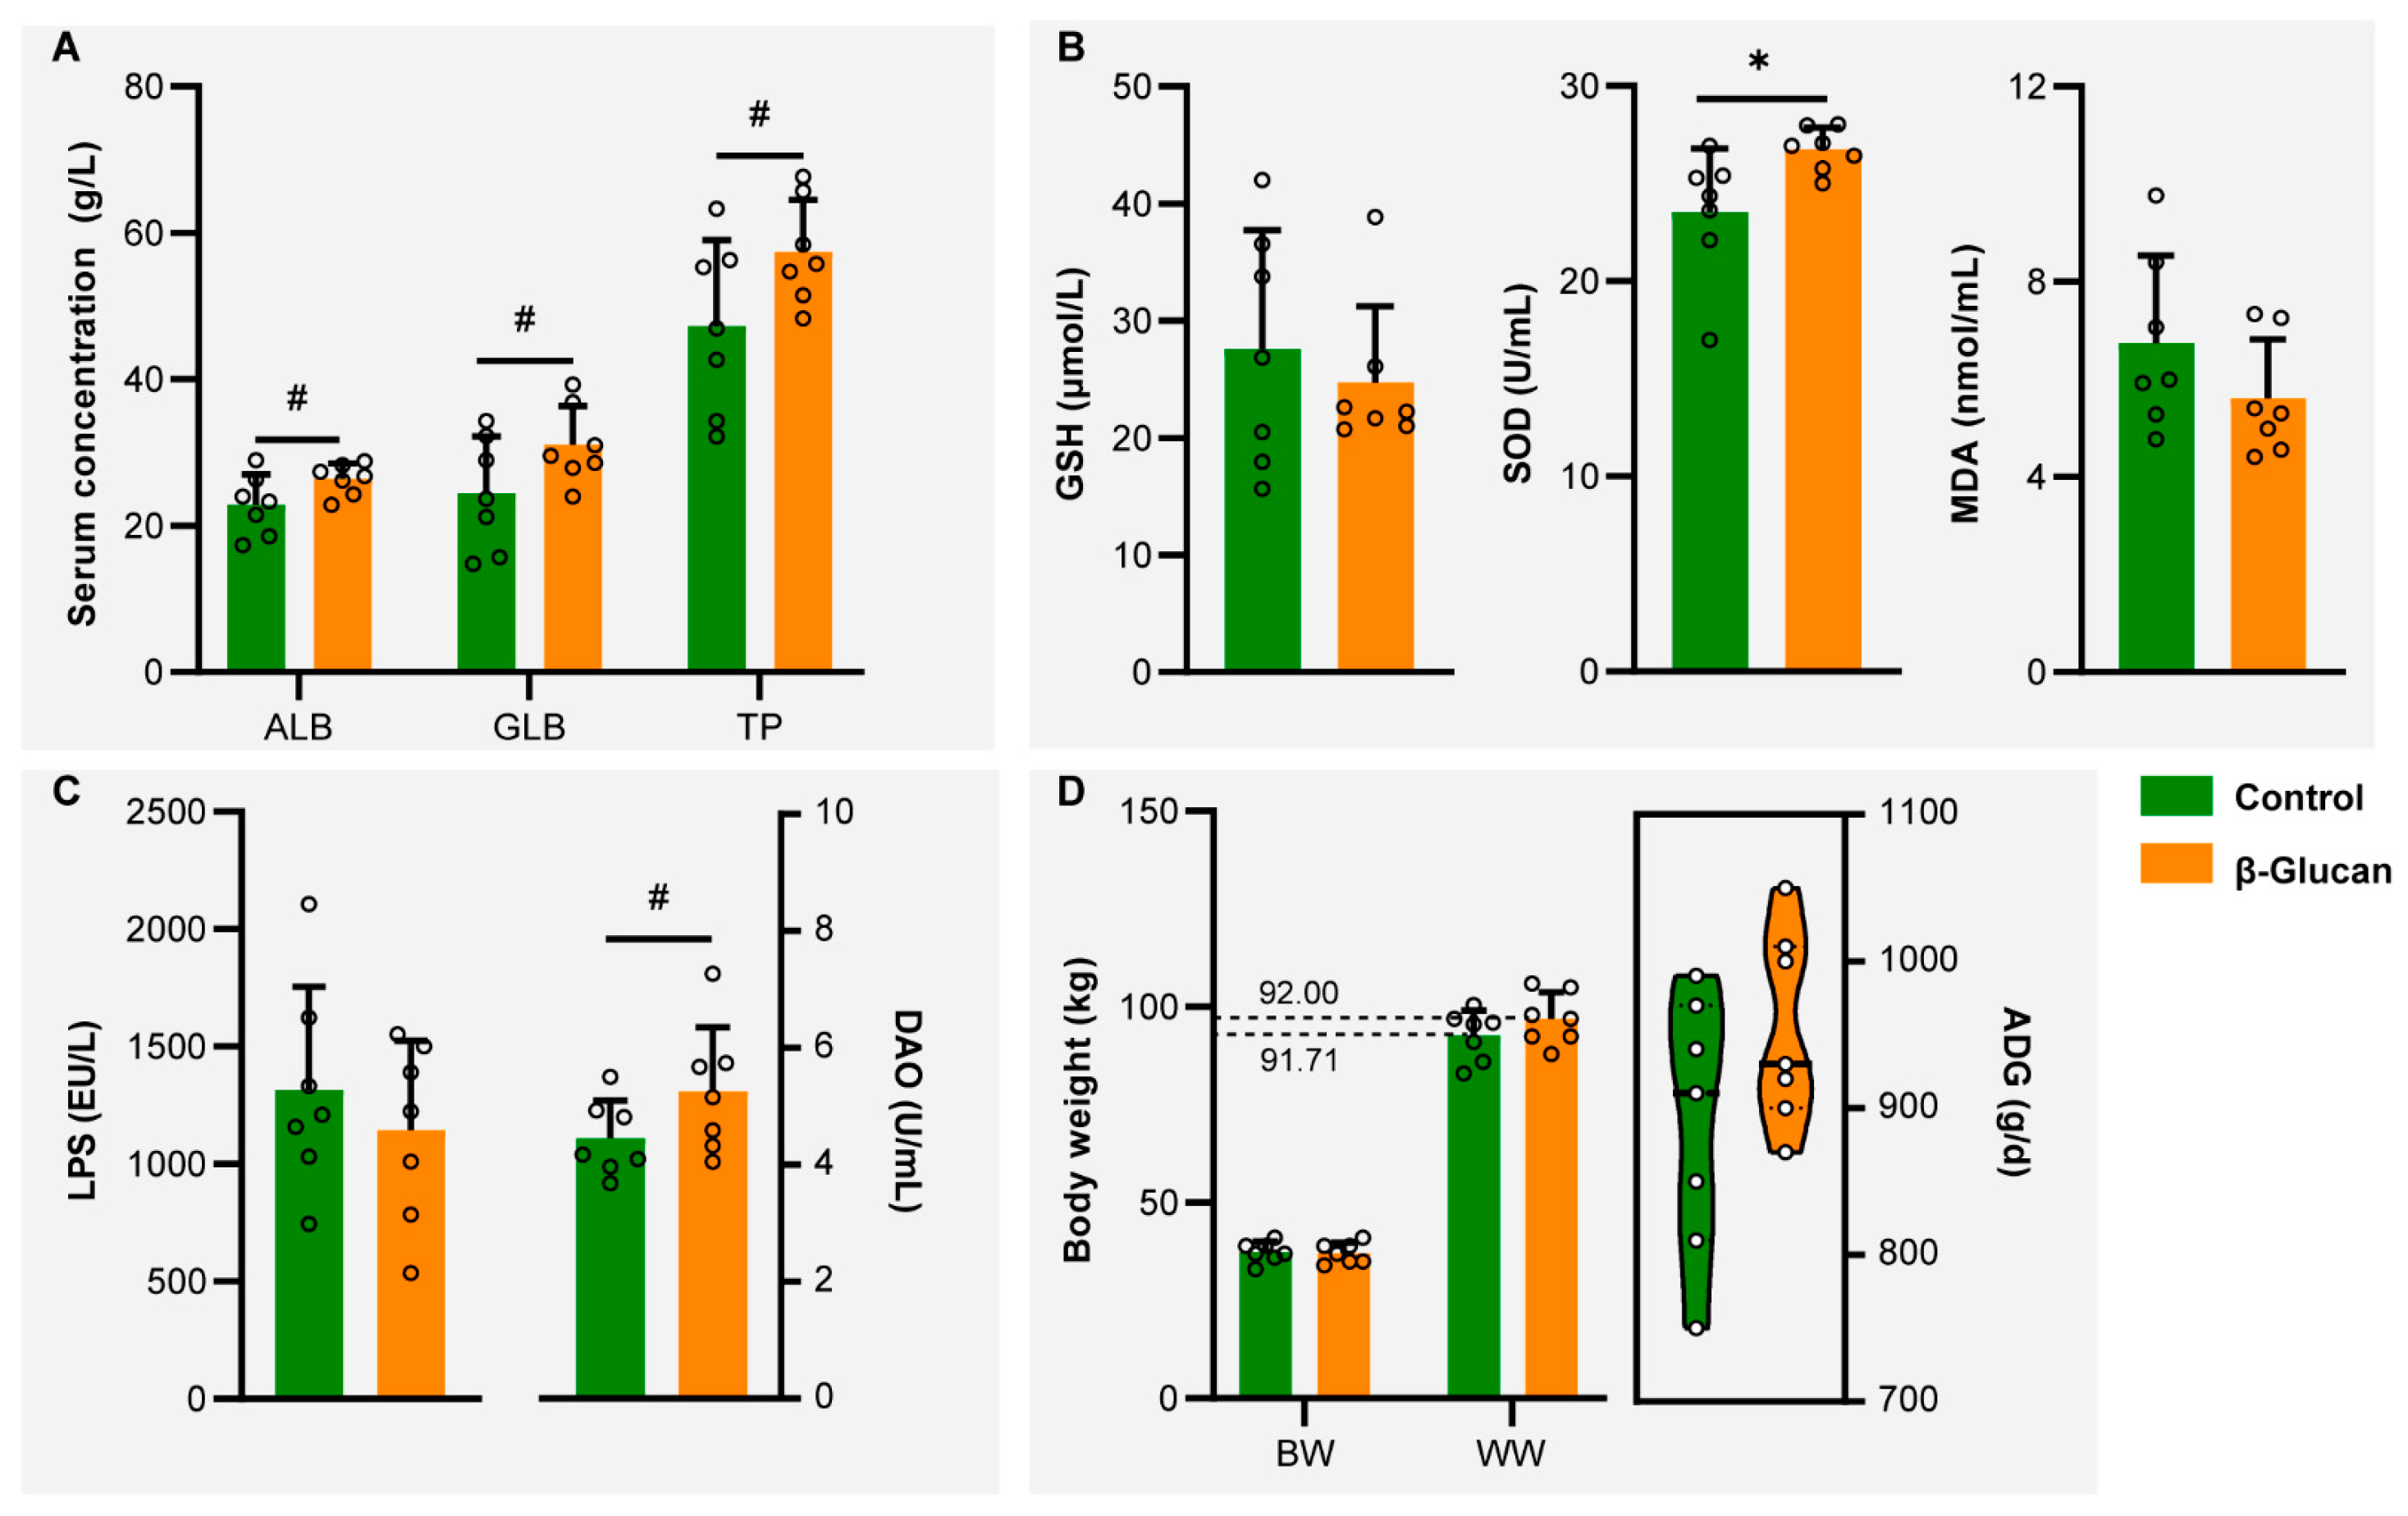
3.1. Serum Markers and Body Weight Analyses
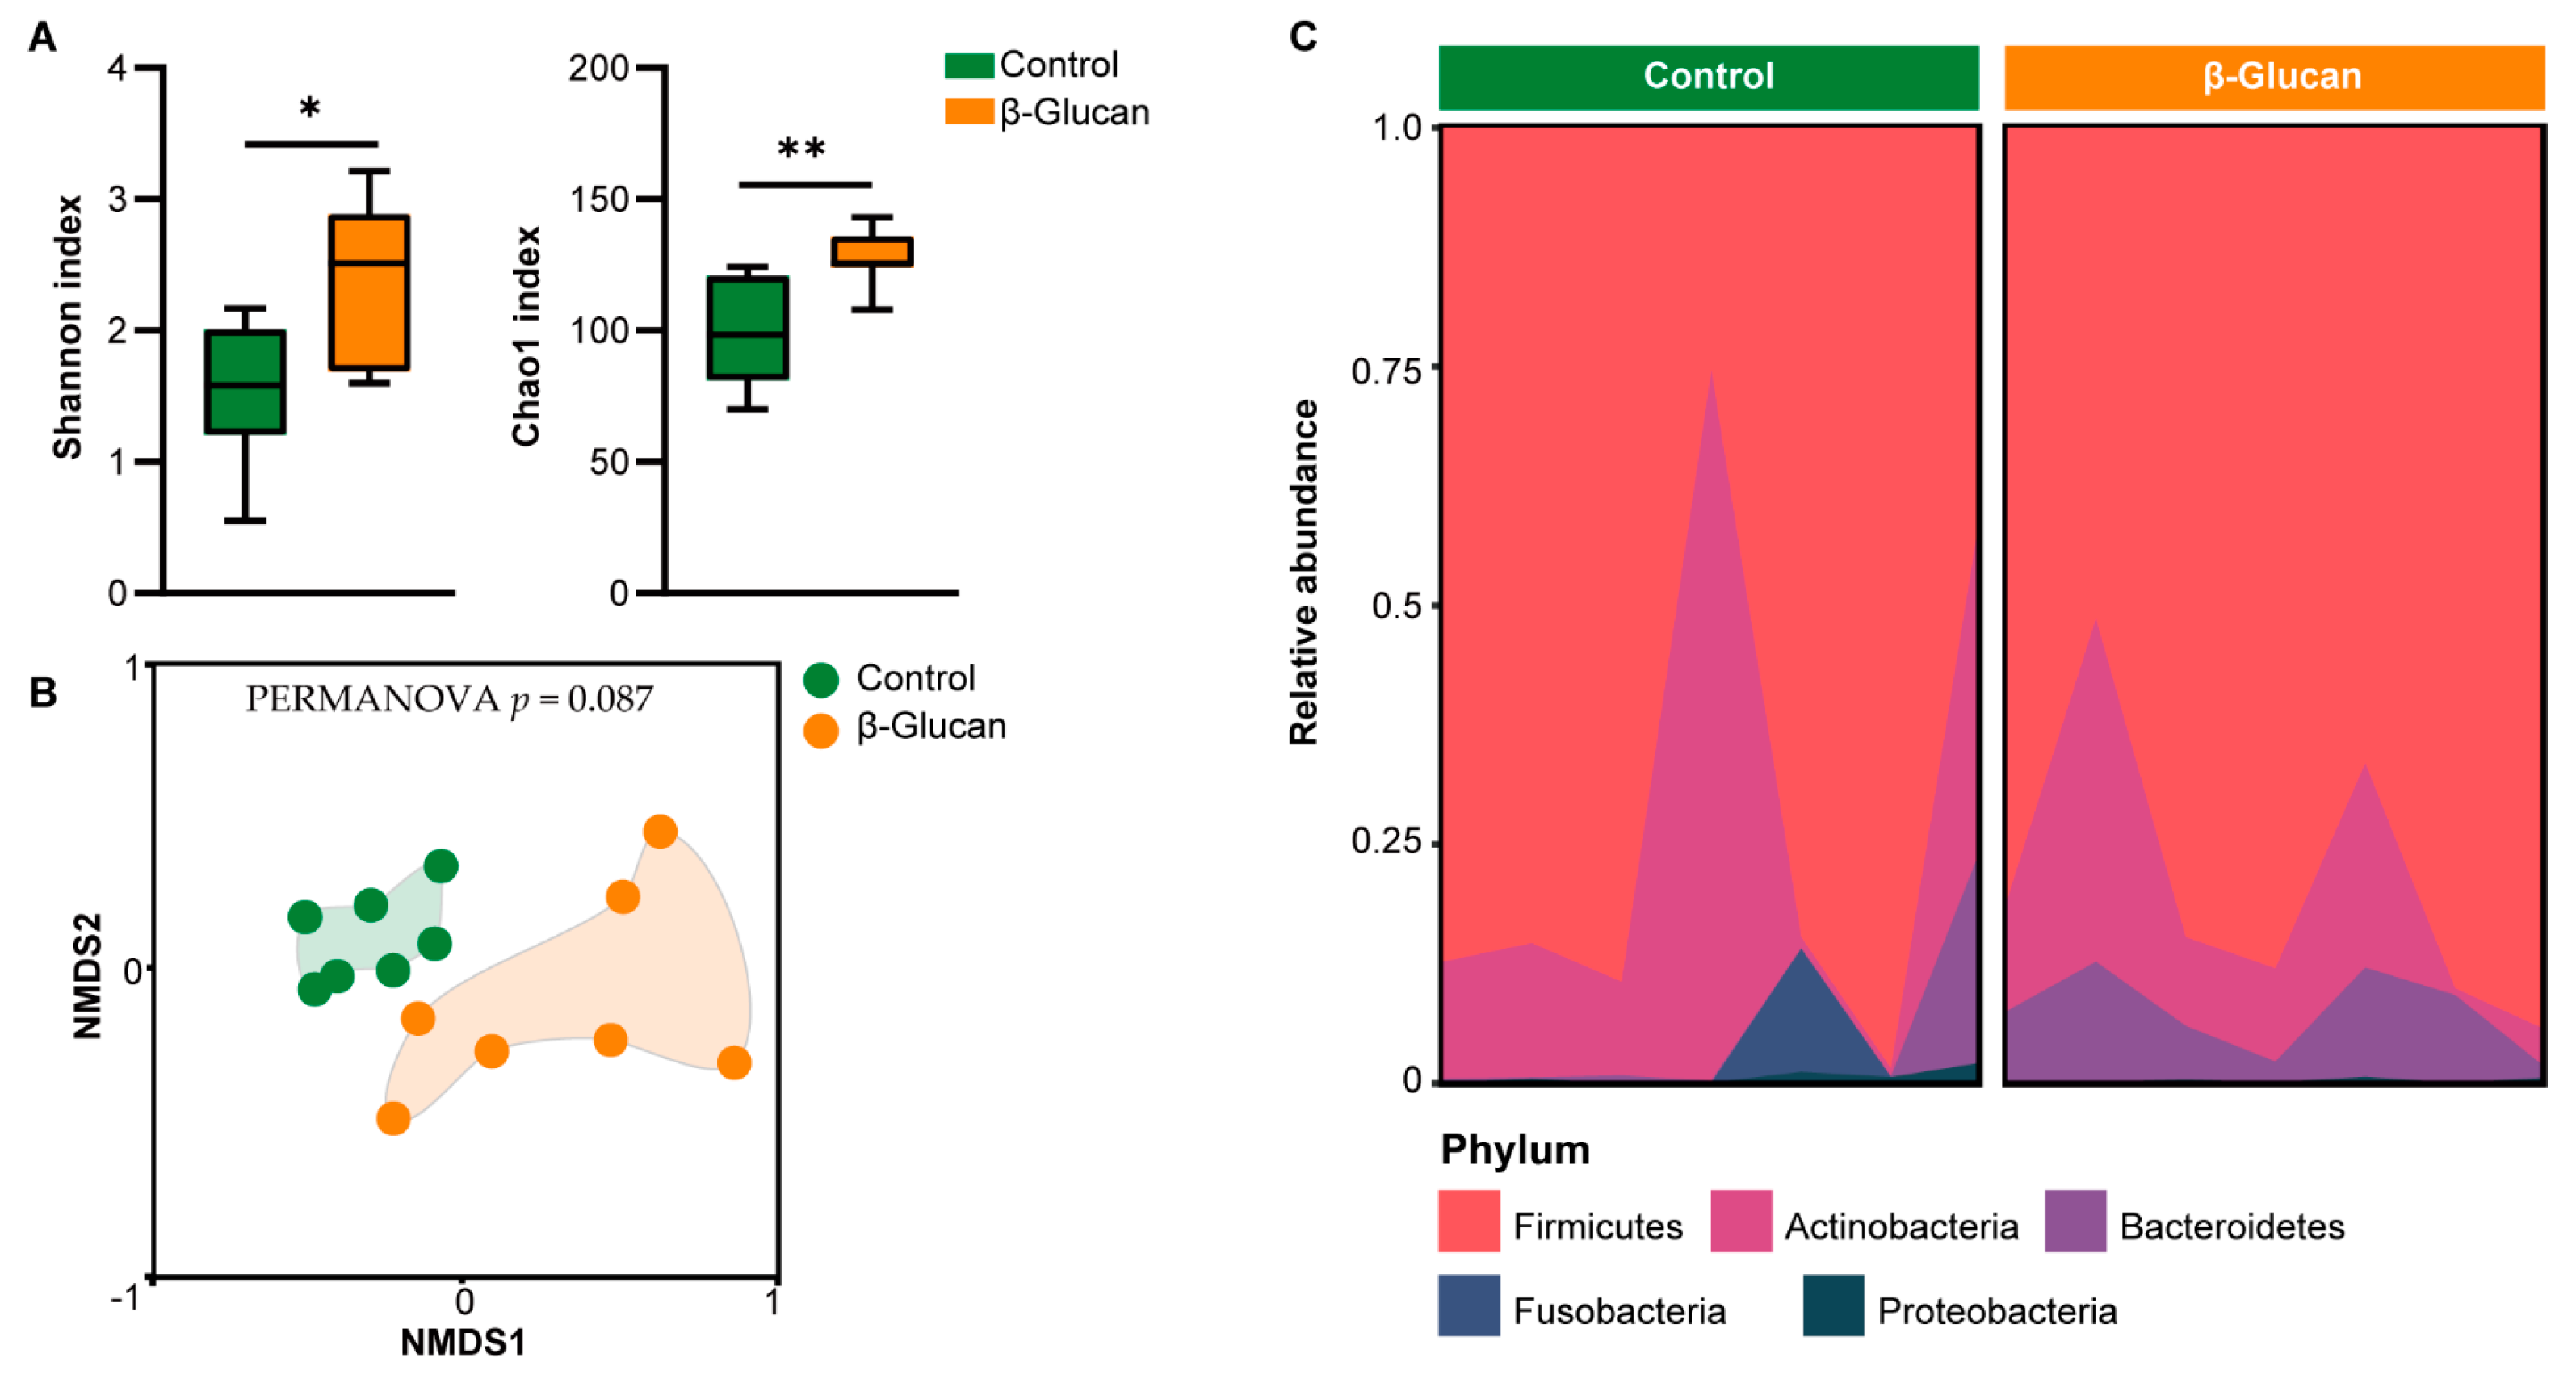
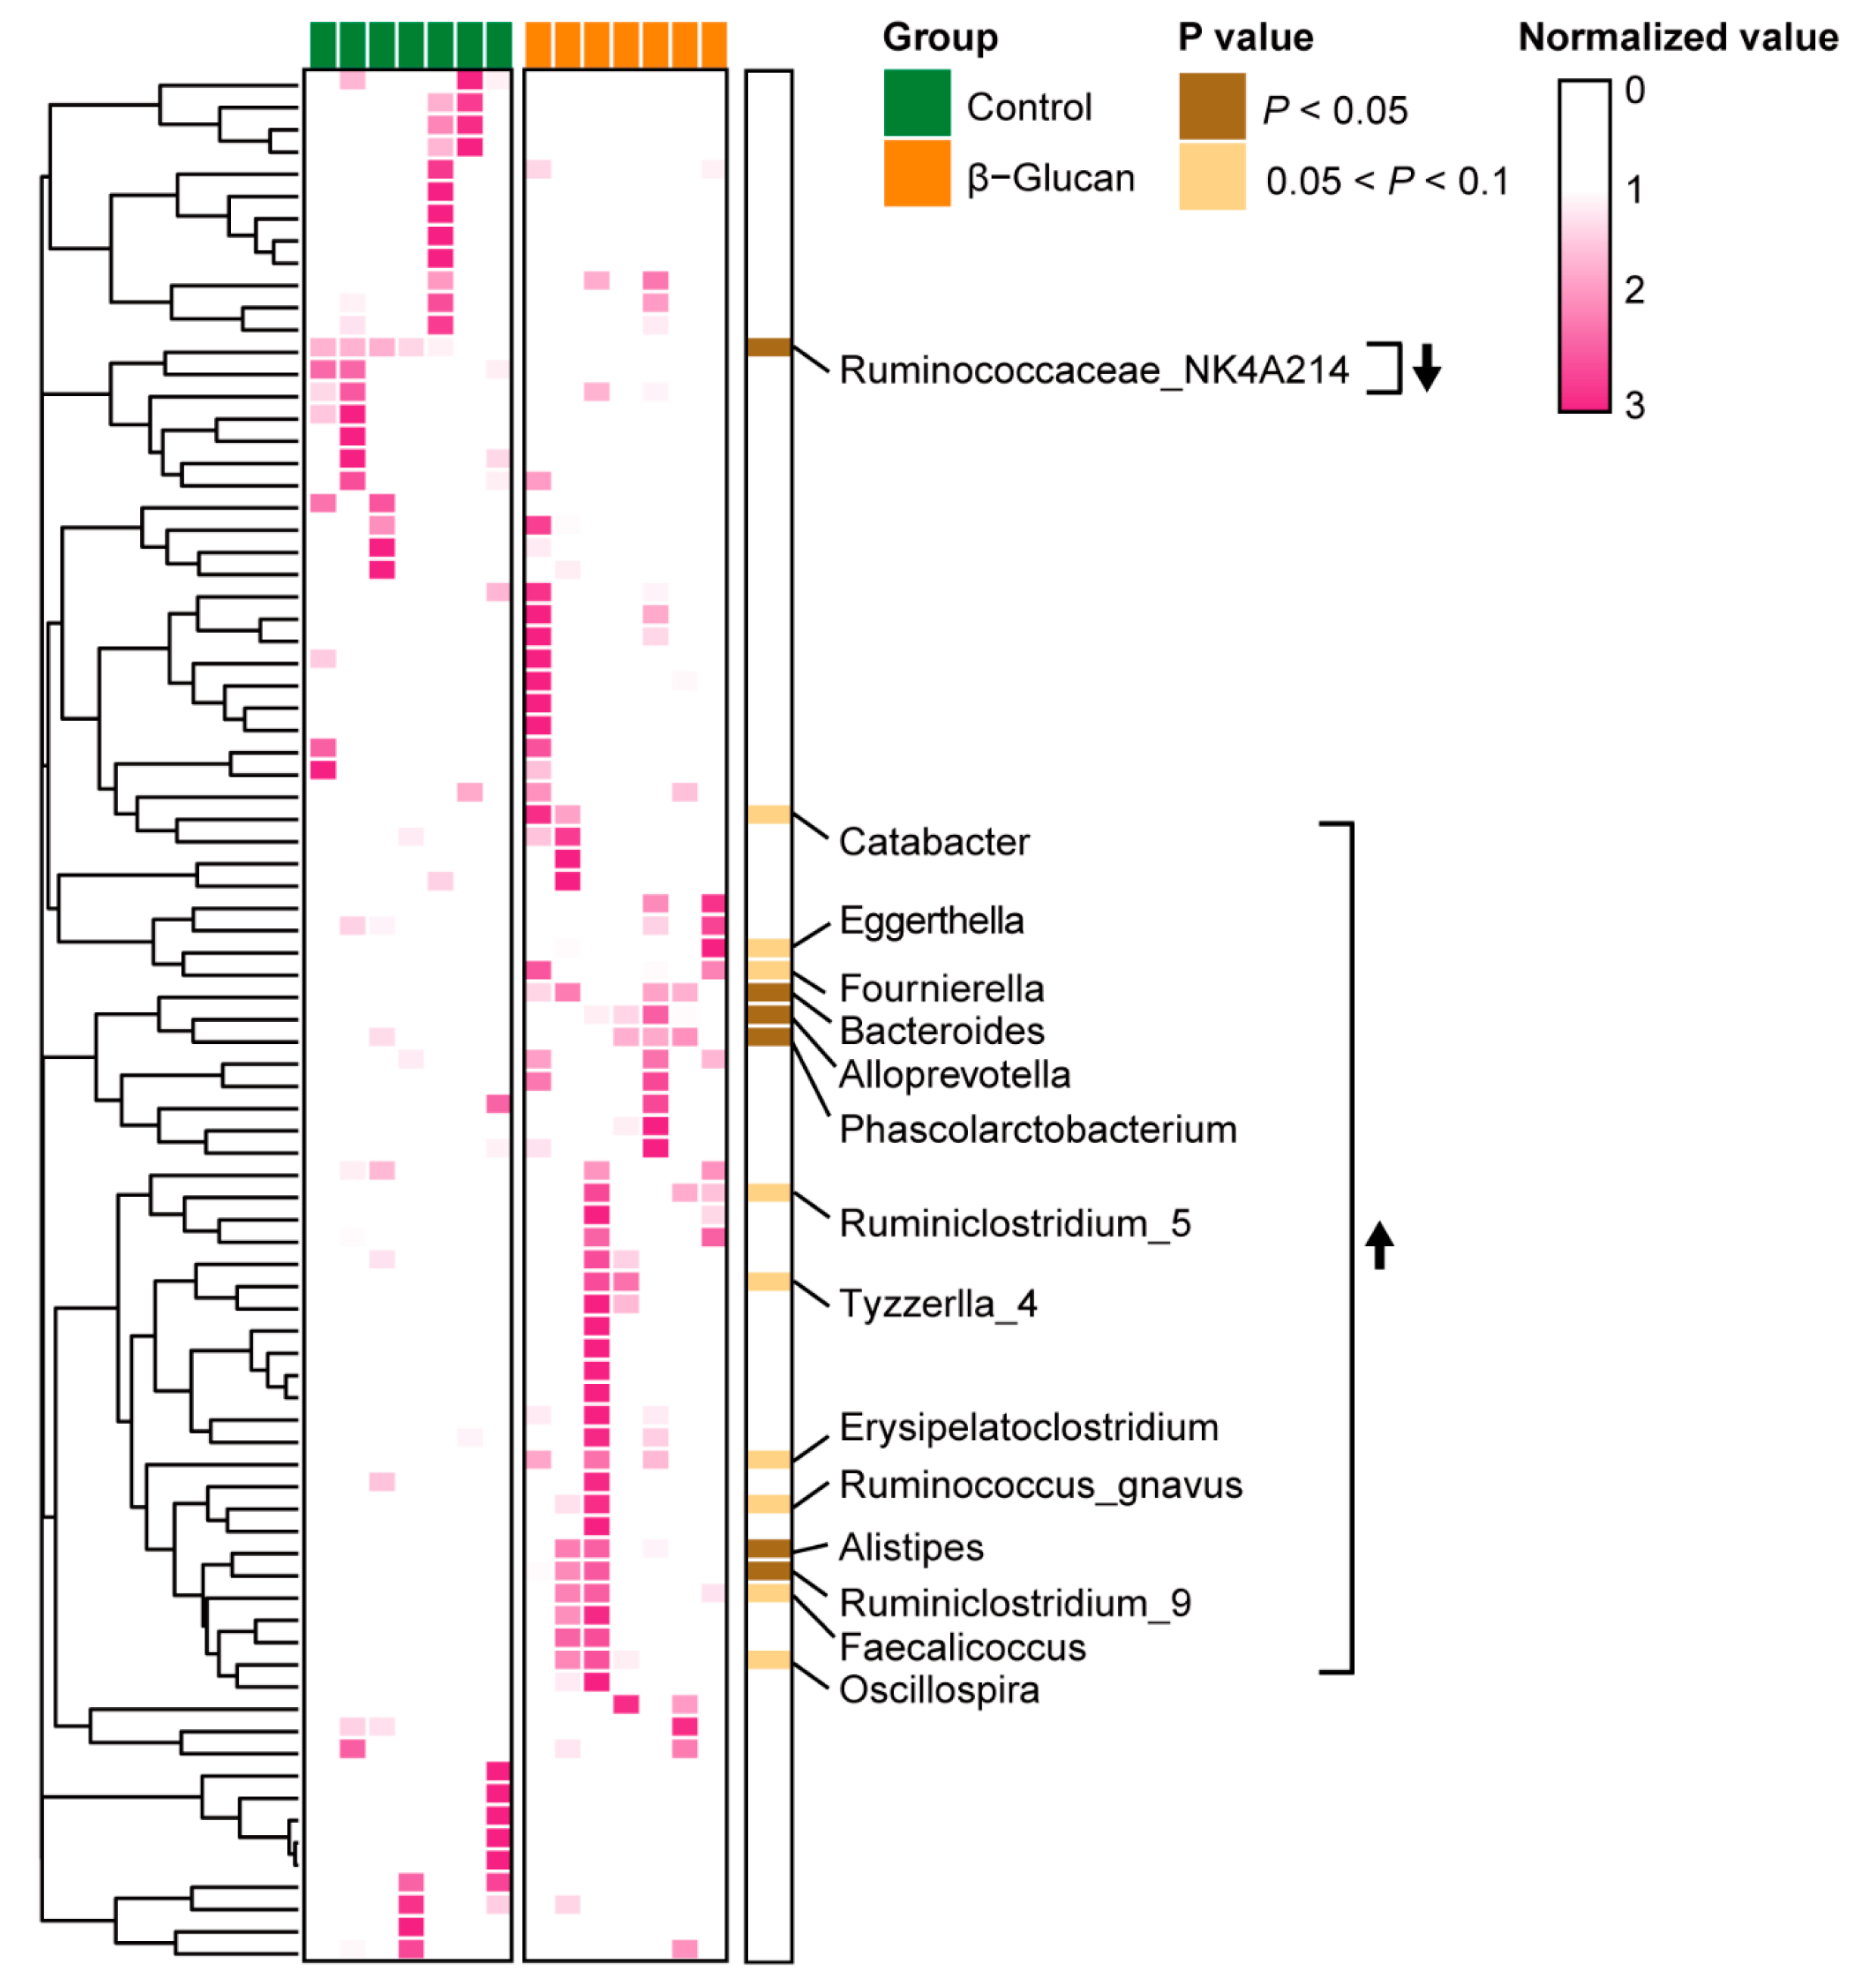
3.2. Alterations of Gut Microbiota in Dairy Calves
3.3. Alterations of Plasma Metabolites in Dairy Calves
3.4. Association of Gut Microbiota and Plasma Metabolites
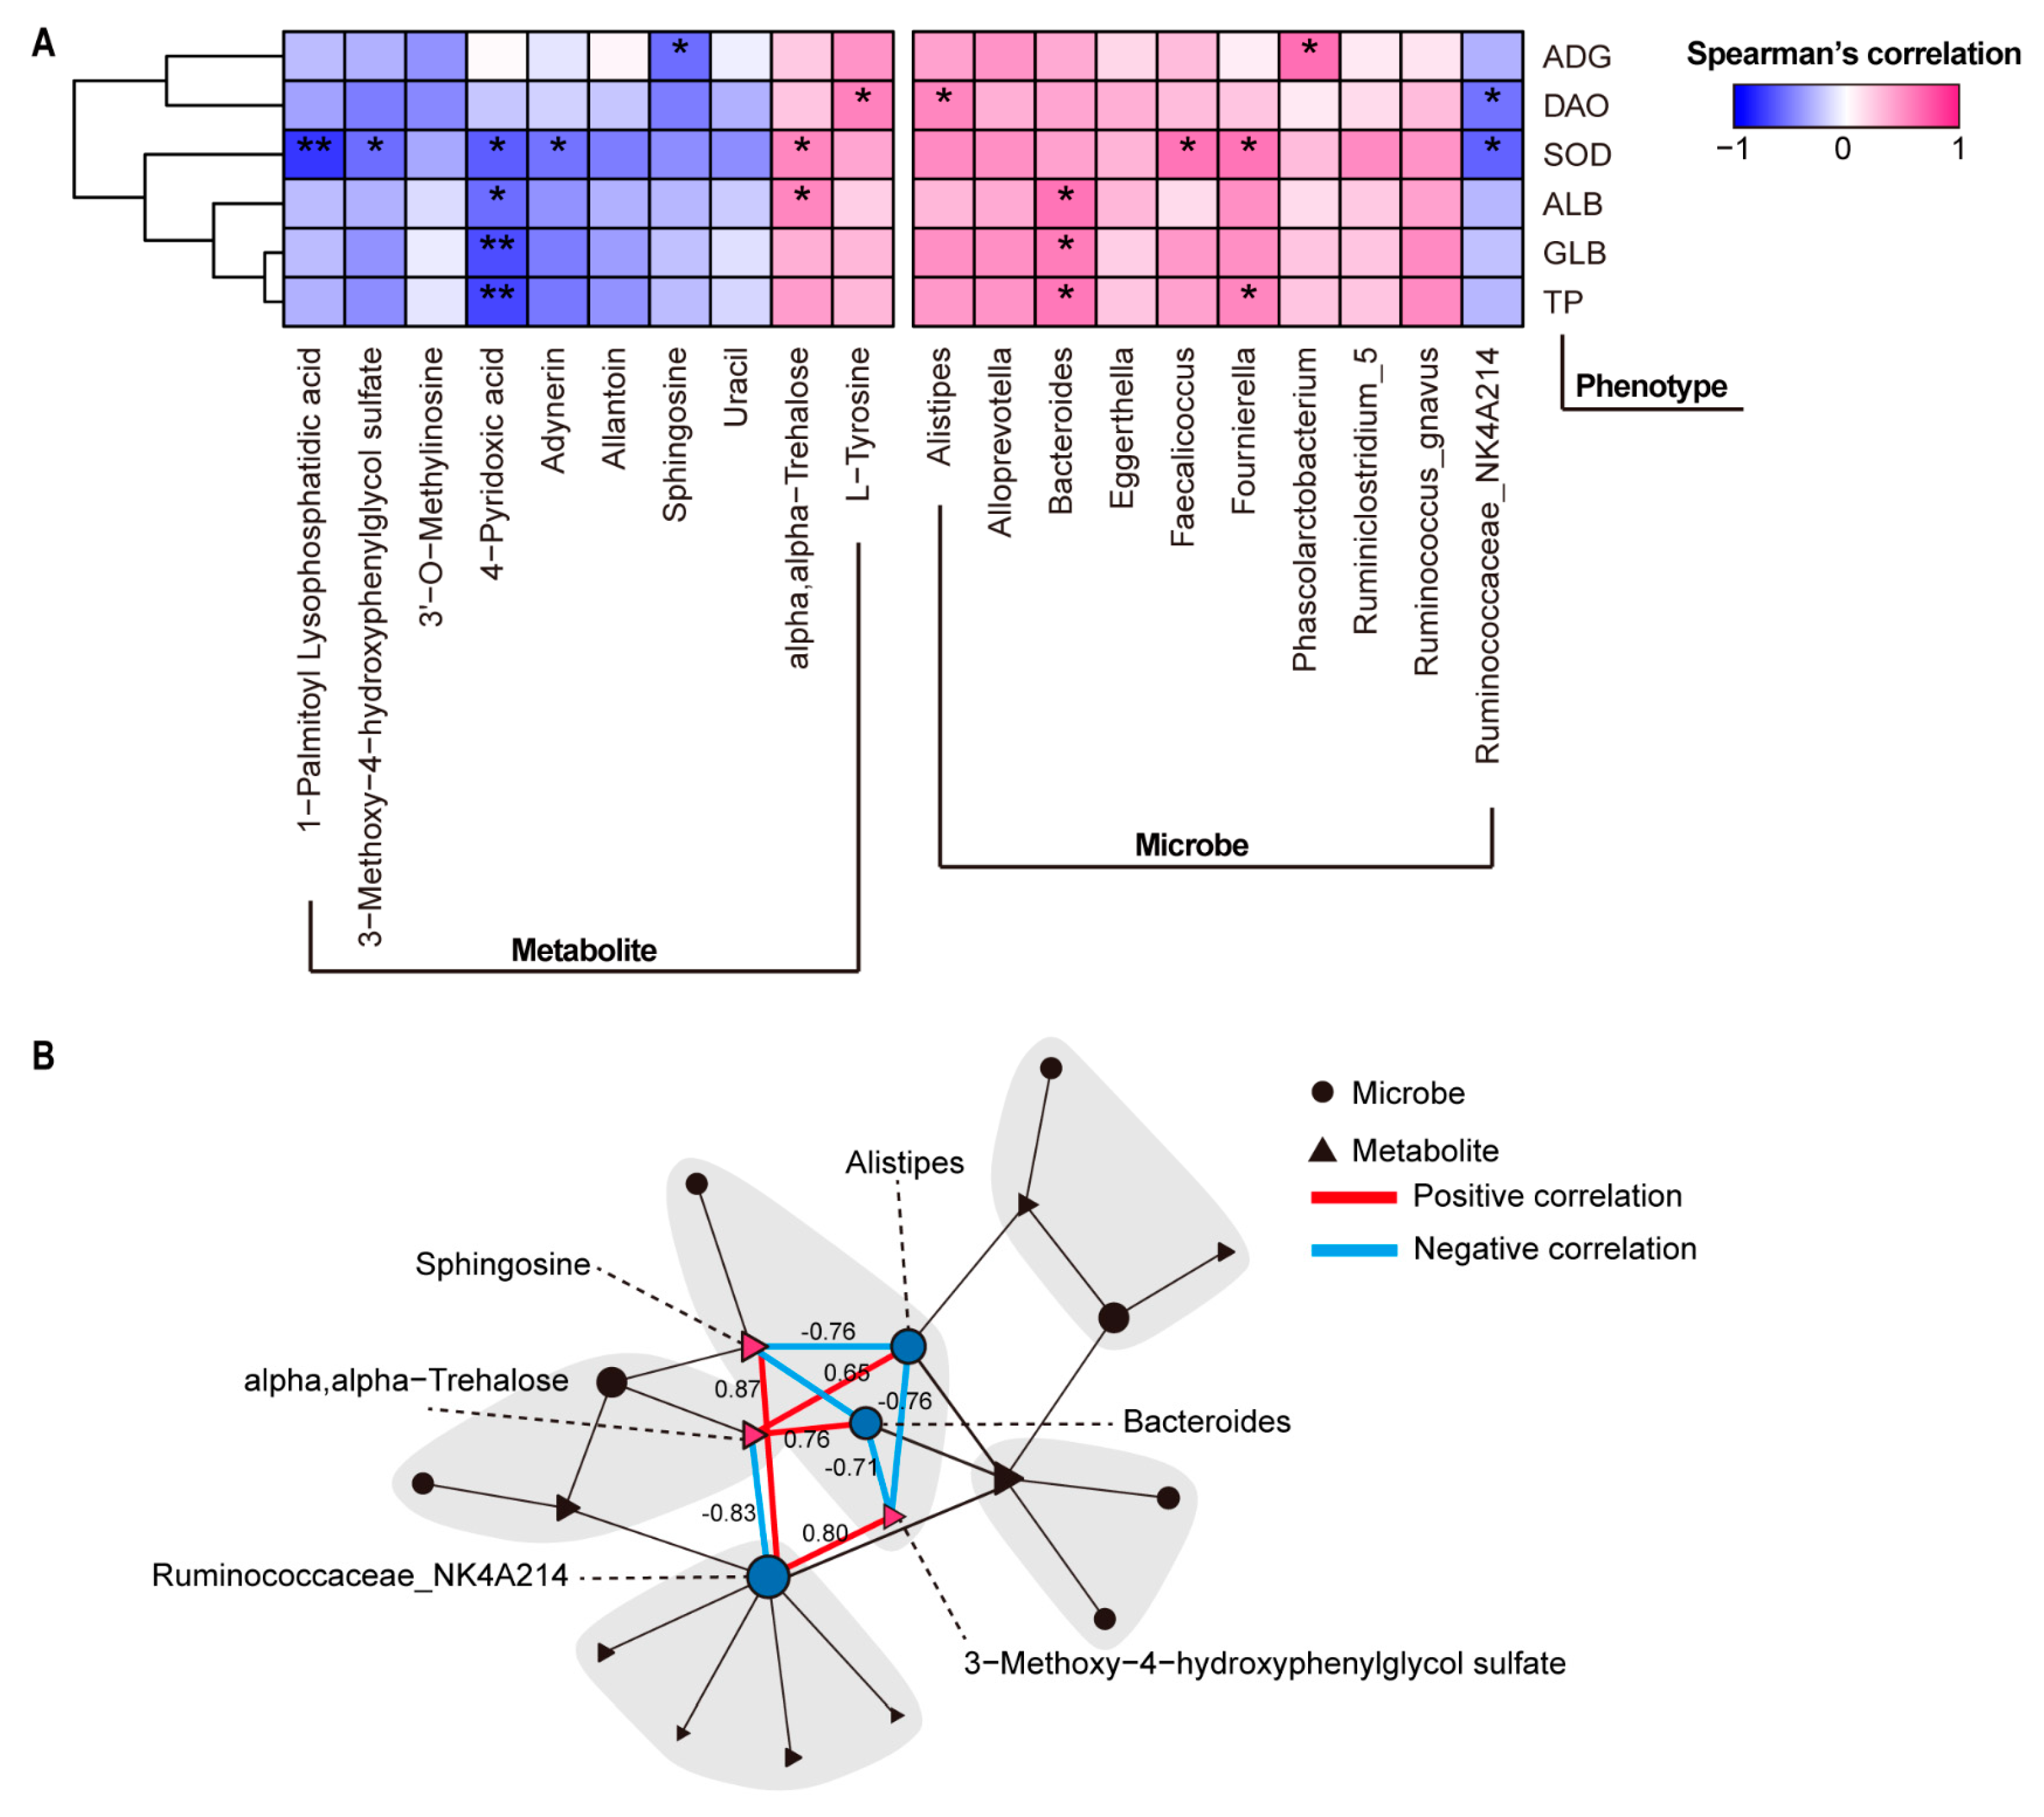
3.5. Association among Gut Microbe, Plasma Metabolite, and Clinical Phenotype
4. Discussion
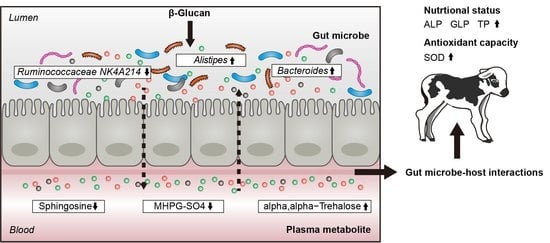
5. Conclusions
Author Contributions
Funding
Institutional Review Board Statement
Informed Consent Statement
Data Availability Statement
Acknowledgments
Conflicts of Interest
References
- Sapkota, D.; Kelly, A.K.; Crosson, P.; White, R.R.; McGee, M. Quantification of cow milk yield and pre-weaning calf growth response in temperate pasture-based beef suckler systems: A meta-analysis. Livest. Sci. 2020, 241, 104222. [Google Scholar] [CrossRef]
- Fischer, A.J.; Villot, C.; van Niekerk, J.K.; Yohe, T.T.; Renaud, D.L.; Steele, M.A. Invited Review: Nutritional regulation of gut function in dairy calves: From colostrum to weaning. Appl. Anim. Sci. 2019, 35, 498–510. [Google Scholar] [CrossRef]
- Arshad, M.A.; Hassan, F.U.; Rehman, M.S.; Huws, S.A.; Cheng, Y.; Din, A.U. Gut microbiome colonization and development in neonatal ruminants: Strategies, prospects, and opportunities. Anim. Nutr. 2021, 7, 883–895. [Google Scholar] [CrossRef] [PubMed]
- Rot, C.; Creutzinger, K.; Goetz, H.; Winder, C.; Morrison, J.; Conboy, M.; Bajus, A.; Renaud, D.L. Factors associated with body weight of young surplus dairy calves on arrival to a calf rearing facility. Prev. Vet. Med. 2022, 203, 105630. [Google Scholar] [CrossRef]
- O’Hara, E.; Neves, A.L.A.; Song, Y.; Guan, L.L. The role of the gut microbiome in cattle production and health: Driver or Passenger? Annu. Rev. Anim. Biosci. 2020, 8, 199–220. [Google Scholar] [CrossRef] [Green Version]
- Kim, H.S.; Whon, T.W.; Sung, H.; Jeong, Y.S.; Jung, E.S.; Shin, N.R.; Hyun, D.W.; Kim, P.S.; Lee, J.Y.; Lee, C.H.; et al. Longitudinal evaluation of fecal microbiota transplantation for ameliorating calf diarrhea and improving growth performance. Nat. Commun. 2021, 12, 161. [Google Scholar] [CrossRef]
- Lee, J.H.; Park, J.H. Host-microbial interactions in metabolic diseases: From diet to immunity. J. Microbiol. 2022, 60, 561–575. [Google Scholar] [CrossRef] [PubMed]
- Abuajamieh, M.; Kvidera, S.K.; Fernandez, M.V.; Nayeri, A.; Upah, N.C.; Nolan, E.A.; Lei, S.M.; DeFrain, J.M.; Green, H.B.; Schoenberg, K.M.; et al. Inflammatory biomarkers are associated with ketosis in periparturient Holstein cows. Res. Vet. Sci. 2016, 109, 81–85. [Google Scholar] [CrossRef]
- Klopp, R.N.; Yoon, I.; Eicher, S.; Boerman, J.P. Effects of feeding Saccharomyces cerevisiae fermentation products on the health of Holstein dairy calves following a lipopolysaccharide challenge. J. Dairy Sci. 2022, 105, 1469–1479. [Google Scholar] [CrossRef]
- Xiao, J.X.; Alugongo, G.M.; Chung, R.; Dong, S.Z.; Li, S.L.; Yoon, I.; Wu, Z.H.; Cao, Z.J. Effects of Saccharomyces cerevisiae fermentation products on dairy calves: Ruminal fermentation, gastrointestinal morphology, and microbial community. J. Dairy Sci. 2016, 99, 5401–5412. [Google Scholar] [CrossRef] [PubMed] [Green Version]
- O’Hara, E.; Kelly, A.; McCabe, M.S.; Kenny, D.A.; Guan, L.L.; Waters, S.M. Effect of a butyrate-fortified milk replacer on gastrointestinal microbiota and products of fermentation in artificially reared dairy calves at weaning. Sci. Rep. 2018, 8, 14901. [Google Scholar] [CrossRef] [PubMed]
- Burton, R.A.; Fincher, G.B. (1,3;1,4)-β-D-Glucans in cell walls of the poaceae, lower plants, and fungi: A Tale of Two Linkages. Mol. Plant. 2009, 2, 873–882. [Google Scholar] [CrossRef] [PubMed] [Green Version]
- El Khoury, D.; Cuda, C.; Luhovyy, B.L.; Anderson, G.H. Beta glucan: Health benefits in obesity and metabolic syndrome. J. Nutr. Metab. 2012, 2012, 851362. [Google Scholar] [CrossRef] [PubMed] [Green Version]
- Xia, W.H.; Wang, L.; Niu, X.D.; Wang, J.H.; Wang, Y.M.; Li, Q.L.; Wang, Z.Y. Supplementation with beta-1,3-glucan improves productivity, immunity and antioxidative status in transition Holstein cows. Res. Vet. Sci. 2021, 134, 120–126. [Google Scholar] [CrossRef]
- Teng, P.Y.; Adhikari, R.; Llamas-Moya, S.; Kim, W.K. Effects of combination of mannan-oligosaccharides and beta-glucan on growth performance, intestinal morphology, and immune gene expression in broiler chickens. Poult. Sci. 2021, 100, 101483. [Google Scholar] [CrossRef]
- Ma, T.; Tu, Y.; Zhang, N.F.; Guo, J.P.; Deng, K.D.; Zhou, Y.; Yun, Q.; Diao, Q.Y. Effects of dietary yeast β-glucan on nutrient digestibility and serum profiles in pre-ruminant Holstein calves. J. Integr. Agric. 2015, 14, 749–757. [Google Scholar] [CrossRef]
- Virginio Junior, G.F.; Reis, M.E.; da Silva, A.P.; de Toledo, A.F.; Cezar, A.M.; Mendes, L.W.; Greco, L.; Montenegro, H.; Coutinho, L.L.; Bittar, C.M.M. Does algae beta-glucan affect the fecal bacteriome in dairy calves? PLoS ONE 2021, 16, e0258069. [Google Scholar] [CrossRef]
- Love, W.J.; Lehenbauer, T.W.; Kass, P.H.; Van Eenennaam, A.L.; Aly, S.S. Development of a novel clinical scoring system for on-farm diagnosis of bovine respiratory disease in pre-weaned dairy calves. PeerJ 2014, 2, e238. [Google Scholar] [CrossRef] [PubMed] [Green Version]
- Mahendran, S.A.; Booth, R.; Beekhuis, L.; Manning, A.; Blackmore, T.; Vanhoudt, A.; Bell, N. Assessing the effects of weekly preweaning health scores on dairy calf mortality and productivity parameters: Cohort study. Vet. Rec. 2017, 181, 196. [Google Scholar] [CrossRef]
- Han, J.; Meng, J.; Chen, S.; Li, C. Integrative analysis of the gut microbiota and metabolome in rats treated with rice straw biochar by 16S rRNA gene sequencing and LC/MS-based metabolomics. Sci. Rep. 2019, 9, 17860. [Google Scholar] [CrossRef] [PubMed] [Green Version]
- Yong, K.; Luo, Z.Z.; Luo, Q.; Yang, Q.W.; Huang, Y.X.; Zhao, X.X.; Zhang, Y.; Cao, S.Z. Plasma metabolome alteration in dairy cows with left displaced abomasum before and after surgical correction. J. Dairy Sci. 2021, 104, 8177–8187. [Google Scholar] [CrossRef] [PubMed]
- Domingo-Almenara, X.; Siuzdak, G. Metabolomics Data Processing Using XCMS. Methods Mol. Biol. 2020, 2104, 11–24. [Google Scholar] [CrossRef] [PubMed]
- Luo, Z.Z.; Shen, L.H.; Jiang, J.; Huang, Y.X.; Bai, L.P.; Yu, S.M.; Yao, X.P.; Ren, Z.H.; Yang, Y.X.; Cao, S.Z. Plasma metabolite changes in dairy cows during parturition identified using untargeted metabolomics. J. Dairy Sci. 2019, 102, 4639–4650. [Google Scholar] [CrossRef] [PubMed] [Green Version]
- Liang, L.; Rasmussen, M.H.; Piening, B.; Shen, X.; Chen, S.; Rost, H.; Snyder, J.K.; Tibshirani, R.; Skotte, L.; Lee, N.C.; et al. Metabolic Dynamics and Prediction of Gestational Age and Time to Delivery in Pregnant Women. Cell 2020, 181, 1680–1692.e1615. [Google Scholar] [CrossRef]
- Yu, G.; Xu, C.; Zhang, D.; Ju, F.; Ni, Y. MetOrigin: Discriminating the origins of microbial metabolites for integrative analysis of the gut microbiome and metabolome. iMeta 2022, 1, e10. [Google Scholar] [CrossRef]
- Chong, J.; Liu, P.; Zhou, G.; Xia, J. Using MicrobiomeAnalyst for comprehensive statistical, functional, and meta-analysis of microbiome data. Nat. Protoc. 2020, 15, 799–821. [Google Scholar] [CrossRef]
- Sun, T.; Li, M.; Yu, X.; Liang, D.; Xie, G.; Sang, C.; Jia, W.; Chen, T. 3MCor: An integrative web server for metabolome microbiome-metadata correlation analysis. Bioinformatics 2022, 38, 1378–1384. [Google Scholar] [CrossRef]
- Gelsinger, S.L.; Heinrichs, A.J.; Jones, C.M. A meta-analysis of the effects of preweaned calf nutrition and growth on first-lactation performance. J. Dairy Sci. 2016, 99, 6206–6214. [Google Scholar] [CrossRef]
- Kertz, A.F.; Hill, T.M.; Quigley, J.D., 3rd; Heinrichs, A.J.; Linn, J.G.; Drackley, J.K. A 100-Year Review: Calf nutrition and management. J. Dairy Sci. 2017, 100, 10151–10172. [Google Scholar] [CrossRef] [PubMed]
- Forse, R.A.; Shizgal, H.M. Serum albumin and nutritional status. JPEN. J. Parenter. Enteral. Nutr. 1980, 4, 450–454. [Google Scholar] [CrossRef] [PubMed]
- Galata, C.; Busse, L.; Birgin, E.; Weiss, C.; Hardt, J.; Reissfelder, C.; Otto, M. Role of albumin as a nutritional and prognostic marker in elective intestinal surgery. Can. J. Gastroenterol. Hepatol. 2020, 2020, 7028216. [Google Scholar] [CrossRef]
- Misra, C.K.; Das, B.K.; Mukherjee, S.C.; Pattnaik, P. Effect of long term administration of dietary β-glucan on immunity, growth and survival of Labeo rohita fingerlings. Aquaculture 2006, 255, 82–94. [Google Scholar] [CrossRef]
- Nakashima, A.; Yamada, K.; Iwata, O.; Sugimoto, R.; Atsuji, K.; Ogawa, T.; Ishibashi-Ohgo, N.; Suzuki, K. β-Glucan in foods and its physiological functions. J. Nutr. Sci. Vitaminol. 2018, 64, 8–17. [Google Scholar] [CrossRef] [Green Version]
- Abo Ghanima, M.M.; Abd El-Aziz, A.H.; Noreldin, A.E.; Atta, M.S.; Mousa, S.A.; El-Far, A.H. Beta-glucan administration improves growth performance and gut health in New Zealand White and APRI rabbits with different breed responses. PLoS ONE 2020, 15, e0234076. [Google Scholar] [CrossRef]
- Saijo, S.; Fujikado, N.; Furuta, T.; Chung, S.-H.; Kotaki, H.; Seki, K.; Sudo, K.; Akira, S.; Adachi, Y.; Ohno, N.; et al. Dectin-1 is required for host defense against Pneumocystis carinii but not against Candida albicans. Nat. Immunol. 2007, 8, 39–46. [Google Scholar] [CrossRef] [PubMed]
- Yu, C.; Chen, H.; Du, D.; Lv, W.; Li, S.; Li, D.; Xu, Z.; Gao, M.; Hu, H.; Liu, D. beta-Glucan from Saccharomyces cerevisiae alleviates oxidative stress in LPS-stimulated RAW264.7 cells via Dectin-1/Nrf2/HO-1 signaling pathway. Cell Stress Chaperones 2021, 26, 629–637. [Google Scholar] [CrossRef]
- Steele, M.A.; Penner, G.B.; Chaucheyras-Durand, F.; Guan, L.L. Development and physiology of the rumen and the lower gut: Targets for improving gut health. J. Dairy Sci. 2016, 99, 4955–4966. [Google Scholar] [CrossRef] [Green Version]
- Zhang, J.B.; Yuan, C.; Hua, G.; Tong, R.Y.; Luo, X.F.; Ying, Z. Early gut barrier dysfunction in patients with severe acute pancreatitis: Attenuated by continuous blood purification treatment. Int. J. Artif. Organs 2010, 33, 706–715. [Google Scholar] [CrossRef] [PubMed]
- Fukuda, T.; Tsukano, K.; Nakatsuji, H.; Suzuki, K. Plasma diamine oxidase activity decline with diarrhea severity in calves indicating systemic dysfunction related to intestinal mucosal damage. Res. Vet. Sci. 2019, 126, 127–130. [Google Scholar] [CrossRef] [PubMed]
- Tsukano, K.; Fukuda, T.; Otsuka, M.; Nishi, Y.; Inoue, H.; Sarashina, S.; Suzuki, K. Advantage of parenteral nutrition for diarrheic calves. J. Vet. Med. Sci. 2018, 80, 1808–1812. [Google Scholar] [CrossRef]
- Valdes, A.M.; Walter, J.; Segal, E.; Spector, T.D.J.B. Role of the gut microbiota in nutrition and health. BMJ 2018, 361, K2179. [Google Scholar] [CrossRef] [PubMed] [Green Version]
- Bai, J.Y.; Zhao, J.J.; Al-Ansi, W.; Wang, J.; Xue, L.M.; Liu, J.X.; Wang, Y.; Fan, M.C.; Qian, H.F.; Li, Y.; et al. Oat β-glucan alleviates DSS-induced colitis via regulating gut microbiota metabolism in mice. Food Funct. 2021, 12, 8976–8993. [Google Scholar] [CrossRef] [PubMed]
- Portincasa, P.; Bonfrate, L.; Vacca, M.; De Angelis, M.; Farella, I.; Lanza, E.; Khalil, M.; Wang, D.Q.; Sperandio, M.; Di Ciaula, A. Gut Microbiota and Short Chain Fatty Acids: Implications in Glucose Homeostasis. Int. J. Mol. Sci. 2022, 23, 1105. [Google Scholar] [CrossRef] [PubMed]
- Liang, J.; Kou, S.; Chen, C.; Raza, S.H.A.; Wang, S.; Ma, X.; Zhang, W.J.; Nie, C. Effects of clostridium butyricum on growth performance, metabonomics and intestinal microbial differences of weaned piglets. BMC Microbiol. 2021, 21, 85. [Google Scholar] [CrossRef] [PubMed]
- Chen, X.; Su, X.; Li, J.; Yang, Y.; Wang, P.; Yan, F.; Yao, J.; Wu, S. Real-time monitoring of ruminal microbiota reveals their roles in dairy goats during subacute ruminal acidosis. NPJ Biofilms Microbiomes 2021, 7, 45. [Google Scholar] [CrossRef]
- Wu, Y.; Li, X.; Liu, H.; Du, Y.; Zhou, J.; Zou, L.; Xiong, X.; Huang, H.; Tan, Z.; Yin, Y. A water-soluble beta-glucan improves growth performance by altering gut microbiome and health in weaned pigs. Anim. Nutr. 2021, 7, 1345–1351. [Google Scholar] [CrossRef]
- Visconti, A.; Le Roy, C.I.; Rosa, F.; Rossi, N.; Martin, T.C.; Mohney, R.P.; Li, W.; de Rinaldis, E.; Bell, J.T.; Venter, J.C.; et al. Interplay between the human gut microbiome and host metabolism. Nat. Commun. 2019, 10, 4505. [Google Scholar] [CrossRef] [PubMed] [Green Version]
- Joyce, S.A.; Kamil, A.; Fleige, L.; Gahan, C.G.M. The cholesterol-lowering effect of oats and oat beta glucan: Modes of action and potential role of bile acids and the microbiome. Front. Nutr. 2019, 6, 171. [Google Scholar] [CrossRef]
- Lia, A.; Hallmans, G.; Sandberg, A.S.; Sundberg, B.; Aman, P.; Andersson, H. Oat beta-glucan increases bile acid excretion and a fiber-rich barley fraction increases cholesterol excretion in ileostomy subjects. Am. J. Clin. Nutr. 1995, 62, 1245–1251. [Google Scholar] [CrossRef]
- Li, C.C.; Gan, L.; Tan, Y.; Yan, M.Z.; Liu, X.M.; Chang, Q.; Pan, R.L. Chronic restraint stress induced changes in colonic homeostasis-related indexes and tryptophan-kynurenine metabolism in rats. J. Proteom. 2021, 240, 104190. [Google Scholar] [CrossRef] [PubMed]
- Badawy, A.A. Kynurenine pathway of tryptophan metabolism: Regulatory and functional aspects. Int. J. Tryptophan Res. 2017, 10, 1–20. [Google Scholar] [CrossRef] [PubMed] [Green Version]
- Yabut, J.M.; Crane, J.D.; Green, A.E.; Keating, D.J.; Khan, W.I.; Steinberg, G.R. Emerging roles for serotonin in regulating metabolism: New implications for an ancient molecule. Endocr. Rev. 2019, 40, 1092–1107. [Google Scholar] [CrossRef] [PubMed]
- Sturza, A.; Olariu, S.; Ionica, M.; Duicu, O.M.; Vaduva, A.O.; Boia, E.; Muntean, D.M.; Popoiu, C.M. Monoamine oxidase is a source of oxidative stress in obese patients with chronic inflammation. Can. J. Physiol. Pharmacol. 2019, 97, 844–849. [Google Scholar] [CrossRef] [PubMed] [Green Version]
- Van der Leek, A.P.; Yanishevsky, Y.; Kozyrskyj, A.L. The kynurenine pathway as a novel link between allergy and the gut microbiome. Front. Immunol. 2017, 8, 1374. [Google Scholar] [CrossRef] [Green Version]
- Mizunoe, Y.; Kobayashi, M.; Sudo, Y.; Watanabe, S.; Yasukawa, H.; Natori, D.; Hoshino, A.; Negishi, A.; Okita, N.; Komatsu, M.; et al. Trehalose protects against oxidative stress by regulating the Keap1-Nrf2 and autophagy pathways. Redox Biol. 2018, 15, 115–124. [Google Scholar] [CrossRef]
- Bowers, M.B., Jr.; Mazure, C.M.; Greenfeld, D.G. Elevated plasma monoamine metabolites in eating disorders. Psychiatry Res. 1994, 52, 11–15. [Google Scholar] [CrossRef]
- Couttas, T.A.; Kain, N.; Daniels, B.; Lim, X.Y.; Shepherd, C.; Kril, J.; Pickford, R.; Li, H.; Garner, B.; Don, A.S. Loss of the neuroprotective factor Sphingosine 1-phosphate early in Alzheimer’s disease pathogenesis. Acta Neuropathol. Commun. 2014, 2, 9. [Google Scholar] [CrossRef] [Green Version]
- Wang, X.; Wang, Y.; Xu, J.; Xue, C. Sphingolipids in food and their critical roles in human health. Crit. Rev. Food Sci. Nutr. 2021, 61, 462–491. [Google Scholar] [CrossRef]


Publisher’s Note: MDPI stays neutral with regard to jurisdictional claims in published maps and institutional affiliations. |
© 2022 by the authors. Licensee MDPI, Basel, Switzerland. This article is an open access article distributed under the terms and conditions of the Creative Commons Attribution (CC BY) license (https://creativecommons.org/licenses/by/4.0/).
Share and Cite
Luo, Z.; Ma, L.; Zhou, T.; Huang, Y.; Zhang, L.; Du, Z.; Yong, K.; Yao, X.; Shen, L.; Yu, S.; et al. Beta-Glucan Alters Gut Microbiota and Plasma Metabolites in Pre-Weaning Dairy Calves. Metabolites 2022, 12, 687. https://doi.org/10.3390/metabo12080687
Luo Z, Ma L, Zhou T, Huang Y, Zhang L, Du Z, Yong K, Yao X, Shen L, Yu S, et al. Beta-Glucan Alters Gut Microbiota and Plasma Metabolites in Pre-Weaning Dairy Calves. Metabolites. 2022; 12(8):687. https://doi.org/10.3390/metabo12080687
Chicago/Turabian StyleLuo, Zhengzhong, Li Ma, Tao Zhou, Yixin Huang, Liben Zhang, Zhenlong Du, Kang Yong, Xueping Yao, Liuhong Shen, Shumin Yu, and et al. 2022. "Beta-Glucan Alters Gut Microbiota and Plasma Metabolites in Pre-Weaning Dairy Calves" Metabolites 12, no. 8: 687. https://doi.org/10.3390/metabo12080687
APA StyleLuo, Z., Ma, L., Zhou, T., Huang, Y., Zhang, L., Du, Z., Yong, K., Yao, X., Shen, L., Yu, S., Shi, X., & Cao, S. (2022). Beta-Glucan Alters Gut Microbiota and Plasma Metabolites in Pre-Weaning Dairy Calves. Metabolites, 12(8), 687. https://doi.org/10.3390/metabo12080687