
The Importance of HDL-Cholesterol and Fat-Free Percentage as Protective Markers in Risk Factor Hierarchy for Patients with Metabolic Syndrome

 ,
,  and
and
Abstract
:1. Introduction
2. Materials and Methods
2.1. Study Population
2.2. Data Collection
2.2.1. Clinical and Anthropometric Measurements
2.2.2. Biochemical Measurements
2.2.3. Body Composition Measurements
2.3. Prioritizing Parameters in the Prevalence of Metabolic Syndrome
2.4. Statistical Analysis
3. Results
3.1. Baseline Characteristics of the Study Population
3.2. Sensitivity Score
4. Discussion
5. Conclusions
Supplementary Materials
Author Contributions
Funding
Institutional Review Board Statement
Informed Consent Statement
Data Availability Statement
Conflicts of Interest
References
- World Health Organization (WHO). Obesity and Overweight. 2022. Available online: https://www.who.int/news-room/fact-sheets/detail/obesity-and-overweight (accessed on 4 October 2022).
- Fahed, G.; Aoun, L.; Bou Zerdan, M.; Allam, S.; Bou Zerdan, M.; Bouferraa, Y.; Assi, H.I. Metabolic Syndrome: Updates on Pathophysiology and Management in 2021. Int. J. Mol. Sci. 2022, 23, 786. [Google Scholar] [CrossRef] [PubMed]
- Trayhurn, P.; Wood, I.S. Adipokines: Inflammation and the pleiotropic role of white adipose tissue. Br. J. Nutr. 2004, 92, 347–355. [Google Scholar] [CrossRef] [Green Version]
- Shah, R.V.; Murthy, V.L.; Abbasi, S.A.; Blankstein, R.; Kwong, R.Y.; Goldfine, A.B.; Jerosch-Herold, M.; Lima, J.A.; Ding, J.; Allison, M.A. Visceral adiposity and the risk of metabolic syndrome across body mass index: The MESA Study. JACC Cardiovasc. Imaging. 2014, 7, 1221–1235. [Google Scholar] [CrossRef] [PubMed] [Green Version]
- Després, J.-P.; Lemieux, I.; Bergeron, J.; Pibarot, P.; Mathieu, P.; Larose, E.; Rodés-Cabau, J.; Bertrand, O.F.; Poirier, P. Abdominal obesity and the metabolic syndrome: Contribution to global cardiometabolic risk. Arterioscler. Thromb. Vasc. Biol. 2008, 28, 1039–1049. [Google Scholar] [CrossRef] [PubMed]
- Grundy, S.M.; Cleeman, J.I.; Daniels, S.R.; Donato, K.A.; Eckel, R.H.; Franklin, B.A.; Gordon, D.J.; Krauss, R.M.; Savage, P.J.; Smith, S.C., Jr.; et al. American Heart Association; National Heart, Lung, and Blood Institute. Diagnosis and management of the metabolic syndrome: An American Heart Association/National Heart, Lung, and Blood Institute Scientific Statement. Circulation 2005, 112, 2735–2752. [Google Scholar] [CrossRef] [PubMed] [Green Version]
- Kim, S.H.; Jeong, J.B.; Kang, J.; Ahn, D.W.; Kim, J.W.; Kim, B.G.; Lee, K.L.; Oh, S.; Yoon, S.H.; Park, S.J.; et al. Association between sarcopenia level and metabolic syndrome. PLoS ONE. 2021, 16, e0248856. [Google Scholar] [CrossRef]
- Kim, G.; Lee, S.E.; Jun, J.E.; Lee, Y.B.; Ahn, J.; Bae, J.C.; Jin, S.M.; Hur, K.Y.; Jee, J.H.; Lee, M.K.; et al. Increase in relative skeletal muscle mass over time and its inverse association with metabolic syndrome development: A 7-year retrospective cohort study. Cardiovasc Diabetol. 2018, 17, 23. [Google Scholar] [CrossRef] [PubMed] [Green Version]
- Park, S.H.; Park, J.H.; Park, H.Y.; Jang, H.J.; Kim, H.K.; Park, J.; Shin, K.J.; Lee, J.G.; Moon, Y.S. Additional role of sarcopenia to waist circumference in predicting the odds of metabolic syndrome. Clin Nutr. 2014, 33, 668–672. [Google Scholar] [CrossRef]
- Nishikawa, H.; Asai, A.; Fukunishi, S.; Nishiguchi, S.; Higuchi, K. Metabolic Syndrome and Sarcopenia. Nutrients 2021, 13, 3519. [Google Scholar] [CrossRef]
- Bays, H. Central obesity as a clinical marker of adiposopathy; increased visceral adiposity as a surrogate marker for global fat dysfunction. Curr. Opin. Endocrinol. Diabetes Obes. 2014, 21, 345–351. [Google Scholar] [CrossRef]
- Harrison, G.G.; Buskirk, E.R.; Carter, J.E.; Johnston, F.E.; Lohman, T.G.; Pollock, M.L.; Roche, A.F.; Wilmore, J. Skinfold thicknesses and measurement technique. In Anthropometric Standardization Reference Manual; Lohman, T.G., Roche, A.F., Martorell, R., Eds.; Human Kinetics: Champaign, IL, USA, 1988; pp. 55–70. [Google Scholar]
- Callaway, C.W.; Chumlea, W.C.; Bouchard, C.; Himes, J.H.; Lohman, T.G.; Martin, A.D.; Mitchell, C.D.; Mueller, W.H.; Roche, A.F.; Seefeldt, V.D. Circumferences. In Anthropometric Standardization Reference Manual; Lohman, T.G., Roche, A.F., Martorell, R., Eds.; Human Kinetics: Champaign, IL, USA, 1988; pp. 39–54. [Google Scholar]
- Matthews, D.R.; Hosker, J.P.; Rudenski, A.S.; Naylor, B.A.; Treacher, D.F.; Turner, R.C. Homeostasis model assessment: Insulin resistance and beta-cell function from fasting plasma glucose and insulin concentrations in man. Diabetologia 1985, 28, 412–419. [Google Scholar] [CrossRef] [PubMed] [Green Version]
- Scafoglieri, A.; Clarys, J.P. Dual energy X-ray absorptiometry: Gold standard for muscle mass? J. Cachexia Sarcopenia Muscle 2018, 9, 786–787. [Google Scholar] [CrossRef] [PubMed]
- Criminisi, A.; Sorek, N.; Heymsfield, S.B. Normalized sensitivity of multi-dimensional body composition biomarkers for risk change prediction. Sci. Rep. 2022, 12, 12375. [Google Scholar] [CrossRef] [PubMed]
- Fox, C.S.; Massaro, J.M.; Hoffmann, U.; Pou, K.M.; Maurovich-Horvat, P.; Liu, C.Y.; Vasan, R.S.; Murabito, J.M.; Meigs, J.B.; Cupples, L.A.; et al. Abdominal visceral and subcutaneous adipose tissue compartments: Association with metabolic risk factors in the Framingham Heart Study. Circulation 2007, 116, 39–48. [Google Scholar] [CrossRef] [Green Version]
- Wajchenberg, B.L. Subcutaneous and visceral adipose tissue: Their relation to the metabolic syndrome. Endocr. Rev. 2000, 21, 697738. [Google Scholar] [CrossRef]
- Yang, H.; Xin, Z.; Feng, J.P.; Yang, J.K. Waist-to-height ratio is better than body mass index and waist circumference as a screening criterion for metabolic syndrome in Han Chinese adults. Medicine. Medicine 2017, 96, e8192. [Google Scholar] [CrossRef]
- Cao, Q.; Yu, S.; Xiong, W.; Li, Y.; Li, H.; Li, J.; Li, F. Waist-hip ratio as a predictor of myocardial infarction risk: A systematic review and meta-analysis. Medicine 2018, 97, e11639. [Google Scholar] [CrossRef]
- Mani, P.; Ren, H.Y.; Neeland, I.J.; McGuire, D.K.; Ayers, C.R.; Khera, A.; Rohatgi, A. The association between HDL particle concentration and incident metabolic syndrome in the multi-ethnic Dallas Heart Study. Diabetes Metab. Syndr. 2017, 11 (Suppl S1), S175–S179. [Google Scholar] [CrossRef]
- Qiao, Q. Comparison of different definitions of the metabolic syndrome in relation to cardiovascular mortality in European men and women. Diabetologia 2006, 49, 2837–2846. [Google Scholar] [CrossRef]
- Denimal, D.; Monier, S.; Brindisi, M.C.; Petit, J.M.; Bouillet, B.; Nguyen, A.; Demizieux, L.; Simoneau, I.; Pais de Barros, J.P.; Vergès, B.; et al. Impairment of the Ability of HDL From Patients With Metabolic Syndrome but Without Diabetes Mellitus to Activate eNOS: Correction by S1P Enrichment. Arterioscler. Thromb. Vasc. Biol. 2017, 37, 804–811. [Google Scholar] [CrossRef]
- Annema, W.; Dikkers, A.; de Boer, J.F.; van Greevenbroek, M.; van der Kallen, C.; Schalkwijk, C.G.; Stehouwer, C.; Dullaart, R.; Tietge, U. Impaired HDL cholesterol efflux in metabolic syndrome is unrelated to glucose tolerance status: The CODAM study. Sci. Rep. 2016, 6, 27367. [Google Scholar] [CrossRef] [PubMed] [Green Version]
- Akinmolayemi, O.; Saldanha, S.; Joshi, P.H.; Deodhar, S.; Ayers, C.R.; Neeland, I.J.; Rohatgi, A. Cholesterol efflux capacity and its association with prevalent metabolic syndrome in a multi-ethnic population (Dallas Heart Study). PLoS ONE. 2021, 16, e0257574. [Google Scholar] [CrossRef] [PubMed]
- Thakkar, H.; Vincent, V.; Shukla, S.; Sra, M.; Kanga, U.; Aggarwal, S.; Singh, A. Improvements in cholesterol efflux capacity of HDL and adiponectin contribute to mitigation in cardiovascular disease risk after bariatric surgery in a cohort with morbid obesity. Diabetol. Metab. Syndr. 2021, 13, 46. [Google Scholar] [CrossRef] [PubMed]
- Yuan, H.; Yu, C.; Li, X.; Sun, L.; Zhu, X.; Zhao, C.; Zhang, Z.; Yang, Z. Serum uric acid levels and risk of metabolic syndrome: A dose-response meta-analysis of prospective studies. J. Clin. Endocrinol. Metab. 2015, 100, 4198–4207. [Google Scholar] [CrossRef] [PubMed] [Green Version]
- King, C.; Lanaspa, M.A.; Jensen, T.; Tolan, D.R.; Sánchez-Lozada, L.G.; Johnson, R.J. Uric Acid as a Cause of the Metabolic Syndrome. Contrib Nephrol. 2018, 192, 88–102. [Google Scholar] [CrossRef]
- Srikanthan, K.; Feyh, A.; Visweshwar, H.; Shapiro, J.I.; Sodhi, K. Systematic review of metabolic syndrome biomarkers: A Panel for early detection, management, and risk stratification in the west virginian population. Int. J. Med. Sci. 2016, 13, 25–38. [Google Scholar] [CrossRef] [Green Version]
- Sharma, V.R.; Matta, S.T.; Haymond, M.W.; Chung, S.T. Measuring Insulin Resistance in Humans. Horm Res Paediatr. 2020, 93, 577–588. [Google Scholar] [CrossRef]
- Matsuura, F.; Oku, H.; Koseki, M.; Sandoval, J.C.; Yuasa-Kawase, M.; Tsubakio-Yamamoto, K.; Masuda, D.; Maeda, N.; Tsujii, K.; Ishigami, M.; et al. Adiponectin accelerates reverse cholesterol transport by increasing high density lipoprotein assembly in the liver. Biochem. Biophys Res. Commun. 2007, 358, 1091–1095. [Google Scholar] [CrossRef]
- Mitu, I.; Dimitriu, C.D.; Preda, C.; Mitu, O.; Costache, I.I.; Ciocoiu, M. Adipokine profile and metabolic syndrome in patients with similar adipose tissue mass and distribution. Med. Surg. J. 2022, 126, 214–223. [Google Scholar] [CrossRef]
- Frühbeck, G.; Catalán, V.; Rodríguez, A.; Ramírez, B.; Becerril, S.; Salvador, J.; Colina, I.; Gómez-Ambrosi, J. Adiponectin-leptin Ratio is a Functional Biomarker of Adipose Tissue Inflammation. Nutrients 2019, 11, 454. [Google Scholar] [CrossRef]

| All Subjects (n = 104) | Patients without MetS (n = 35) | Patients with MetS (n = 69) | p * | |
|---|---|---|---|---|
| Mean (Lower Bound-Upper Bound) ± SD OR Median (IQR) | Mean (Lower Bound-Upper Bound) ± SD OR Median (IQR) | Mean (Lower Bound-Upper Bound) ± SD OR Median (IQR) | ||
| Demographic and anthropometric parameters | ||||
| Age | 62 (12) | 58.29 (55.7–60.88) ± 7.54 | 63 (13) | |
| Gender ** | ||||
| Female | 74.04% (77) | 82.86% (29) | 69.56% (48) | |
| Male | 25.96% (27) | 17.14% (6) | 30.44% (21) | 0.16 |
| BMI (kg/m2) | 30.99 (5.83) | 30.61 (28.87–32.36) ± 5.08 | 31.01 (6.10) | |
| WC (cm) | 106 (16) | 100 (49) | 110 (18) | |
| HC (cm) | 113 (12.8) | 111.86 (108.65–115.06) ± 9.33 | 115 (13) | |
| WHtR | 0.64 (0.10) | 0.62 (0.60–0.65) ± 0.07 | 0.65 (0.08) | |
| WHR | 0.94 (0.93–0.95) ± 0.06 | 0.92 (0.90–0.94) ± 0.06 | 0.96 (0.94–0.97) ± 0.06 | 0.003 |
| Abdominal skinfold (mm) | 36.22 (34.63–37.81) ± 8.17 | 35.66 (32.6–38.71) ± 8.90 | 36.51 (34.63–38.39) ± 7.82 | 0.62 |
| Tricipital skinfold (mm) | 27.06 (25.61–28.50) ± 7.43 | 27 (24.41–29.59) ± 56.65 | 27.09 (25.30–28.88) ± 7.44 | 0.95 |
| Body composition parameters assessed by DEXA | ||||
| Total Fat (kg) | 34.16 (9.22) | 33.56 (30.34–36.78) ± 9.37 | 34.03 (9.26) | |
| Total fat-free (kg) | 49.07 (15.07) | 47.79 (9.52) | 51.44 (20.40) | |
| Trunk fat (kg) | 17.32 (5.76) | 16.25 (14.23–18.27) ± 5.88 | 18.40 (6.14) | |
| Trunk fat-free (kg) | 24.96 (8.65) | 23.78 (3.99) | 27.17 (25.75–28.60) ± 5.93 | |
| Trunk total (kg) | 42.40 (13.73) | 39.13 (10.28) | 45.50 (13.76) | |
| Total fat (%) | 41.40 (8) | 42.30 (8.30) | 40.07 (38.55–41.59) ± 6.32 | |
| Total fat-free (%) | 58.90 (7.95) | 57.70 (8.30) | 60.12 (58.59–61.64) ± 6.34 | |
| Trunk fat (%) | 40.30 (39.05–41.55) ± 6.42 | 41.30 (9.90) | 40.82 (39.34–42.29) ± 6.13 | |
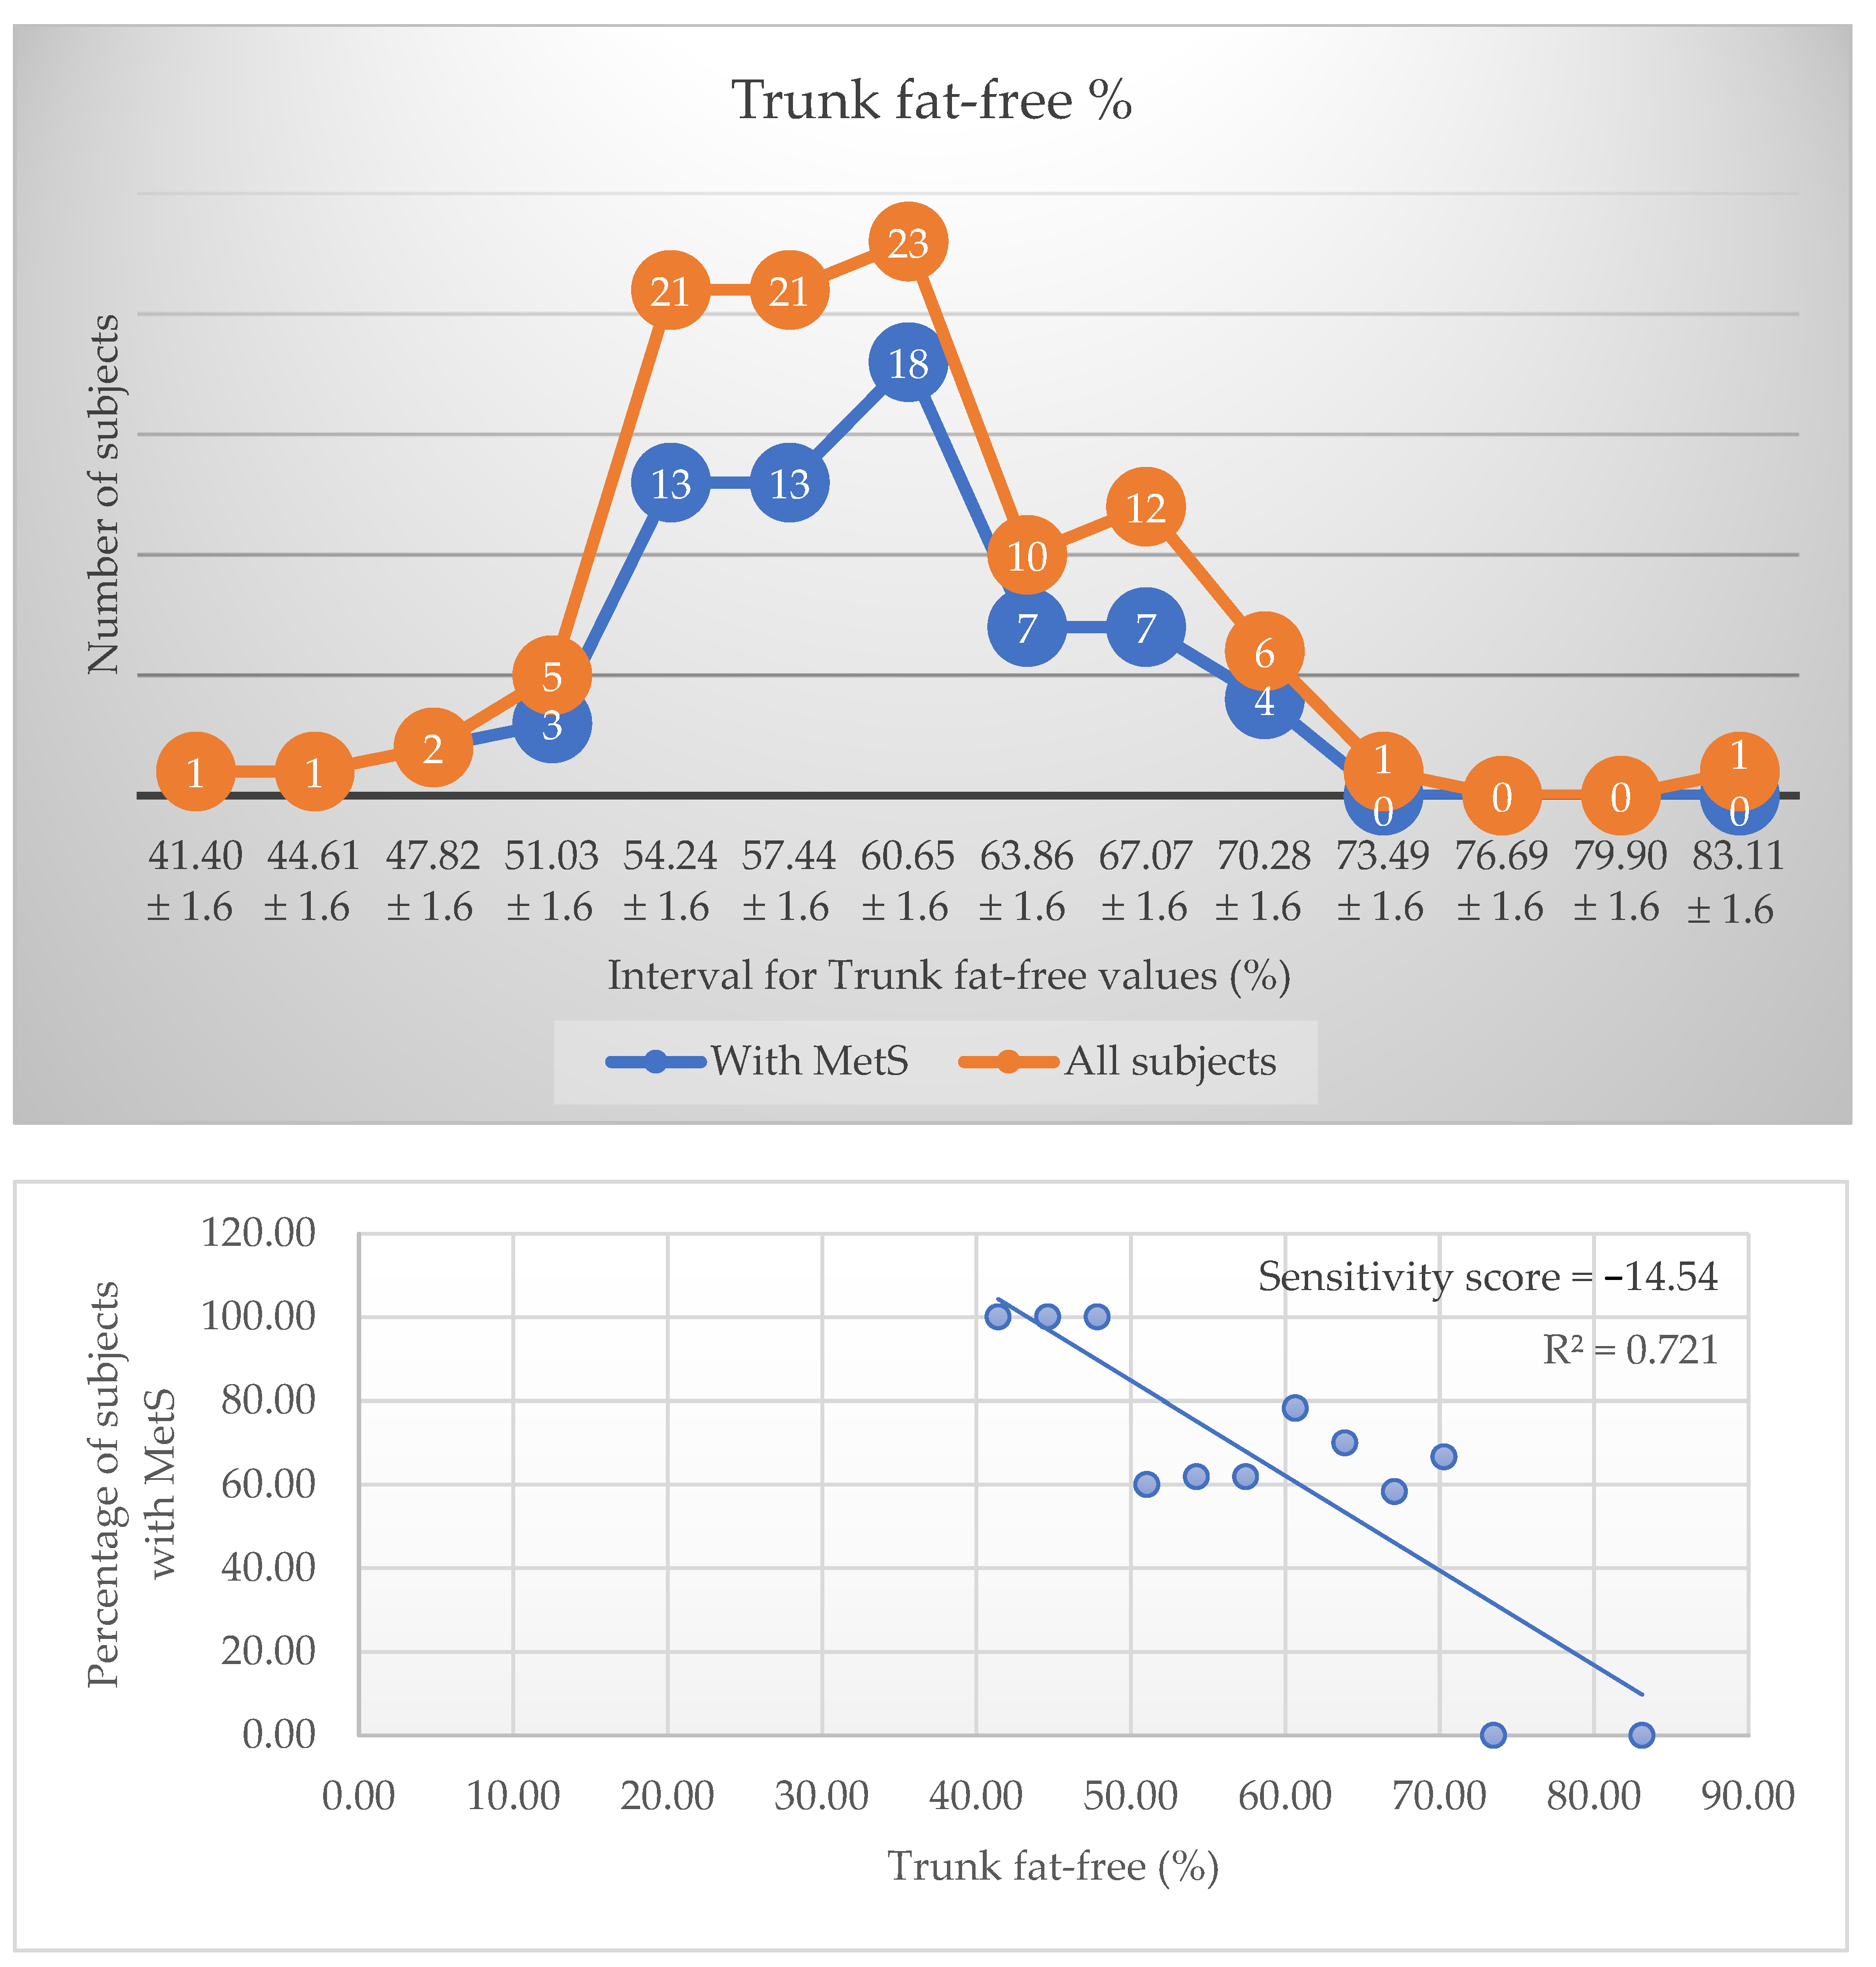
| Trunk fat-free (%) | 59.70 (58.45–60.95) ± 6.42 | 58.70 (9.90) | 59.93 (58.41–61.44) ± 6.32 | |
| FMI (kg/m2) | 12.59 (4) | 12.45 (11.31–13.58) ± 3.31 | 12.60 (3.86) | |
| FFMI (kg/m2) | 18.28 (4.30) | 18.17 (17.24–19.09) ± 2.69 | 19.28 (18.57–19.99) ± 2.96 | 0.06 |
| MetS associated biomarkers | ||||
| Glucose (mg/dL) | 103 (22) | 94 (10) | 105 (27.50) | |
| Insulin (μUI/mL) | 15 (12.07) | 9.69 (10.24) | 16.40 (17.95) | |
| HOMA-IR | 3.78 (3.60) | 2.19 (2.68) | 4.48 (5.70) | |
| TG (mg/dL) | 135 (83.5) | 97.63 (88.10–107.15) ± 27.73 | 168 (104) | |
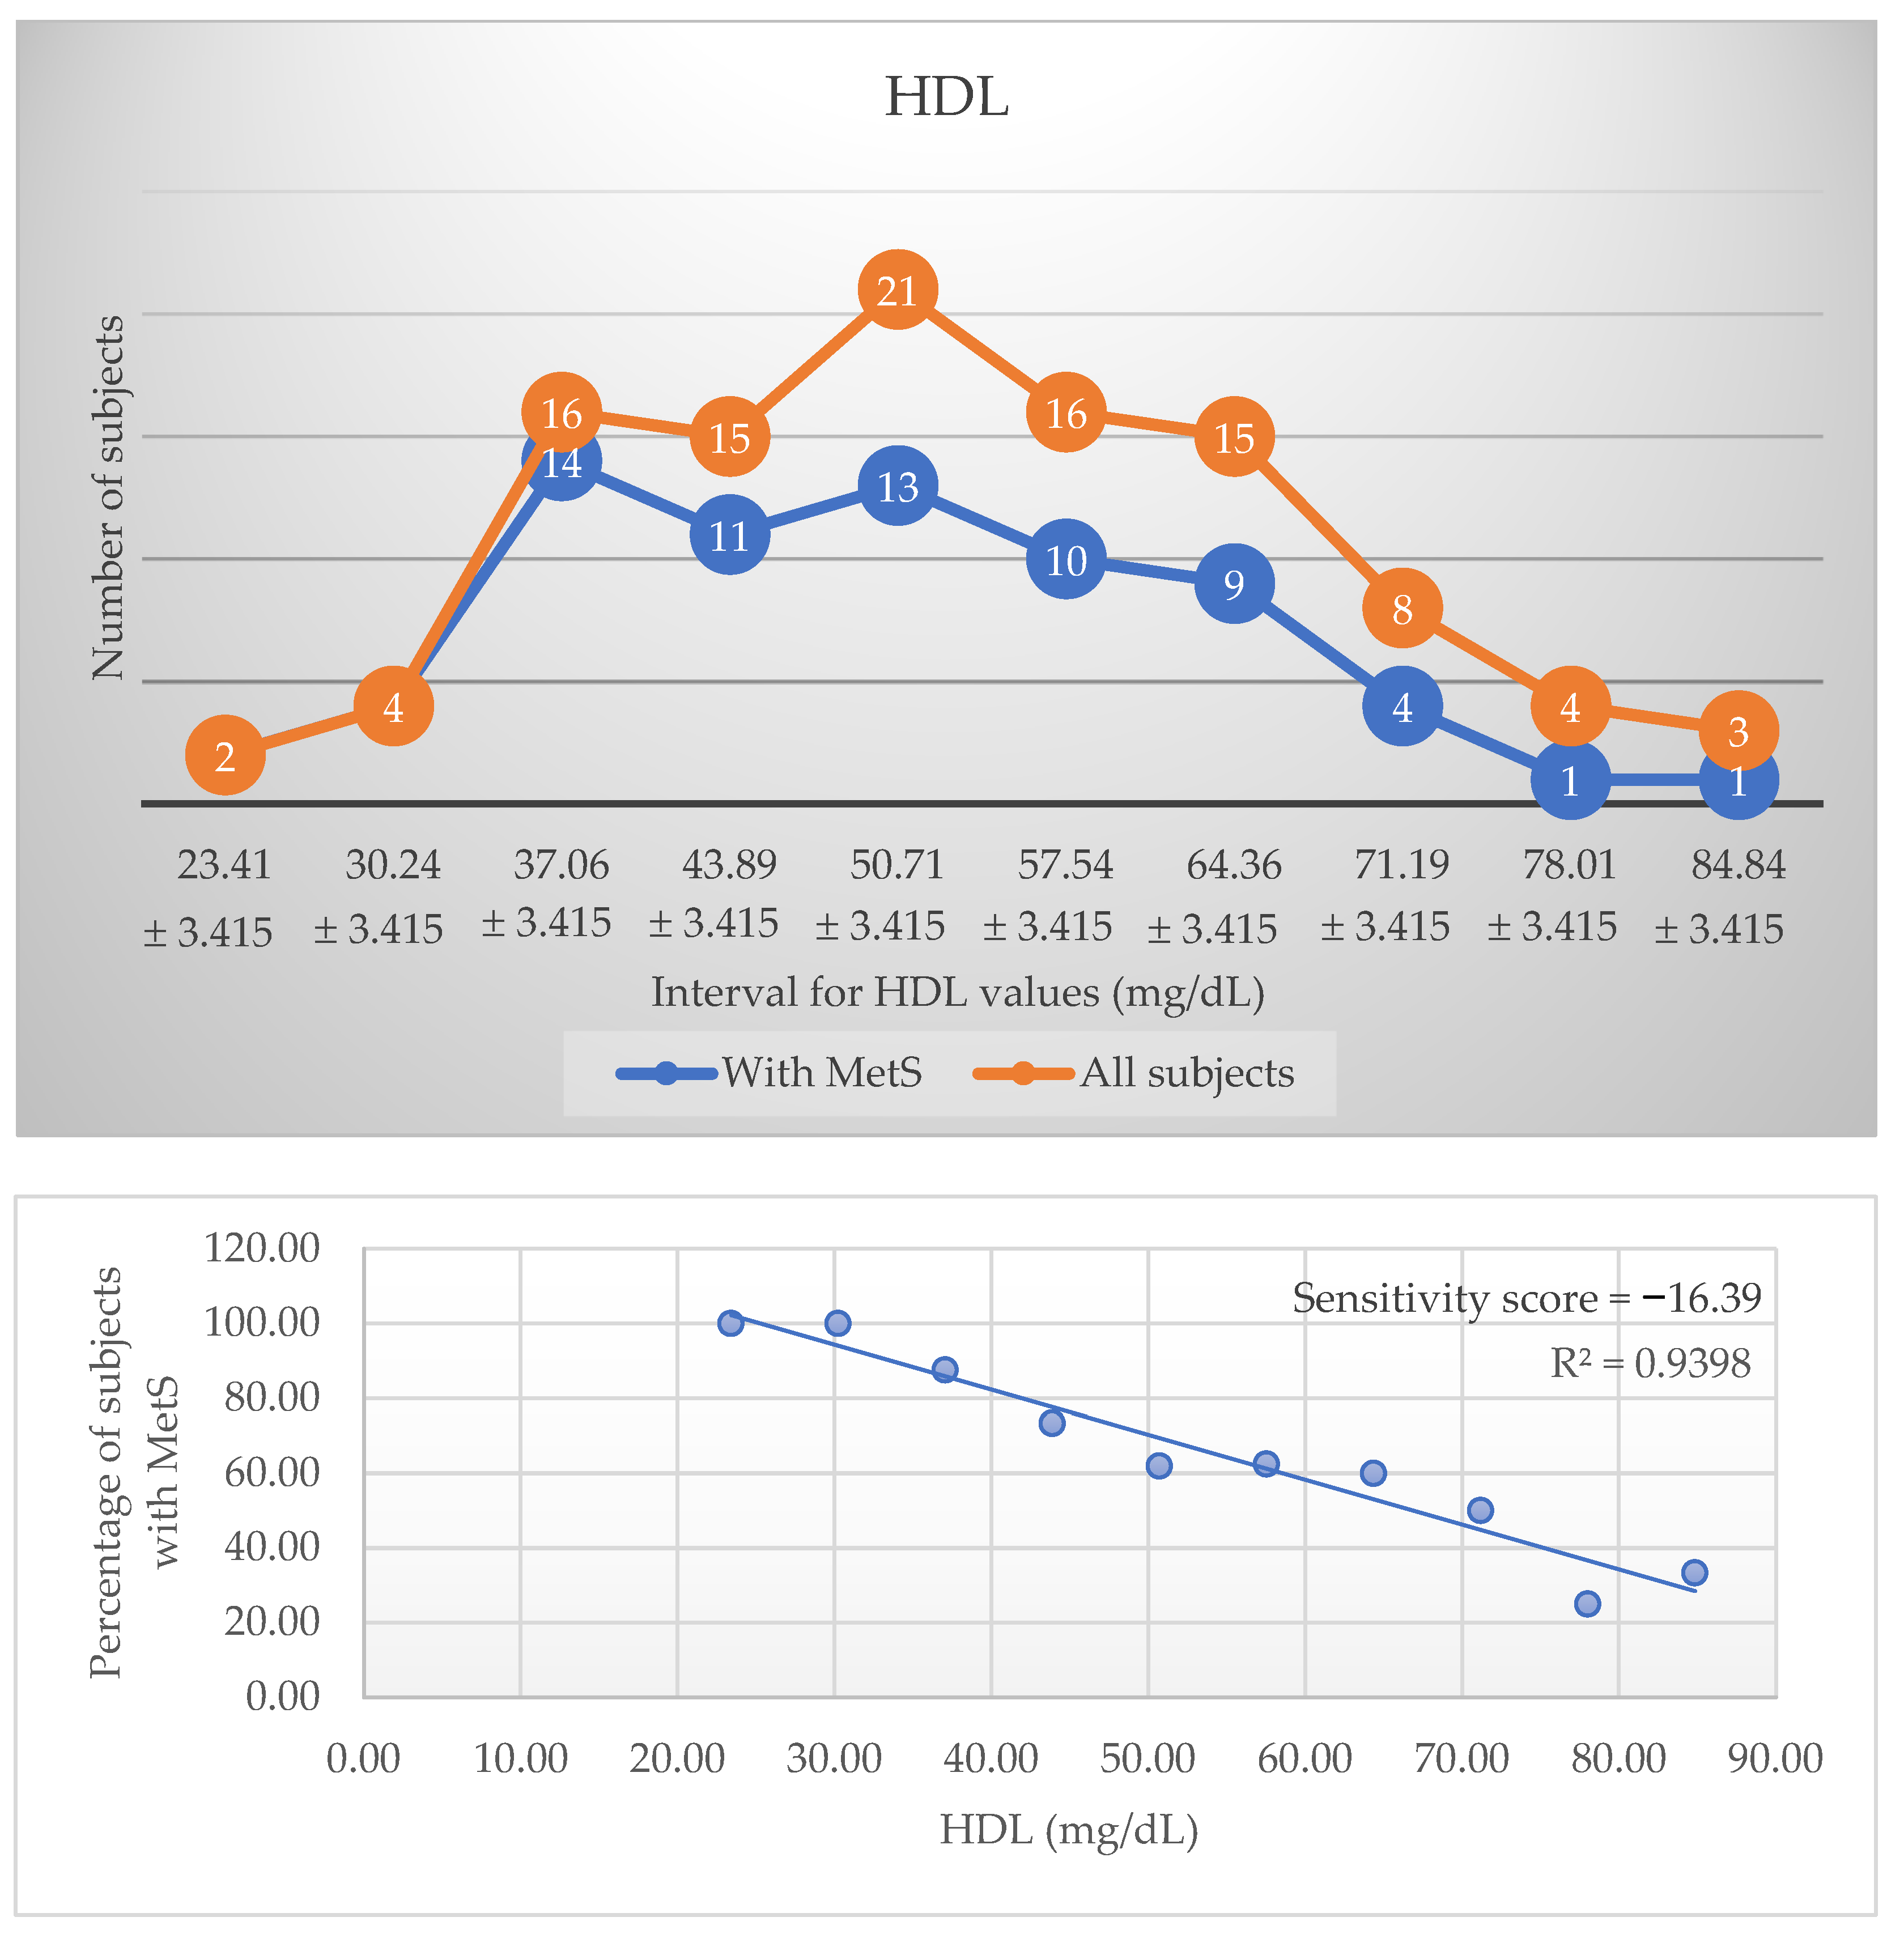
| HDL-Chol (mg/dL) | 52.63 (49.98–55.29) ± 13.65 | 59.03 (54.81–63.25) ± 12.29 | 49.39 (46.21–52.57) ± 13.23 | 0.001 |
| Non-HDL (mg/dL) | 155.97 (147.24–164.70) ± 44.90 | 153.91 (140.09–167.73) ± 40.23 | 157.01 (145.64–168.39) ± 47.34 | 0.74 |
| SBP (mmHg) | 135 (21.8) | 125 (21) | 139 (18.50) | |
| DBP (mmHg) | 85.94 (83.61–88.28) ± 12.01 | 79 (12) | 90 (14.5) | |
| Leptin (ng/dL) | 19.63 (28.45) | 19.87 (30.40) | 19.40 (28.50) | |
| Adiponectin (μg/dL) | 13.02 (6.45) | 15.74 (13.75–17.73) ± 5.80 | 12.84 (3.69) | |
| ALR | 1.98 (3.43) | 1.75 (1.94) | 2.12 (3.45) | |
| Uric acid (mg/dL) | 5.52 (5.21–5.83) ± 1.60 | 5.01 (4.63–5.39) ± 1.10 | 5.77 (5.35–6.19) ± 1.75 | 0.02 |
| CRP (mg/dL) | 0.32 (0.38) | 0.20 (0.35) | 0.40 (0.61) | |
| Patients without MetS (n = 35) | Patients with MetS (n = 69) | p | |
|---|---|---|---|
| Median OR Mean Rank (*) | Median OR Mean Rank (*) | ||
| Age | 61 | 63 | 0.202 |
| BMI (kg/m2) | 31 | 31.01 | 0.133 |
| WC (cm) | 100 | 110 | 0.001 |
| HC (cm) | 112 | 115 | 0.120 |
| WHtR | 0.62 | 0.65 | 0.015 |
| Total Fat (kg) | 34.32 | 34.03 | 0.431 |
| Total fat-free (kg) | 43.89 * | 56.87 * | 0.038 |
| Trunk fat (kg) | 16.52 | 18.40 | 0.025 |
| Trunk fat-free (kg) | 42.14 * | 57.75 * | 0.013 |
| Trunk total (kg) | 39.13 | 45.50 | 0.03 |
| Total fat (%) | 42.30 | 40.80 | 0.573 |
| Total fat-free (%) | 57.70 | 59.20 | 0.573 |
| Trunk fat (%) | 41.30 | 40.50 | 0.522 |
| Trunk fat-free (%) | 58.70 | 59.50 | 0.522 |
| FMI (kg/m2) | 12.59 | 12.60 | 0.888 |
| Glucose (mg/dL) | 31.29 * | 63.26 * | <0.001 |
| Insulin (μUI/mL) | 9.69 | 16.40 | <0.001 |
| HOMA-IR | 33.80 * | 61.99 * | <0.001 |
| TG (mg/dL) | 27.59 * | 65.14 * | <0.001 |
| SBP (mmHg) | 125 | 139 | <0.001 |
| DBP (mmHg) | 79 (12) | 90 (14.5) | 0.001 |
| Leptin (ng/dL) | 19.87 | 19.40 | 0.804 |
| Adiponectin (μg/dL) | 61.80 * | 47.78 * | 0.025 |
| ALR | 1.75 | 2.12 | 0.264 |
| CRP (mg/dL) | 0.20 | 0.40 | 0.012 |
| Rank | Biomarker | Score | Coefficients | R | R2 | p | |
|---|---|---|---|---|---|---|---|
| Intercept | Variable | ||||||
| Biological and clinical parameters | |||||||
| 1 | HDL-chol (mg/dL) | −16.39 | 130.33 | −1.20 | 0.97 | 0.94 | <0.001 |
| 2 | Insulin (μUI/mL) | 16.36 | 36.37 | 1.43 | 0.86 | 0.73 | 0.003 |
| 3 | ALR | −13.44 | 84.42 | −15.60 | 0.87 | 0.76 | 0.002 |
| 4 | TG (mg/dL) | 11.88 | 47.28 | 0.14 | 0.74 | 0.55 | 0.01 |
| 5 | HOMA-IR | 9.83 | 58.60 | 2.14 | 0.78 | 0.61 | 0.01 |
| 6 | Glucose (mg/dL) | 7.17 | 49.74 | 0.20 | 0.66 | 0.43 | 0.04 |
| 7 | CRP (mg/dL) | 6.81 | 61.17 | 13.22 | 0.90 | 0.80 | 0.10 |
| 8 | Uric acid (mg/dL) | 5.57 | 57.97 | 3.47 | 0.40 | 0.16 | 0.19 |
| 9 | Leptin (ng/dL) | 5.16 | 59.47 | 0.35 | 0.49 | 0.24 | 0.21 |
| 10 | nonHDL (mg/dL) | 4.74 | 51.64 | 0.10 | 0.39 | 0.15 | 0.26 |
| Body composition parameters | |||||||
| 1 | Trunk fat-free (%) | −14.54 | 198.16 | −2.27 | 0.85 | 0.72 | <0.001 |
| 2 | WHtR | 13.81 | −74.39 | 202.34 | 0.79 | 0.62 | 0.004 |
| 3 | Trunk fat (%) | 11.81 | −10.16 | 1.84 | 0.85 | 0.72 | <0.001 |
| 4 | WHR | 10.06 | −88.25 | 162.03 | 0.76 | 0.57 | 0.01 |
| 5 | Total fat (%) | 9.74 | 7.65 | 1.53 | 0.54 | 0.29 | 0.11 |
| 6 | Total fat-free (%) | −9.33 | 156.32 | −1.47 | 0.51 | 0.26 | 0.13 |
| 7 | FMI (kg/m2) | 8.91 | 23.64 | 2.45 | 0.55 | 0.31 | 0.06 |
| 8 | HC (cm) | 8.83 | −38.36 | 0.84 | 0.51 | 0.26 | 0.11 |
| 9 | Total fat (kg) | 8.75 | 23.03 | 0.83 | 0.50 | 0.25 | 0.11 |
| 10 | WC (cm) | 8.46 | −9.20 | 0.68 | 0.49 | 0.24 | 0.17 |
| 11 | Abdominal skinfold (mm) | 8.05 | 25.83 | 0.98 | 0.44 | 0.19 | 0.16 |
| 12 | Trunk fat (kg) | 7.98 | 28.27 | 1.18 | 0.51 | 0.26 | 0.13 |
| 13 | Total fat-free (kg) | 7.77 | 28.90 | 0.68 | 0.41 | 0.17 | 0.27 |
| 14 | FFMI (kg/m2) | 7.12 | 21.26 | 2.45 | 0.56 | 0.31 | 0.12 |
| 15 | BMI (kg/m2) | 7.09 | 17.60 | 1.32 | 0.43 | 0.18 | 0.19 |
| 16 | Tricipital skinfold (mm) | 6.96 | 43.98 | 0.94 | 0.58 | 0.34 | 0.08 |
Publisher’s Note: MDPI stays neutral with regard to jurisdictional claims in published maps and institutional affiliations. |
© 2022 by the authors. Licensee MDPI, Basel, Switzerland. This article is an open access article distributed under the terms and conditions of the Creative Commons Attribution (CC BY) license (https://creativecommons.org/licenses/by/4.0/).
Share and Cite
Mitu, I.; Dimitriu, C.-D.; Preda, C.; Mitu, O.; Costache, I.-I.; Miftode, R.-Ș.; Ciocoiu, M. The Importance of HDL-Cholesterol and Fat-Free Percentage as Protective Markers in Risk Factor Hierarchy for Patients with Metabolic Syndrome. Metabolites 2022, 12, 1217. https://doi.org/10.3390/metabo12121217
Mitu I, Dimitriu C-D, Preda C, Mitu O, Costache I-I, Miftode R-Ș, Ciocoiu M. The Importance of HDL-Cholesterol and Fat-Free Percentage as Protective Markers in Risk Factor Hierarchy for Patients with Metabolic Syndrome. Metabolites. 2022; 12(12):1217. https://doi.org/10.3390/metabo12121217
Chicago/Turabian StyleMitu, Ivona, Cristina-Daniela Dimitriu, Cristina Preda, Ovidiu Mitu, Irina-Iuliana Costache, Radu-Ștefan Miftode, and Manuela Ciocoiu. 2022. "The Importance of HDL-Cholesterol and Fat-Free Percentage as Protective Markers in Risk Factor Hierarchy for Patients with Metabolic Syndrome" Metabolites 12, no. 12: 1217. https://doi.org/10.3390/metabo12121217