
A Distinctive Human Metabolomics Alteration Associated with Osteopenic and Osteoporotic Patients

 ,
,  , , and
Abstract
1. Introduction
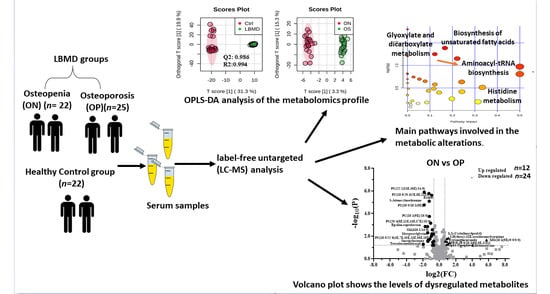
2. Results
2.1. Clinical Characteristics and Demographics of the Study Population
2.2. The Overall Metabolomic Analysis and Exclusion of Confounder-Associated Metabolites
2.3. Metabolomics Profiling of LBMD and Control Groups
2.4. Metabolomics Profiling between ON and OP Groups
3. Discussion
4. Materials and Methods
4.1. Patients
4.2. Metabolomic Analysis
4.3. Statistical Analysis
5. Conclusions
Supplementary Materials
Author Contributions
Funding
Institutional Review Board Statement
Informed Consent Statement
Data Availability Statement
Conflicts of Interest
References
- Jeremiah, M.P.; Unwin, B.K.; Greenawald, M.H.; Casiano, V.E. Diagnosis and Management of Osteoporosis. Am. Fam. Physician 2015, 92, 261–268. [Google Scholar]
- Tu, K.N.; Lie, J.D.D.; Wan, C.K.V.; Cameron, M.; Austel, A.G.; Nguyen, J.K.; Van, K.; Hyun, D. Osteoporosis: A Review of Treatment Options. Pharm. Ther. 2018, 43, 92–104. [Google Scholar]
- Al-Anazi, A.F.; Qureshi, V.F.; Javaid, K.; Qureshi, S. Preventive effects of phytoestrogens against postmenopausal osteoporosis as compared to the available therapeutic choices: An overview. J. Nat. Sci. Biol. Med. 2011, 2, 154–163. [Google Scholar]
- Atik, O.S.S.; Gunal, I.; Korkusuz, F. Burden of osteoporosis. Clin. Orthop. Relat. Res. 2006, 443, 19–24. [Google Scholar] [CrossRef] [PubMed]
- Cole, Z.A.; Dennison, E.M.; Cooper, C. Osteoporosis epidemiology update. Curr. Rheumatol. Rep. 2008, 10, 92–96. [Google Scholar] [CrossRef]
- Pouresmaeili, F.; Kamalidehghan, B.; Kamarehei, M.; Goh, Y.M. A comprehensive overview on osteoporosis and its risk factors. Clin. Risk. Manag. 2018, 14, 2029–2049. [Google Scholar] [CrossRef]
- Harvey, N.; Dennison, E.; Cooper, C. Osteoporosis: Impact on health and economics. Nat. Rev. Rheumatol. 2010, 6, 99–105. [Google Scholar] [CrossRef]
- Harvey, N.; Dennison, E.; Cooper, C. Osteoporosis: A lifecourse approach. J. Bone Miner. Res. 2014, 29, 1917–1925. [Google Scholar] [CrossRef] [PubMed]
- Drake, M.T.; Clarke, B.L.; Lewiecki, E.M. The Pathophysiology and Treatment of Osteoporosis. Clin. Ther. 2015, 37, 1837–1850. [Google Scholar] [CrossRef]
- Willson, T.; Nelson, S.D.; Newbold, J.; Nelson, R.E.; LaFleur, J. The clinical epidemiology of male osteoporosis: A review of the recent literature. Clin. Epidemiol. 2015, 7, 65–76. [Google Scholar]
- National Osteoporosis Foundation. Available online: https://www.nof.org/patients/what-is-osteoporosis/ (accessed on 28 November 2020).
- Silva, A.C.V.; da Rosa, M.I.; Fernandes, B.; Lumertz, S.; Diniz, R.M.; dos Reis Damiani, M.E. Factors associated with osteopenia and osteoporosis in women undergoing bone mineral density test. Rev. Bras. Reumatol. 2015, 55, 223–228. [Google Scholar] [CrossRef][Green Version]
- Kanis, J.A.; Melton, L.J., III; Christiansen, C.; Johnston, C.C.; Khaltaev, N. The diagnosis of osteoporosis. J. Bone Miner. Res. 1994, 9, 1137–1141. [Google Scholar] [CrossRef]
- Gonnelli, S.; Cepollaro, C.; Gennari, L.; Montagnani, A.; Caffarelli, C.; Merlotti, D.; Rossi, S.; Cadirni, A.; Nuti, R. Quantitative ultrasound and dual-energy X-ray absorptiometry in the prediction of fragility fracture in men. Osteoporos. Int. 2005, 16, 963–968. [Google Scholar] [CrossRef]
- Curtis, E.M.; Moon, R.J.; Dennison, E.M.; Harvey, N.C.; Cooper, C. Recent advances in the pathogenesis and treatment of osteoporosis. Clin. Med. 2016, 16, 360–364. [Google Scholar] [CrossRef]
- Liu, X.; Locasale, J.W. Metabolomics: A Primer. Trends Biochem. Sci. 2017, 42, 274–284. [Google Scholar] [CrossRef] [PubMed]
- Jacob, M.; Malkawi, A.; Albast, N.; Al Bougha, S.; Lopata, A.; Dasouki, M.; Abdel Rahman, A.M. A targeted metabolomics approach for clinical diagnosis of inborn errors of metabolism. Anal. Chim. Acta 2018, 1025, 141–153. [Google Scholar] [CrossRef] [PubMed]
- Al-Qahtani, W.; Abdel Jabar, M.; Masood, A.; Jacob, M.; Nizami, I.; Dasouki, M.; Abdel Rahman, A.M. Dried Blood Spot-Based Metabolomic Profiling in Adults with Cystic Fibrosis. J. Proteome Res. 2020, 19, 2346–2357. [Google Scholar] [CrossRef] [PubMed]
- You, Y.S.S.; Lin, C.Y.; Liang, H.J.; Lee, S.H.; Tsai, K.S.; Chiou, J.M.; Chen, Y.C.; Tsao, C.K.; Chen, J.H. Association between the metabolome and low bone mineral density in Taiwanese women determined by (1)H NMR spectroscopy. J. Bone Miner. Res. 2014, 29, 212–222. [Google Scholar] [CrossRef]
- Qi, H.; Bao, J.; An, G.; Ouyang, G.; Zhang, P.; Wang, C.; Ying, H.; Ouyang, P.; Ma, B.; Zhang, Q. Association between the metabolome and bone mineral density in pre- and postmenopausal Chinese women using GC-MS. Mol. Biosyst. 2016, 12, 2265–2275. [Google Scholar] [CrossRef]
- Miyamoto, T.; Hirayama, A.; Sato, Y.; Koboyashi, T.; Katsuyama, E.; Kanagawa, H.; Miyamoto, H.; Mori, T.; Yoshida, S.; Fujie, A.; et al. A serum metabolomics-based profile in low bone mineral density postmenopausal women. Bone 2017, 95, 1–4. [Google Scholar] [CrossRef] [PubMed]
- Moayyeri, A.; Cheung, C.L.; Tan, K.C.; Morris, J.A.; Cerani, A.; Mohney, R.P.; Richards, J.B.; Hammond, C.; Spector, T.D.; Menni, C. Metabolomic Pathways to Osteoporosis in Middle-Aged Women: A Genome-Metabolome-Wide Mendelian Randomization Study. J. Bone Miner. Res. 2018, 33, 643–650. [Google Scholar] [CrossRef]
- Miyamoto, T.; Hirayama, A.; Sato, Y.; Koboyashi, T.; Katsuyama, E.; Kanagawa, H.; Fujie, A.; Morita, M.; Watanabe, R.; Tando, T.; et al. Metabolomics-based profiles predictive of low bone mass in menopausal women. Bone Rep. 2018, 9, 11–18. [Google Scholar] [CrossRef]
- Zhao, Q.; Shen, H.; Su, K.-J.; Zhang, J.-G.; Tian, Q.; Zhao, L.-J.; Qiu, C.; Zhang, Q.; Garrett, T.J.; Liu, J.; et al. Metabolomic profiles associated with bone mineral density in US Caucasian women. Nutr. Metab. 2018, 15, 57. [Google Scholar] [CrossRef] [PubMed]
- Zhao, H.; Li, X.; Zhang, D.; Chen, H.; Chao, Y.; Wu, K.; Dong, X.; Su, J. Integrative Bone Metabolomics—Lipidomics Strategy for Pathological Mechanism of Postmenopausal Osteoporosis Mouse Model. Sci. Rep. 2018, 8, 16456. [Google Scholar] [CrossRef]
- Lee, M.Y.; Kim, H.Y.; Singh, D.; Yeo, S.H.; Baek, S.Y.; Park, Y.K.; Lee, C.H. Metabolite Profiling Reveals the Effect of Dietary Rubus coreanus Vinegar on Ovariectomy-Induced Osteoporosis in a Rat Model. Molecules 2016, 21, 149. [Google Scholar] [CrossRef]
- Huang, Y.; Bo, Y.; Wu, X.; Wang, Q.; Qin, F.; Zhao, L.; Xiong, Z. An intergated serum and urinary metabonomic research based on UPLC-MS and therapeutic effects of Gushudan on prednisolone-induced osteoporosis rats. J. Chromatogr. B 2016, 1027, 119–130. [Google Scholar] [CrossRef]
- Ma, B.; Li, X.; Zhang, Q.; Wu, D.; Wang, G.; Jiye, A.; Sun, J.; Li, J.; Liu, Y.; Wang, Y.; et al. Metabonomic profiling in studying anti-osteoporosis effects of strontium fructose 1,6-diphosphate on estrogen deficiency-induced osteoporosis in rats by GC/TOF-MS. Eur. J. Pharmacol. 2013, 718, 524–532. [Google Scholar] [CrossRef]
- Malkawi, A.K.; Alzoubi, K.H.; Jacob, M.; Matic, G.; Ali, A.; Al Faraj, A.; Almuhanna, F.; Dasouki, M.; Abdel Rahman, A.M. Metabolomics Based Profiling of Dexamethasone Side Effects in Rats. Front. Pharmacol. 2018, 9, 46. [Google Scholar] [CrossRef]
- Dahabiyeh, L.A.A.; Malkawi, A.K.; Wang, X.; Colak, D.; Mujamammi, A.H.; Sabi, E.M.M.; Li, L.; Dasouki, M.; Abdel Rahman, A.M. Dexamethasone-Induced Perturbations in Tissue Metabolomics Revealed by Chemical Isotope Labeling LC-MS Analysis. Metabolites 2020, 10, 42. [Google Scholar] [CrossRef]
- Liu, X.; Liu, Y.; Cheng, M.; Zhang, X.; Xiao, H. A metabolomics study of the inhibitory effect of 17-beta-estradiol on osteoclast proliferation and differentiation. Mol. Biosyst. 2015, 11, 635–646. [Google Scholar] [CrossRef] [PubMed]
- Jacob, M.; Lopata, A.L.; Dasouki, M.; Abdel Rahman, A.M. Metabolomics toward personalized medicine. Mass Spectrom. Rev. 2019, 38, 221–238. [Google Scholar] [CrossRef]
- Gu, X.; Al Dubayee, M.; Alshahrani, A.; Masood, A.; Benabdelkamel, H.; Zahra, M.; Li, L.; Abdel Rahman, A.M.; Aljada, A. Distinctive Metabolomics Patterns Associated With Insulin Resistance and Type 2 Diabetes Mellitus. Front. Mol. Biosci. 2020, 7, 609806. [Google Scholar] [CrossRef]
- Yang, T.-L.; Shen, H.; Liu, A.; Dong, S.-S.; Zhang, L.; Deng, F.-Y.; Zhao, Q.; Deng, H.-W. A road map for understanding molecular and genetic determinants of osteoporosis. Nat. Rev. Endocrinol. 2020, 16, 91–103. [Google Scholar] [CrossRef]
- Yu, L.; Qi, H.; An, G.; Bao, J.; Ma, B.; Zhu, J.; Ouyang, G.; Zhang, P.; Fan, H.; Zhang, Q. Association between metabolic profiles in urine and bone mineral density of pre- and postmenopausal Chinese women. Menopause 2019, 26, 94–102. [Google Scholar] [CrossRef]
- Cabrera, D.; Kruger, M.; Wolber, F.M.; Roy, N.C.; Totman, J.J.; Henry, C.J.; Cameron-Smith, D.; Fraser, K. Association of Plasma Lipids and Polar Metabolites with Low Bone Mineral Density in Singaporean-Chinese Menopausal Women: A Pilot Study. Int. J. Environ. Res. Public Health 2018, 15, 1045. [Google Scholar] [CrossRef]
- Wang, J.; Yan, D.; Zhao, A.; Hou, X.; Zheng, X.; Chen, P.; Bao, Y.; Jia, W.; Hu, C.; Zhang, Z.L.; et al. Discovery of potential biomarkers for osteoporosis using LC-MS/MS metabolomic methods. Osteoporos. Int. 2019, 30, 1491–1499. [Google Scholar] [CrossRef]
- Mei, Z.; Dong, X.; Qian, Y.; Hong, D.; Xie, Z.; Yao, G.; Qin, A.; Gao, S.; Hu, J.; Liang, L.; et al. Association between the metabolome and bone mineral density in a Chinese population. EBioMedicine 2020, 62, 103111. [Google Scholar] [CrossRef]
- Picke, A.-K.; Campbell, G.; Napoli, N.; Hofbauer, L.C.; Rauner, M. Update on the impact of type 2 diabetes mellitus on bone metabolism and material properties. Endocr. Connect. 2019, 8, R55–R70. [Google Scholar] [CrossRef]
- Xu, B.; Lovre, D.; Mauvais-Jarvis, F. The effect of selective estrogen receptor modulators on type 2 diabetes onset in women: Basic and clinical insights. J. Diabetes Its Complicat. 2017, 31, 773–779. [Google Scholar] [CrossRef]
- Delitala, A.P.; Scuteri, A.; Doria, C. Thyroid Hormone Diseases and Osteoporosis. J. Clin. Med. 2020, 9, 1034. [Google Scholar] [CrossRef]
- Mandal, C.C. High Cholesterol Deteriorates Bone Health: New Insights into Molecular Mechanisms. Front. Endocrinol. 2015, 6, 165. [Google Scholar] [CrossRef] [PubMed]
- Xu, L.; Sinclair, A.J.; Faiza, M.; Li, D.; Han, X.; Yin, H.; Wang, Y. Furan fatty acids—Beneficial or harmful to health? Prog. Lipid Res. 2017, 68, 119–137. [Google Scholar] [CrossRef]
- Tsutsumi, Y.; Deguchi, T.; Takano, M.; Takadate, A.; Lindup, W.E.; Otagiri, M. Renal disposition of a furan dicarboxylic acid and other uremic toxins in the rat. J. Pharmacol. Exp. Ther. 2002, 303, 880–887. [Google Scholar] [CrossRef]
- Niwa, T. Organic acids and the uremic syndrome: Protein metabolite hypothesis in the progression of chronic renal failure. Semin. Nephrol. 1996, 16, 167–182. [Google Scholar]
- Duranton, F.; Cohen, G.; De Smet, R.; Rodriguez, M.; Jankowski, J.; Vanholder, R.; Argiles, A. Normal and pathologic concentrations of uremic toxins. J. Am. Soc. Nephrol. 2012, 23, 1258–1270. [Google Scholar] [CrossRef]
- Zheng, J.-S.; Lin, M.; Imamura, F.; Cai, W.; Wang, L.; Feng, J.-P.; Ruan, Y.; Tang, J.; Wang, F.; Yang, H.; et al. Serum metabolomics profiles in response to n-3 fatty acids in Chinese patients with type 2 diabetes: A double-blind randomised controlled trial. Sci. Rep. 2016, 6, 29522. [Google Scholar] [CrossRef]
- Swank, K.R.; Furness, J.E.; Baker, E.A.A.; Gehrke, C.K.; Biebelhausen, S.P.; Baker, K.C.C. Metabolomic Profiling in the Characterization of Degenerative Bone and Joint Diseases. Metabolites 2020, 10, 223. [Google Scholar] [CrossRef]
- Colucci, S.; Mori, G.; Vaira, S.; Brunetti, G.; Greco, G.; Mancini, L.; Simone, G.M.; Sardelli, F.; Koverech, A.; Zallone, A.; et al. L-carnitine and isovaleryl L-carnitine fumarate positively affect human osteoblast proliferation and differentiation in vitro. Calcif. Tissue Int. 2005, 76, 458–465. [Google Scholar] [CrossRef] [PubMed]
- Flanagan, J.L.; Simmons, P.A.; Vehige, J.; Willcox, M.D.P.; Garrett, Q. Role of carnitine in disease. Nutr. Metab. 2010, 7, 30. [Google Scholar] [CrossRef]
- Reuter, S.E.; Evans, A.M. Carnitine and acylcarnitines: Pharmacokinetic, pharmacological and clinical aspects. Clin. Pharmacokinet. 2012, 51, 553–572. [Google Scholar] [CrossRef]
- Park, H.D.; Kim, S.R.; Ki, C.S.; Lee, S.Y.; Chang, Y.S.; Jin, D.K.; Park, W.S. Two novel HADHB gene mutations in a Korean patient with mitochondrial trifunctional protein deficiency. Ann. Clin. Lab. Sci. 2009, 39, 399–404. [Google Scholar] [PubMed]
- Chen, C.; Hou, G.; Zeng, C.; Ren, Y.; Chen, X.; Peng, C. Metabolomic profiling reveals amino acid and carnitine alterations as metabolic signatures in psoriasis. Theranostics 2021, 11, 754–767. [Google Scholar] [CrossRef] [PubMed]
- Drosatos-Tampakaki, Z.; Drosatos, K.; Siegelin, Y.; Gong, S.; Khan, S.; Van Dyke, T.; Goldberg, I.J.; Schulze, P.C.; Schulze-Späte, U. Palmitic acid and DGAT1 deficiency enhance osteoclastogenesis, while oleic acid-induced triglyceride formation prevents it. J. Bone Miner. Res. 2014, 29, 1183–1195. [Google Scholar] [CrossRef] [PubMed]
- Alsahli, A.; Kiefhaber, K.; Gold, T.; Muluke, M.; Jiang, H.; Cremers, S.; Schulze-Späte, U. Palmitic Acid Reduces Circulating Bone Formation Markers in Obese Animals and Impairs Osteoblast Activity via C16-Ceramide Accumulation. Calcif. Tissue Int. 2016, 98, 511–519. [Google Scholar] [CrossRef]
- Aleidi, S.M.; Dahabiyeh, L.A.A.; Gu, X.; Al Dubayee, M.; Alshahrani, A.; Benabdelkamel, H.; Mujammami, M.; Li, L.; Aljadaa, A.; Raman, A.M.A. Obesity Connected Metabolic Changes in Type 2 Diabetic Patients Treated with Metformin. Front. Pharmacol. 2020, 11, 2498. [Google Scholar]
- Alseekh, S.; Aharoni, A.; Brotman, Y.; Contrepois, K.; D’Auria, J.; Ewald, J.; Ewald, J.C.; Fraser, P.D.; Giavalisco, P.; Hall, R.D.; et al. Mass spectrometry-based metabolomics: A guide for annotation, quantification and best reporting practices. Nat. Methods 2021, 18, 747–756. [Google Scholar] [CrossRef] [PubMed]
- Zardini Buzatto, A.; Sarkar, I.; van Drunen Littel-van den Hurk, S.; Li, L. Comprehensive Lipidomic and Metabolomic Analysis for Studying Metabolic Changes in Lung Tissue Induced by a Vaccine against Respiratory Syncytial Virus. ACS Infect. Dis. 2020, 6, 2130–2142. [Google Scholar] [CrossRef]
- Zardini Buzatto, A.; Kwon, B.K.; Li, L. Development of a NanoLC-MS workflow for high-sensitivity global lipidomic analysis. Anal. Chim. Acta 2020, 1139, 88–99. [Google Scholar] [CrossRef]
- Liebisch, G.; Vizcaíno, J.A.; Köfeler, H.; Trötzmüller, M.; Griffiths, W.J.; Schmitz, G.; Spener, F.; Wakelam, M.J.O. Shorthand notation for lipid structures derived from mass spectrometry. J. Lipid. Res. 2013, 54, 1523–1530. [Google Scholar] [CrossRef]
- Chong, J.; Soufan, O.; Li, C.; Caraus, I.; Li, S.; Bourque, G.; Wishart, D.S.; Xia, J. MetaboAnalyst 4.0: Towards more transparent and integrative metabolomics analysis. Nucleic Acids Res. 2018, 46, W486–W494. [Google Scholar] [CrossRef]


| Ctrl | ON | OP | ||||
|---|---|---|---|---|---|---|
| Total n (%) | 22 (31.88) | 22 (31.88) | 25 (36.23) | |||
| Parameters | Mean | SEM | Mean | SEM | Mean | SEM |
| Age (years) | 54.82 | 1.03 | 64.64 § | 1.72 | 66.16 § | 1.78 |
| Gender (F/M) | (13/9) | - | (15/7) | - | (24/1) | - |
| Menopause * (yes/no) | (13/0) | - | (14/1) | - | (24/0) | - |
| Weight (kg) | 85.13 | 3.63 | 74.21 | 3.88 | 69.23 § | 2.86 |
| Height (cm) | 162.22 | 0.02 | 157.11 ǂ | 0.021 | 150.68 § | 0.01 |
| BMI (kg/m2) | 32.21 | 1.1 | 30.38 | 1.84 | 30.70 | 1.4 |
| Lumbar t-Score | 0.29 | 0.24 | −1.25 §,ǂ | 0.21 | −2.62 § | 0.12 |
| Femoral t-Score | 0.34 | 0.29 | −1.51 §,ǂ | 0.14 | −1.93 § | 0.13 |
| FBG (mmol/L) | 10.2 | 1.16 | 6.08 § | 0.39 | 5.87 § | 0.41 |
| HDL (mmol/L) | 1.00 | 0.80 | 1.47 § | 0.12 | 1.42 § | 0.09 |
| TG (mmol/L) | 1.85 | 0.15 | 1.23 § | 0.11 | 1.127 § | 0.08 |
| Cholesterol (mmol/L) | 5.51 | 0.23 | 4.47 § | 0.19 | 4.27 § | 0.29 |
| Calcium (mmol/L) | 2.24 | 0.026 | 2.37 § | 0.025 | 2.33 § | 0.02 |
| Albumin (g/L) | 37.65 | 1.14 | 41.98 § | 2.0 | 42.75 § | 0.86 |
| Vitamin D 25 hydroxy (nmol/L) | 68.32 | 7.39 | 77.64 | 3.3 | 86.57 | 6.05 |
Publisher’s Note: MDPI stays neutral with regard to jurisdictional claims in published maps and institutional affiliations. |
© 2021 by the authors. Licensee MDPI, Basel, Switzerland. This article is an open access article distributed under the terms and conditions of the Creative Commons Attribution (CC BY) license (https://creativecommons.org/licenses/by/4.0/).
Share and Cite
Aleidi, S.M.; Alnehmi, E.A.; Alshaker, M.; Masood, A.; Benabdelkamel, H.; Al-Ansari, M.M.; Abdel Rahman, A.M. A Distinctive Human Metabolomics Alteration Associated with Osteopenic and Osteoporotic Patients. Metabolites 2021, 11, 628. https://doi.org/10.3390/metabo11090628
Aleidi SM, Alnehmi EA, Alshaker M, Masood A, Benabdelkamel H, Al-Ansari MM, Abdel Rahman AM. A Distinctive Human Metabolomics Alteration Associated with Osteopenic and Osteoporotic Patients. Metabolites. 2021; 11(9):628. https://doi.org/10.3390/metabo11090628
Chicago/Turabian StyleAleidi, Shereen M., Eman A. Alnehmi, Mohammed Alshaker, Afshan Masood, Hicham Benabdelkamel, Mysoon M. Al-Ansari, and Anas M. Abdel Rahman. 2021. "A Distinctive Human Metabolomics Alteration Associated with Osteopenic and Osteoporotic Patients" Metabolites 11, no. 9: 628. https://doi.org/10.3390/metabo11090628
APA StyleAleidi, S. M., Alnehmi, E. A., Alshaker, M., Masood, A., Benabdelkamel, H., Al-Ansari, M. M., & Abdel Rahman, A. M. (2021). A Distinctive Human Metabolomics Alteration Associated with Osteopenic and Osteoporotic Patients. Metabolites, 11(9), 628. https://doi.org/10.3390/metabo11090628