Systematic Evaluation of Normalization Methods for Glycomics Data Based on Performance of Network Inference
Abstract
1. Introduction
2. Results
2.1. Data
- (1)
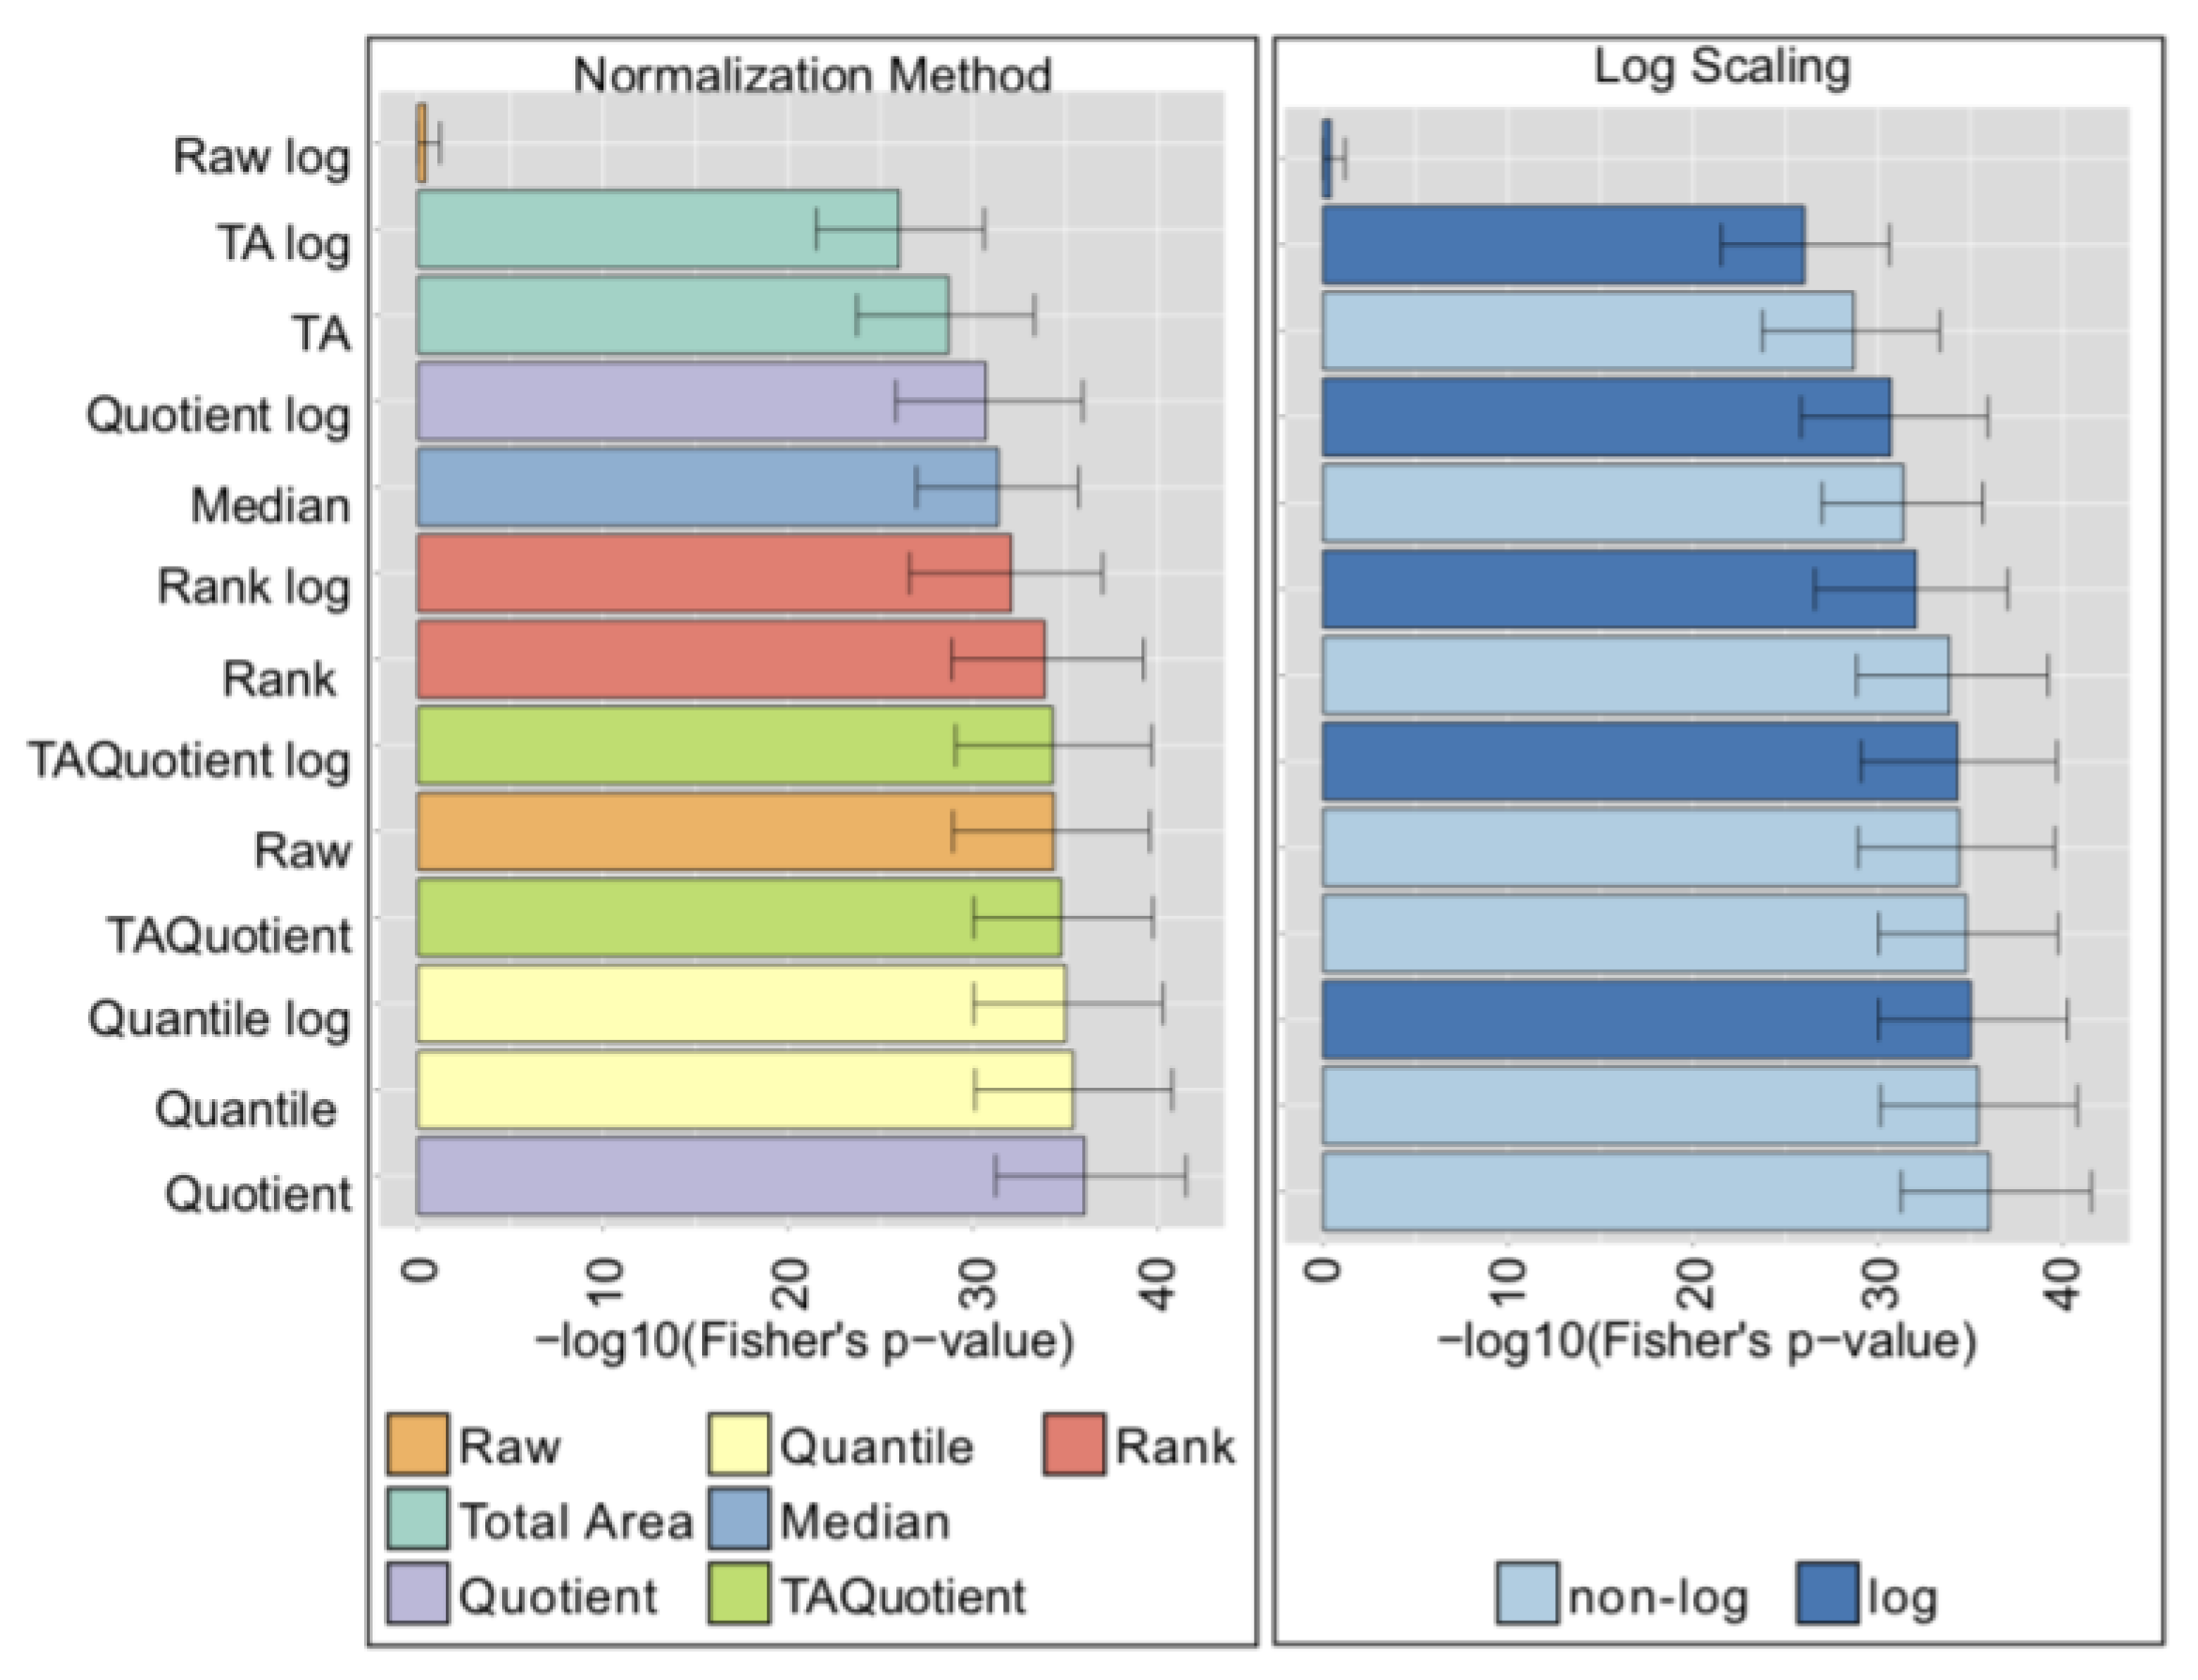
- In four cohorts (Korčula 2013, Korčula 2010, Split, Vis) [27], N-glycans from the Fc region of IgG were measured via liquid chromatography-electroSpray ionization-mass spectrometry (LC-ESI-MS). This platform allows to quantify glycopeptides, i.e., short amino acid sequences in proximity of the glycosylation site in combination with the attached glycans. Since IgG has four isoforms (also referred to as subclasses), which differ in their amino acid sequences [28,29], the LC-ESI-MS technology is able to distinguish among glycans bound to different IgG subclasses. In total, 50 N-glycopeptide structures were quantified: 20 for IgG1, 20 for IgG2 and IgG3 (which have the same glycopeptide composition and hence are not distinguishable by mass [28,29]), and 10 for IgG4. In the main manuscript, we show results for the Korčula 2013 cohort, which included 669 samples.
- (2)
- In one cohort (Study of Colorectal Cancer in Scotland; SOCCS) [30], IgG N-glycans were measured via ultra-high-performance liquid chromatography with fluorescence detection (UHPLC-FLD). In this case, all glycans bound to the IgG protein are first released and then measured, including the ones in the Fab region (see the Methods Section), but no information about the IgG subclass of origin is retained. Peaks in the chromatogram reflect chemical–physical properties of the measured molecules and not necessarily single glycan structures. In the specific case of IgG N-glycans, however, each UHPLC peak typically includes one highly predominant structure [31]. For the purpose of the analyses presented in this paper, we only considered the most abundant structure within each peak. The final UHPLC cohort consisted of 24 glycan peaks quantified in 535 samples.
- (3)
- In the last cohort (Leiden Longevity Study; LLS) [32], N-glycans from the whole set of human plasma proteins were measured via matrix-assisted laser desorption/ionization–Fourier-transform ion cyclotron resonance–mass spectrometry (MALDI-FTICR-MS). In this setting, glycans from all plasma proteins are released and measured together. Therefore, glycans originating from highly abundant and highly glycosylated proteins will be predominant. Notably, this platform only identifies molecular masses, so structural information is not directly available from the data. Therefore, within each mass, multiple glycan structures can be present, and this has to be taken into account. In the analyzed cohort, 61 distinct masses were quantified in 2056 samples.
2.2. Overview of Normalization Methods
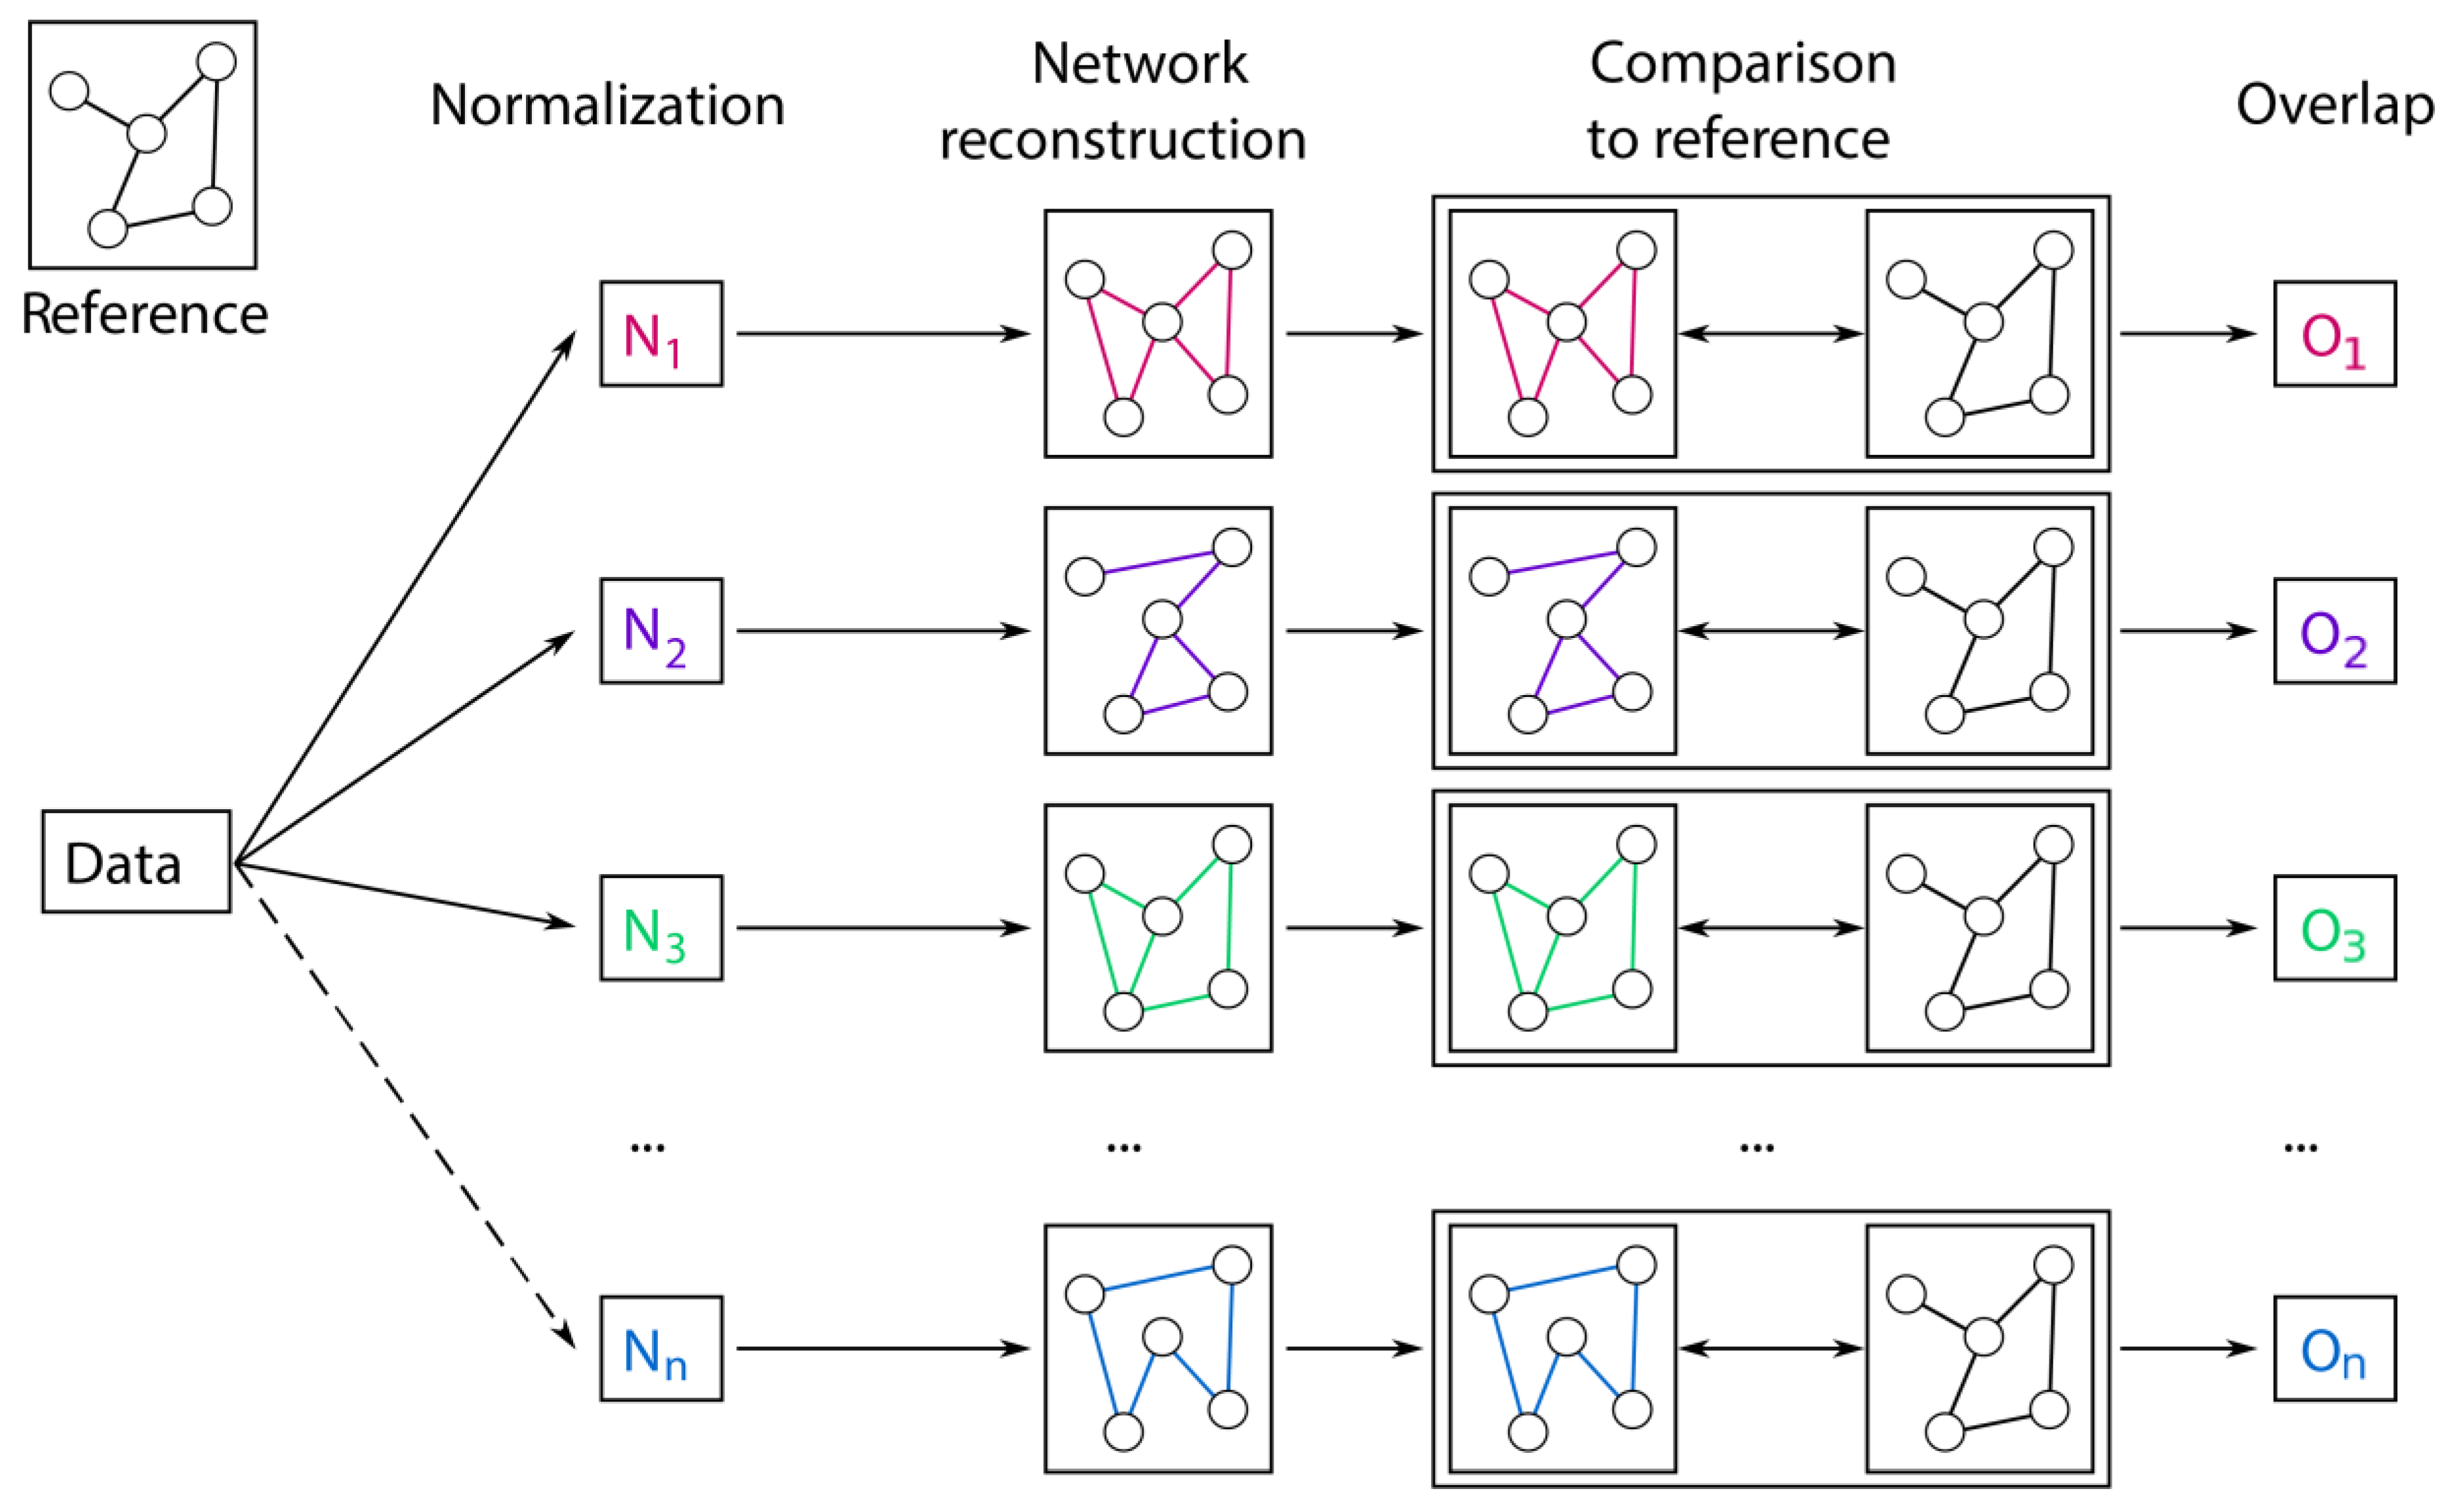
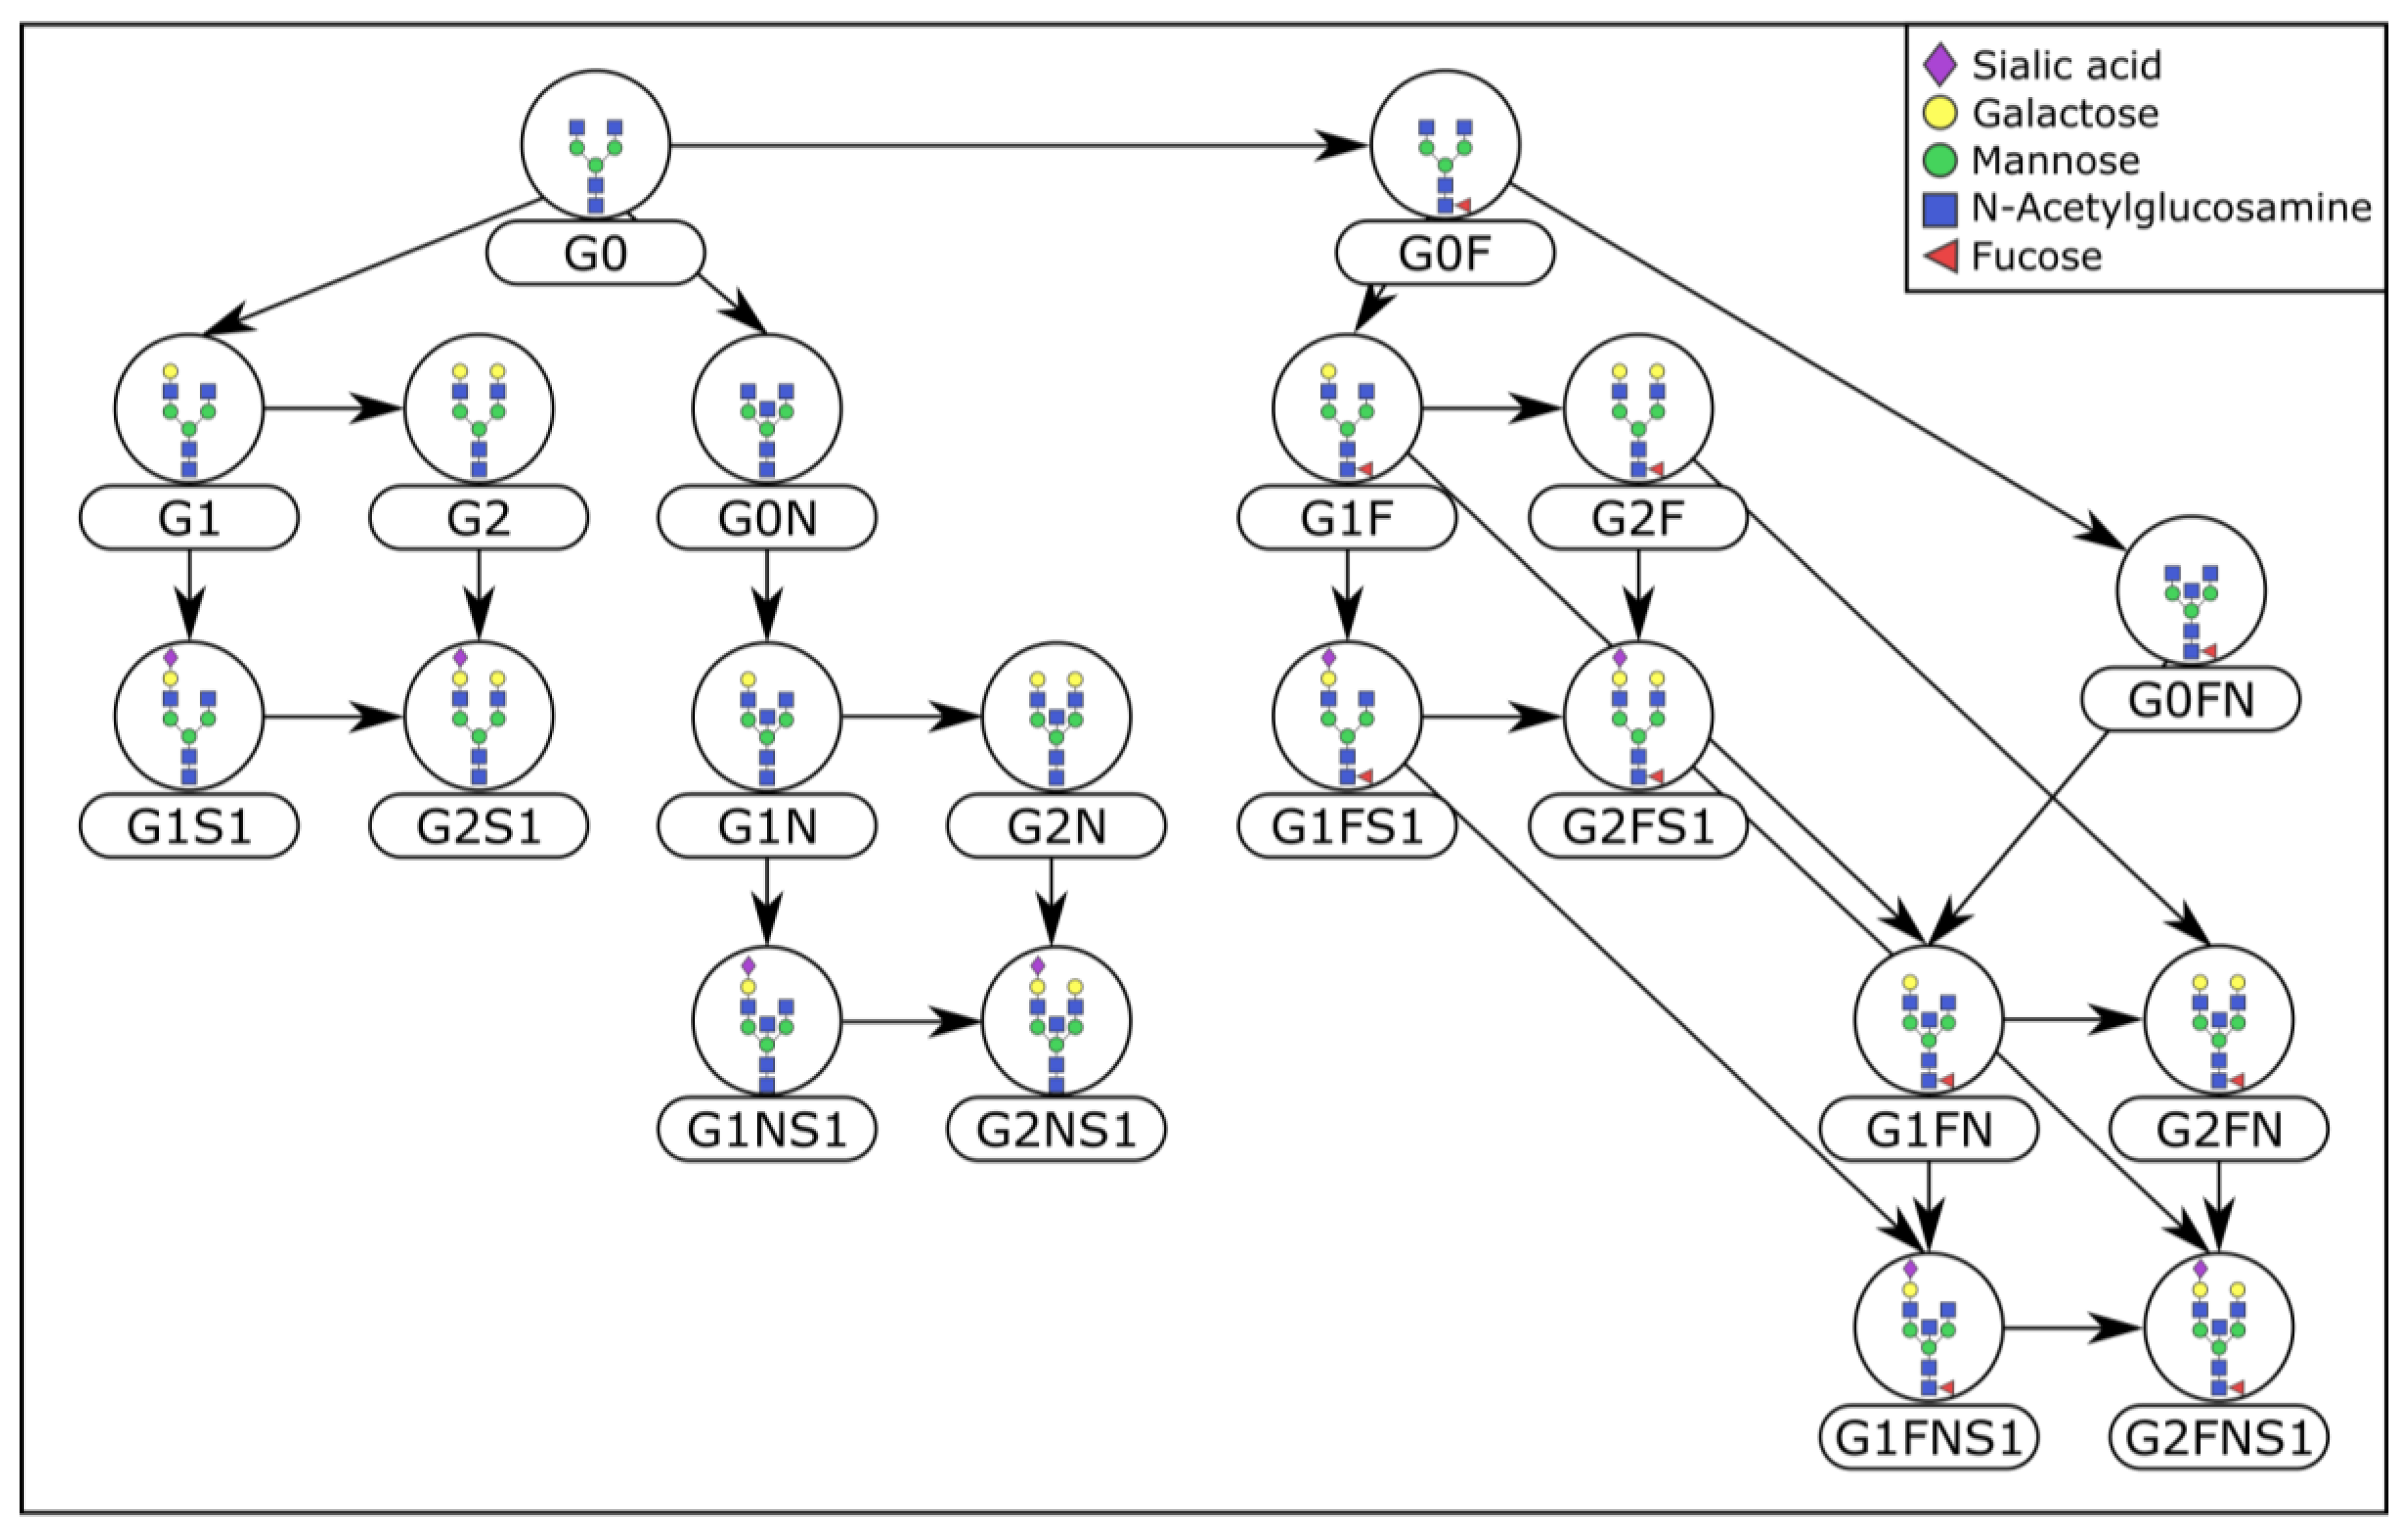
2.3. Prior Knowledge-Based Evaluation
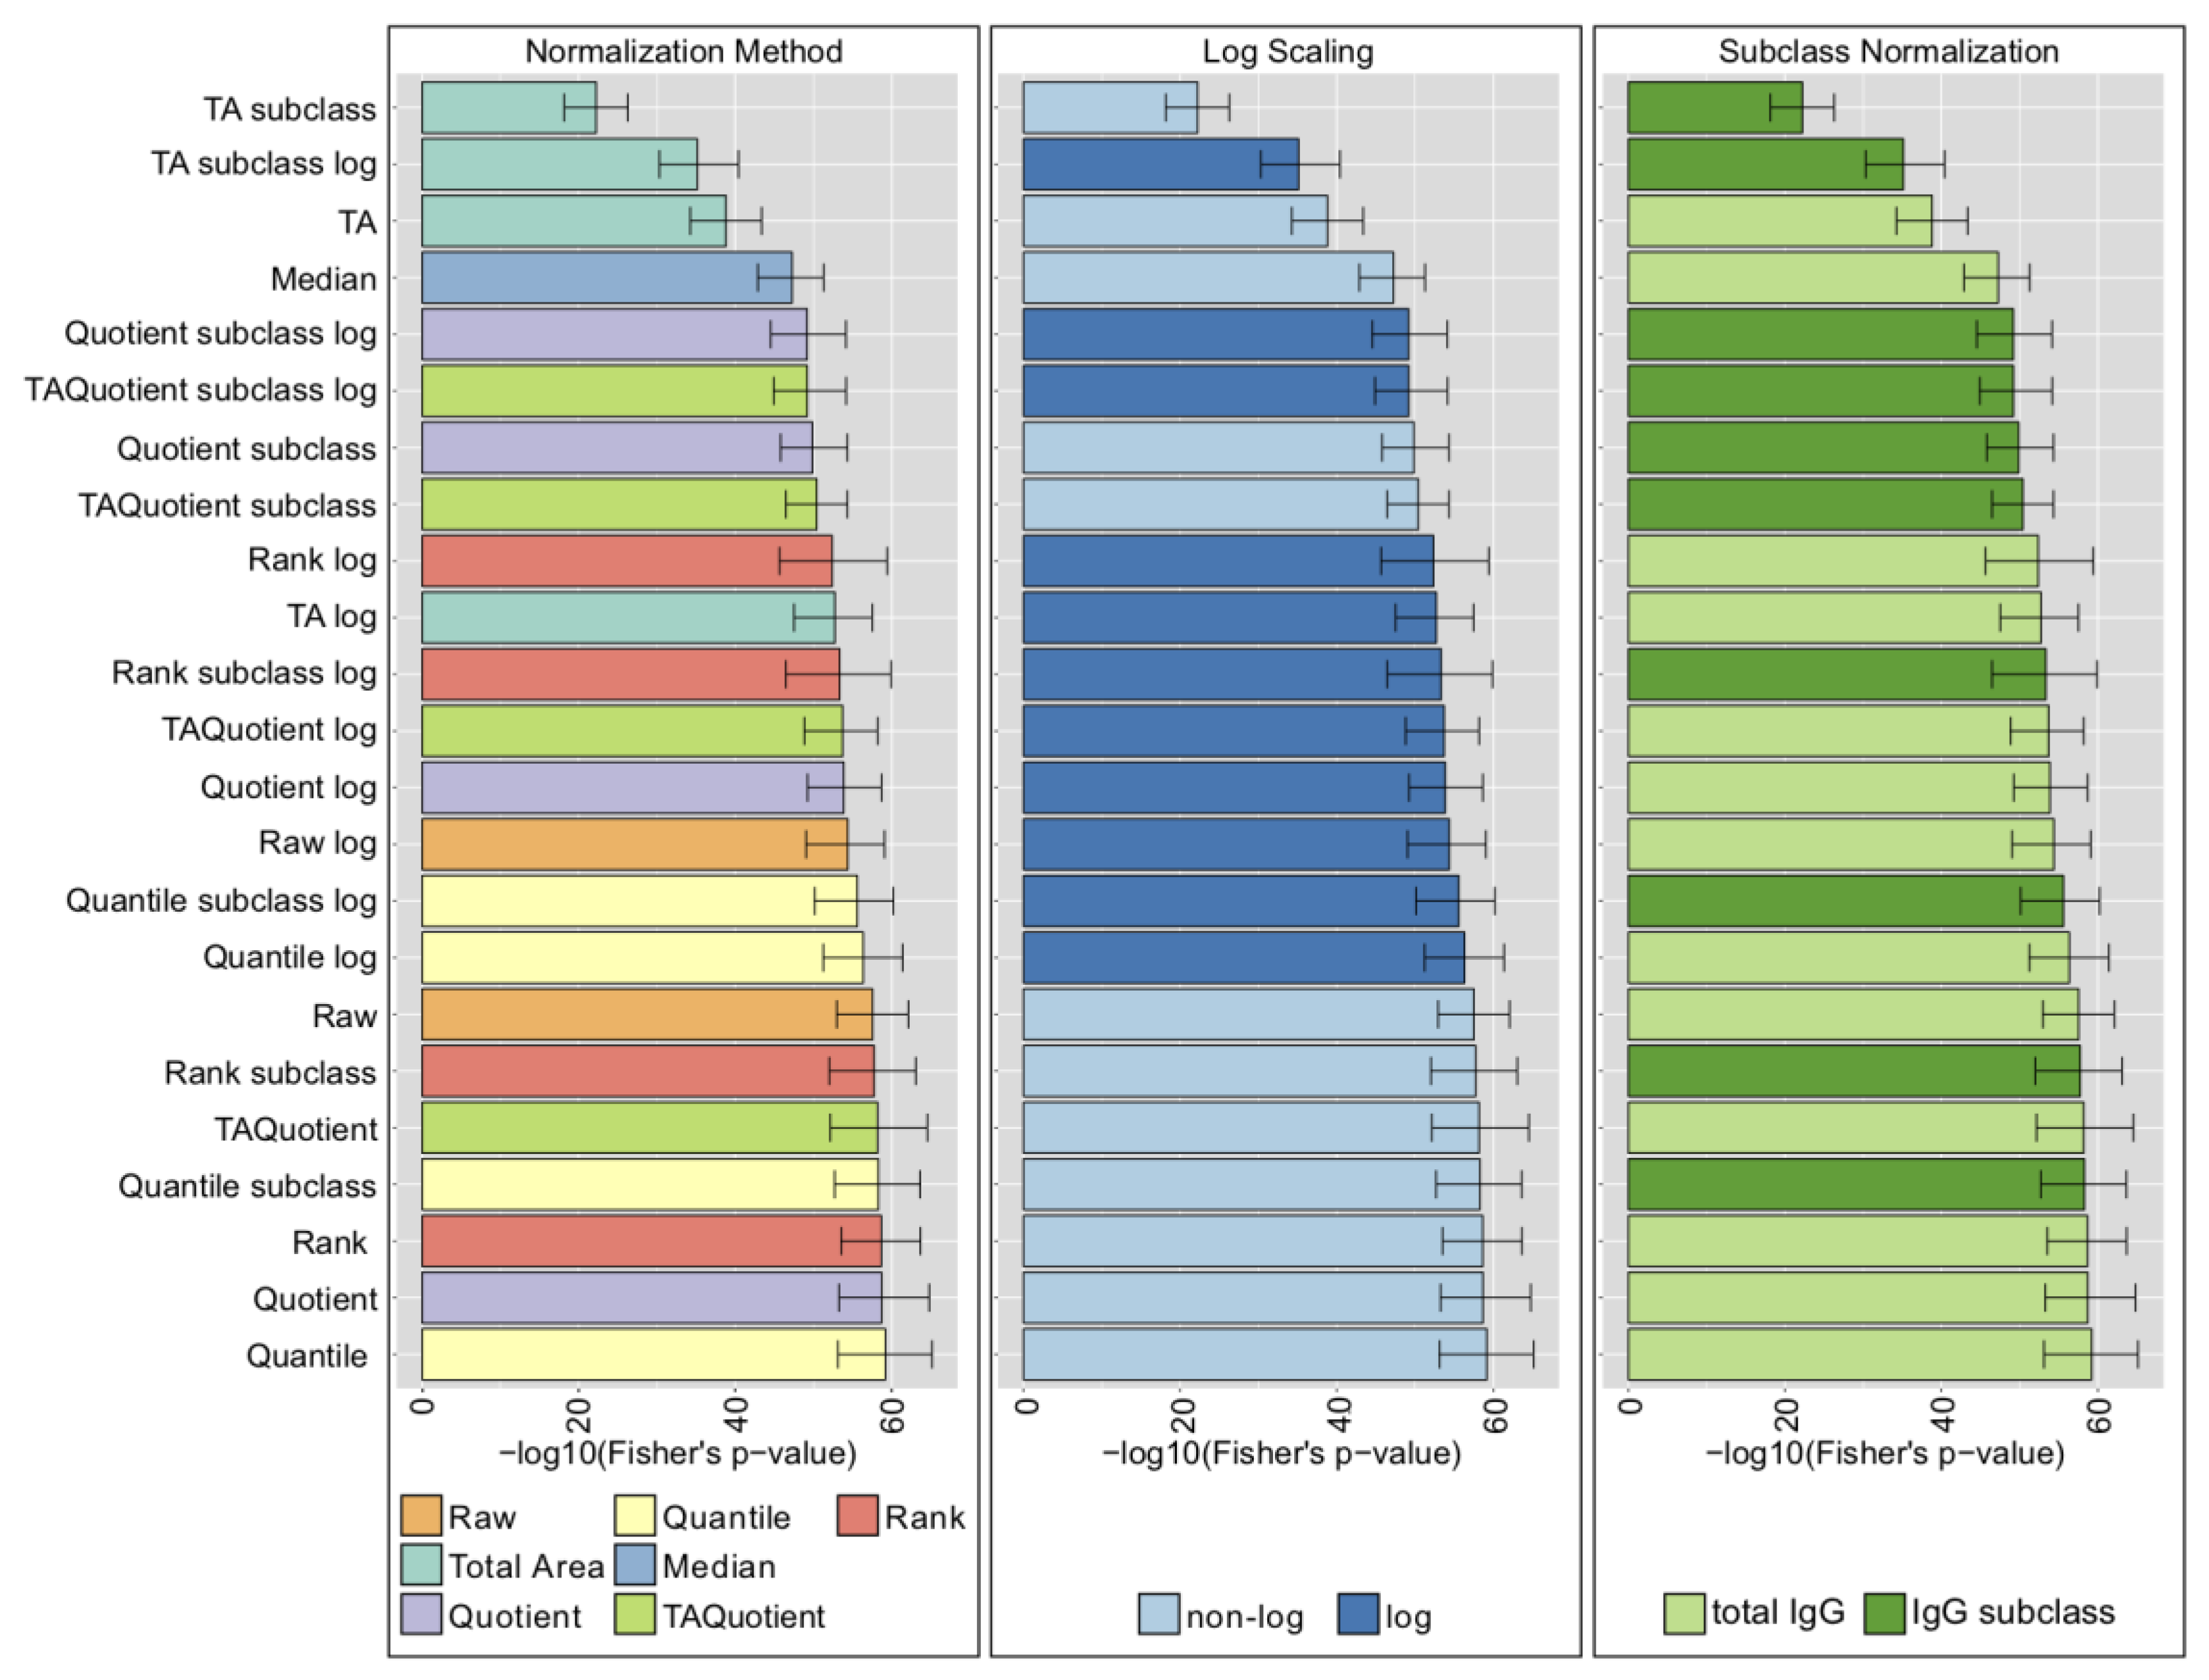
2.4. LC-ESI-MS—IgG Fc N-Glycopeptides
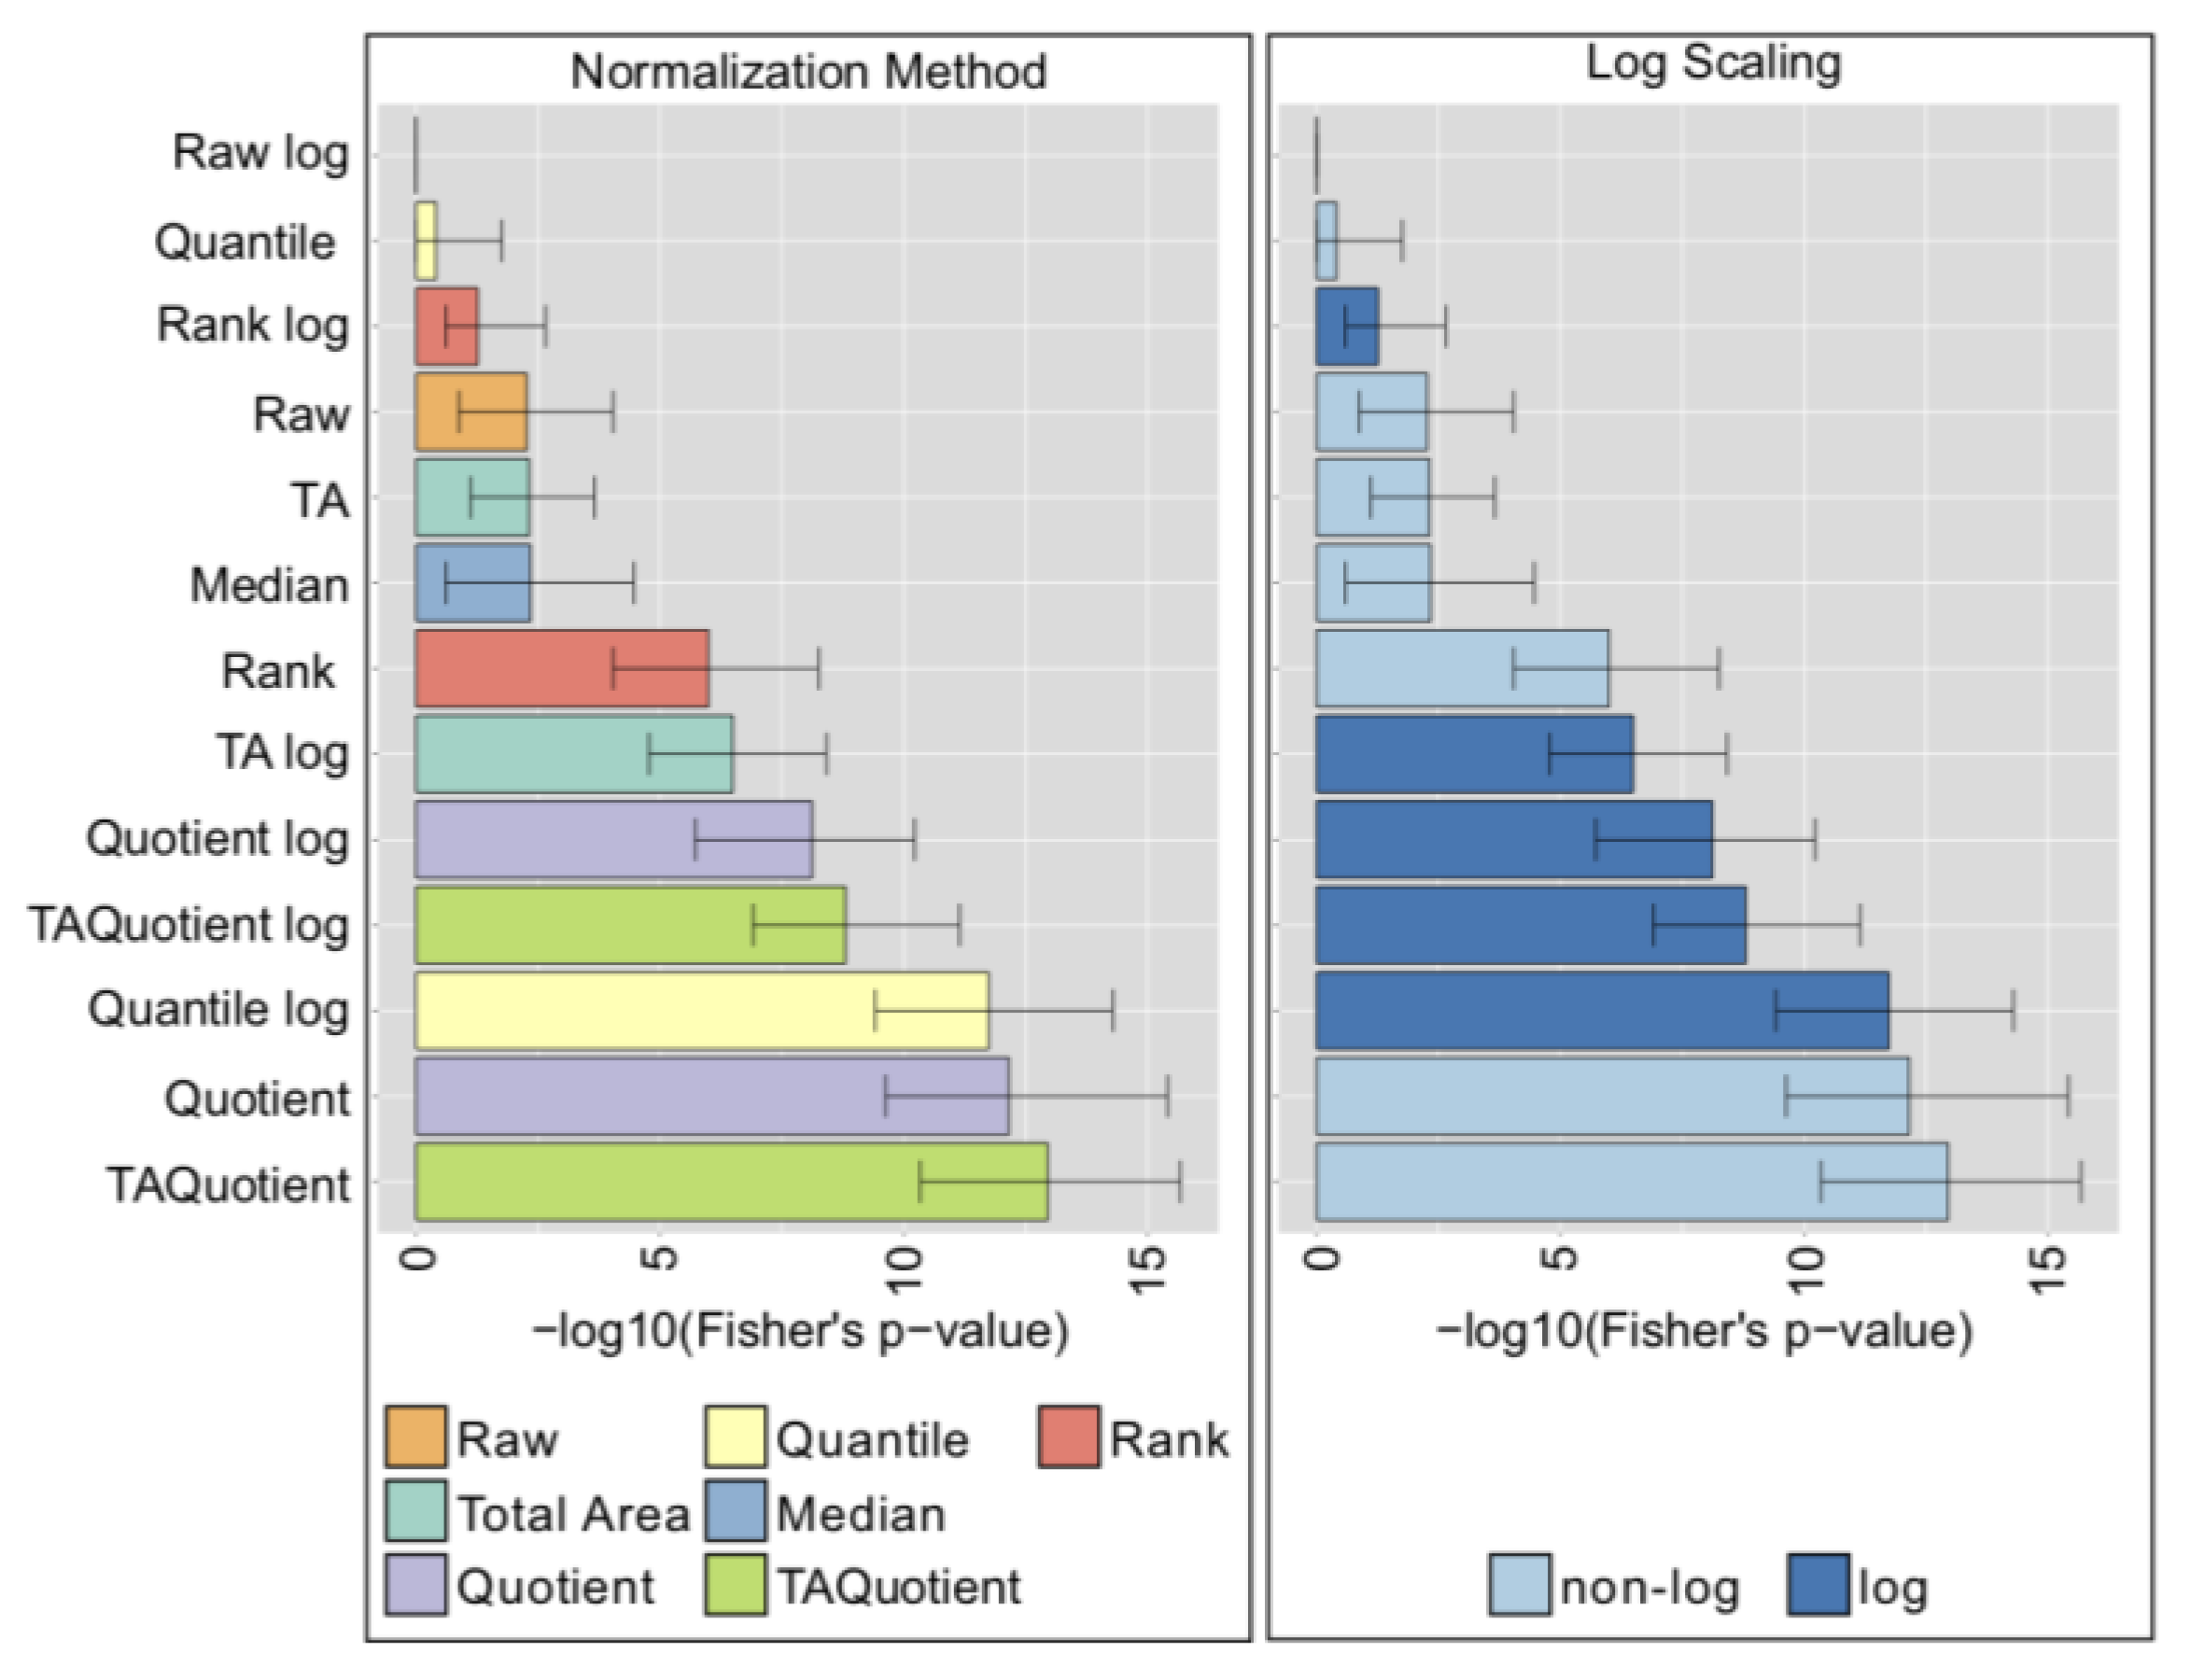
2.5. UHPLC-FLD—Total IgG N-Glycans
2.6. MALDI-FTICR-MS—Total Plasma N-Glycans
2.7. Comparison with Phenotype Association Analysis
3. Discussion
4. Materials and Methods
4.1. Datasets
4.1.1. LC-ESI-MS
4.1.2. UHPLC-FLD
4.1.3. MALDI-FTICR-MS
4.2. Normalization Methods
4.3. Prior Knowledge
4.4. GGM Estimation
4.5. Overlap to the Biological Reference
4.6. Statistical Association with Age
Supplementary Materials
Author Contributions
Funding
Acknowledgments
Conflicts of Interest
Data Availability
References
- Walt, D.; Aoki-Kinoshita, K.F.; Bendiak, B.; Bertozzi, C.R.; Boons, G.J.; Darvill, A.; Hart, G.; Kiessling, L.L.; Lowe, J.; Moon, R.; et al. Transforming Glycoscience: A Roadmap for the Future; National Academies Press: Washington, DC, USA, 2012; pp. 1–209. [Google Scholar]
- Johnstone, D.M.; Riveros, C.; Heidari, M.; Graham, R.M.; Trinder, D.; Berretta, R.; Olynyk, J.K.; Scott, R.J.; Moscato, P.; Milward, E.A. Evaluation of Different Normalization and Analysis Procedures for Illumina Gene Expression Microarray Data Involving Small Changes. Microarrays 2013, 2, 131–152. [Google Scholar] [CrossRef] [PubMed]
- Välikangas, T.; Suomi, T.; Elo, L.L. A systematic evaluation of normalization methods in quantitative label-free proteomics. Brief. Bioinform. 2016, 19, bbw095. [Google Scholar] [CrossRef] [PubMed]
- Van den Berg, R.A.; Hoefsloot, H.C.J.; Westerhuis, J.A.; Smilde, A.K.; van der Werf, M.J. Centering, scaling, and transformations: Improving the biological information content of metabolomics data. BMC Genom. 2006, 7, 142. [Google Scholar] [CrossRef]
- Kohl, S.M.; Klein, M.S.; Hochrein, J.; Oefner, P.J.; Spang, R.; Gronwald, W. State-of-the art data normalization methods improve NMR-based metabolomic analysis. Metabolomics 2012, 8, 146–160. [Google Scholar] [CrossRef]
- Li, B.; Tang, J.; Yang, Q.; Cui, X.; Li, S.; Chen, S.; Cao, Q.; Xue, W.; Chen, N.; Zhu, F. Performance evaluation and online realization of data-driven normalization methods used in LC/MS based untargeted metabolomics analysis. Sci. Rep. 2016, 6, 38881. [Google Scholar] [CrossRef] [PubMed]
- Uh, H.-W.; Klarić, L.; Ugrina, I.; Lauc, G.; Smilde, A.K.; Houwing-Duistermaat, J.J. Choosing proper normalization is essential for discovery of sparse glycan biomarkers. Mol. Omi. 2020, 16, 231–242. [Google Scholar] [CrossRef]
- Houwing-Duistermaat, J.J.; Uh, H.W.; Gusnanto, A. Discussion on the paper ‘Statistical contributions to bioinformatics: Design, modelling, structure learning and integration’ by Jeffrey S. Morris and Veerabhadran Baladandayuthapani. Stat. Model. 2017, 17, 319–326. [Google Scholar] [CrossRef]
- Aitchison, J. The Statistical Analysis of Compositional Data. J. R. Stat. Soc. Ser. B Methodol. 1982, 44, 139–160. [Google Scholar] [CrossRef]
- Gloor, G.B.; Macklaim, J.M.; Pawlowsky-Glahn, V.; Egozcue, J.J. Microbiome datasets are compositional: And this is not optional. Front. Microbiol. 2017, 8, 2224. [Google Scholar] [CrossRef]
- Xia, F.; Chen, J.; Fung, W.K.; Li, H. A logistic normal multinomial regression model for microbiome compositional data analysis. Biometrics 2013, 69, 1053–1063. [Google Scholar] [CrossRef]
- Mandal, S.; van Treuren, W.; White, R.A.; Eggesbø, M.; Knight, R.; Peddada, S.D. Analysis of composition of microbiomes: A novel method for studying microbial composition. Microb. Ecol. Health Dis. 2015, 26, 27663. [Google Scholar] [CrossRef] [PubMed]
- Gloor, G.B.; Reid, G. Compositional analysis: A valid approach to analyze microbiome high-throughput sequencing data. Can. J. Microbiol. 2016, 62, 692–703. [Google Scholar] [CrossRef] [PubMed]
- Chen, E.Z.; Li, H. A two-part mixed-effects model for analyzing longitudinal microbiome compositional data. Bioinformatics 2016, 32, 2611–2617. [Google Scholar] [CrossRef]
- Shi, P.; Zhang, A.; Li, H. Regression analysis for microbiome compositional data. Ann. Appl. Stat. 2016, 10, 1019–1040. [Google Scholar] [CrossRef]
- Aitchison, J. Logratios and natural laws in compositional data analysis. Math. Geol. 1999, 31, 563–580. [Google Scholar] [CrossRef]
- Aitchison, J.; Barceló-Vidal, C.; Martin-Fernández, J.A.; Pawlowsky-Glahn, V. Logratio analysis and compositional distance. Math. Geol. 2000, 32, 271–275. [Google Scholar] [CrossRef]
- Egozcue, J.J.; Pawlowsky-Glahn, V.; Mateu-Figueras, G.; Barcelo-Vidal, C. Isometric logratio transformations for compositional data analysis. Math. Geol. 2003, 35, 279–300. [Google Scholar] [CrossRef]
- Aitchison, J.; Egozcue, J.J. Compositional data analysis: Where are we and where should we be heading? Math. Geol. 2005, 37, 829–850. [Google Scholar] [CrossRef]
- Tsilimigras, M.C.B.; Fodor, A.A. Compositional data analysis of the microbiome: Fundamentals, tools, and challenges. Ann. Epidemiol. 2016, 26, 330–335. [Google Scholar] [CrossRef]
- Callister, S.J.; Barry, R.C.; Adkins, J.N.; Johnson, E.T.; Qian, W.J.; Webb-Robertson, B.J.; Smith, R.D.; Lipton, M.S. Normalization approaches for removing systematic biases associated with mass spectrometry and label-free proteomics. J. Proteome Res. 2006, 5, 277–286. [Google Scholar] [CrossRef]
- Rapaport, F.; Khanin, R.; Liang, Y.; Pirun, M.; Krek, A.; Zumbo, P.; Mason, C.E.; Socci, N.D.; Betel, D. Comprehensive evaluation of differential gene expression analysis methods for RNA-seq data. Genome Biol. 2013, 14, 3158. [Google Scholar] [CrossRef] [PubMed]
- Lauritzen, S.L. Graphical Models; Clarendon Press: Oxford, UK, 1996; Volume 17. [Google Scholar]
- Krumsiek, J.; Suhre, K.; Illig, T.; Adamski, J.; Theis, F.J. Gaussian graphical modeling reconstructs pathway reactions from high-throughput metabolomics data. BMC Syst. Biol. 2011, 5, 21. [Google Scholar] [CrossRef] [PubMed]
- Krumsiek, J.; Suhre, K.; Evans, A.M.; Mitchell, M.W.; Mohney, R.P.; Milburn, M.V.; Wägele, B.; Römisch-Margl, W.; Illig, T.; Adamski, J.; et al. Mining the Unknown: A Systems Approach to Metabolite Identification Combining Genetic and Metabolic Information. PLoS Genet. 2012, 8, e1003005. [Google Scholar] [CrossRef] [PubMed]
- Benedetti, E.; Pučić-Baković, M.; Keser, T.; Wahl, A.; Hassinen, A.; Yang, J.Y.; Liu, L.; Trbojević-Akmačić, I.; Razdorov, G.; Štambuk, J.; et al. Network inference from glycoproteomics data reveals new reactions in the IgG glycosylation pathway. Nat. Commun. 2017, 8, 1483. [Google Scholar] [CrossRef]
- Rudan, I.; Marušić, A.; Janković, S.; Rotim, K.; Boban, M.; Lauc, G.; Grković, I.; Ðogaš, Z.; Zemunik, T.; Vatavuk, Z.; et al. ‘10 001 Dalmatians:’ Croatia Launches Its National Biobank. Croat. Med. J. 2009, 50, 4–6. [Google Scholar] [CrossRef]
- Jefferis, R.; Lefranc, M.-P. Human immunoglobulin allotypes: Possible implications for immunogenicity. MAbs 2009, 1, 332–338. [Google Scholar] [CrossRef]
- Balbin, M.; Grubb, A.; de Lange, G.G.; Grubb, R. DNA sequences specific for Caucasian G3m(b) and (g) allotypes: Allotyping at the genomic level. Immunogenetics 1994, 39, 187–193. [Google Scholar] [CrossRef]
- Vučković, F.; Theodoratou, E.; Thaçi, K.; Timofeeva, M.; Vojta, A.; Štambuk, J.; Pučić-Baković, M.; Rudd, P.M.; Đerek, L.; Servis, D.; et al. IgG Glycome in Colorectal Cancer. Clin. Cancer Res. 2016, 22, 3078–3086. [Google Scholar] [CrossRef]
- Pučić, M.; Knežević, A.; Vidič, J.; Adamczyk, B.; Novokmet, M.; Polašek, O.; Gornik, O.; Šupraha-Goreta, S.; Wormald, M.R.; Redžić, I.; et al. High throughput isolation and glycosylation analysis of IgG-variability and heritability of the IgG glycome in three isolated human populations. Mol. Cell. Proteom. 2011, 10, M111.010090. [Google Scholar] [CrossRef]
- Reiding, K.R.; Ruhaak, L.R.; Uh, H.W.; El Bouhaddani, S.; van den Akker, E.B.; Plomp, R.; McDonnell, L.A.; Houwing-Duistermaat, J.J.; Slagboom, P.E.; Beekman, M.; et al. Human plasma N-glycosylation as analyzed by matrix-assisted laser desorption/ionization-Fourier transform ion cyclotron resonance-MS associates with markers of inflammation and metabolic health. Mol. Cell. Proteom. 2017, 16, 228–242. [Google Scholar] [CrossRef]
- Hansen, K.D.; Irizarry, R.A.; Wu, Z. Removing technical variability in RNA-seq data using conditional quantile normalization. Biostatistics 2012, 13, 204–216. [Google Scholar] [CrossRef] [PubMed]
- Tsodikov, A.; Szabo, A.; Jones, D. Adjustments and measures of differential expression for microarray data. Bioinformatics 2002, 18, 251–260. [Google Scholar] [CrossRef] [PubMed]
- Moh, E.S.X.; Thaysen-Andersen, M.; Packer, N.H. Relative versus absolute quantitation in disease glycomics. PROTEOMICS Clin. Appl. 2015, 9, 368–382. [Google Scholar] [CrossRef]
- Dieterle, F.; Ross, A.; Schlotterbeck, G.; Senn, H. Probabilistic quotient normalization as robust method to account for dilution of complex biological mixtures. Application in1H NMR metabonomics. Anal. Chem. 2006, 78, 4281–4290. [Google Scholar] [CrossRef] [PubMed]
- Do, K.T.; Pietzner, M.; Rasp, D.J.; Friedrich, N.; Nauck, M.; Kocher, T.; Suhre, K.; Mook-Kanamori, D.O.; Kastenmüller, G.; Krumsiek, J. Phenotype-driven identification of modules in a hierarchical map of multifluid metabolic correlations. NPJ Syst. Biol. Appl. 2017, 3, 28. [Google Scholar] [CrossRef] [PubMed]
- Koch, A.L. The logarithm in biology 1. Mechanisms generating the log-normal distribution exactly. J. Theor. Biol. 1966, 12, 276–290. [Google Scholar] [CrossRef]
- Furusawa, C.; Suzuki, T.; Kashiwagi, A.; Yomo, T.; Kaneko, K. Ubiquity of log-normal distributions in intra-cellular reaction dynamics. Biophysics 2005, 1, 25–31. [Google Scholar] [CrossRef]
- Schäfer, J.; Strimmer, K. A shrinkage approach to large-scale covariance matrix estimation and implications for functional genomics. Stat. Appl. Genet. Mol. Biol. 2005, 4, 32. [Google Scholar] [CrossRef]
- Yu, X.; Wang, Y.; Kristic, J.; Dong, J.; Chu, X.; Ge, S.; Wang, H.; Fang, H.; Gao, Q.; Liu, D.; et al. Profiling IgG N-glycans as potential biomarker of chronological and biological ages: A community-based study in a Han Chinese population. Medicine 2016, 95, e4112. [Google Scholar] [CrossRef]
- Krištić, J.; Vučković, F.; Menni, C.; Klarić, L.; Keser, T.; Beceheli, I.; Pučić-Baković, M.; Novokmet, M.; Mangino, M.; Thaqi, K.; et al. Glycans Are a Novel Biomarker of Chronological and Biological Ages. J. Gerontol. Ser. A 2014, 69, 779–789. [Google Scholar] [CrossRef]
- Šunderić, M.; Križáková, M.; Malenković, V.; Ćujić, D.; Katrlik, J.; Nedić, O. Changes Due to Ageing in the Glycan Structure of Alpha-2-Macroglobulin and Its Reactivity with Ligands. Protein J. 2019, 38, 23–29. [Google Scholar] [CrossRef] [PubMed]
- Ruhaak, L.R.; Uh, H.W.; Beekman, M.; Hokke, C.H.; Westendorp, R.G.; Houwing-Duistermaat, J.; Wuhrer, M.; Deelder, A.M.; Slagboom, P.E. Plasma protein N-glycan profiles are associated with calendar age, familial longevity and health. J. Proteome Res. 2011, 10, 1667–1674. [Google Scholar] [CrossRef] [PubMed]
- Vanhooren, V.; Desmyter, L.; Liu, X.E.; Cardelli, M.; Franceschi, C.; Federico, A.; Libert, C.; Laroy, W.; Dewaele, S.; Contreras, R.; et al. N-Glycomic Changes in Serum Proteins during Human Aging. Rejuvenation Res. 2007, 10, 521–531a. [Google Scholar] [CrossRef]
- Do, K.T.; Wahl, S.; Raffler, J.; Molnos, S.; Laimighofer, M.; Adamski, J.; Suhre, K.; Strauch, K.; Peters, A.; Gieger, C.; et al. Characterization of missing values in untargeted MS-based metabolomics data and evaluation of missing data handling strategies. Metabolomics 2018, 14, 128. [Google Scholar] [CrossRef] [PubMed]
- Selman, M.H.; Derks, R.J.; Bondt, A.; Palmblad, M.; Schoenmaker, B.; Koeleman, C.A.; van de Geijn, F.E.; Dolhain, R.J.; Deelder, A.M.; Wuhrer, M. Fc specific IgG glycosylation profiling by robust nano-reverse phase HPLC-MS using a sheath-flow ESI sprayer interface. J. Proteom. 2012, 75, 1318–1329. [Google Scholar] [CrossRef] [PubMed]
- Huffman, J.E.; Pučić-Baković, M.; Klarić, L.; Hennig, R.; Selman, M.H.; Vučković, F.; Novokmet, M.; Krištić, J.; Borowiak, M.; Muth, T.; et al. Comparative performance of four methods for high-throughput glycosylation analysis of immunoglobulin G in genetic and epidemiological research. Mol. Cell. Proteom. 2014, 13, 1598–1610. [Google Scholar] [CrossRef]
- Theodoratou, E.; Kyle, J.; Cetnarskyj, R.; Farrington, S.M.; Tenesa, A.; Barnetson, R.; Porteous, M.; Dunlop, M.; Campbell, H. Dietary flavonoids and the risk of colorectal cancer. Cancer Epidemiol. Biomark. Prev. 2007, 16, 684–693. [Google Scholar] [CrossRef]
- Schoenmaker, M.; de Craen, A.J.; de Meijer, P.H.; Beekman, M.; Blauw, G.J.; Slagboom, P.E.; Westendorp, R.G. Evidence of genetic enrichment for exceptional survival using a family approach: The Leiden Longevity Study. Eur. J. Hum. Genet. 2006, 14, 79–84. [Google Scholar] [CrossRef]
- Aitchison, J. A Concise Guide to Compositional Data Analysis. CDA Work. Girona 2003, 24, 73–81. [Google Scholar]
- Bolstad, B.M.; Irizarry, R.; Astrand, M.; Speed, T.P. A comparison of normalization methods for high density oligonucleotide array data based on variance and bias. Bioinformatics 2003, 19, 185–193. [Google Scholar] [CrossRef]
- Taniguchi, N.; Honke, K.; Fukuda, M. Handbook of Glycosyltransferases and Related Genes; Springer Science & Business Media: Berlin, Germany, 2012. [Google Scholar]
- Benjamini, Y.; Hochberg, Y. Controlling the false discovery rate: A practical and powerful approach to multiple testing. J. R. Stat. Soc. B 1995, 57, 289–300. [Google Scholar] [CrossRef]
- Seneta, E.; Phipps, M.C. On the Comparison of Two Observed Frequencies. Biom. J. 2001, 43, 23–43. [Google Scholar] [CrossRef]
- Phipps, M.C. Inequalities between Hypergeometric Tails. J. Appl. Math. Decis. Sci. 2003, 7, 165–174. [Google Scholar] [CrossRef]
- Routledge, R.; Rick, R. Fisher’s Exact Test. In Encyclopedia of Biostatistics; John Wiley & Sons, Ltd.: Chichester, UK, 2005. [Google Scholar]
| LC-ESI-MS | UHPLC-FLD | MALDI-FTICR-MS | ||||
|---|---|---|---|---|---|---|
| Dataset Name | Korčula 2013 | Korčula 2010 | Split | Vis | CRC Controls | LLS |
| Glycans measured | IgG Fc | IgG Fc | IgG Fc | IgG Fc | IgG total | Total plasma |
| Number of peaks | 50 | 50 | 50 | 50 | 24 | 61 |
| Number of samples for analysis | 669 | 504 | 980 | 395 | 535 | 2056 |
| Age range (mean ± SD) | 18–88 (53.2 ± 16.3) | 18–98 (56.4 ± 13.6) | 18–85 (50.3 ± 14.3) | 18–91 (55.8 ± 15.2) | 21–74 (51.6 ± 5.9) | 30–80 (59.2 ± 6.7) |
| Normalization | Label | Group |
|---|---|---|
| Raw | Raw | Basic Normalizations |
| Quantile per glycan | Quantile | |
| Rank per glycan | Rank | |
| Total Area | TA | |
| Median Centering | Median | |
| Probabilistic Quotient | Quotient | |
| Total Area + Probabilistic Quotient | TAQuotient | |
| log(Raw) | Raw log | Logarithm |
| log(Quantile per glycan) | Quantile log | |
| log(Rank per glycan) | Rank log | |
| log(Total Area) | TA log | |
| log(Probabilistic Quotient) | Quotient log | |
| log(Total Area + Probabilistic Quotient) | TAQuotient log | |
| (Quantile per glycan) per IgG subclass | Quantile subclass | Per Subclass |
| (Rank per glycan) per IgG subclass | Rank subclass | |
| (Total Area) per IgG subclass | TA subclass | |
| (Probabilistic Quotient) per IgG subclass | Quotient subclass | |
| (Total Area + Probabilistic Quotient) per IgG subclass | TAQuotient subclass | |
| (log(Quantile per glycan)) per IgG subclass | Quantile log subclass | |
| (log(Rank per glycan) per IgG subclass | Rank log subclass | |
| (log(Total Area)) per IgG subclass | TA log subclass | |
| (log(Probabilistic Quotient)) per IgG subclass | Quotient log subclass | |
| (log(Total Area + Probabilistic Quotient)) per IgG subclass | TAQuotient log subclass |
| Platform | LC-ESI-MS | UHPLC-FLD | MALDI-FTICR | ||||||
|---|---|---|---|---|---|---|---|---|---|
| Dataset | Korčula 2013 | Korčula 2010 | Split | Vis | LC-ESI-MS Average | CRC Controls | LLS | Weighted Average across Platforms | |
| Normalization | |||||||||
| TAQuotient log | 0.340 | 0.680 | 0.700 | 0.740 | 0.615 | 0.625 | 0.590 | 0.610 | |
| Quotient log | 0.340 | 0.660 | 0.700 | 0.740 | 0.610 | 0.625 | 0.590 | 0.608 | |
| Quotient | 0.320 | 0.660 | 0.740 | 0.680 | 0.600 | 0.583 | 0.574 | 0.586 | |
| TAQuotient | 0.320 | 0.660 | 0.740 | 0.660 | 0.595 | 0.583 | 0.574 | 0.584 | |
| TA log | 0.360 | 0.700 | 0.760 | 0.700 | 0.630 | 0.542 | 0.475 | 0.549 | |
| TA | 0.300 | 0.720 | 0.780 | 0.720 | 0.630 | 0.500 | 0.475 | 0.535 | |
| Quantile | 0.220 | 0.600 | 0.700 | 0.640 | 0.540 | 0.000 | 0.279 | 0.273 | |
| Raw | 0.180 | 0.560 | 0.700 | 0.620 | 0.515 | 0.000 | 0.279 | 0.265 | |
| Rank | 0.220 | 0.520 | 0.700 | 0.580 | 0.505 | 0.000 | 0.262 | 0.256 | |
| Quantile log | 0.220 | 0.560 | 0.700 | 0.580 | 0.515 | 0.000 | 0.246 | 0.254 | |
| Median | 0.220 | 0.520 | 0.560 | 0.640 | 0.485 | 0.000 | 0.246 | 0.244 | |
| Raw log | 0.220 | 0.560 | 0.680 | 0.540 | 0.500 | 0.000 | 0.213 | 0.238 | |
| Rank log | 0.140 | 0.400 | 0.620 | 0.540 | 0.425 | 0.000 | 0.115 | 0.180 | |
© 2020 by the authors. Licensee MDPI, Basel, Switzerland. This article is an open access article distributed under the terms and conditions of the Creative Commons Attribution (CC BY) license (http://creativecommons.org/licenses/by/4.0/).
Share and Cite
Benedetti, E.; Gerstner, N.; Pučić-Baković, M.; Keser, T.; Reiding, K.R.; Ruhaak, L.R.; Štambuk, T.; Selman, M.H.J.; Rudan, I.; Polašek, O.; et al. Systematic Evaluation of Normalization Methods for Glycomics Data Based on Performance of Network Inference. Metabolites 2020, 10, 271. https://doi.org/10.3390/metabo10070271
Benedetti E, Gerstner N, Pučić-Baković M, Keser T, Reiding KR, Ruhaak LR, Štambuk T, Selman MHJ, Rudan I, Polašek O, et al. Systematic Evaluation of Normalization Methods for Glycomics Data Based on Performance of Network Inference. Metabolites. 2020; 10(7):271. https://doi.org/10.3390/metabo10070271
Chicago/Turabian StyleBenedetti, Elisa, Nathalie Gerstner, Maja Pučić-Baković, Toma Keser, Karli R. Reiding, L. Renee Ruhaak, Tamara Štambuk, Maurice H.J. Selman, Igor Rudan, Ozren Polašek, and et al. 2020. "Systematic Evaluation of Normalization Methods for Glycomics Data Based on Performance of Network Inference" Metabolites 10, no. 7: 271. https://doi.org/10.3390/metabo10070271
APA StyleBenedetti, E., Gerstner, N., Pučić-Baković, M., Keser, T., Reiding, K. R., Ruhaak, L. R., Štambuk, T., Selman, M. H. J., Rudan, I., Polašek, O., Hayward, C., Beekman, M., Slagboom, E., Wuhrer, M., Dunlop, M. G., Lauc, G., & Krumsiek, J. (2020). Systematic Evaluation of Normalization Methods for Glycomics Data Based on Performance of Network Inference. Metabolites, 10(7), 271. https://doi.org/10.3390/metabo10070271


