Abstract
The development of analytical procedures, in line with the recent regulatory requirements ICH Q2 (R2) and ICH Q14, is progressing, and it must be able to manage the entire life cycle of the methodology. This is also applicable to and especially challenging for combinations of drug substances and dosage form. A reliable and efficient, stability-indicating, MS-compatible, reverse-phase ultra-performance liquid chromatographic (UPLC®) method was developed for the determination of carvedilol and felodipine in a combination oral dosage form. The development of the method, performed using analytical quality by design (AQbD) principles, was in line with the future regulatory requirements. Furthermore, the fixed-dose combination dosage forms are a clear solution to the polypharmacy phenomenon in the elderly population. The main factors evaluated were the mobile phase buffer, organic modifier, column, flow, and column temperature. The optimum conditions were achieved with a Waters Acquity HSS T3 (100 × 2.1 mm i.d., 1.8 µm) column at 38 °C, using ammonium acetate buffer (5 mM, pH 4.5) (Solution A) and MeOH (Solution B) as mobile phases in gradient elution (t = 0 min, 10% B; t = 1.5 min, 10% B; t = 12.0 min, 90% B; t = 13.0 min, 10% B; t = 15.5 min, 10% B) at a flow rate of 0.2 mL/min and UV Detection of 240 and 362 nm for carvedilol (CAV) and felodipine (FLP), respectively. The linearity was demonstrated over concentration ranges of 30–650 µg/mL (R2 = 0.9984) (CAV) and 32–260 µg/mL (R2 = 0.9996) (FLP). Forced degradation studies were performed by subjecting the samples to hydrolytic (acid and base), oxidative, and thermal stress conditions. Standard solution stability was also performed. The proposed validated method was successfully used for the quantitative analysis of bulk, stability, and fixed-dose combination dosage form samples of the desired drug product. Using the AQbD principles, it is possible to generate methodologies with improved knowledge, leading to high-quality data, lower operation costs, and minimum regulatory risk. Furthermore, this work paves the way for providing a platform of robust analytical methods for the simultaneous quantification of innovative on-demand new dose combinations.
1. Introduction
Lately, personalized medicine has been a very active topic within the pharmaceutical industry. This approach addresses the individual requirements of patients, their preferences, social contexts, etc. [1]. Treating complex chronic diseases in combination with satisfying individual patient demands has led to the development of novel dose combinations in response to these challenges. The prescription of several active pharmaceutical ingredients (APIs) to one particular patient is a very common clinical practice. Drug combinations offer a solution in terms of patient convenience and treatment adherence. This being said, it becomes a challenge, including the involvement of the regulatory bodies, particularly in the development of compliant analytical procedures, to analyze combination dosage forms [2]. There are already efforts being made by the United States Pharmacopoeia (USP) to modernize and include fixed-dose combinations (FDC) in their monographs [3].
As there are already established individual monographs for analysis, one approach could be to perform the testing in a separate manner. This would result in a waste of effort and economic resources. Instead, having a combined approach would facilitate the analysis of the QC labs within the pharmaceutical industry. It is clear that the analytical methodologies need to be compliant with traditional requirements such as stability-indicating features [4], chromatographic performance [5], development [6], and validation [7]. Additionally, this approach is preferred by the USP, considering the opportunities made for external sponsors and global laboratories in their recent submissions [8].
Carvedilol (CAV) is a vasodilating, nonselective, third-generation β-blocker without the negative hemodynamic and metabolic effects of traditional β-blockers [9]. It is also a preferred choice for the treatment of heart failure, hypertension, and left ventricular dysfunctions [10]. Carvedilol competitively blocks β1, β2, and α1-adrenoceptors and has additional antioxidant and antiproliferative effects, improving ventricular function and reducing mortality and morbidity in patients with chronic heart failure [11].
Felodipine (FLP) is a vascular-selective dihydropyridine calcium channel blocker which lowers arterial blood pressure by decreasing peripheral vascular resistance [12]. Felodipine selectively dilates systemic, but not pulmonary, arterioles, has no effect on venous vessels, and is well-tolerated [12,13].
The intention of the use of a combination of different antihypertensive drugs is to improve blood pressure and provide enhanced efficacy and similar tolerability to the same or higher dosages of the individual drugs administered as monotherapy [12]. Controlled double-blind clinical trials have demonstrated that combinations of calcium channel blockers and beta blockers result in augmented symptom benefits compared with either drug class alone [14]. The predominant mechanism responsible for such improvement is increased lowering of myocardial oxygen demand by virtue of additive diminution in heart rate, blood pressure, and, consequently, pressure-rate product both at rest and during exercise [14]. A combined therapy with calcium channel blockers and beta blockers is also an important contribution to the treatment of patients that remain symptomatic during single-drug treatment [14]. However, the appearance of additive adverse cardiac effects requires close clinical monitoring and careful selection of patients [14].
There are several references to HPLC procedures for the elution of CAV [15,16,17,18] and FLP [19,20,21,22], each of them in combination with other components [23,24]. However, no analytical methods are available for the quantification of CAV and FLP in a dose combination. Additionally, none of the analytical methodologies are developed under the Analytical Quality by Design (AQbD) principles, which are currently becoming present in product fillings [25].
The main target of Quality by Design (QbD) is product design taking into account consistent performance as well as quality [26]. In terms of analytical applications, it pursues an analytical methodology that systematically achieves its intended goal [27]. Basically, its approach comes from conducting a thorough risk assessment and framing its parameters of control. The method is built based on data evaluations and decisions from experimental work [28,29,30,31]. As a first step, the method is defined with purpose suitability as an analytical target profile (ATP) together with a quality target product profile (QTPP) [32,33,34,35,36,37]. Furthermore, upon evaluation, regulatory requirements like pharmacopoeia compliance and ICH Q2 [7] are especially considered. On the ATP, the critical method attributes (CMeAs) are defined with the acceptance criteria, while the critical method parameters (CMePs) are investigated to restrict their influence on method performance and improve the understanding between the CMeAs and CMePs that conjointly strengthen the impact the results. A classic tool of investigation for this is applied mathematics involved in the design of experiments (DoE) [27,29,33,34,38,39].
It is certain that the AQbD improves the process of cutting down the out-of-trend (OOT) and out-of-specification (OOS) because of its strategy of risk assessment, which is extremely helpful and saves costs of analytical testing and deviations [34].
A QbD approach also provides the potential for improved regulatory filings through enhanced understanding of the method and risk-based regulatory flexibility during life cycle management [40,41,42,43]. Presently, the concept of life cycle management is gaining more importance in the development of products, and analytical methods are not an exception. The newly implemented USP chapter <1220>, the analytical procedure life cycle, presents an alternative framework for analytical methods and incorporates all the events during its life cycle in order to demonstrate its suitability for intended purpose [44]. The application of life cycle management to analytical methods provides the chance to apply the scientific knowledge from the development of the method into quality risk assessment and continuous improvement [45]. Overall, this approach is aligned and works as an extension of the current pharmaceutical guidelines [6,29,30,31,43,44] with QbD conceptuality.
As a systematic approach, the steps of AQbD implementation are defined in Figure 1.

Figure 1.
AQbD flowchart, adapted from Watson [46].
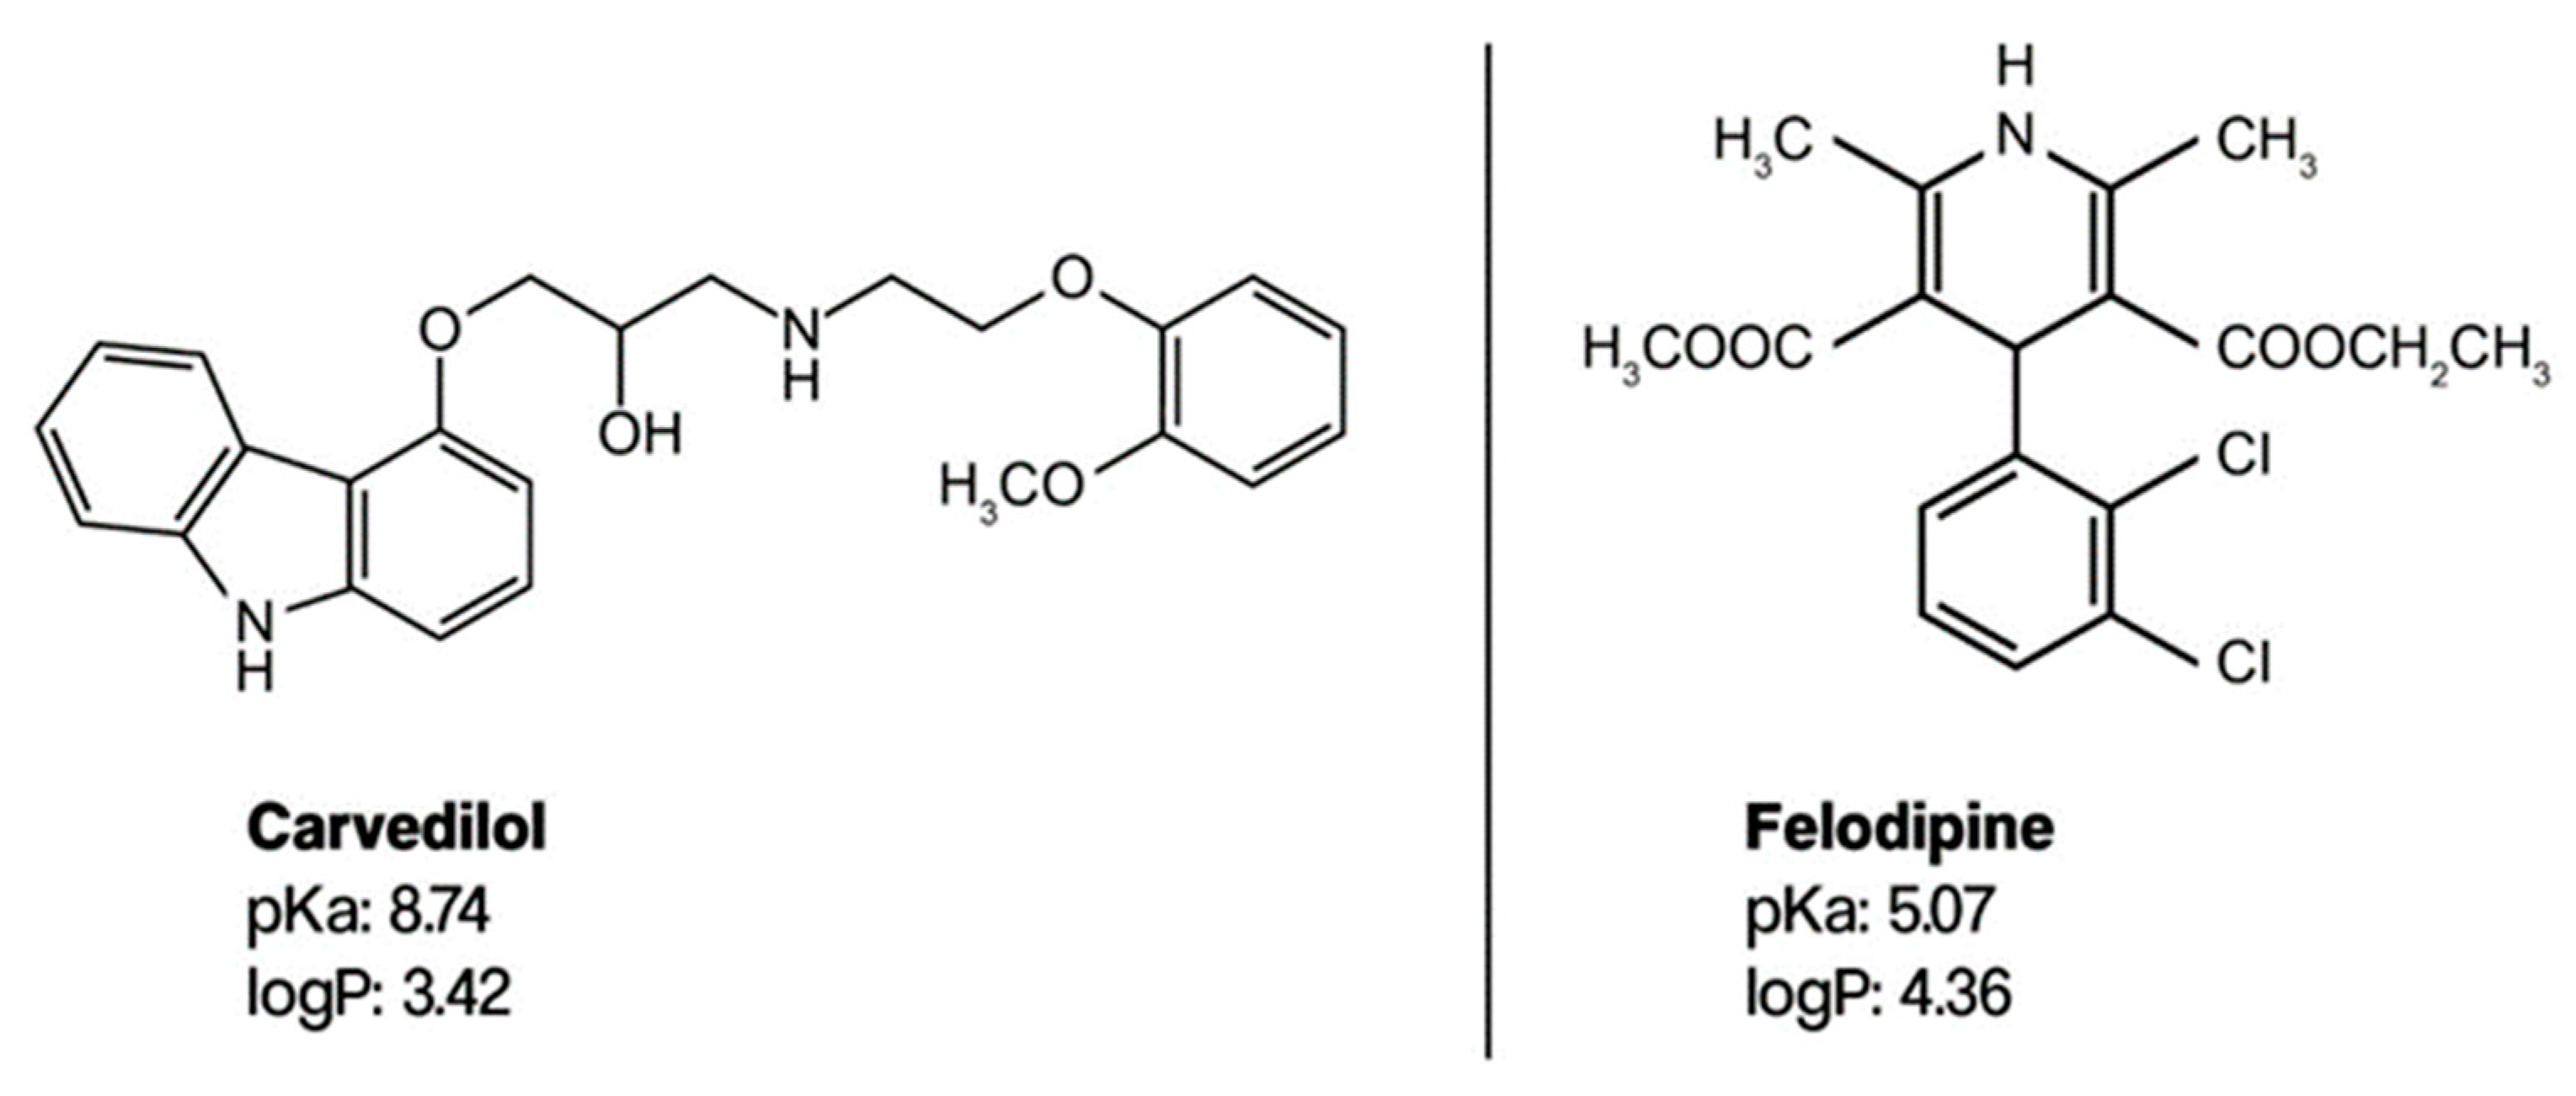
Carvedilol and felodipine (Figure 2) have pKa values of 8.7 and 5.07 and logP values of 3.05 and 4.36 [32], respectively. The pKa values are relevant because they inform us about the ionization state of the compounds under the chromatographic conditions, which can also influence their interaction with the stationary phase and the mobile phase. Given the logP values of carvedilol and felodipine, one can anticipate that these compounds would exhibit considerable retention on non-polar stationary phases, with felodipine likely showing stronger retention than carvedilol due to its higher logP value.
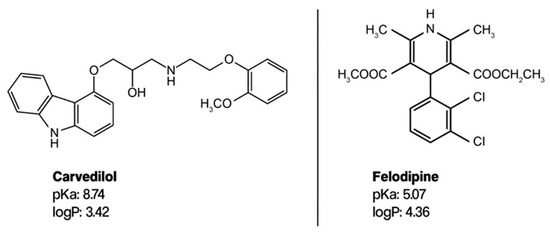
Figure 2.
Molecular structure of carvedilol and felodipine.
2. Materials and Methods
2.1. Chemicals and Reagents
Acetonitrile and methanol of HPLC grade were acquired from VWR (Radnor, PA, USA). Ammonium acetate (99%) for HPLC was purchased from Loba Chemie PVT. LTD (Mumbai, India), and hydrochloric acid and formic acid from Carl Roth (Karlsruhe, Germany). Sodium hydroxide pellets were obtained from Merck-Supelco (Darmstadt, Germany), and hydrogen peroxide solution (>30%) was used for trace analysis. Ammonium bicarbonate (99.5%) and ammonium formate (99%) were obtained from Sigma Aldrich (St. Louis, MO, USA). The water used for all analyses came from the purification equipment 08.1205 of TKA Germany (Niederelbert, Germany). All sample solutions were filtered before injection into the chromatograph using glass fiber Whatman CELTRON 30/0-45 CA-GF 92 0.45 µm filters from Sigma Aldrich (St. Louis, MO, USA). As the sample diluent, a mixture 70:30 of acetonitrile:water was selected.
2.2. Standards, Samples, and Excipients
The APIs and reference working standards of carvedilol (purity of 99.67%) and felodipine (purity of 99.7%) were acquired from Dacon Natural Products (Qingdao Shandong, China). As excipients, agglomerated lactose Tabletosse® 100 was acquired from MEGGLE GmBH & Co., (Wasserburg, Germany), and sodium starch glycolate Explotab® from JRS Pharma (Polanco, Spain). Cellulose microcristaline Avicel® PH102 was supplied by Dupont—Pharma, (Wilmington, NC, USA) and magnesium stearate (Cometa System) from Aptuit (Verona, Italy). The dosage form was prepared in capsules using HPMC VCaps® capsules, size 00, from Lonza Group AG (Basel, Switzerland). The quantitative composition is presented in Table 1.

Table 1.
Quantitative composition of the studied dosage form.
The studied formulations were prepared by layering blends, which were then mixed using a Turbula T2F mixer from WAG Group, Germany, at 75 rpm for 20 min. Following this, magnesium stearate was added, and the mixture was further blended for an additional 1.5 min. Subsequently, the capsules were manually filled.
2.3. Equipment
A reversed-phase ultra-performance liquid chromatograph (Acquity H-Class from Waters Corp. (Milford, CT, USA)) was equipped with a photo-diode array detector (PDA) and coupled to a mass single-quadrupole detector (QDa) with an electrospray ionization interface. The configuration for the QDa analysis included an MS scan range of 100–900 Da in positive mode, a probe temperature set at 400 °C, a cone voltage of 15 V, and capillary voltages of 1.5 kV for positive and 0.8 kV for negative modes. The equipment was commanded by the chromatographic software Empower 3 from Waters Corp. (Milford, CT, USA) and used for the development, analysis, and validation of the method. The chromatographic columns used were from Waters Corp. (Milford, CT, USA), including an Acquity UPLC BEH C18 (2.1 × 100 mm; 1.7 µm), Acquity UPLC HSS T3 (2.1 × 100 mm; 1.8 µm), and Xbridge BEH Phenyl (2.1 × 100 mm; 2.5 µm). Additionally, a Poroshell120 EC-C8 (2.1 × 100 mm; 2.7 µm) from Agilent Technologies (Santa Clara, CA, USA) was also utilized. The pH measurements were performed with a FiveEasy (FE20) pH meter from Mettler Toledo (Columbus, OH, USA). The statistical analysis was performed using Design-Expert® 14.2.0 software from Stat-Ease Inc. (Minneapolis, MN, USA).
2.4. Method Validation
2.4.1. Specificity
The specificity of a method is its ability to unambiguously identify and separate the analyte in the presence of other components, such as degradation products, impurities, other active ingredients, excipients, and matrix components [7]. Specificity was tested on the mobile phase, diluent, reference solution, matrix formulation components, and final product. The chromatograms were recorded and evaluated to assess their purity plots.
2.4.2. Forced Degradation Studies
In order to demonstrate the stability-indicating characteristics, a forced degradation study was performed. Specific quantities of each API, representing a 100% concentration, were weighted and combined with placebo. Samples were dissolved in the diluent. All solutions were prepared in 100 mL flasks and subjected to the following conditions:
- Acid hydrolysis: exposure to 5.0 mL of hydrochloric acid (HCl) 1 N for 1 h;
- Alkaline hydrolysis: exposure to 5.0 mL of sodium hydroxide (NaOH) 1 N for 1 h;
- Oxidation: exposure to 2.5 mL of hydrogen peroxide (H2O2) 30% for 30 min;
- Thermolysis: exposure to heat (65 °C) in a steam bath for 1 h.
For the forced degradation studies, exposure times ranging from 30 min to 1 h were selected based on initial experiments and established industry norms. This duration was chosen to facilitate substantial, but not total, degradation of the API, enabling a detailed examination of its degradation pathway. This approach aligns with the ICH Q1A(R2) [47] guidelines, which, while advocating for stress testing to pinpoint degradation products, do not mandate precise exposure durations. Instead, they grant researchers the latitude to determine the optimal balance between observing meaningful degradation and preserving the sample’s integrity.
In cases of acid and alkaline hydrolyses, once the exposure time was over, the samples were neutralized with NaOH and HCl solutions, respectively, and filled with diluent solution. The possible degradation was screened by comparing the obtained chromatograms with a control sample.
These analyses were completed with the purity study of the chromatographic peak corresponding to each analyte.
2.4.3. Linearity
The linearity of an analytical procedure shows that the obtained results are directly proportional to the relevant concentration range of the analyte [7]. Five groups of solutions, in triplicate at concentrations between 70 and 130% of the declared content/labelled claim, were prepared by dilution and dissolving in the diluent [48].
2.4.4. Accuracy
The accuracy of an analytical procedure gives an indication of systematic uncertainties in the results. It is the degree of agreement between the expected value or the reference value and the value obtained [7]. Solutions of both APIs at three concentrations levels of 70, 100, and 130% of the declared content/labeled claim were prepared by weighing (n = 3) (including excipient matrix) and dissolving in the diluent, then further analyzed.
2.4.5. Precision (Repeatability and Intermediate Precision)
The precision of an analytical procedure expresses the closeness of agreement (degree of scatter) between a series of measurements obtained from multiple sampling of the same homogeneous sample under the prescribed conditions. Repeatability expresses the precision under the same operating conditions over a short interval of time. Repeatability is also termed intra-assay precision [7]. The repeatability was investigated by analyzing six independent determinations of the final dosage form (n = 6). The intermediate precision was determined using a second test series of identically prepared samples (n = 6). The reagents and samples were freshly prepared and analyzed by a second analyst. The degree of difference was assessed via the t-Student test.
2.4.6. Robustness
The robustness of an analytical process defines its resilience to small but intended changes in the method parameters, and thus provides information on the reliability of the method in routine operation [7,48]. The effects of the stability of solutions on the obtained results were assessed for 72 h in refrigerated conditions (5 °C), with changes in the chromatographic column temperature (±1 °C), flow rate (±0.01 mL/min), mobile phase pH (±0.2), organic content in gradient (±2%), and a different chromatographic column (ACQUITY UPLC HSS T3). The results were compared with those of the repeatability test. Additionally, the chromatographic parameters from the system’s suitability were monitored. In the development stage, part of the robustness area was evaluated by the design of the experiments, and in the validation stage, an ANOVA evaluation was performed for the sample concentration results.
3. Results and Discussion
3.1. Method Development Using AQbD Principles
The definition of the ATP comes at the first stage of the development and is justified according to scientific or regulatory requirements. Some specific topics could vary depending on the submitted market.
The ATP states the required quality of the reportable value produced by an analytical procedure in terms of the target measurement uncertainty [42]. It creates a summary of the requirements, if achieved, and will ensure an accurate assessment of a particular product quality attribute over the life cycle of the product [27]. The ATP shown in Table 2 assembles the internal and regulatory requirements for analytical methodologies [6,7,48,49]. The analytical method must be able to accurately quantify in ranges from 30 to 650 and from 32 to 260 µg/mL for CAV and FLP, respectively, and must be MS-compatible.

Table 2.
Analytical target profile for the quantification of CAV and FLP.
The CAV and FLP are good candidates for elution via conventional reverse-phase chromatography based on their logP values (Figure 2). This technique is present in the vast majority of pharmaceutical quality control (QC) labs, so it makes the method easy to transfer and apply for eventual product release. Furthermore, the MS compatibility feature provides an interesting and helpful advantage to analytical investigations concerning stability and impurity evaluations.
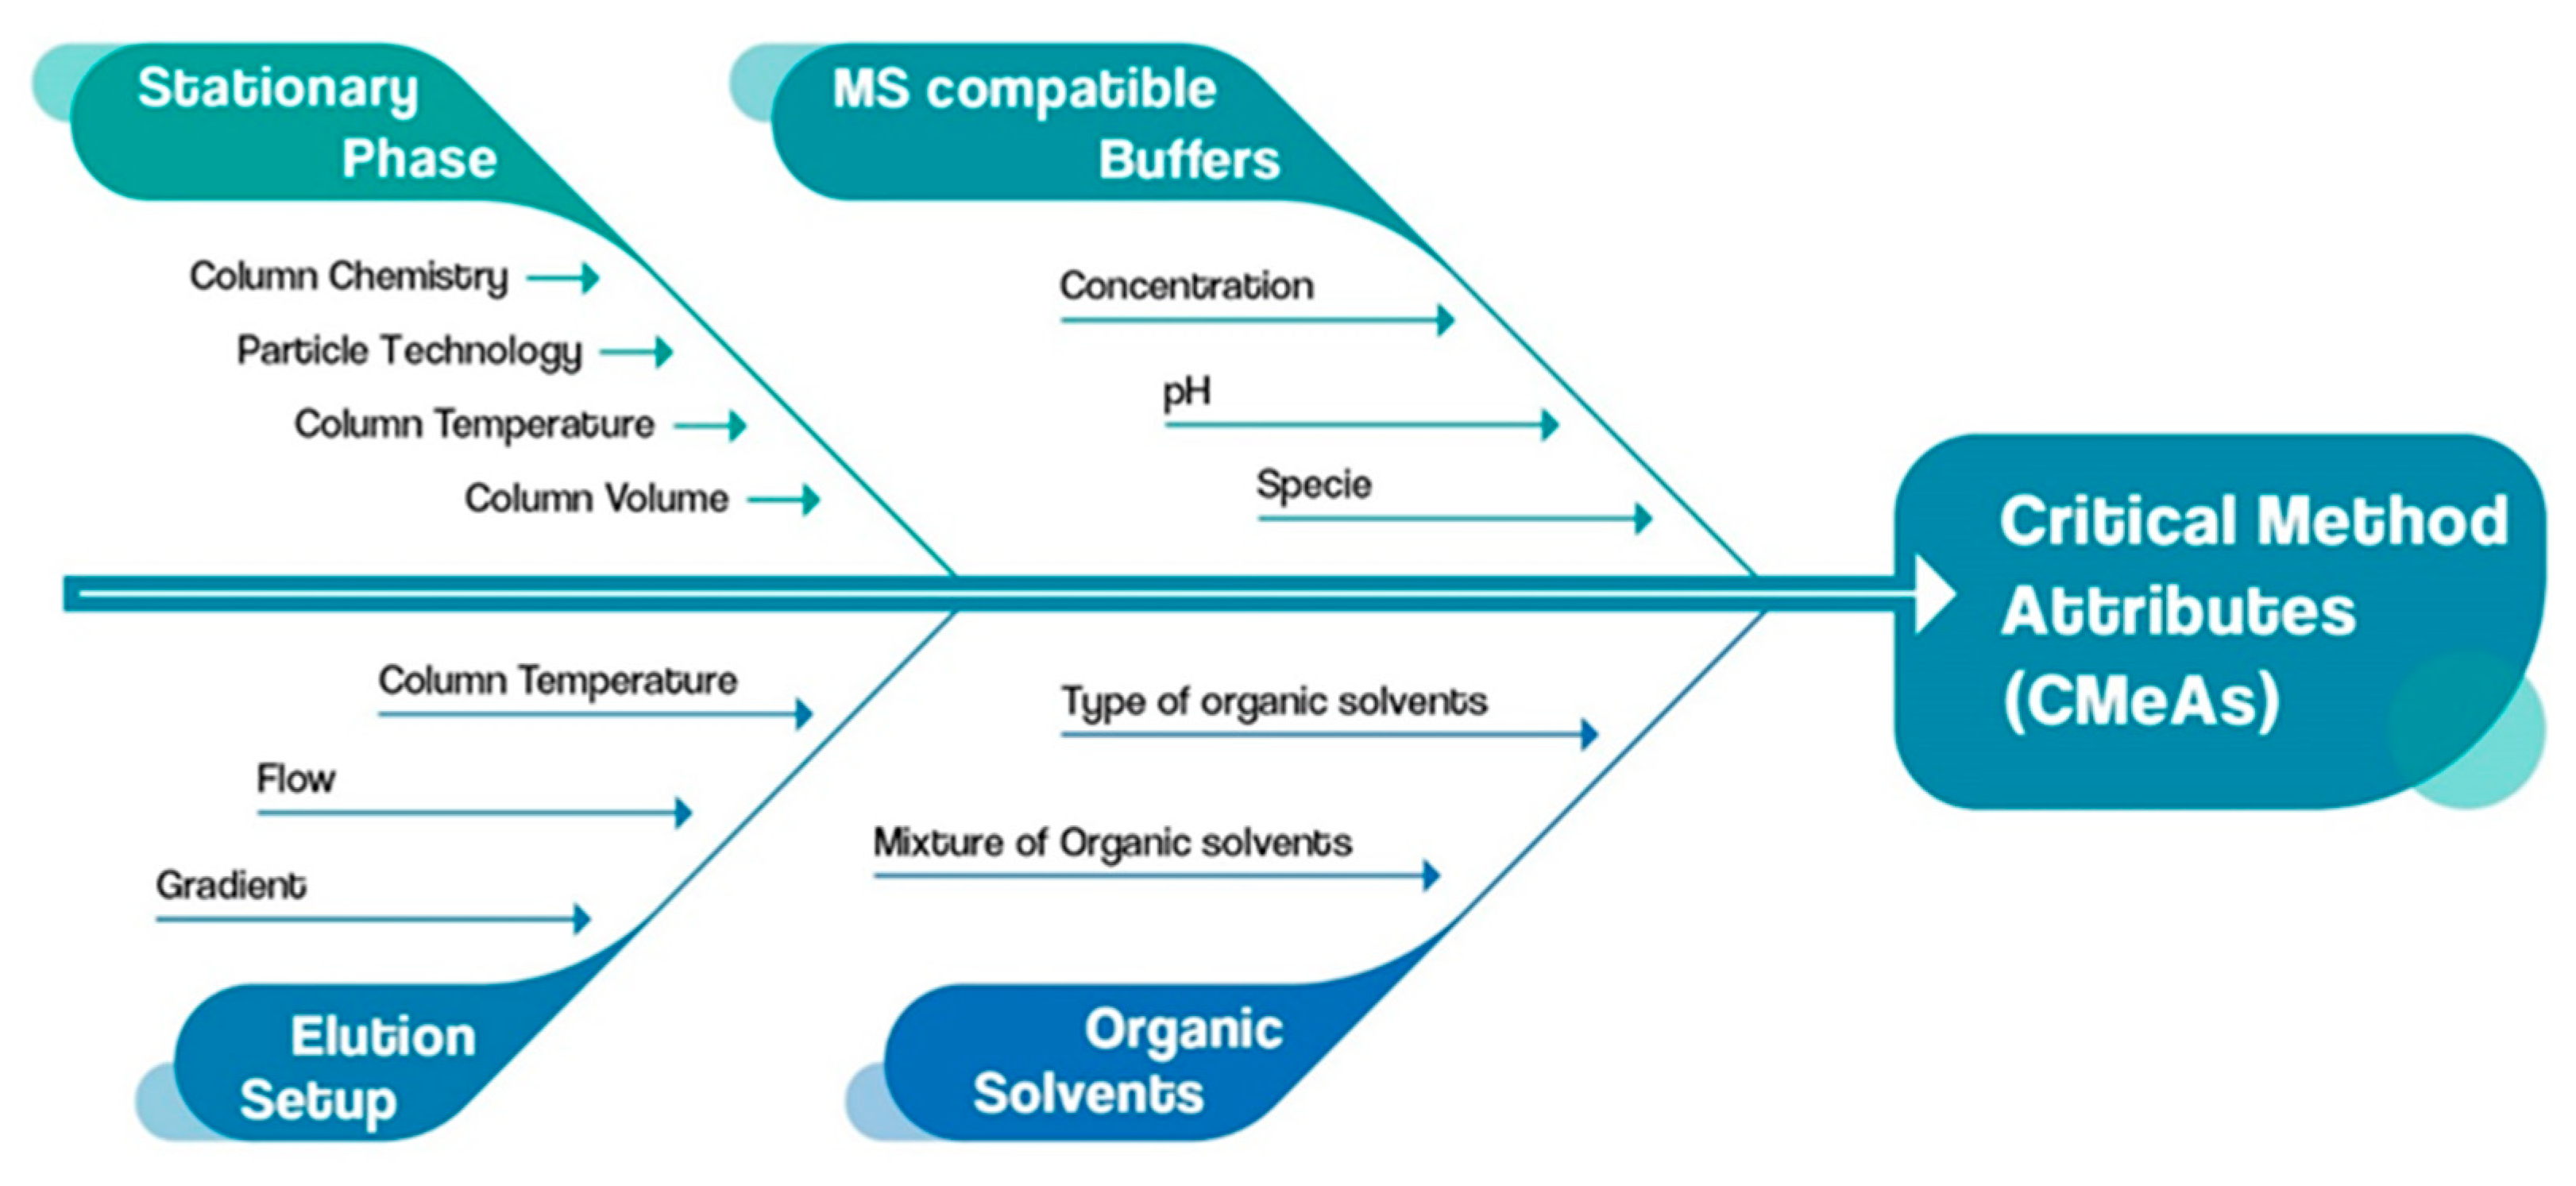
For the identification of the critical method parameters (CMePs), an Ishikawa fishbone diagram was utilized as a quality risk management (QRM) tool (Figure 3). With an effective evaluation of CMePs, their impact on the critical method attributes (CMeAs) is assessed.
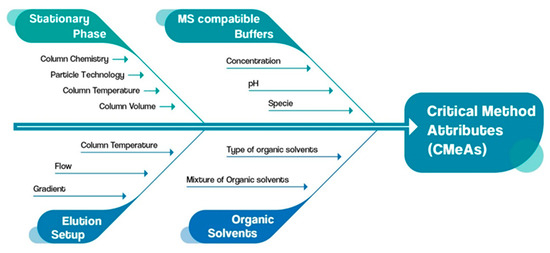
Figure 3.
Ishikawa fishbone diagram assessment of CMeAs and CMePs.
For the experimental planning of method development, API solutions were prepared and injected based on pre-established DoE (Table 3). Variables such as column, mobile phase, organic modifier (type and percentage in gradient), column temperature, and flow rate were adjusted to provide the requirements established by the ATP in two main stages: the screening phase and the optimization phase. Afterwards, the developed analytical method was validated following the ICH Q2 (R2) guideline (Validation of Analytical Procedures) [7].

Table 3.
Factors and levels of the design of experiments for development of the analytical method.
During the screening phase, two columns with the same C18 chemistry were evaluated, considering their carbon coverage and ligand density. The T3 column is less hydrophobic than its traditional C18 counterpart, as it has lower carbon density [50]. The development and validation experiments were defined using a 70:30 Acetonitrile: water mixture from previous solubility evaluations as a diluent, with a concentration of 250 and 100 µg/mL for CAV and FLP, respectively. A fixed injection volume (1 µL) flow and gradients of 0.3 mL/min t = 0 min, 10% B; t = 3 min, 10% B; t = 13.5 min, 90% B; t = 14.5 min, 10% B; and t = 16.5 min, 10% B were used, where B corresponds to the organic modifier.
The mobile phase buffers, as well as their pH values, were selected as MS compatible, and the chromatographic behavior was verified at a wide range, with and without dissociation of the APIs.
The initial experimental design was a D-optimal factorial split-plot to identify up to two-factor interactions between the studied parameters and the CMeAs. The hard-to-change factor was the mobile phase pH, which is why it was divided into six whole plots while the other factors (column and organic modifier) were randomly distributed.
The consecutive analysis suggested proceeding at an acidic pH and using methanol as organic modifier, as well as the Acquity HSS T3 as the column of choice. Final confirmatory runs at the given setting demonstrated that the predicted values were within the 95% prediction interval and that the method could be operated well within the analytical target profiles of both APIs.
Some responses had to be transformed to meet the model’s diagnostic criteria. The coefficient table can be found in Supplementary Materials Section (Table S1), including the transformation type as well as the p-value.
To further investigate the critical factors and to optimize the method, a second DoE followed an I-optimal response surface design for quadratic interactions between the factors of methanol percentage, column temperature, and flow. The design was augmented later in a second block of runs in order to extend its space and cover the optimum setting.
The coefficient table for all the metrics is given in Table S2 (see Supplementary Materials Section), including the transformation type and the p-values.
The optimal setting is a suggested solution where the defined parameters have the best response for both APIs simultaneously, and it depends on the constraints that are defined for the given responses, such as the lower and upper limits and importance of the response. Table 4 gives an overview of these constraints.

Table 4.
Factor lower and upper limits for DoE optimization and constrains.
Since the response “purity flag” is a dichotomous parameter where “0” represents a good outcome vs. “1”, which is flagged for issues in terms of peak purity, the outcome is the probability of “1” to occur, and is set to be minimized.
With the best solution given, each response was predicted and a so-called desirability value was assigned, where “1” means that the constraints were fully met. Those desirability values were used to compare the outcomes relative to each other.
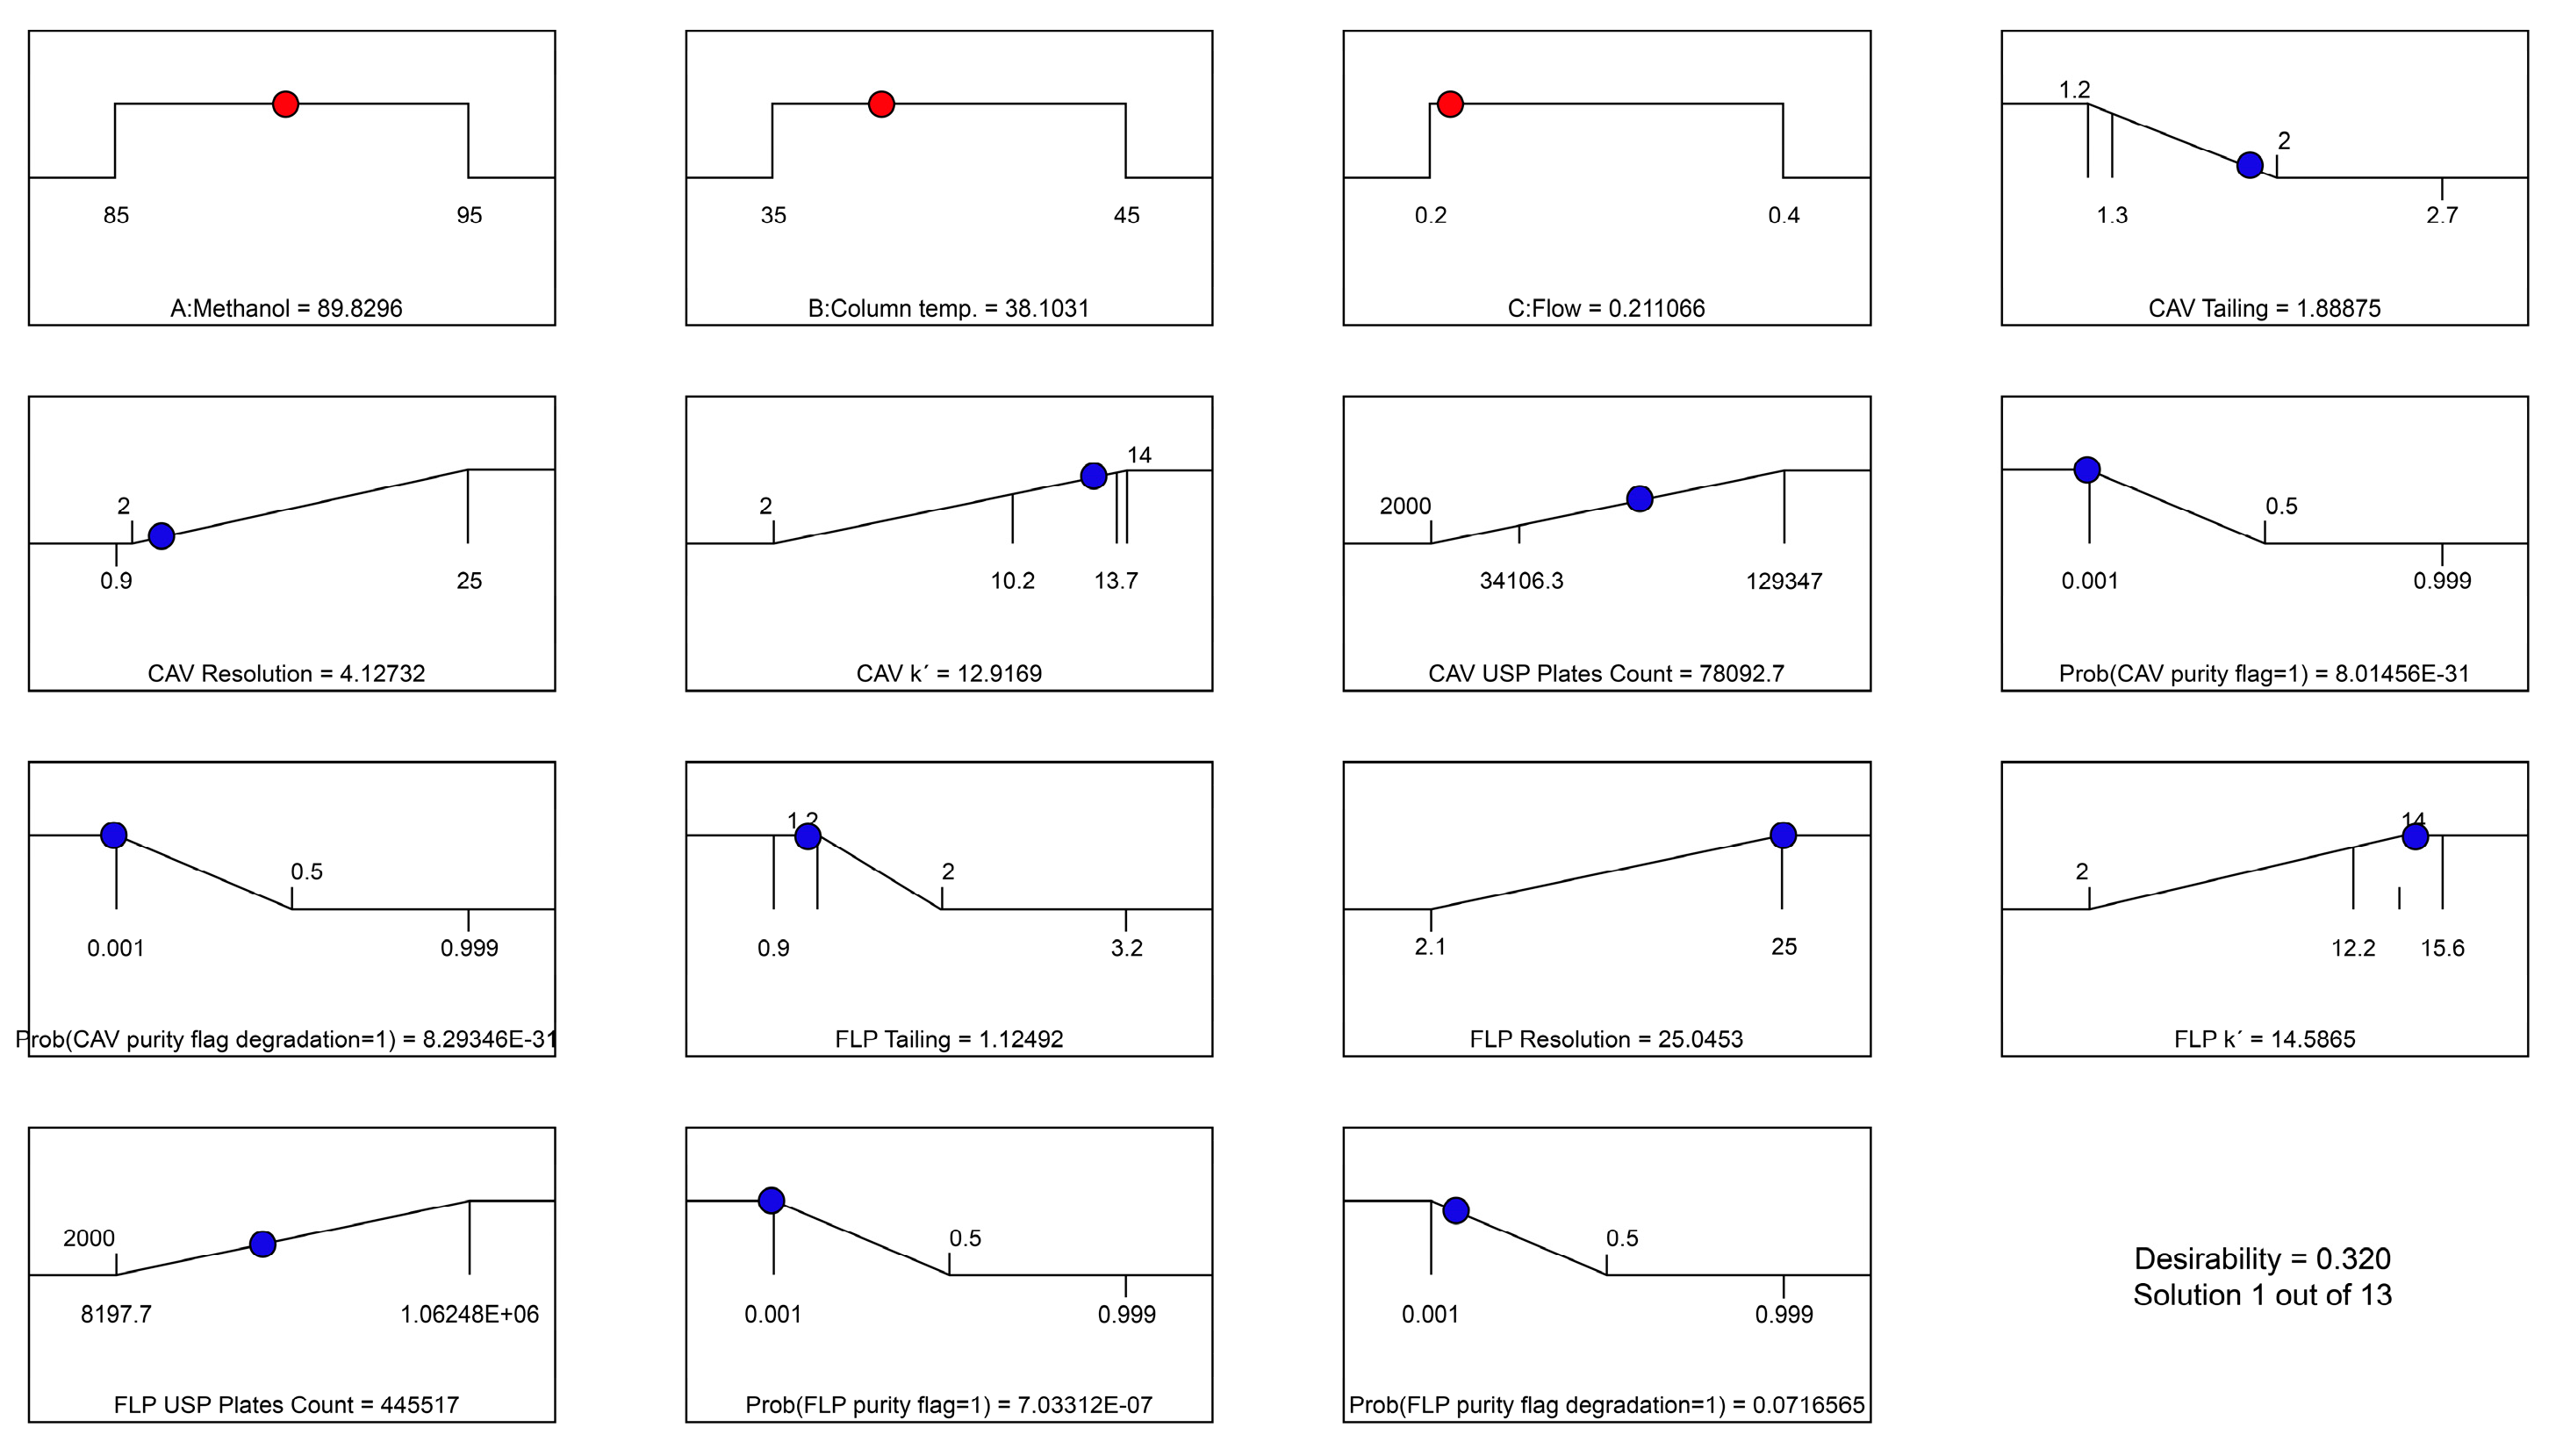
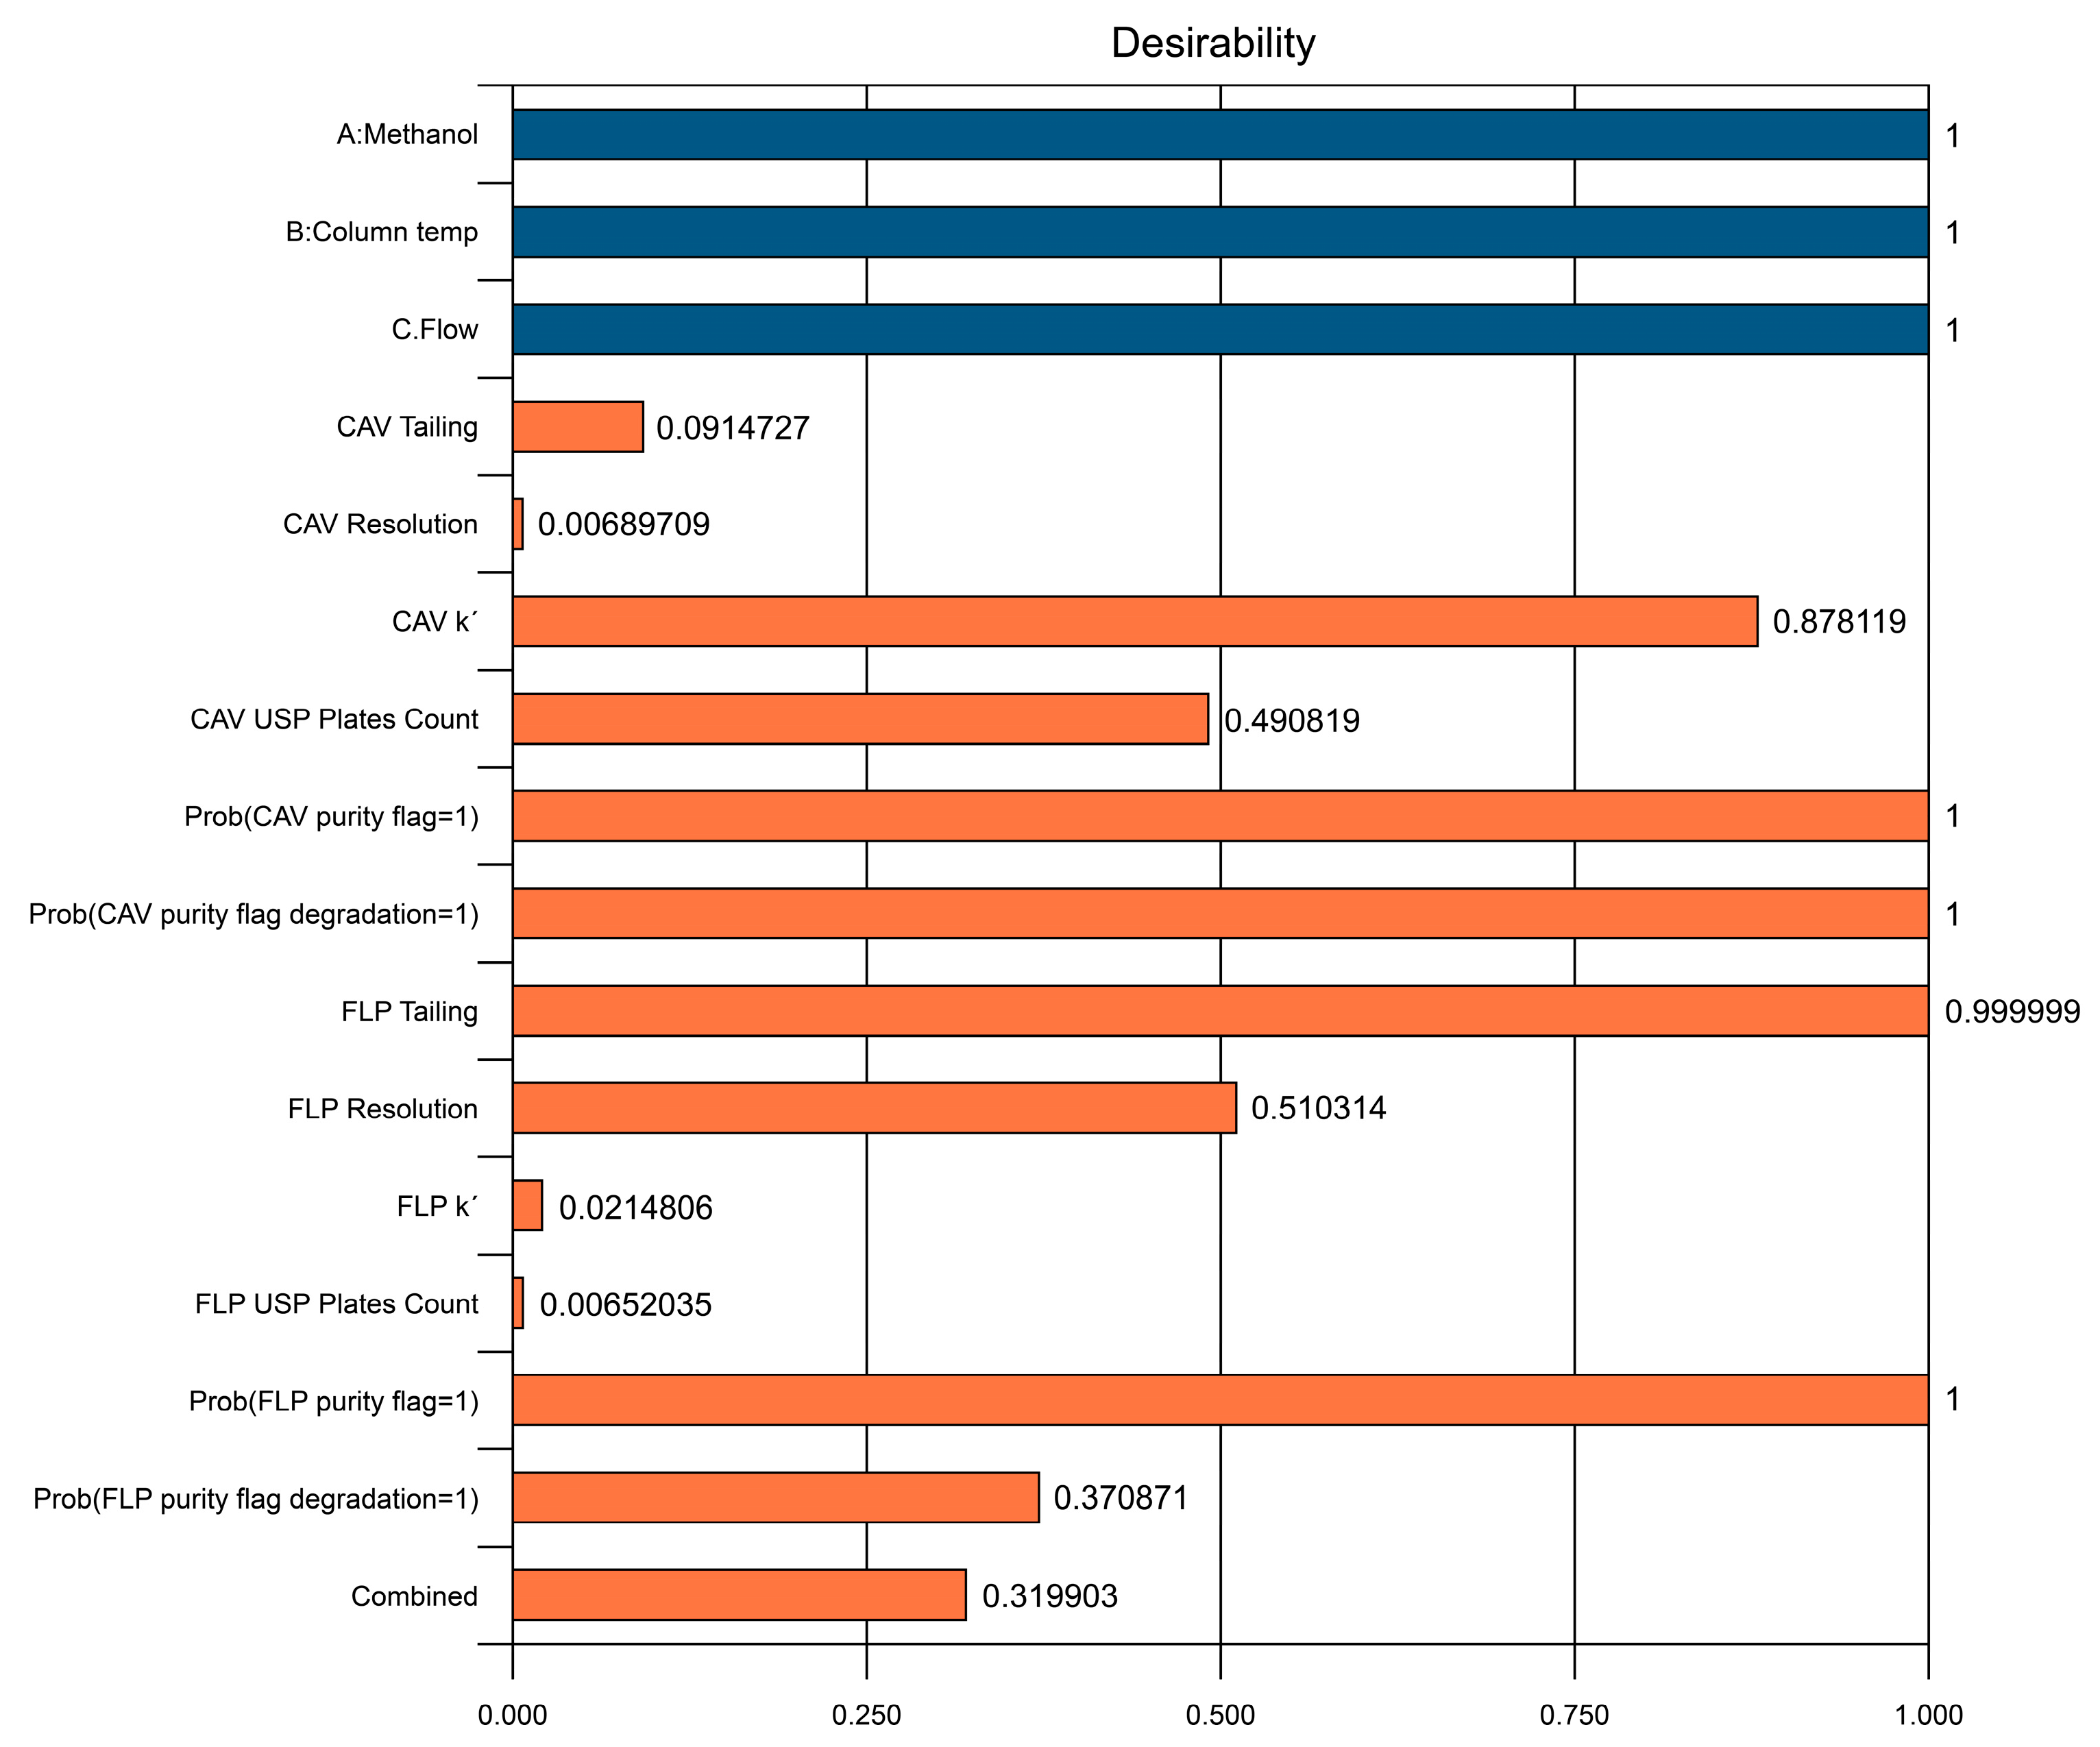
Figure 4 and Figure 5 illustrate the predicted results, with the overall desirability of the suggested solution as well as the individual desirability values.
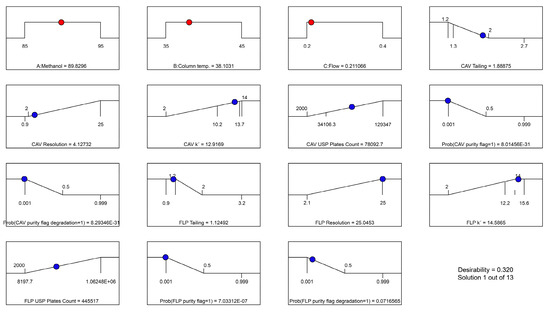
Figure 4.
Graph of predicted overall desirability results based on selected solution. The red points are for the factors and the blue the responses.
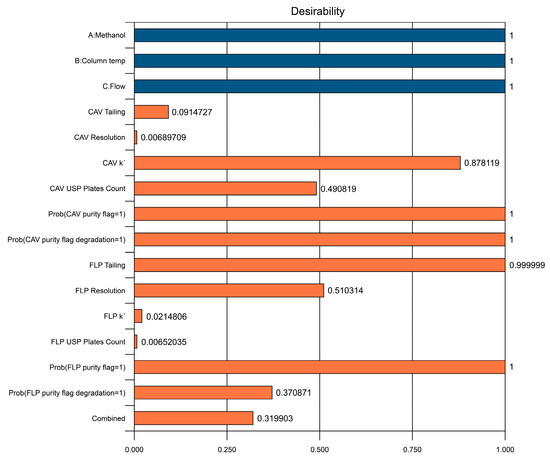
Figure 5.
Predicted individual desirability results based on selected solution.
The reason for the relatively low desirability value of the resolution for CAV is that the maximum constraint was set based on the maximum real value from the trials, which was 25. However, a predicted resolution of >2 is more than sufficient for a good separation. It is appreciated that even variables at the lower end desirability values had good predicted results, and no issues were found with respect to the defined constraints.
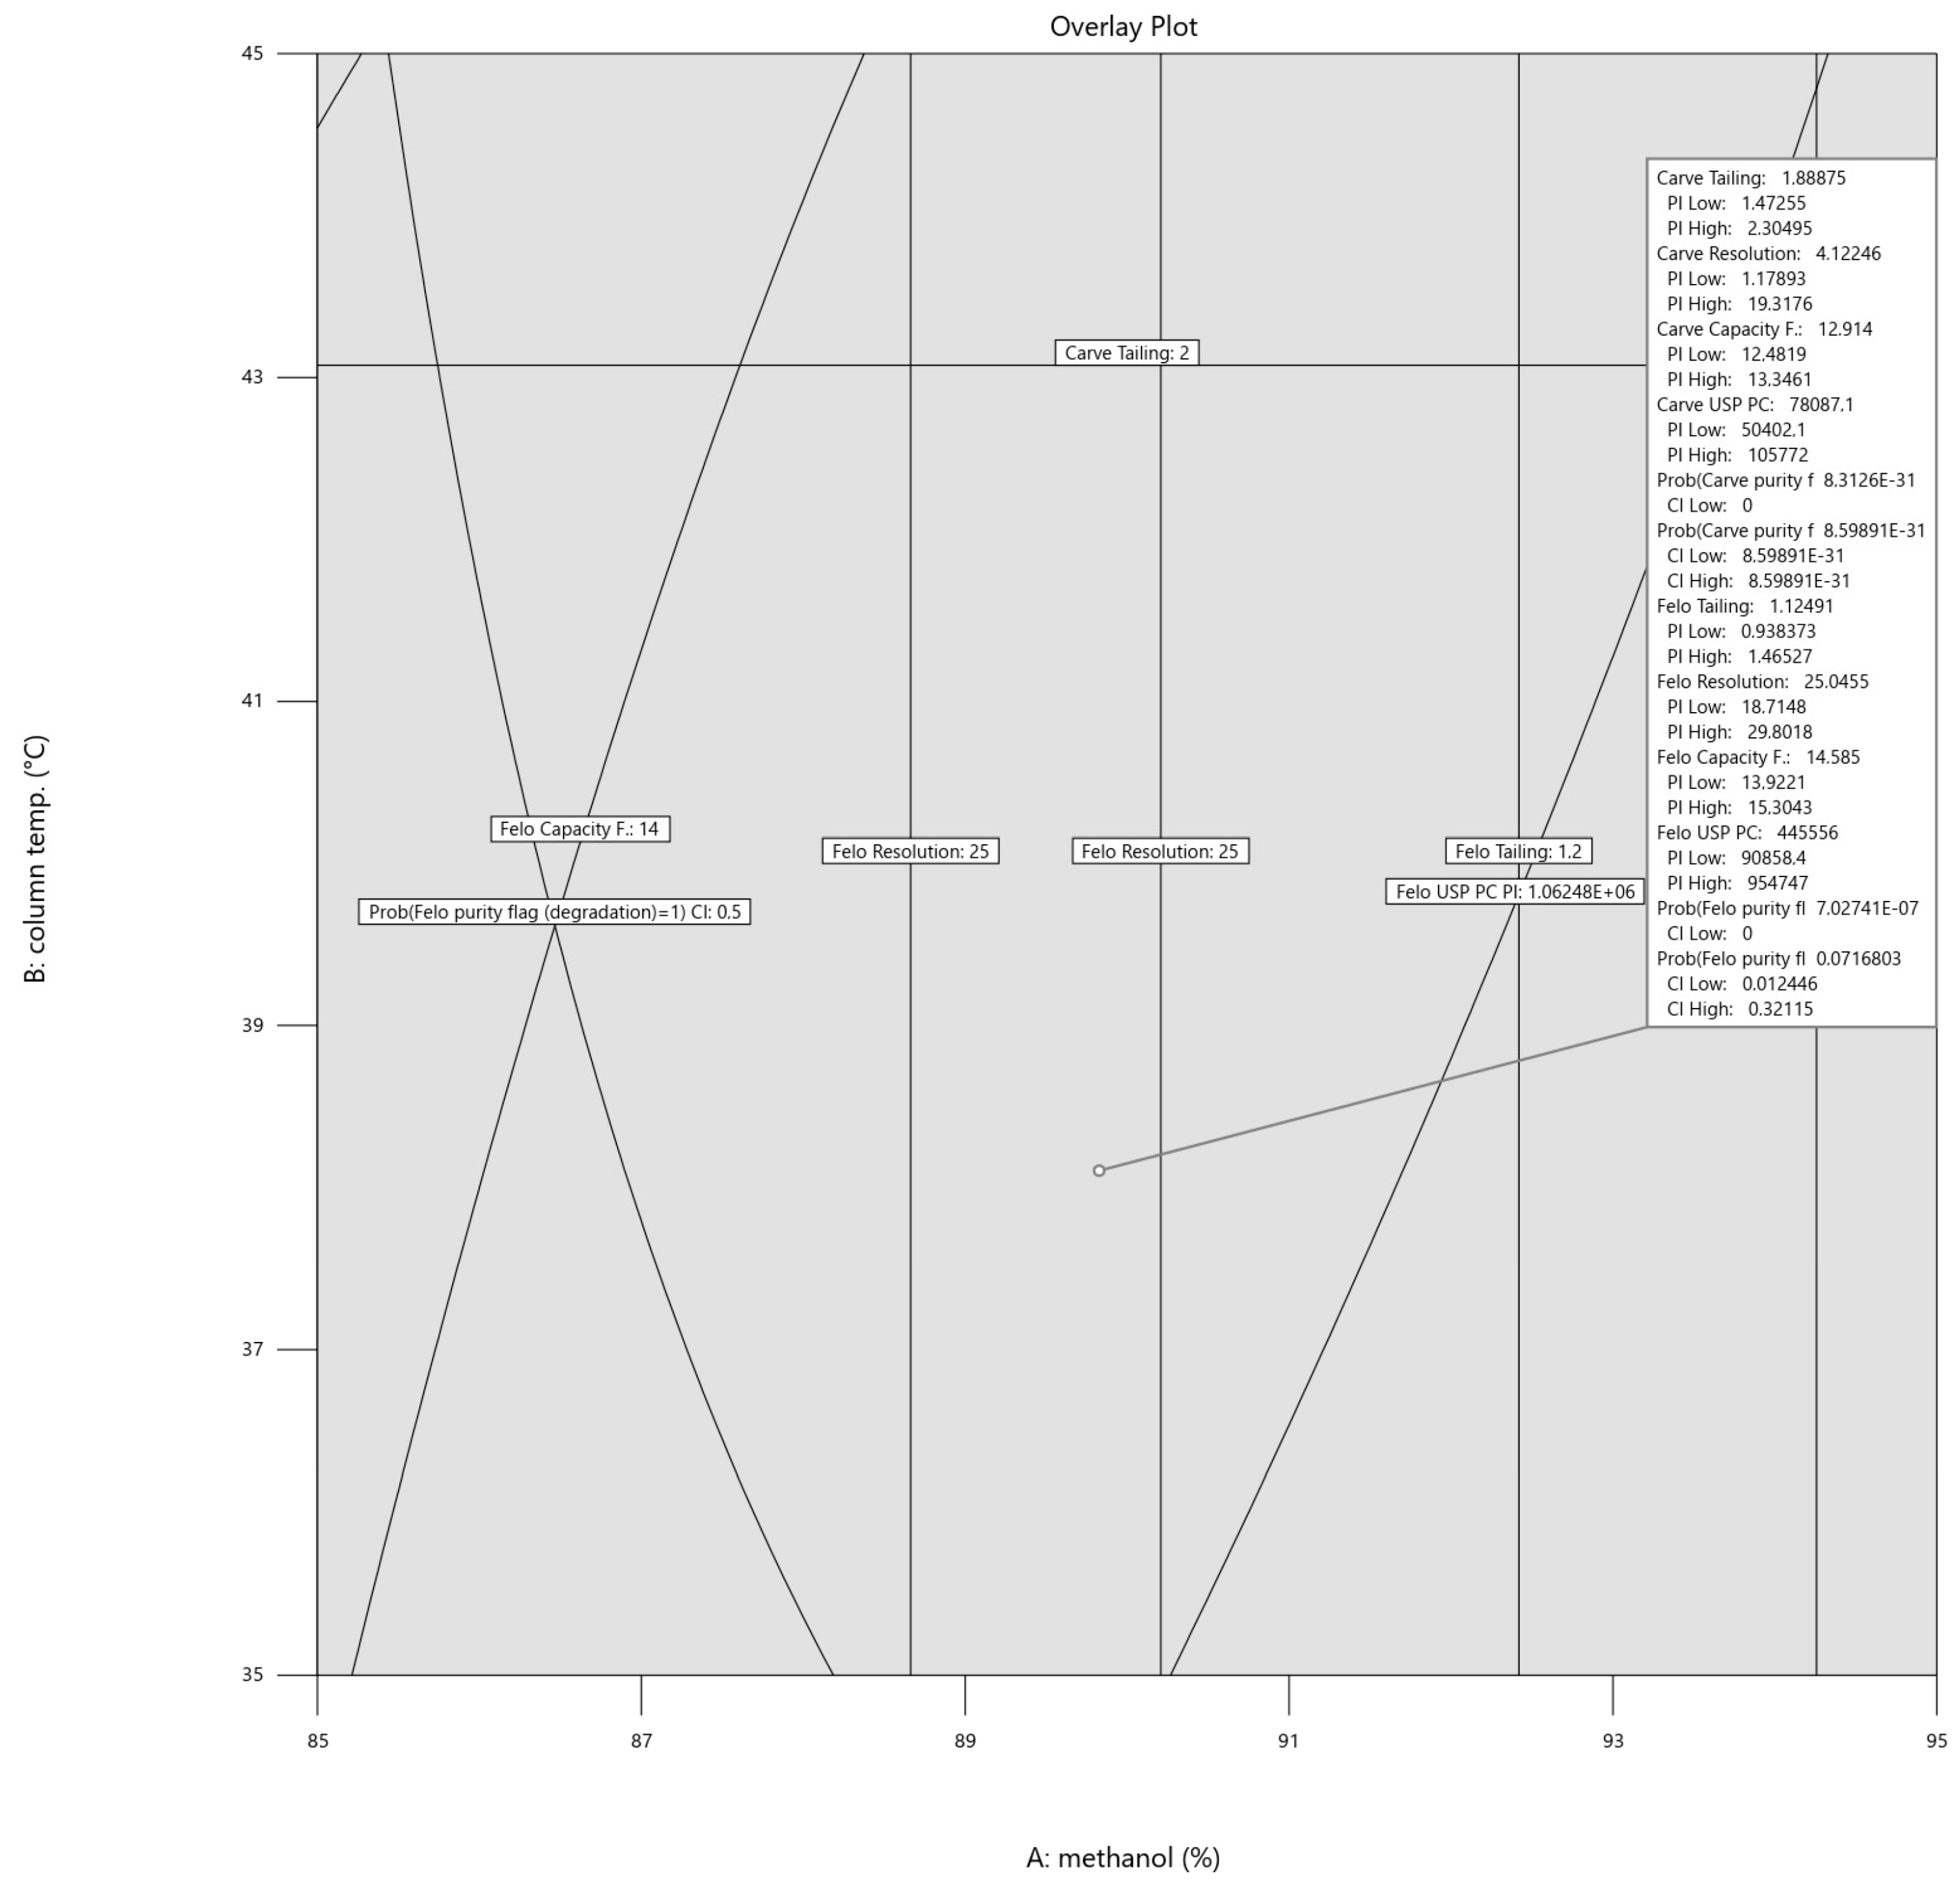
As it turned out, the margin of safety in which the parameters could be varied was broad, as illustrated in Figure 5. Hence, the final setting, using the one-sided confidence interval for the purity flag responses and prediction interval for all the other responses (α = 0.05), was rounded to 90% methanol concentration, 38 °C column temperature, and 0.2 mL/min flow. The rounded values were still well within the intervals (within the border lines), and as depicted in Figure 6 below, the respective intervals for each variable are shown in the flag description.
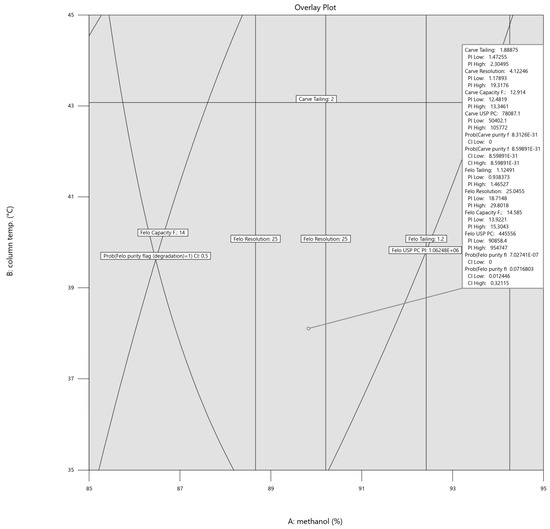
Figure 6.
Overlay plot for the prediction-interval-based optimal setting for methanol concentration, column temperature, and flow rate. The flag is set at 89.83% methanol, 38.10 °C column temperature, and 0.21 mL/min flow rate.
The point prediction for the rounded values is shown in Table 5 for each response in the original scale.

Table 5.
Point prediction of rounded values for CAV and FLP.
Furthermore, with eight runs at the given setting, it could be confirmed that the response surface model predicted the outcome skillfully and that the result met all requirements.
3.2. Validation of Analytical Method
According to the obtained results, the following conditions (Table 6) were addressed as the final analytical method conditions for validation.

Table 6.
Final analytical method conditions used for validation.
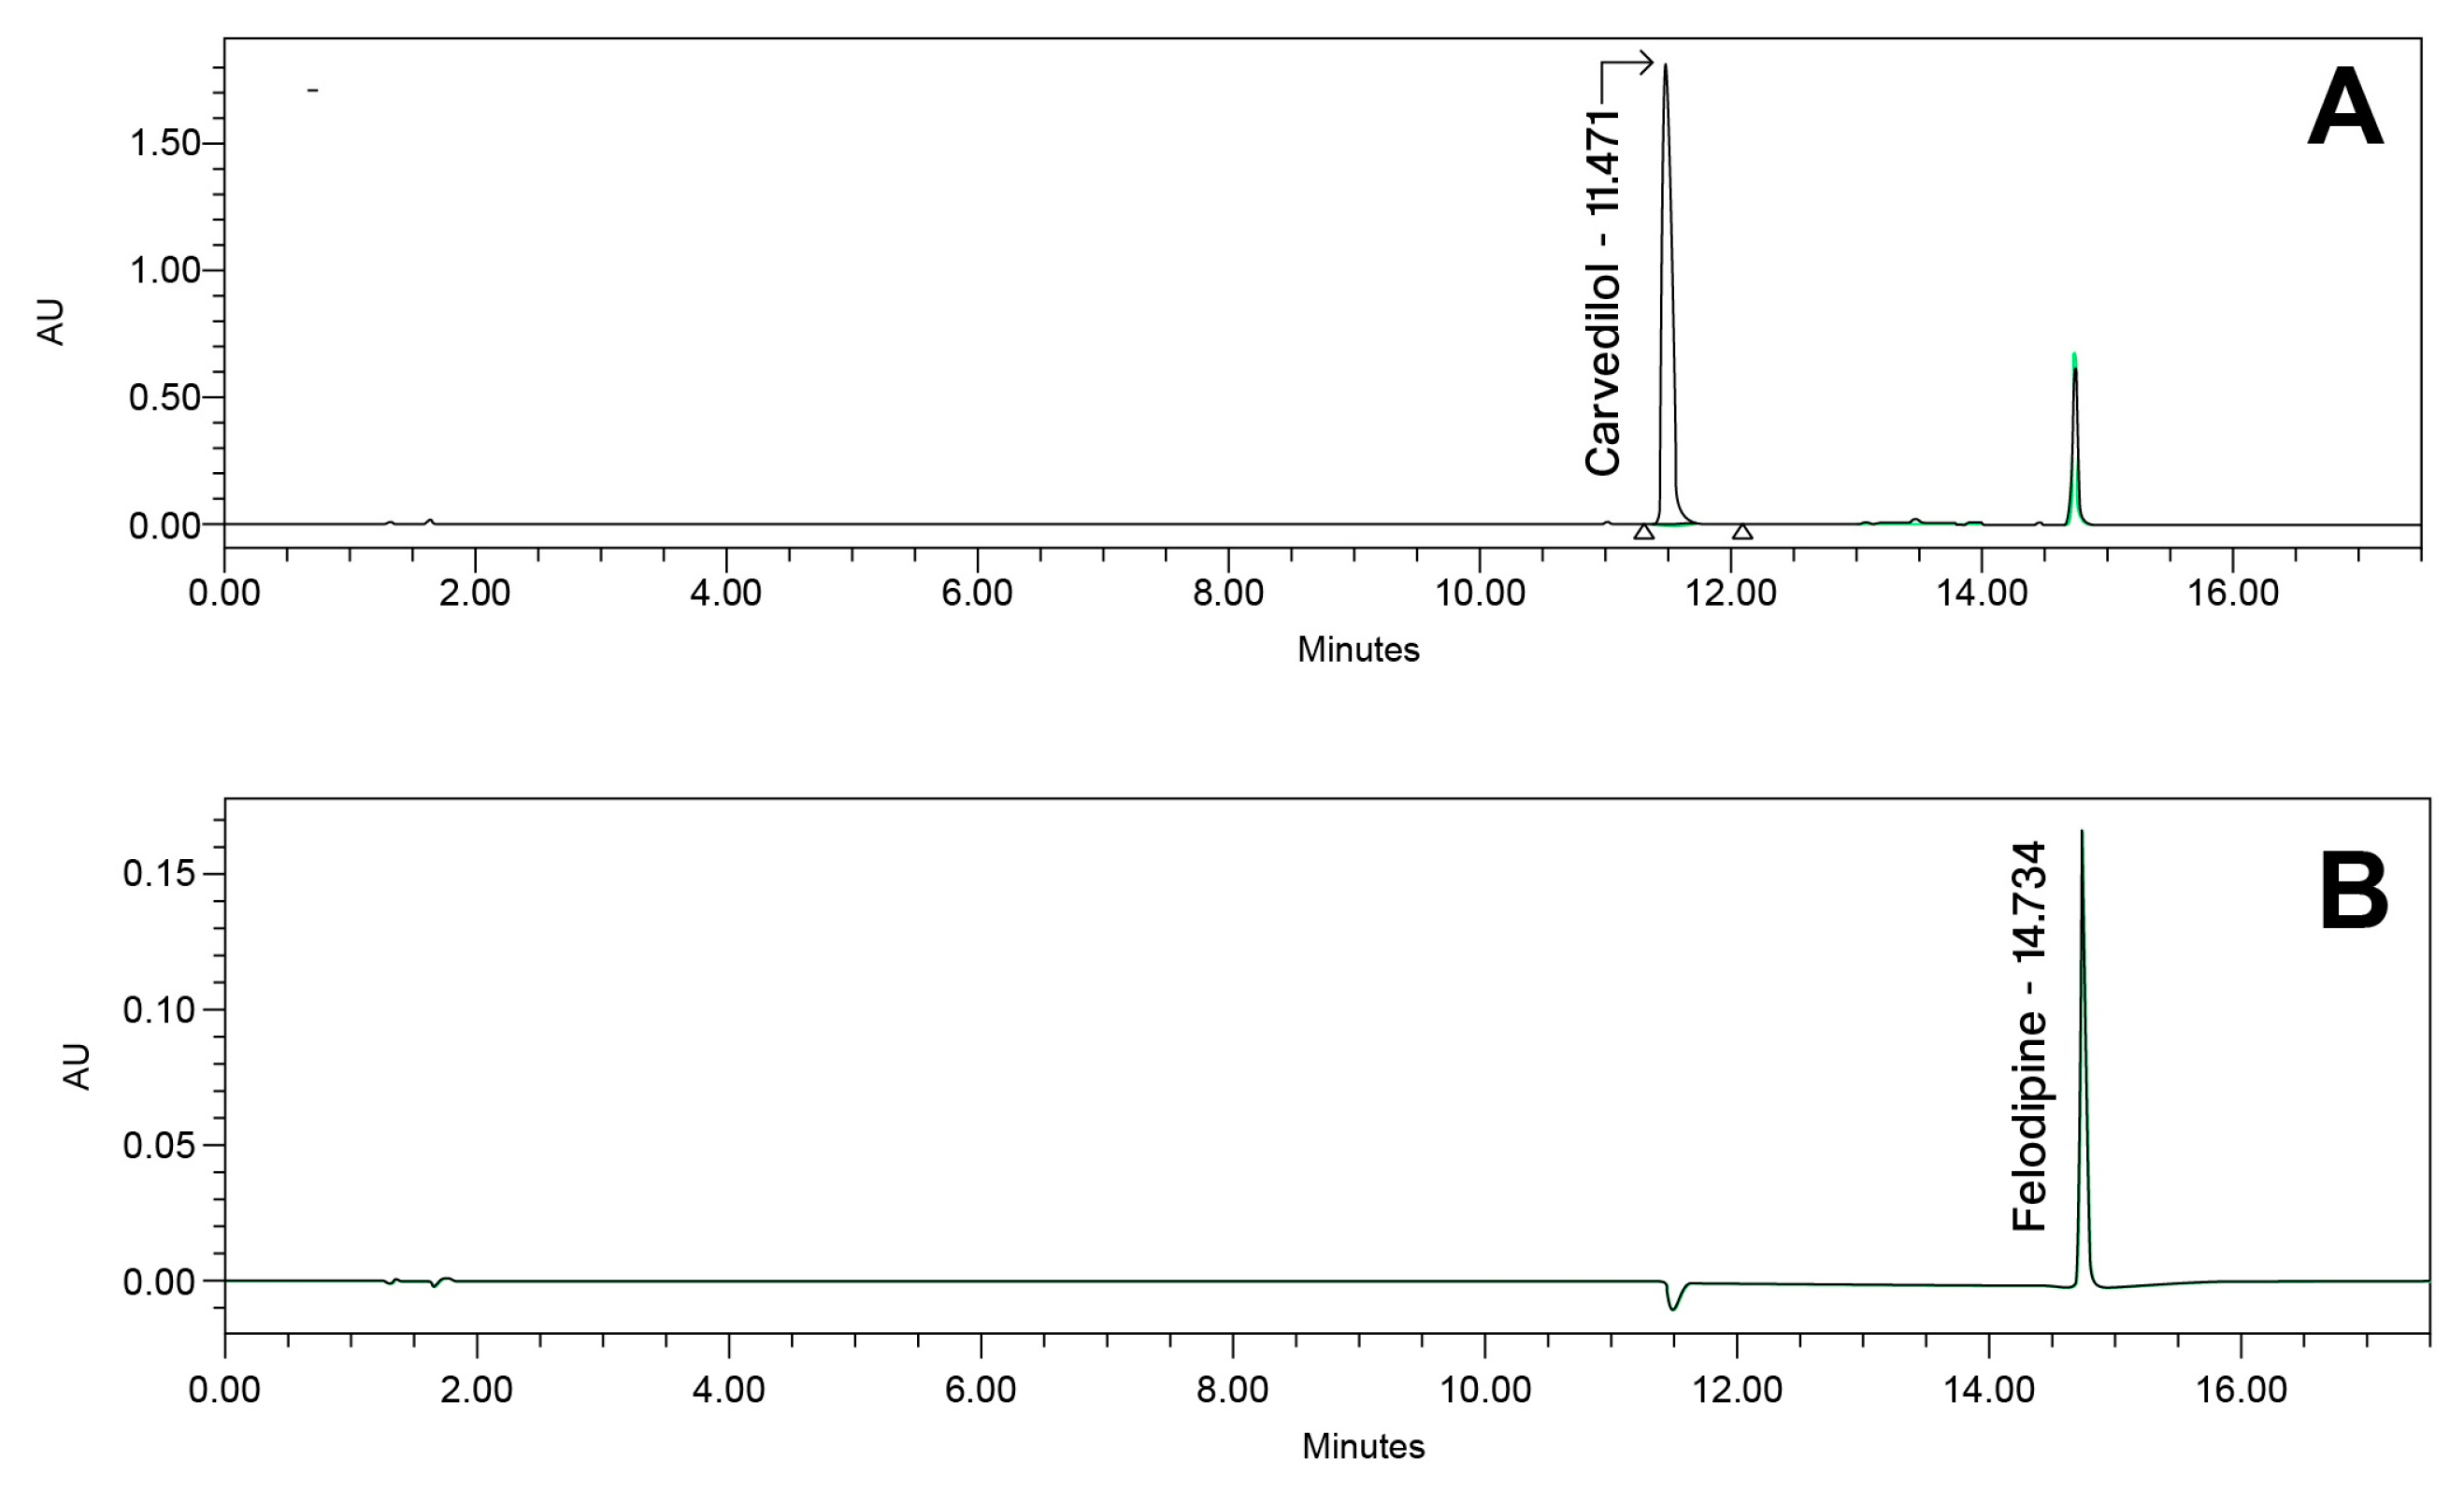
The developed analytical method was validated according to the ICH (R2) Q2 guidelines [7] and following the proposed acceptance criterion from the FDA laboratory manual for method validation and verification [48]. An example chromatogram is presented in Figure 7.
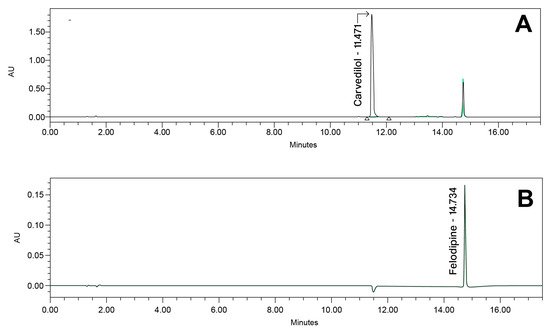
Figure 7.
Example chromatogram at (A) 240 nm and (B) 362 nm for carvedilol and felodipine prototype capsule composition.
3.2.1. Specificity and Forced Degradation Studies
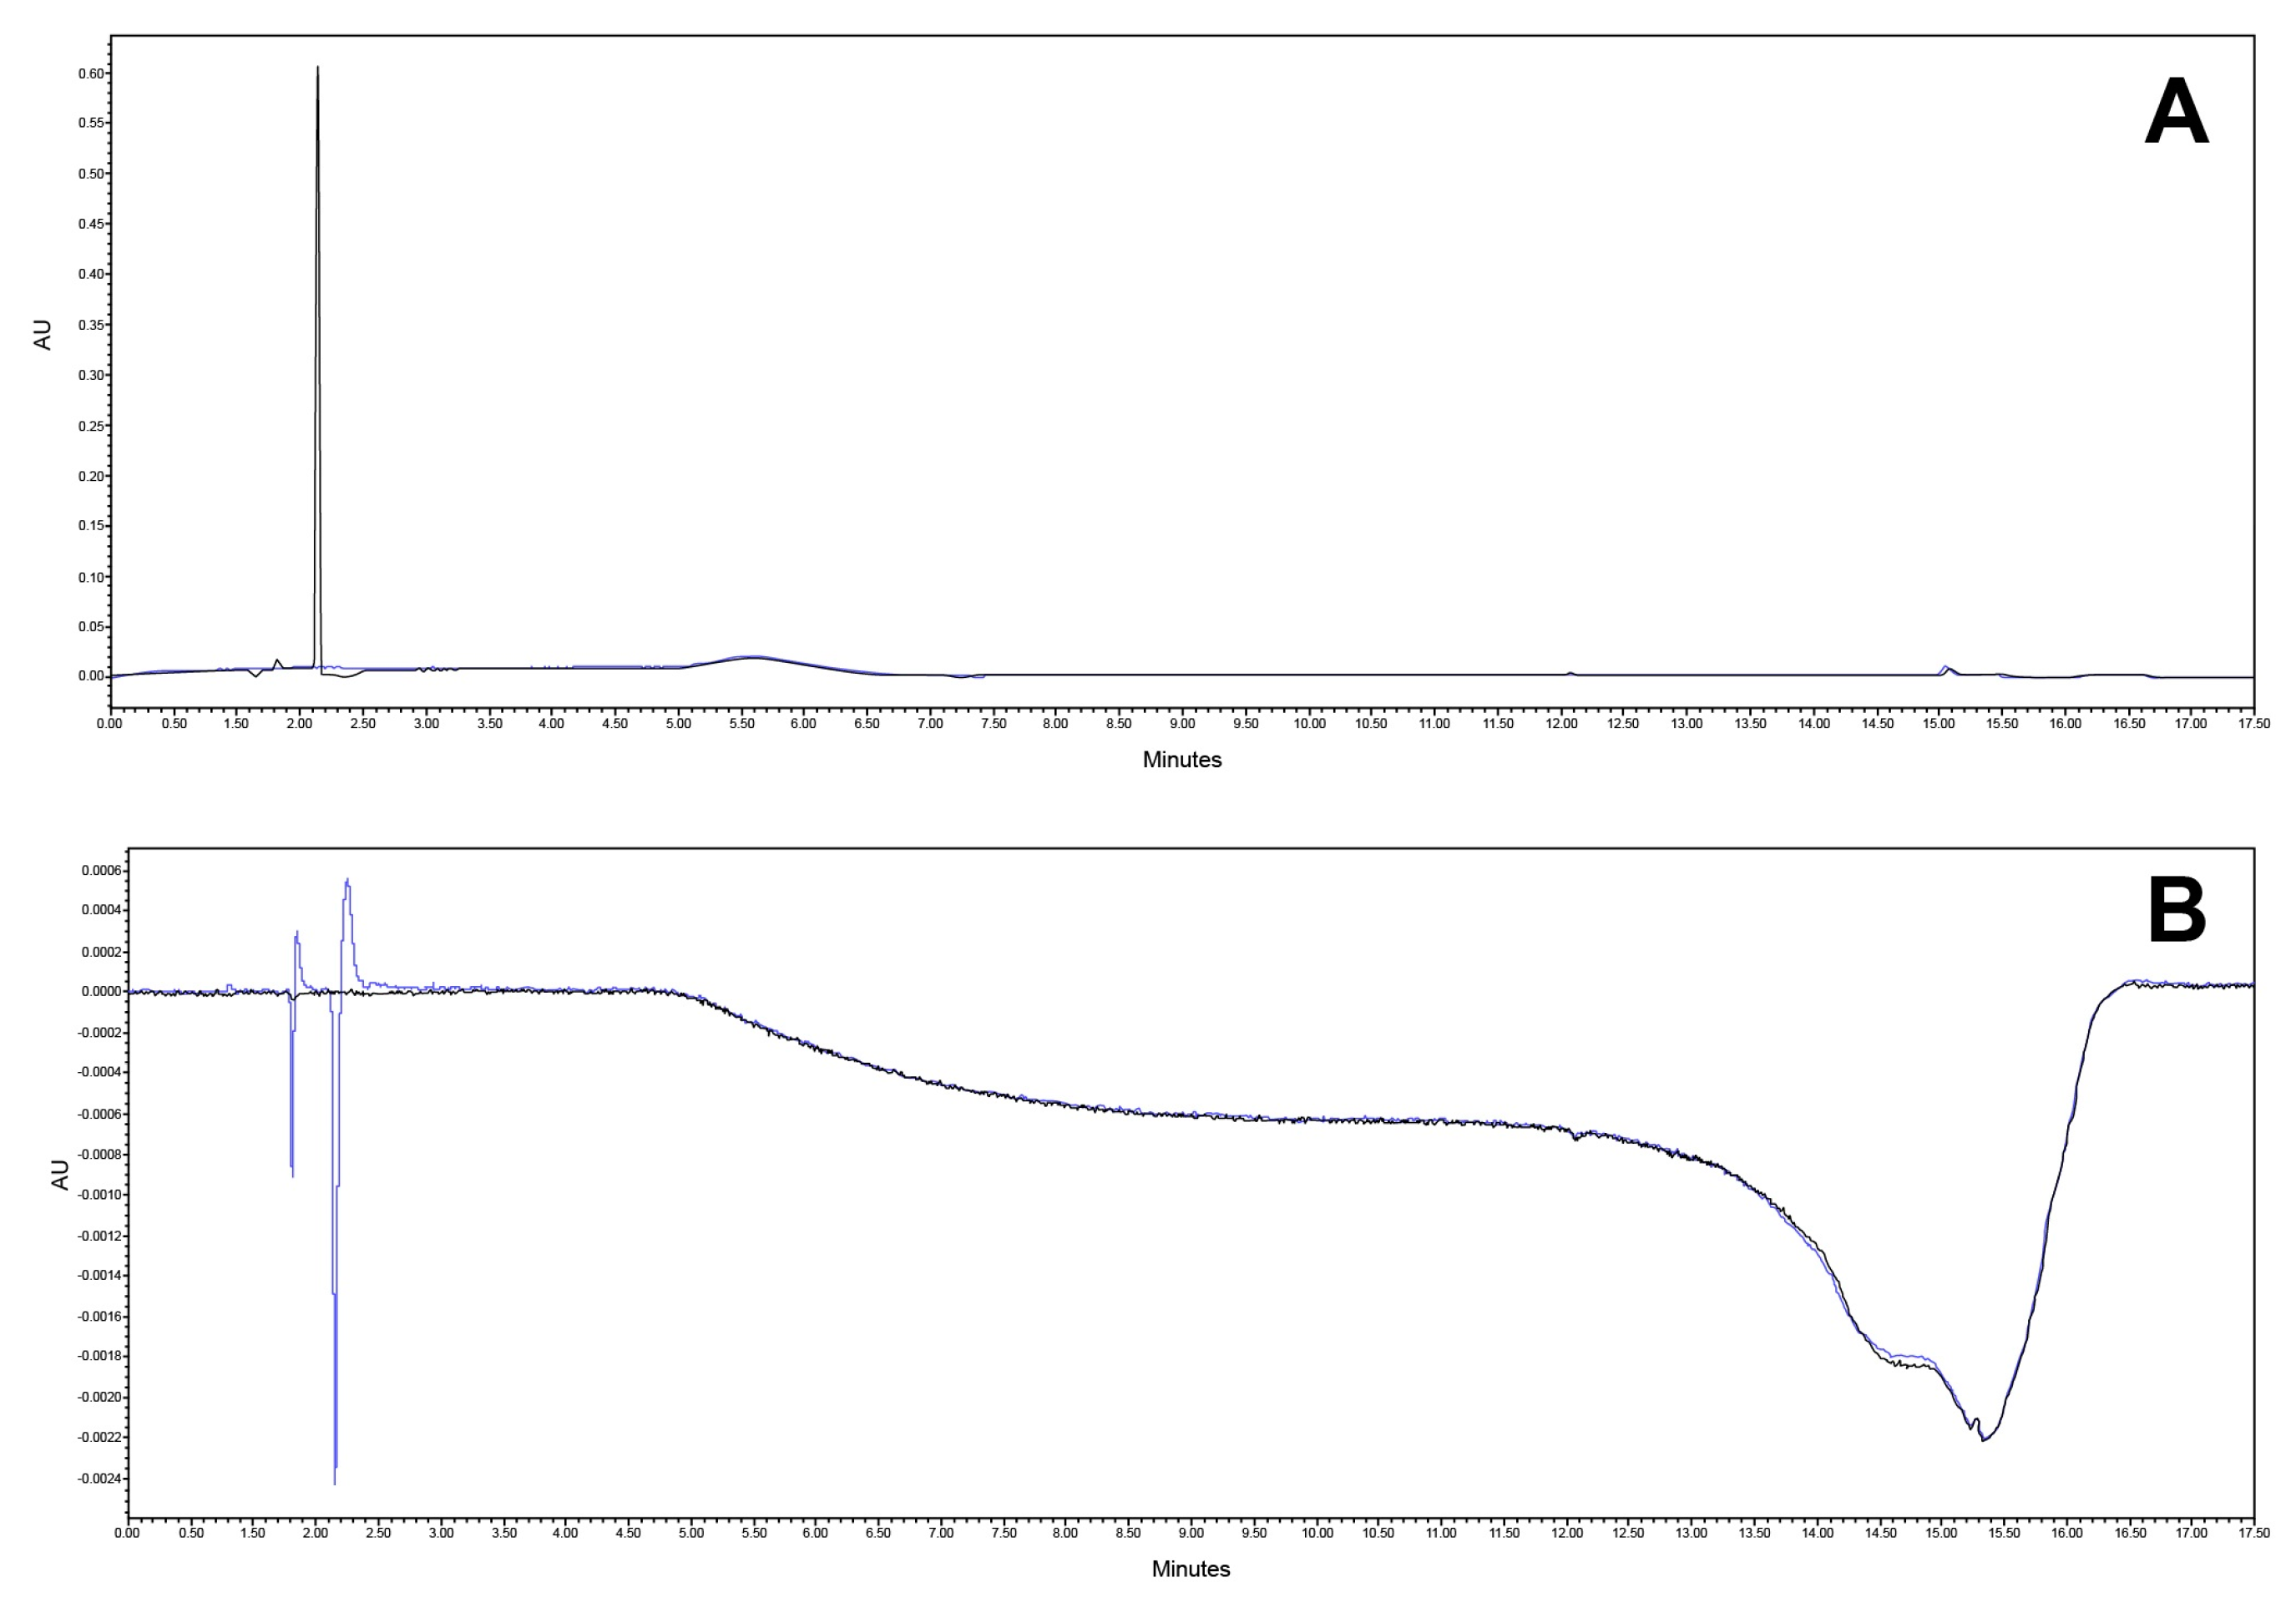
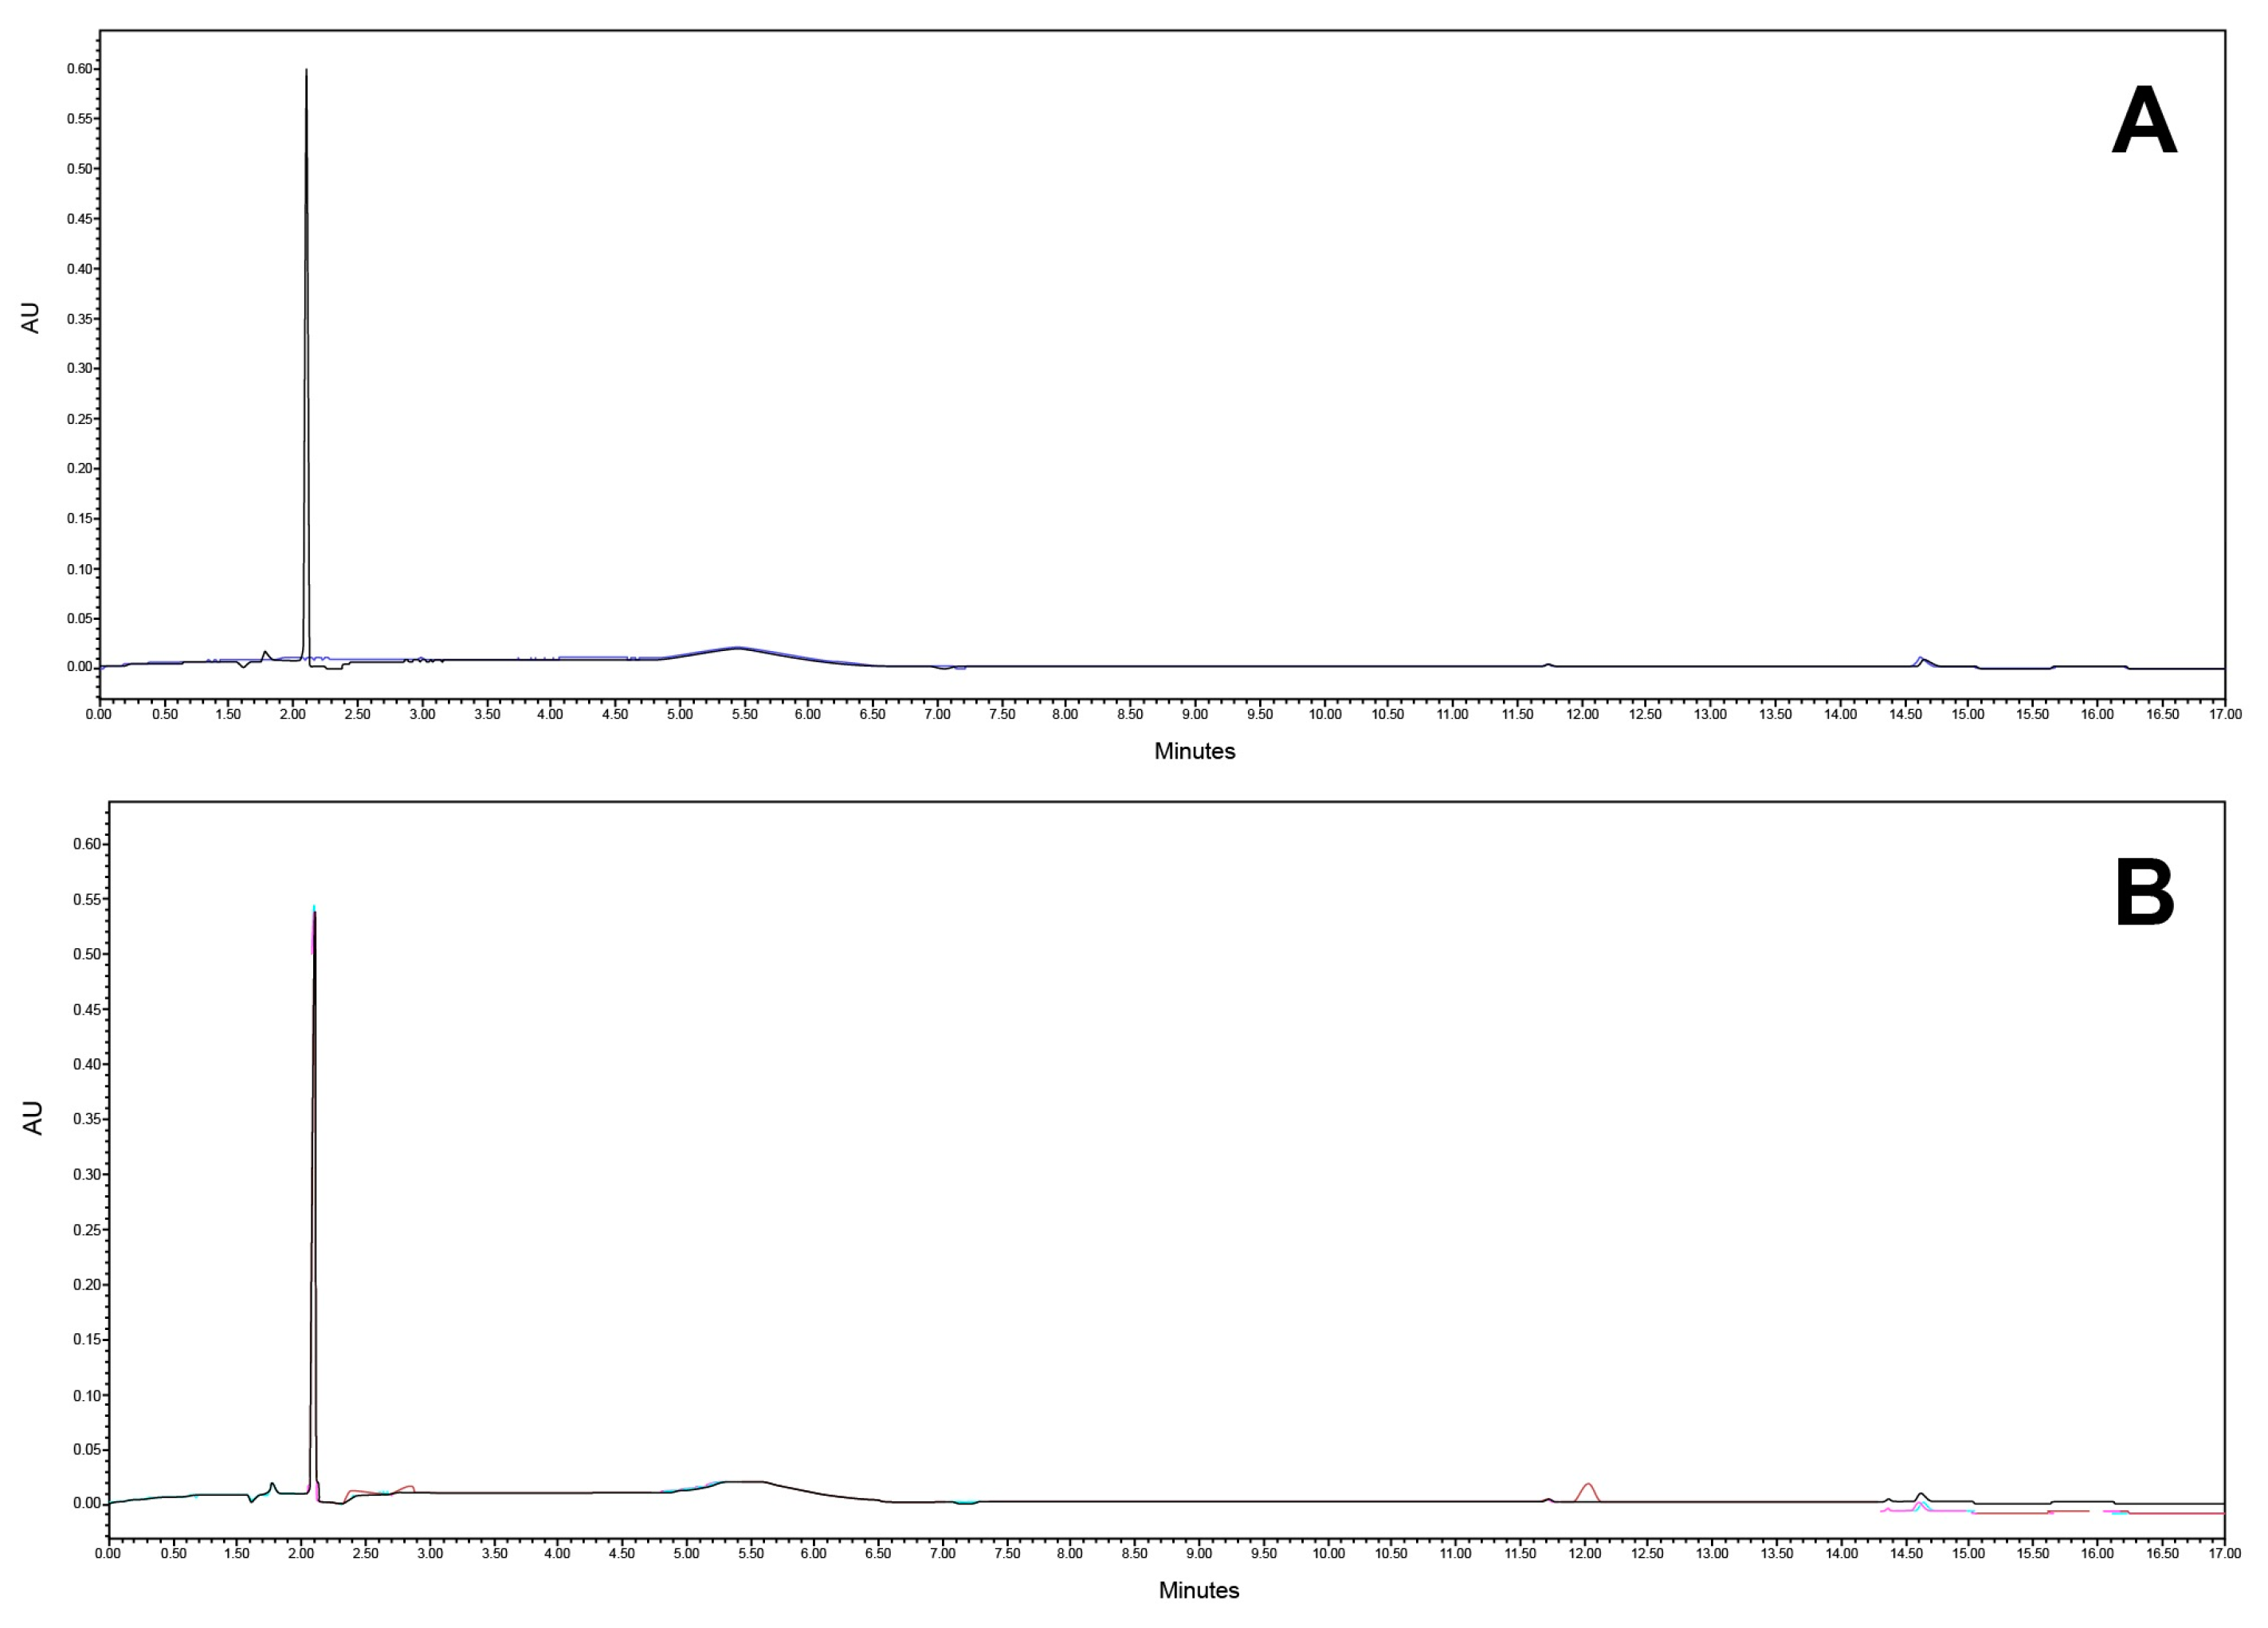
Specificity was tested on a mobile phase, diluent (blank), reference solution, matrix formulation component, and the final product. The analytical method proved to be selective for the quantification of the active substances in the presence of the matrix. Also, sufficient resolution between the CAV and FLP (more than 2.0) was obtained. The chromatograms are presented in Figure 8 and Figure 9.
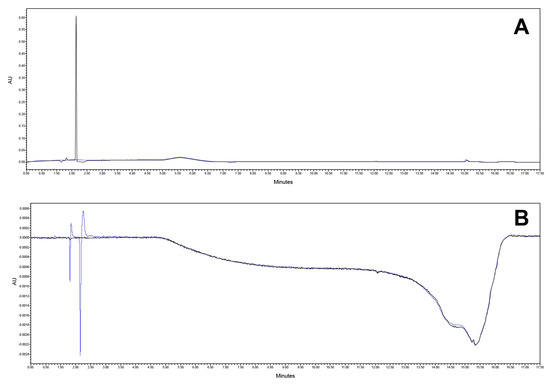
Figure 8.
Chromatogram at (A) 240 nm and (B) 362 nm of mobile phase (black) and diluent (blue).
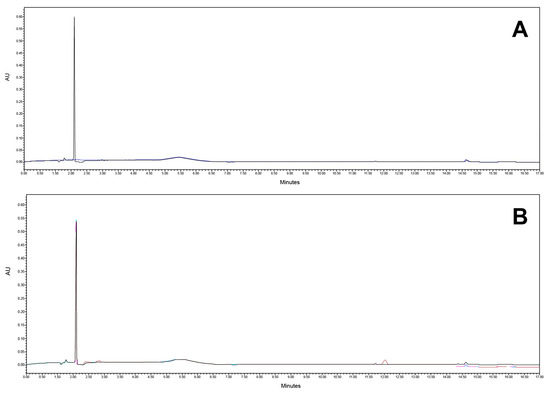
Figure 9.
Chromatogram at (A) 240 nm and (B) 362 nm of placebo matrix.
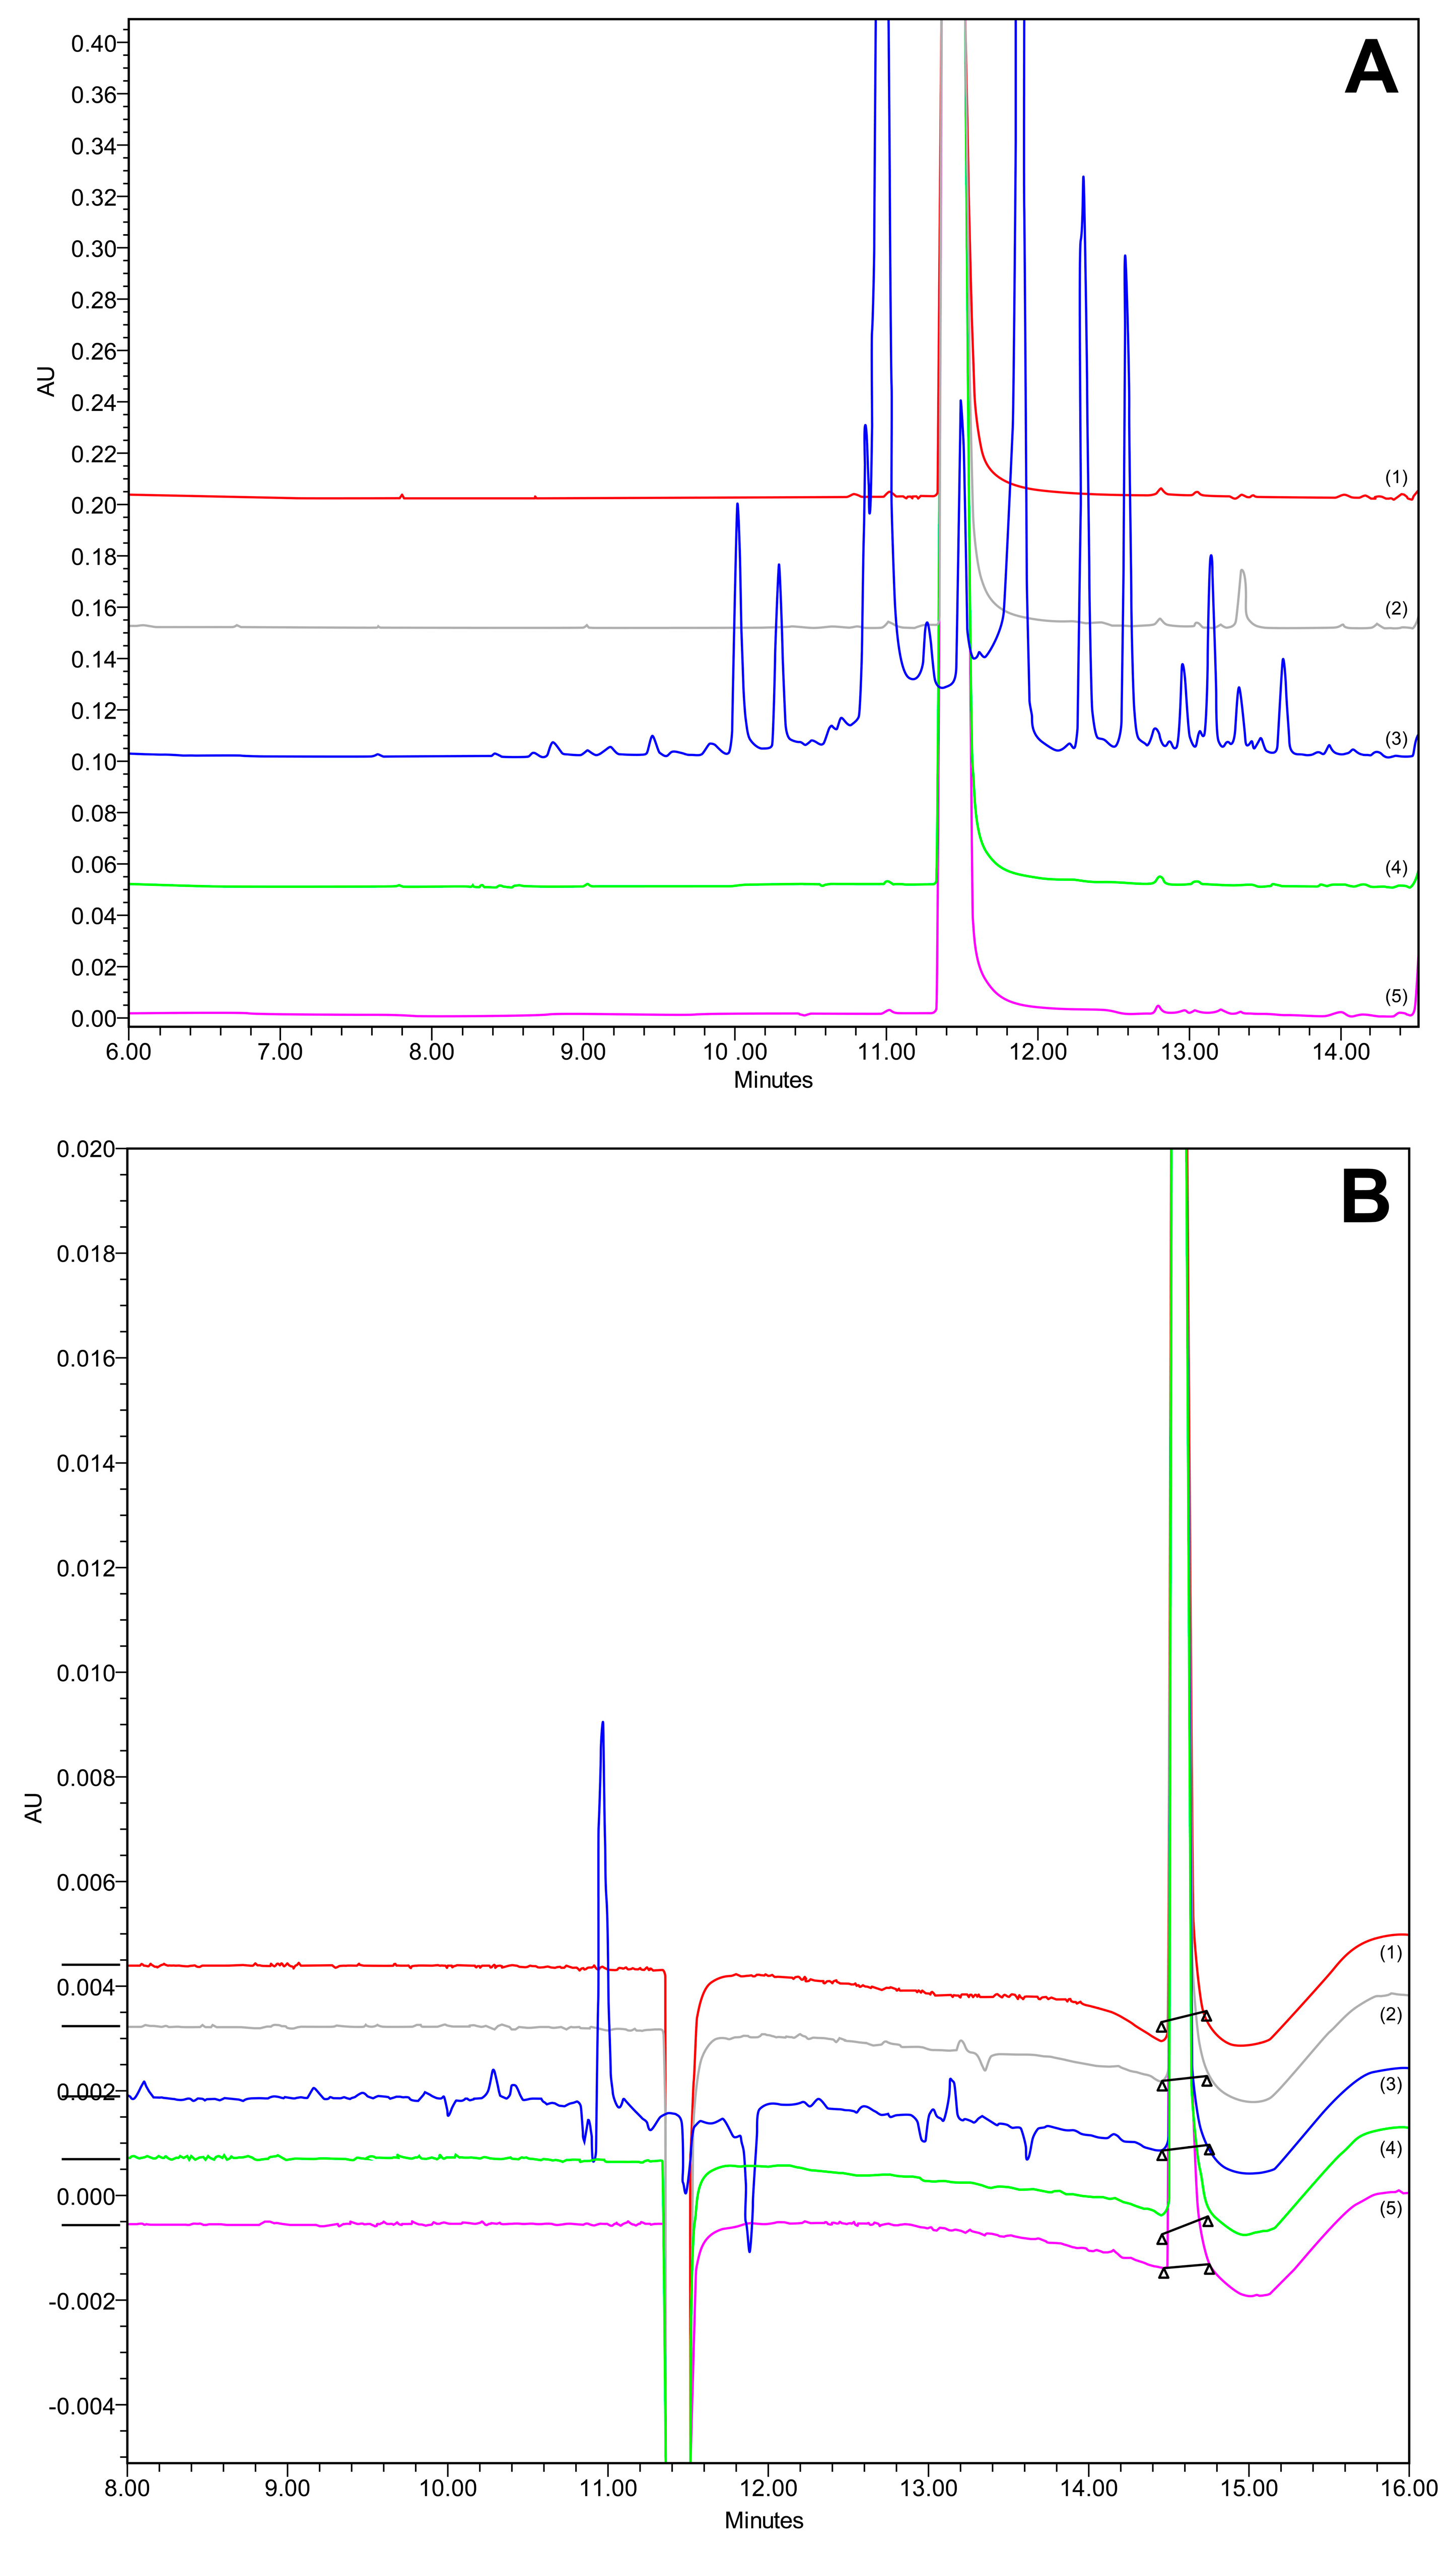
The forced degradation study was conducted in triplicate, and all the peaks were eluted appropriately (Figure 10), with satisfactory peak purity (see Figures S1–S10 in Supplementary Materials). The degradation results are presented in Table 7.
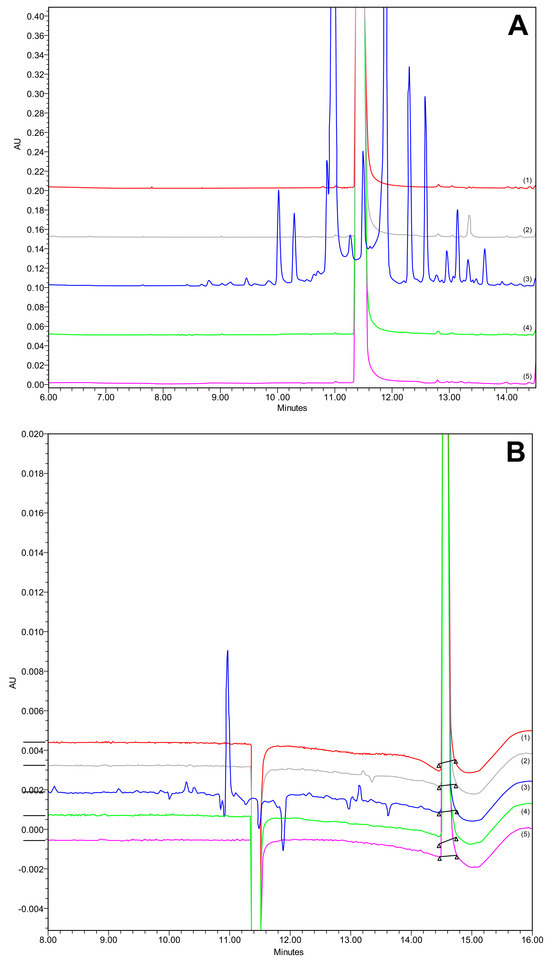
Figure 10.
Chromatogram at (A) 240 nm and (B) 362 nm of forced degradation studies in acidic (1, red), basic (2, grey), oxidative (3, blue), thermal (4, green), and control (5, pink) conditions.

Table 7.
Results of forced degradation studies on CAV and FLP.
CAV demonstrated resilience against strong acids, with no detectable degradation products. During analysis, a PDA spectrum was acquired. The examination of CAV and its impurities was conducted at a wavelength of 240 nm, aligning with the substance’s absorption spectrum, to distinguish it from the FLP peak and associated substances. The relative molecular mass of CAV was 406.474, with the primary molecular ion observed at m/z 407.17 ([M+H+]) through MS spectrometry of the control, which was pure API.
Upon investigating the impact of alkalide, three degradation products emerged. Notably, a peak representing the molecular ion of the protonated product was identified in the MS chromatogram at C27H32N2O4 m/z 449 ([M+H+]), corresponding to n-isopropyl carvedilol. Additionally, another peak observed in the MS chromatogram at m/z 487.08 ([M+H+]) suggested the presence of N-isopropyl carvedilol with a chlorine adduct.
Thermal stress conditions resulted in the formation of two degradation products. The peak with RT 12.84 min corresponded to the MS chromatogram where the protonated compound 646.17 ([M+H+]) matched with 3,3′-(2-(2-Methoxyphenoxy)ethylazanediyl)bis(1-(9Hcarbazol-4-yloxy)propan-2-ol) (Mw 645.76) [51].
Oxidation led to the most active degradation of CAV. The chromatograms showed many different peaks; however, the peak purity was still satisfactory, indicating an absence of coelutions (see Figure S6 in Supplementary Materials). Following the comprehensive analysis, a variety of products was unveiled. Firstly, (E)-2-(9H-carbazol-4-yloxy)ethanol was characterized by a retention time (RT) of 11.716 and molecular formula of C14H12NO2 with m/z 226.05 ([M+H+]) +]) [52]. Subsequently, 4-Hydroxycarbazole (C12H9NO) emerged, with an RT of 10.263 min and m/z 182.03 (Mw 183) [53]. Another identified product was 4-(2-Oxiranylmethoxy)-9H-carbazole (C15H13NO2), with an RT of 12.127 min and m/z 238.04 (Mw 239.27) [54]. The analysis also revealed N-[(2RS)-3-(9H-carbazol-4-yloxy)-2-hydroxypropyl]-N-[2-(2-methoxyphenoxy) ethyl]hydroxylamine, characterized by an RT of 12.384 and m/z 421.15 [51]. Finally, an unknown impurity (C14H10NO) manifested itself with an RT of 12.910 and m/z 208.01 [52].
The relative molecular mass of FLP was 384.254. In the MS spectrometry of the control, pure API, the main molecular ion obtained was m/z 337.96 ([M+H+]), which corresponds to known and previously existing spectra of this substance. FLP was shown to be quite stable under the conditions of accelerated degradation, such as oxidation, thermal stress, and the influence of alkalis and acids, as demonstrated in Table 7. None of the presented chromatograms contain degradation products of FLP (Figure 10). The peak shown around RT 11.8 min, corresponding to stress conditions associated with the oxidation, was not a degradation product of FLP, since its UV spectrum corresponded to carvedilol.
In summary, it is important to emphasize the significance of the forced degradation experiments conducted as part of the validation of the analytical method. These experiments were designed to assess the specificity of the method under various stability scenarios, a critical requirement, as outlined in the ICH Q2 (R2) guideline [7]. The data obtained from these trials demonstrate that the analytical method can distinctly identify and quantify the active pharmaceutical ingredient (API) in the presence of its degradation products, irrespective of the stress conditions applied. The analytical method’s capacity to consistently quantify and distinguish the API, even in the presence of degradation products, underscores its specificity and suitability for stability studies.
3.2.2. Linearity, Accuracy, Precision Including Repeatability, and Intermediate Precision
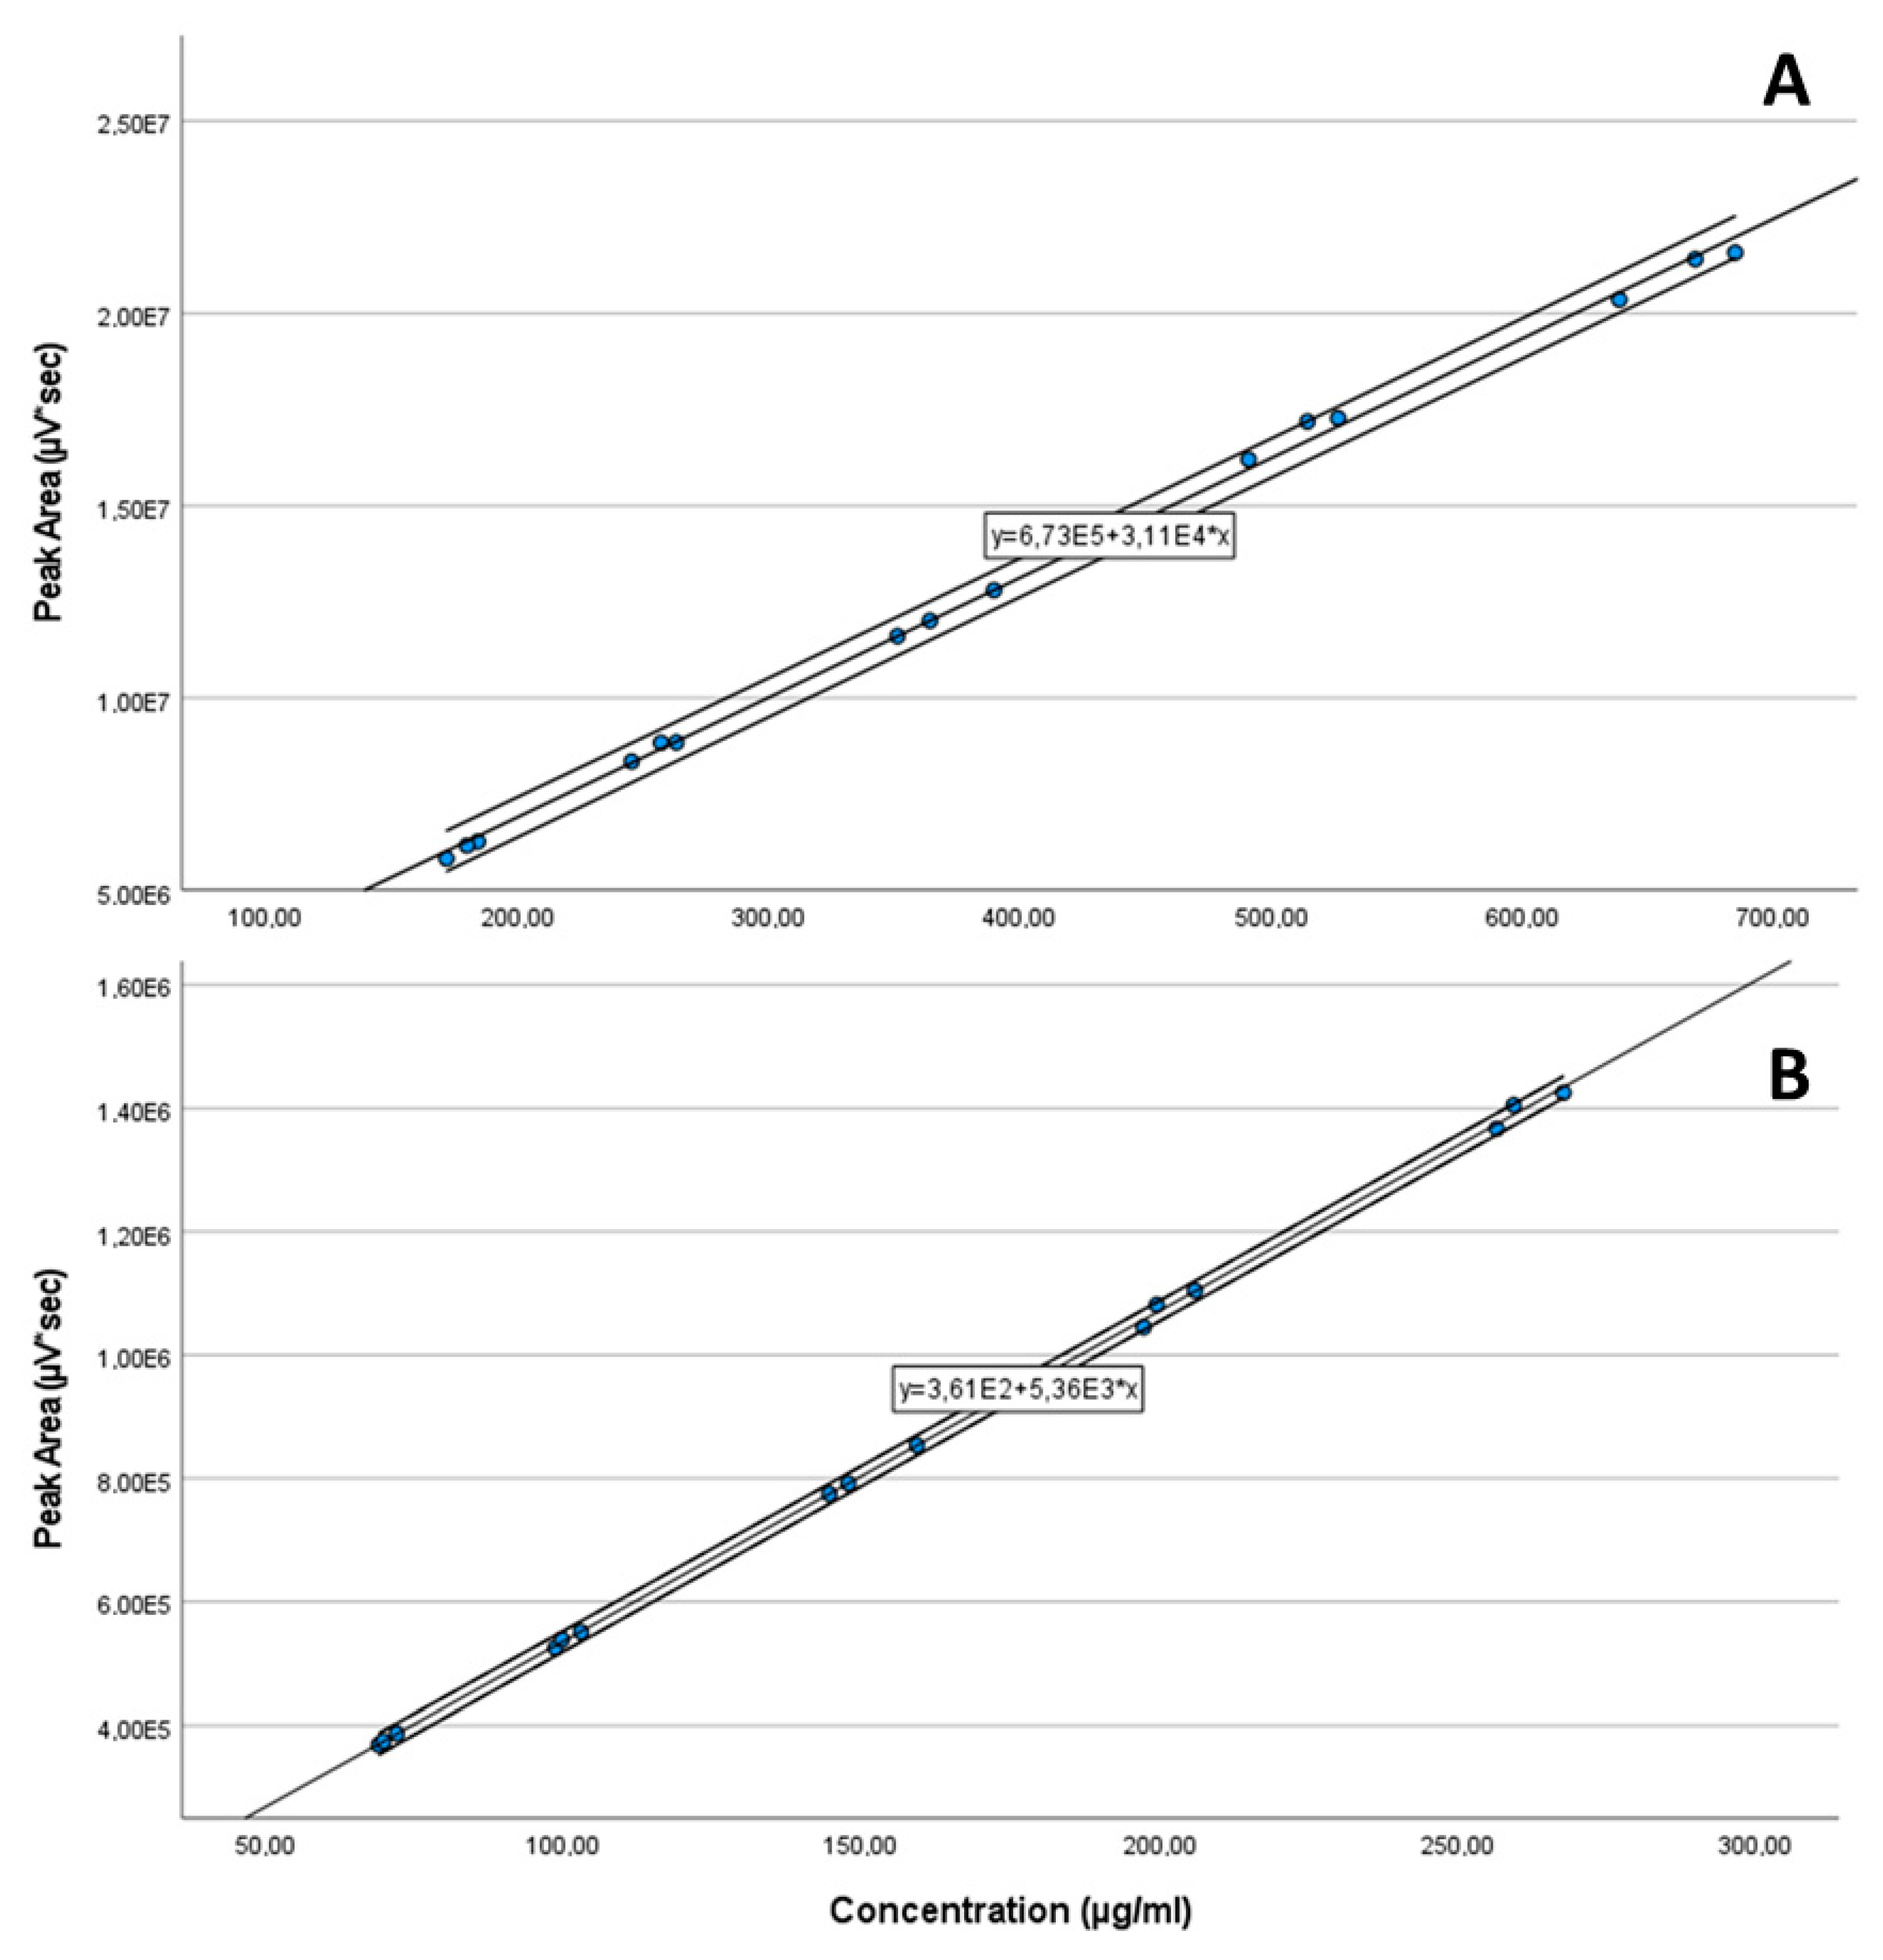
Five solutions were prepared in a concentration range including 70 and 130% of the declared content/label claim of each API [7] by weighing and dissolving in the mixture of 70:30% v/v of acetonitrile:water as diluent in triplicates. The linearity is shown in Figure 11, and was proven from 30–650 µg/mL (R2 = 0.9984) for CAV and 32–260 µg/mL (R2 = 0.9996) for FLP.
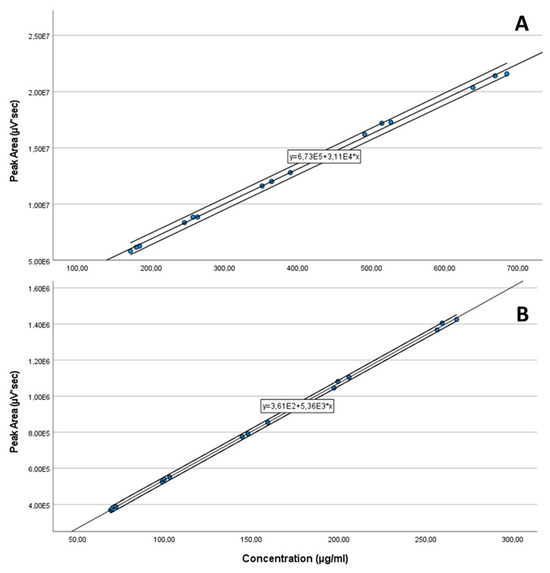
Figure 11.
Linearity plots of CAV (30–650 µg/mL) (A) and FLP (32–260 µg/mL) (B).
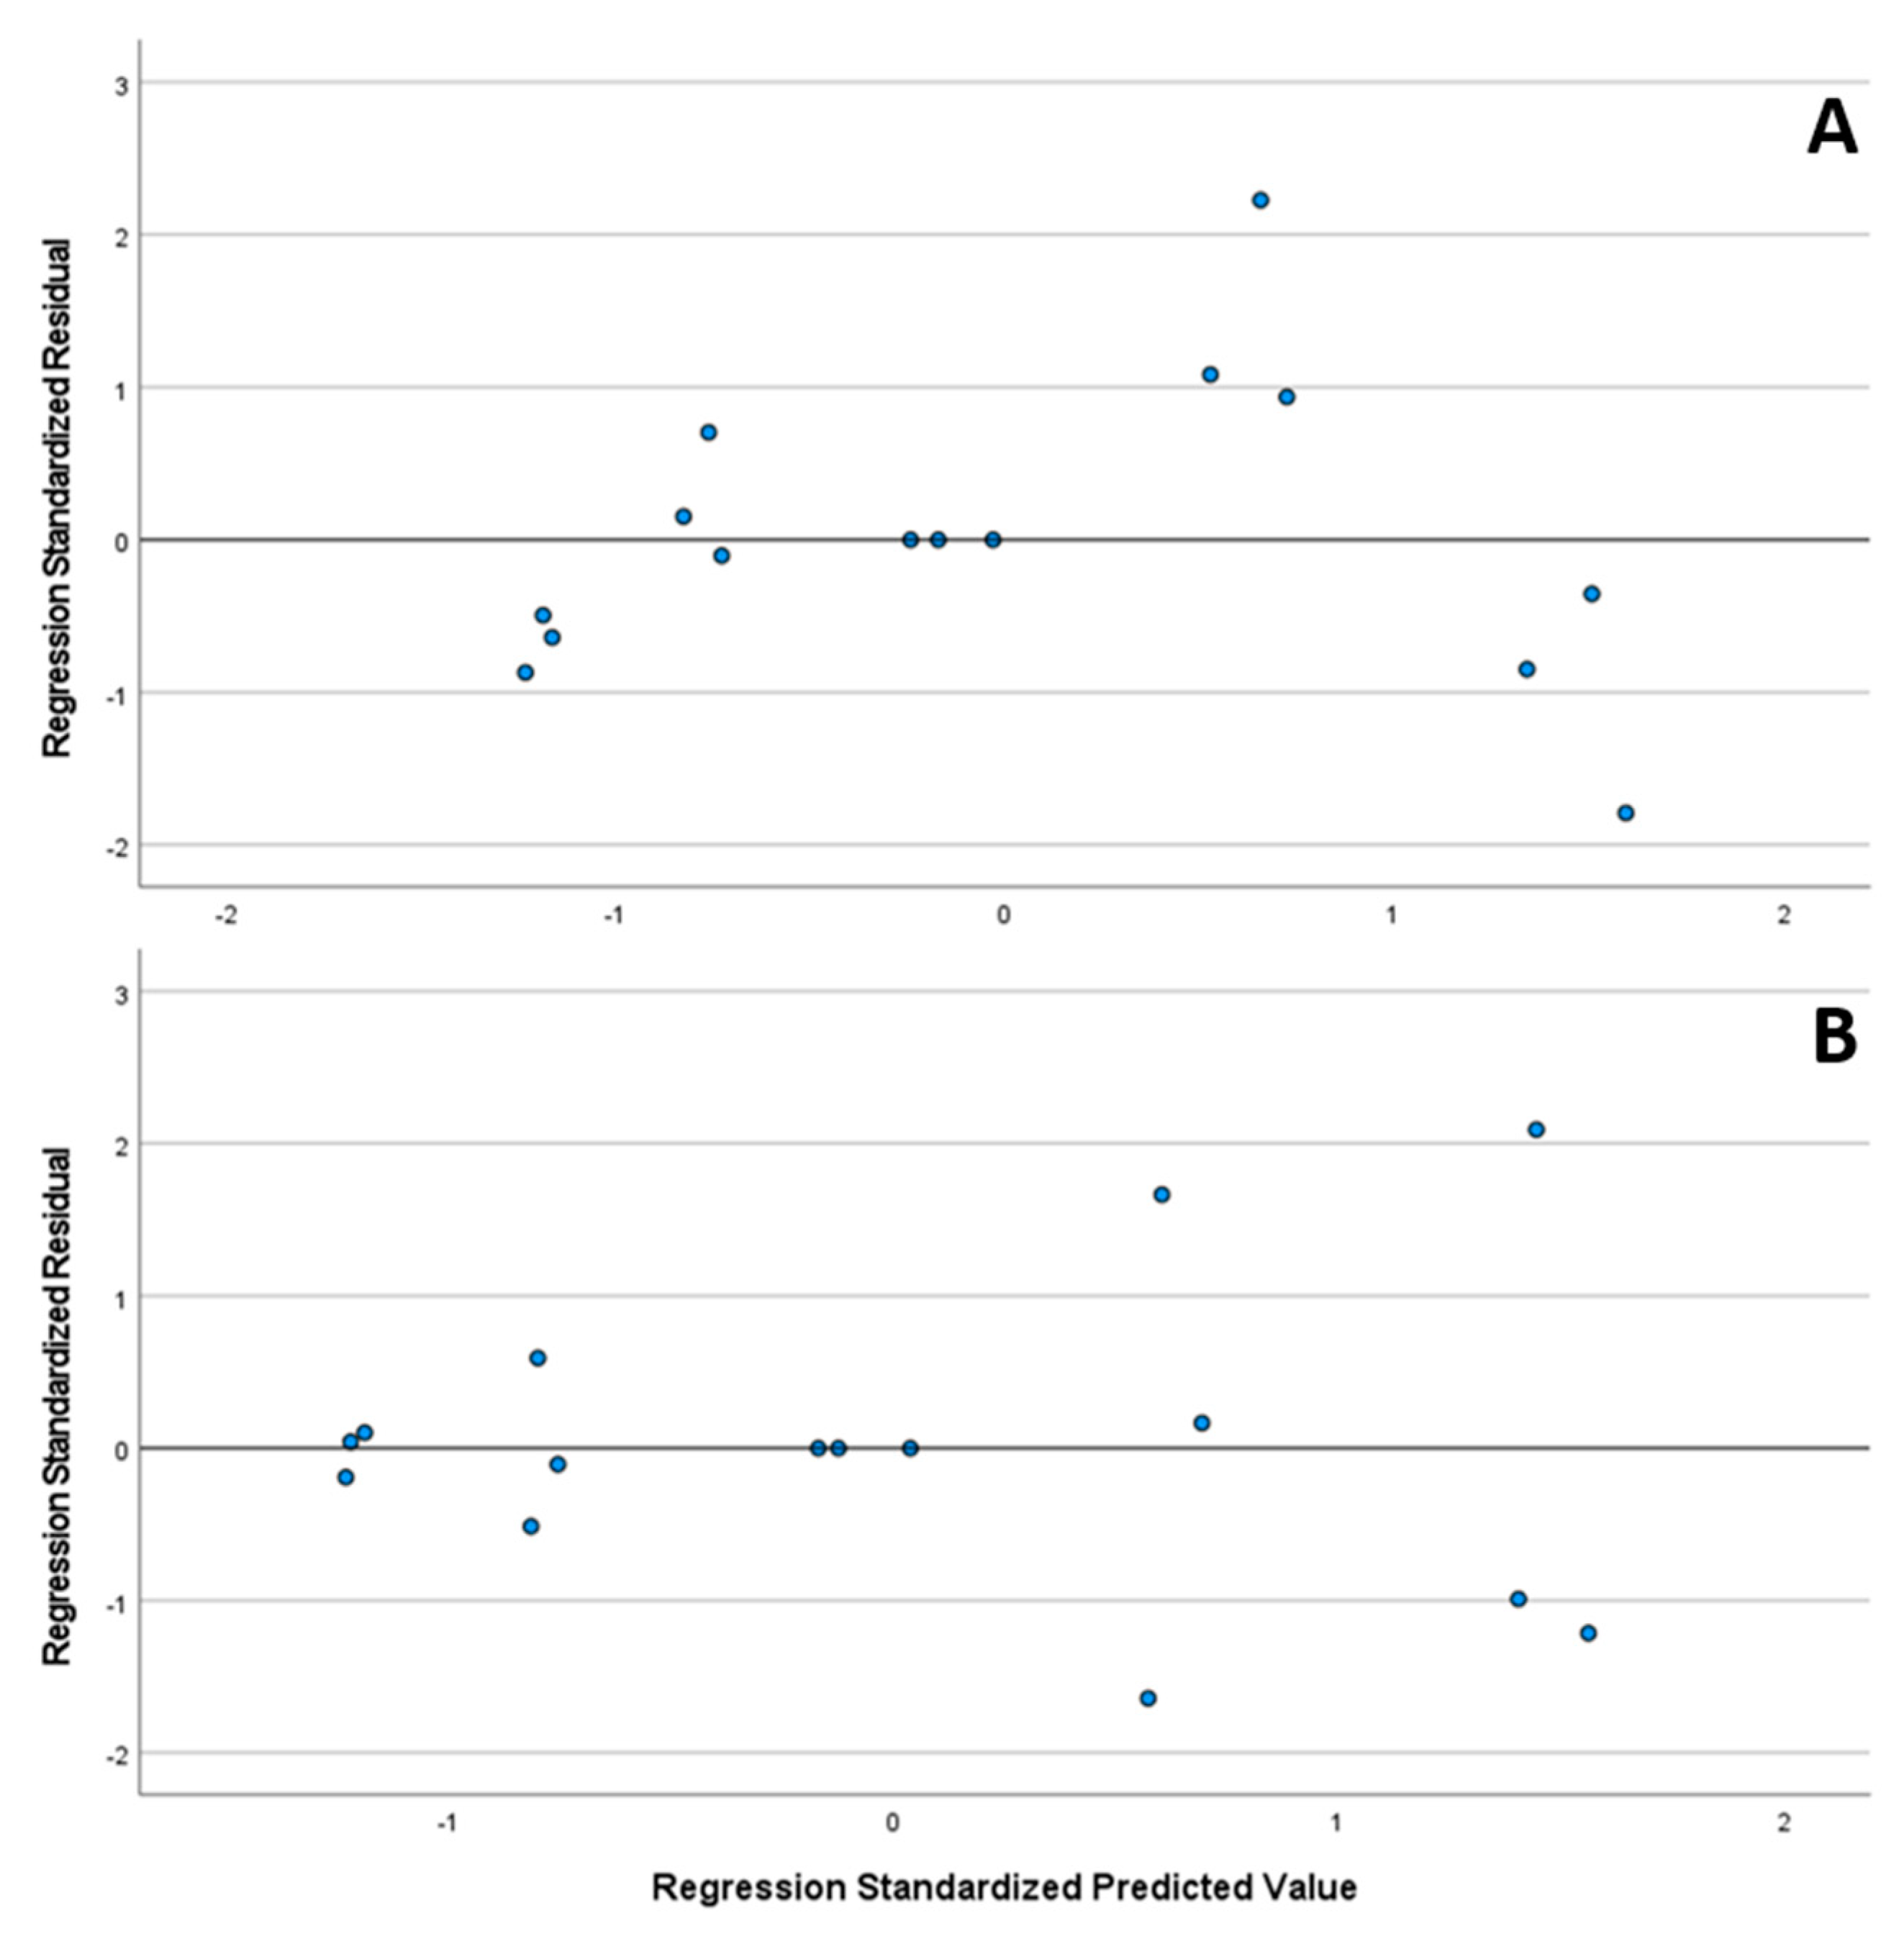
Furthermore, in Figure 12, the standardized residual plot is presented, with no apparent outliers or points of influence throughout the whole concentration range. The normal distribution of the standardized residuals of both substances was verified using the Shapiro–Wilk test (CAV p = 0.717/FLP p = 0.164).
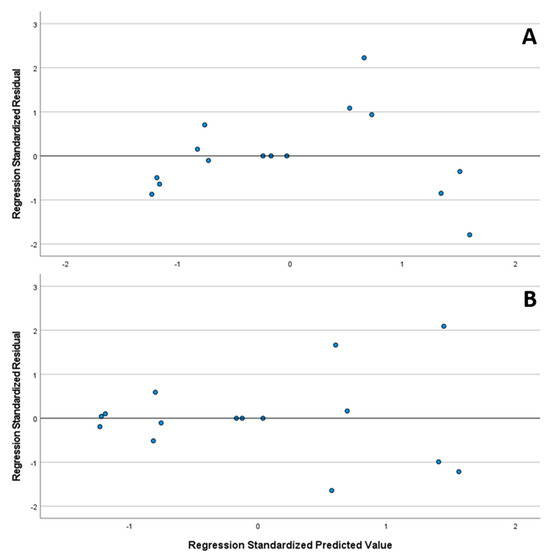
Figure 12.
Standardized residual plot of linearities from CAV (A) and FLP (B).
The accuracy was established based on the calculated recoveries at three concentration levels in triplicate. All the recoveries were in the range of 100 ± 3% (Table 8).

Table 8.
Accuracy results from validation of the method.
The procedure was precise and reproducible for the analytes, since the RSDs for repeatability and intermediate precision were below 2.0%. Both results were statistically proven to be the same at a 95% confidence interval, with a p > 0.05 (Table 9).

Table 9.
Precision and T-Student test results for carvedilol and felodipine.
3.2.3. Robustness
The robustness of an analytical procedure delineates its capacity to withstand minor, yet deliberate, alterations in methodological parameters, thereby elucidating the method’s reliability in regular operation [7].
The evaluation of robustness primarily focused on the assay concentration as the sole dependent variable, examining the stability of solutions over a span of 72 h (n = 6) and at baseline (n = 54) under refrigerated conditions. The following factors were included:
- Stability under refrigerated conditions (0 h n = 54, 72 h n = 6);
- Column temperature (39 °C n = 6, 38 °C n = 48, 37 °C n = 6);
- Flow rate (0.21 mL/min n = 6, 0.20 mL/min n = 48, 0.19 mL/min n = 6);
- pH of the mobile phase buffer (4.7 n = 6, 4.5 n = 48, 4.3 n = 6);
- Organic modifier concentration (92% n = 6, 90% n = 48, 88% n = 6).
Adhering to all specified criteria, a univariate analysis of variance (ANOVA), Type III, exclusively considering the main effects, was executed for each API. Detailed outcomes are delineated in Table 10.

Table 10.
Univariate ANOVA results for the robustness assessment conducted during analytical method validation using the assay concentration as the dependent variable. MS = mean square, df = degree of freedom.
The procedure was robust for both analytes for all the tested variations, including stability, as there was no sufficient evidence to reject the null hypothesis at a significance level of 95% (Table 10). In addition, there were no important changes in the chromatographic features that were addressed in the development section according to ICH Q14 [6]. The results can be found in the Supplementary Materials.
3.3. Analytical Method Life Cycle
Variability in routine analytical methods is inevitable, leading to differences in their performance [55]. To ensure consistent compliance with the Acceptance Test Procedure (ATP), the following control strategies were implemented:
- Consistency in reagents: Manufacturers of key reagents, especially ammonium acetate buffer salt and chromatographic columns, remain the same throughout the analysis. This ensures that the quality and composition of these critical components remain constant, minimizing variability in the method response.
- Control ranges for analytical parameters: Control ranges for essential analytical parameters such as flow rate, pH, column temperature, and organic modifier percentage are established [55,56]. These ranges serve as bounds within which the method is expected to perform optimally. Any deviations from these control ranges can serve as indication points for potential issues or necessary adjustments.
- Control charts for chromatographic features: Chromatographic features, such as peak shape, retention time, and signal intensity, are recorded and monitored using control charts during day-to-day operations [56]. These charts provide a visual representation of the method’s performance over time, allowing for the timely detection of any unexpected variations or anomalies in the methodology. By promptly identifying such deviations, appropriate corrective actions can be taken to maintain the integrity and reliability of the analytical method.
The chromatographic features were monitored and captured over a year and illustrated as control charts (Supplementary Materials Figures S11–S18).
The monitored parameters included the USP plate number, tailing factor, capacity factor, and purity flag, which represents the sole attribute parameter. By charting these parameters over time, our goal was to evaluate the analytical method’s stability and capability for analyzing the APIs.
The dataset encompassed 25 data points for each API. Although this number of data points might appear small, it offers valuable insights into the method’s performance over a prolonged duration. During the analysis, there were instances where some control chart rules were breached. It is crucial to highlight that these breaches occurred within the established control limits, maintaining the process performance within acceptable parameters. This emphasizes the necessity of defining suitable control limits that align with the analytical method’s specific needs.
Despite the noted breaches, the process performance indicators, such as the process capability indices, predominantly surpassed the threshold of 2, signifying substantial process capability and stability. The only exception was the USP plate number for FLP, which fell below 1.5 for CpK and PpK, yet this exception still reinforces the HPLC method’s reliability and consistency for CAV and FLP analysis.
Implementing these control strategies helps to ensure the consistent and reliable performance of the analytical method, and facilitates the early detection and mitigation of any unforeseen issues. Through the application and monitoring of the analytical parameters and employing control charts [56], the method’s overall performance and adherence to established criteria can be continuously assessed and improved.
4. Conclusions
In this study, we developed a single reversed-phase UPLC stability-indicating method for the simultaneous analysis of two APIs (CAV and FLP) in their fixed-dose combination as an oral dosage form. This method, grounded in AQbD principles and incorporating a statistical evaluation model, was validated in accordance with ICH Q2 and Q14 guidelines, demonstrating linearity, accuracy, precision, specificity, and robustness.
Our findings offer a systematic approach to analytical method development using QbD principles, which not only enhances the understanding of the procedure, but also contributes to reduced labor and regulatory costs while ensuring superior data quality [45].
Supplementary Materials
The following supporting information can be downloaded at: https://www.mdpi.com/article/10.3390/scipharm92020022/s1, Figures S1–S5: Purity plot of carvedilol on forced degradations; Figures S6–S10: Purity plot of felodipine on forced degradations; Figures S11–S14: CAV Control charts for USP plates, tailing, capacity factor, and purity flag; Figures S15–S18: FLP Control charts for USP plates, tailing, capacity factor, and purity flag; Tables S1 and S2: Chromatographic feature results from robustness test from method validation for CAV and FLP; Table S3: The coefficient table for the final reduced model for each substance and response, A being the mobile pH and the hard-to-change-factor, B the column type, and C the organic modifier. The 2-factor interactions A [1]B [1], A [2]B [1], A [3]B [1], A [1]B [2], A [2]B [2], A [3]B [2], A [1]B [3], A [2]B [3], and A [3]B [3] were non-significant for either of the cases and were left out of the table. p-value shading: p < 0.05; 0.05 ≤ p< 0.1; p ≥ 0.1.; Table S4: The coefficient table for the final reduced model for each substance and response, A being methanol concentration, b the column temperature, and C the flow rate. The 2-factor interactions AB and BC were non-significant for either of the cases and were left out of the table. p-value shading: p < 0.05; 0.05 ≤ p<0.1; p ≥ 0.1.
Author Contributions
Conceptualization, J.A.A.U. and R.A.L.G.; methodology, J.A.A.U., V.M. and K.B.; validation, V.M., K.B. and A.F.; formal analysis, J.A.A.U., V.M., K.B., R.A.L.G., A.F. and D.J.; resources, R.A.L.G. and S.S.-B.; data curation, V.M. and K.B.; writing—original draft preparation, J.A.A.U. and D.J.; writing—review and editing, V.M., K.B., R.A.L.G., A.F. and S.S.-B.; visualization, J.A.A.U.; supervision, J.A.A.U. and R.A.L.G.; project administration, S.S.-B.; funding acquisition, S.S.-B. All authors have read and agreed to the published version of the manuscript.
Funding
This research was funded within the framework of COMET—Competence Centers for Excellent Technologies by BMK, BMAW, Land Steiermark, and SFG. The COMET program is managed by the FFG. Supported by the TU Graz Open Access Publishing Fund.
Data Availability Statement
All data and materials are present in the manuscript and Supplementary Materials.
Acknowledgments
Open Access Funding by the Graz University of Technology.
Conflicts of Interest
Authors Mr. Jesús Alberto Afonso Urich, Ms. Viktoria Marko, Ms. Katharina Boehm, Ms. Raymar Andreina Lara Garcia, Ms. Anna Fedorko, and Prof. Dr. Sharareh Salar-Behzadi are employed at Research Center Pharmaceutical Engineering GmbH. We declare that the research was conducted in the absence of any commercial or financial relationships that could be construed as a potential conflict of interest.
Abbreviations
| API | Active Pharmaceutical Ingredient |
| AQbD | Analytical Quality by Design |
| ATP | Analytical Target Profile |
| CAV | Carvedilol |
| CMeAs | Critical Method Attributes |
| CMePs | Critical Method Parameters |
| FDA | United States Food and Drug Administration |
| FDC | Fixed-Dose Combination |
| FLP | Felodipine |
| HPLC | High-Performance Liquid Chromatography |
| ICH | International Council of Harmonization |
| MS | Mass Spectrometry |
| OOS | Out of Specification |
| OOT | Out of Trend |
| PDA | Photo Diode Array |
| QbD | Quality by Design |
| QC | Quality Control |
| QDa | Single Quadrupole Mass Detector from Waters Corp. |
| QRM | Quality Risk Management |
| QTPP | Quality Target Product Profile |
| RT | Retention Time |
| UPLC | Ultra-Performance Liquid Chromatography |
| USP | United States Pharmacopoeia |
| UV | Ultraviolet |
References
- Ginsburg, G.S.; Phillips, K.A. Precision medicine: From science to value. Health Aff. 2018, 37, 694–701. [Google Scholar] [CrossRef] [PubMed]
- Tucker, G.; DeSilva, B.; Dressman, J.; Ito, M.; Kumamoto, T.; Mager, D.; Mahler, H.C.; Maitland-van der Zee, A.H.; Pauletti, G.M.; Sasaki, H.; et al. Current Challenges and Potential Opportunities for the Pharmaceutical Sciences to Make Global Impact: An FIP Perspective. J. Pharm. Sci. 2016, 105, 2489–2497. [Google Scholar] [CrossRef] [PubMed]
- Xu, Q. Advancing USP compendial methods for fixed dose combinations: A case study of metoprolol tartrate and hydrochlorothiazide tablets. J. Pharm. Anal. 2019, 9, 77–82. [Google Scholar] [CrossRef] [PubMed]
- USP43-NF38. ⟨2⟩ Oral Drug Products—Product Quality Tests. Available online: https://online.uspnf.com/uspnf/document/1_GUID-DA161518-EC27-4647-AACD-29D28F2A4E92_5_en-US?source=Search%20Results&highlight=Product%20test (accessed on 29 January 2022).
- United States Pharmacopoeia. ⟨621⟩. Chromatography. Available online: https://online.uspnf.com/uspnf/document/1_GUID-6C3DF8B8-D12E-4253-A0E7-6855670CDB7B_1_en-US?source= (accessed on 20 January 2021).
- International Coucil of Harmonisation. (Concept Paper) Q14: Analytical Procedure Development and Revision of Q2(R1) Analytical Validation; International Council of Harmonization: Geneva, Switzerland, 2023. [Google Scholar]
- International Council for Harmonisation Validation of Analytical Procedures Q2(R2). Available online: https://www.ema.europa.eu/en/documents/scientific-guideline/ich-guideline-q2r2-validation-analytical-procedures-step-2b_en.pdf (accessed on 25 October 2022).
- Santos, L.; Behnam, D.; Clydewyn, A.; Clark, J. USP Monograph Modernization Initiative. Available online: https://www.americanpharmaceuticalreview.com/Featured-Articles/173161-USP-Monograph-Modernization-Initiative/ (accessed on 20 January 2022).
- Leonetti, G.; Egan, C.G. Use of carvedilol in hypertension: An update. Vasc. Health Risk Manag. 2012, 307, 1578. [Google Scholar] [CrossRef] [PubMed]
- Zendaoui, A.; Lachance, D.; Roussel, É.; Couet, J.; Arsenault, M. Usefulness of Carvedilol in the Treatment of Chronic Aortic Valve Regurgitation. Circ. Hear. Fail. 2011, 4, 207–213. [Google Scholar] [CrossRef]
- Keating, G.M.; Jarvis, B. Carvedilol: A review of its use in chronic heart failure. Drugs 2003, 63, 1697–1741. [Google Scholar] [CrossRef] [PubMed]
- Haria, M.; Plosker, G.L.; Markham, A. Felodipine/metoprolol: A review of the fixed dose controlled release formulation in the management of essential hypertension. Drugs 2000, 59, 141–157. [Google Scholar] [CrossRef] [PubMed]
- Collste, P.; Danielsson, M.; Elmfeldt, D.; Feleke, E.; Gelin, A.; Hedner, T.; Rydén, L. Long Term Experience of Felodipine in Combination with β-Blockade and Diuretics in Refractory Hypertension. Drugs 1985, 29, 124–130. [Google Scholar] [CrossRef] [PubMed]
- Leon, M.B.; Rosing, D.R.; Bonow, R.O.; Epstein, S.E. Combination therapy with calcium-channel blockers and beta blockers for chronic stable angina pectoris. Am. J. Cardiol. 1985, 55, B69–B80. [Google Scholar] [CrossRef]
- Panella, C.; Ferretti, R.; Casulli, A.; Cirilli, R. Temperature and eluent composition effects on enantiomer separation of carvedilol by high-performance liquid chromatography on immobilized amylose-based chiral stationary phases. J. Pharm. Anal. 2019, 9, 324–331. [Google Scholar] [CrossRef]
- Li, J.; Wang, L.; Wang, S.; Chen, M.; Gu, E.; Hu, G.; Ge, R. Simultaneous quantification of carvedilol and its metabolites in rat plasma by ultra performance liquid chromatography tandem mass spectrometry and pharmacokinetic application. J. Chromatogr. B 2015, 974, 138–146. [Google Scholar] [CrossRef] [PubMed]
- Yilmaz, B.; Arslan, S. HPLC/Fluorometric Detection of Carvedilol in Real Human Plasma Samples Using Liquid–Liquid Extraction. J. Chromatogr. Sci. 2016, 54, 413–418. [Google Scholar] [CrossRef] [PubMed]
- Kaplan, K.; Gürkan Polat, T.; Duman, O.; Tunç, S. Development of a simple, rapid, accurate, and sensitive method for carvedilol analysis in human blood serum by reversed phase-high performance liquid chromatography with diode array detector. J. Liq. Chromatogr. Relat. Technol. 2018, 41, 532–543. [Google Scholar] [CrossRef]
- Walash, M.; Belal, F.; El-Enany, N.; Zayed, S. Micellar liquid chromatographic determination of felodipine in tablets and human plasma with fluorescence detection: Application to stability studies and content uniformity testing. Anal. Methods 2014, 6, 3401. [Google Scholar] [CrossRef]
- Albu, F.; Sora, I.; Tache, F.; David, V.; Medvedovici, A. On-Line SPE on Restricted Access Adsorbent for HPLC-MS/MS Analysis of Felodipine in Plasma Samples. Anal. Lett. 2010, 43, 1330–1343. [Google Scholar] [CrossRef]
- Patre, N.G.; Patil, S.S. Development and Validation of Stability Indicating Assay Method for Determination of Felodipine in Tablet Dosage Form. Int. J. Pharm. Sci. Drug Res. 2018, 10, 268–273. [Google Scholar] [CrossRef]
- Salunkhe, N.H.; Jadhav, N.R.; Bhinge, S.D. Validated RP-HPLC method for quantification of felodipine in rabbit plasma: Application in a bioequivalence study. Ann. Pharm. Françaises 2019, 77, 15–27. [Google Scholar] [CrossRef]
- Al-Adl, S.M.; Abdel-Aziz, L.M.; Mohamed, M.A.M. HPLC Determination of Carvedilol, Candesartan Cilexetil and Hydrochlorothiazide in Their Bulk and Tablet Dosage Forms. Anal. Chem. Lett. 2017, 7, 188–200. [Google Scholar] [CrossRef]
- Taha, E.A.; Fouad, M.M.; Attia, A.K.; Yousef, Z.M. RP-HPLC method development and validation for simultaneous estimation of ramipril and felodipine. Eur. J. Chem. 2019, 10, 113–117. [Google Scholar] [CrossRef]
- European Medicine Agency. QbD: A Global Implementation Perspective The EU Perspective. Available online: https://www.ema.europa.eu/en/documents/presentation/presentation-quality-design-global-implementation-perspective-european-union-perspective-riccardo_en.pdf (accessed on 2 April 2024).
- European Medicine Agency Q8, Q9, Q10 Questions and Answers|Enhanced Reader. Available online: https://www.ema.europa.eu/en/documents/scientific-guideline/ich-guideline-q8-q9-q10-questions-answers-volume-4_en.pdf (accessed on 1 April 2024).
- Reid, G.L.; Cheng, G.; Fortin, D.T.; Harwood, J.W.; Morgado, J.E.; Wang, J.; Xue, G. Reversed-phase liquid chromatographic method development in an analytical quality by design framework. J. Liq. Chromatogr. Relat. Technol. 2013, 36, 2612–2638. [Google Scholar] [CrossRef]
- Moreira, C.d.S.; Lourenço, F.R. Development and optimization of a stability-indicating chromatographic method for verapamil hydrochloride and its impurities in tablets using an analytical quality by design (AQbD) approach. Microchem. J. 2020, 154, 104610. [Google Scholar] [CrossRef]
- International Council of Harmonization. ICH Guideline Q9 on Quality Risk Management; International Council of Harmonization: Geneva, Switzerland, 2014; Volume 44, pp. 1–20. [Google Scholar]
- International Coucil of Harmonisation. Guideline Q10 on Pharmaceutical Quality System; International Coucil of Harmonisation: Geneva, Switzerland, 2015; Volume 44. [Google Scholar]
- International Coucil of Harmonisation. Guideline Q8 (R2) Pharmaceutical Development; International Coucil of Harmonisation: Geneva, Switzerland, 2009; Volume 8. [Google Scholar]
- Analytical Quality by Design (AQbD) in Pharmaceutical Development | American Pharmaceutical Review—The Review of American Pharmaceutical Business & Technology. Available online: https://www.americanpharmaceuticalreview.com/Featured-Articles/144191-Analytical-Quality-by-Design-AQbD-in-Pharmaceutical-Development/ (accessed on 2 March 2021).
- Kochling, J.; Wu, W.; Hua, Y.; Guan, Q.; Castaneda-Merced, J. A platform analytical quality by design (AQbD) approach for multiple UHPLC-UV and UHPLC-MS methods development for protein analysis. J. Pharm. Biomed. Anal. 2016, 125, 130–139. [Google Scholar] [CrossRef] [PubMed]
- Ramalingam, P.; Jahnavi, B. QbD Considerations for Analytical Development; Elsevier Inc.: Amsterdam, The Netherlands, 2019; ISBN 9780128157992. [Google Scholar]
- Žigart, N.; Časar, Z. Development of a Stability-Indicating Analytical Method for Determination of Venetoclax Using AQbD Principles. ACS Omega 2020, 5, 17726–17742. [Google Scholar] [CrossRef]
- Tome, T.; Žigart, N.; Časar, Z.; Obreza, A. Development and Optimization of Liquid Chromatography Analytical Methods by Using AQbD Principles: Overview and Recent Advances. Org. Process Res. Dev. 2019, 23, 1784–1802. [Google Scholar] [CrossRef]
- Guiraldelli, A. USP Case Study: Stability-Indicating Method Development using AQbD Concepts: AQbD Workflow and MODR Validation. 2021. Available online: https://www.youtube.com/watch?v=ZoYBTeTJmm4 (accessed on 3 March 2021).
- Otašević, B.; Šljivić, J.; Protić, A.; Maljurić, N.; Malenović, A.; Zečević, M. Comparison of AQbD and grid point search methodology in the development of micellar HPLC method for the analysis of cilazapril and hydrochlorothiazide dosage form stability. Microchem. J. 2019, 145, 655–663. [Google Scholar] [CrossRef]
- Fukuda, I.M.; Pinto, C.F.F.; Moreira, C.D.S.; Saviano, A.M.; Lourenço, F.R. Design of experiments (DoE) applied to pharmaceutical and analytical quality by design (QbD). Braz. J. Pharm. Sci. 2018, 54, 1–16. [Google Scholar] [CrossRef]
- Verch, T.; Campa, C.; Chéry, C.C.; Frenkel, R.; Graul, T.; Jaya, N.; Nakhle, B.; Springall, J.; Starkey, J.; Wypych, J.; et al. Analytical Quality by Design, Life Cycle Management, and Method Control. AAPS J. 2022, 24, 34. [Google Scholar] [CrossRef]
- Volta e Sousa, L.; Gonçalves, R.; Menezes, J.C.; Ramos, A. Analytical Method Lifecycle Management in Pharmaceutical Industry: A Review. AAPS PharmSciTech 2021, 22, 128. [Google Scholar] [CrossRef]
- Ermer, J.; Aguiar, D.; Boden, A.; Ding, B.; Obeng, D.; Rose, M.; Vokrot, J. Lifecycle management in pharmaceutical analysis: How to establish an efficient and relevant continued performance monitoring program. J. Pharm. Biomed. Anal. 2020, 181, 113051. [Google Scholar] [CrossRef]
- International Conference of Harmonization Technical and Regulatory Considerations for Pharmaceutical Product Life Cycle Management Q12. Available online: https://database.ich.org/sites/default/files/Q12_Guideline_Step4_2019_1119.pdf (accessed on 25 October 2022).
- USP-NF ⟨1220⟩. Analytical Procedure Life Cycle. Available online: https://online.uspnf.com/uspnf/document/1_GUID-35D7E47E-65E5-49B7-B4CC-4D96FA230821_2_en-US?source=Quick%20Search&highlight=1220 (accessed on 18 January 2022).
- Parr, M.K.; Schmidt, A.H. Life cycle management of analytical methods. J. Pharm. Biomed. Anal. 2018, 147, 506–517. [Google Scholar] [CrossRef]
- Watson, S. Applying QbD Principles to Analytical Development. Available online: https://www.pharm-int.com/wp-content/uploads/2021/08/Applying-QbD-Principles-to-Analytical-Development_Article.pdf (accessed on 3 March 2021).
- U.S. Food and Drug Administration. ICH Q1A (R2) Stability Testing of new Drug Substances and Products; U.S. Food and Drug Administration: Silver Spring, MD, USA, 2003.
- U.S. Food and Drug Administration. ORL Laboratory Manual Volume II Methods, Method Verification and Validation; U.S. Food and Drug Administration: Silver Spring, MD, USA, 2020.
- United States Pharmacopoeia. ⟨2⟩ Oral Drug Products—Product Quality Tests. Available online: https://online.uspnf.com/uspnf/document/1_GUID-DA161518-EC27-4647-AACD-29D28F2A4E92_5_en-US?source=Search%20Results&highlight=stability%20indicating (accessed on 3 March 2021).
- What Is the Difference between a T3 Trifunctional Column and a C18 Trifunctional Column?—WKB73010—Waters. Available online: https://support.waters.com/KB_Chem/Columns/WKB73010_What_is_the_difference_between_a_T3_trifunctional_column_and_a_C18_trifunctional_column (accessed on 21 October 2021).
- Ajan, P.G.; Rohith, T.; Santosh, P.; Mantelingu, K.; Rangappa, K.S.; Kumara, M.N. Rapid, Highly Efficient and Stability Indicating Rp-Uplc Method for The Quantitative Determination of Potential Impurities of Carvedilol Active Pharmaceutical Ingredient. Int. J. Pharm. Pharm. Sci. 2014, 6, 214–220. [Google Scholar]
- Chander, C.P.; Raju, B.; Sulthana, A.; Srinivas, R. LC–ESI–MS/MS study of carvedilol and its stress degradation products. Anal. Methods 2013, 5, 4330. [Google Scholar] [CrossRef]
- Abolghasem, J.; Mohammad, H.; Nasrin, S. Non-Aqueous Electromigration Analysis of Some Degradation Products of Carvedilol. Iran J. Pharm. Res. 2014, 13, 471–486. [Google Scholar]
- Samba Siva Rao, L.; Madhavan, P.; Vanitha, K. Prakash Development and validation of stability indicating method for the quantitative determination of carvedilol and its related impurities in pharmaceutical dosage forms using RP HPLC. J. Chem. Pharm. Res. 2015, 7, 144–154. [Google Scholar]
- Montgomery, D.C. Introduction to Statistical Quality Control, 7th ed.; John Wiley & Sons Ltd.: Hoboken, NJ, USA, 2012; ISBN 978-1-118-14681-1. [Google Scholar]
- Maziarz, M.; Rainville, P.; Naughton, S. Continued Performance Verification of Analytical Procedures Using Control Charts of Empower Chromatography Data Software; Milford: London, UK, 2019. [Google Scholar]
Disclaimer/Publisher’s Note: The statements, opinions and data contained in all publications are solely those of the individual author(s) and contributor(s) and not of MDPI and/or the editor(s). MDPI and/or the editor(s) disclaim responsibility for any injury to people or property resulting from any ideas, methods, instructions or products referred to in the content. |
© 2024 by the authors. Licensee MDPI, Basel, Switzerland. This article is an open access article distributed under the terms and conditions of the Creative Commons Attribution (CC BY) license (https://creativecommons.org/licenses/by/4.0/).


