Article

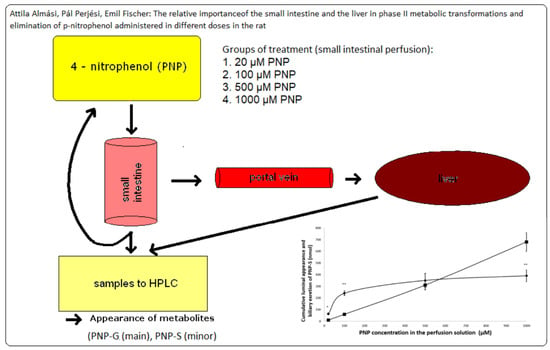
The Relative Importance of the Small Intestine and the Liver in Phase II Metabolic Transformations and Elimination of p-Nitrophenol Administered in Different Doses in the Rat

1
Institute of Pharmaceutical Chemistry, Faculty of Pharmacy, University of Pécs, 7624 Pécs, Hungary
2
Institute of Pharmacology and Pharmacotherapy, Medical Faculty, University of Pécs, 7624 Pécs, Hungary
*
Author to whom correspondence should be addressed.
Sci. Pharm. 2020, 88(4), 51; https://doi.org/10.3390/scipharm88040051
Submission received: 9 August 2020 / Revised: 10 October 2020 / Accepted: 19 October 2020 / Published: 2 November 2020

Abstract

:
Intestinal and hepatic function have been investigated in phase II metabolic reactions and elimination of p-nitrophenol (PNP) in the rat. A jejunal loop was cannulated and recirculated with isotonic solutions containing PNP in different concentrations (0, 20, 100, 500, 1000 µM). Samples were obtained from the perfusate at given intervals. To investigate the metabolic and excretory functions of the liver, the bile duct was cannulated, and the bile was collected. Metabolites of PNP were determined by validated HPLC (high pressure liquid chromatography) methods. The results demonstrated the relative importance of the small intestine and the liver in phase II metabolic transformations and elimination of PNP. There were significant differences between the luminal and biliary appearances of p-nitrophenol-glucuronide (PNP-G) and p-nitrophenol–sulfate (PNP-S). The PNP-G appeared in the intestinal lumen at the lower PNP concentrations (20 µM and 100 µM) at higher rate than in the bile. No significant difference was found between the intestinal and the biliary excretion of PNP-G when PNP was administered at a concentration of 500 µM. However, a reverse ratio of these parameters was observed at the administration of 1000 µM PNP. The results indicated that both the small intestine and the liver might play an important role in phase II metabolic reactions and elimination of PNP. However, the relative importance of the small intestine and the liver can be dependent on the dose of drugs.

Graphical Abstract

1. Introduction

After administration, drug molecules must reach the site of action to be effective. Per os delivered drugs during the pharmacokinetic processes, for example, can be inactivated by enzymes in the gut wall cells and hepatocytes [1,2,3,4]. It is well known that the liver has a vital role in the biotransformation of xenobiotics. However, some new experimental results demonstrated that the extrahepatic drug metabolism could also be significant [4,5,6,7,8]. A particular aspect of intestinal metabolism is its location at the site of the entry of xenobiotics. The metabolites of exogenous compounds formed in the small intestine can be excreted by enterocytes back into the intestinal lumen and, after that, can be discharged with the feces [9,10]. Enterocytes express several metabolic enzymes that are also found in the liver, including, e.g., UDP-glucuronyltransferases, sulfotransferases, esterases, and cytochromes P450 [11,12,13,14,15,16,17,18].
Earlier, we investigated the intestinal disappearance as well as the intestinal and hepatic phase II metabolism of p-nitrophenol in control and STZ-treated experimental animals [19,20,21,22,23]. p-Nitrophenol (PNP) was used as a model compound because it is well known that that PNP is metabolized almost exclusively by phase II metabolic reactions, namely by conjugation with glucuronic acid and sulfate [19,24,25,26,27,28], to form the metabolites p–nitrophenyl glucuronide (PNP-G) and p–nitrophenol sulfate (PNP-S). It was demonstrated that excretion of PNP-G into the small intestine gradually decreases towards the terminal ileum, being the highest in the proximal jejunum. On the contrary, the excretion of PNP-S was found to be slightly increased in the same direction. Furthermore, it was found that increasing the concentration of PNP in the small intestine perfusate results in saturation of excretion of the PNP-G metabolite into the perfusate [20].
4-Nitrophenol is used mainly to manufacture drugs, fungicides, and dyes, and to darken leather. Small amounts of the two substances can be found in the air, water, and soil. Therefore, breathing air, drinking water, and eating foods grown in soils that contain these substances can expose an individual to them. Some people may be exposed to higher than background levels of nitrophenols. Workers who produce or process these chemicals may be exposed to higher doses, particularly during spills or accidents. The reported LD50 values of the per os administered PNP to rats are 230 and 620 mg/kg/day. The cause of death was not indicated in any of these studies [28].
As a continuation of our earlier investigation, the present study was designed to investigate the intestinal and hepatic metabolism of PNP in the same experimental animal. Using this experimental protocol, we aimed to collect simultaneous data on the amount of PNP and its two phase II conjugates excreted to the small intestine by the gut epithelium and the liver (through the bile). The parent compound and the metabolites were determined by our previously developed, validated HPLC methods [19,22,23,29,30].
Exposure to PNP can occur in a wide range of subtoxic and toxic doses. Data on humans relevant to assessing its potential adverse effects are limited to some patch tests [31]. Thus, a direct relationship between the results of the animal experiments and the possible human hazard is not known at present [28,31]. In the present experiments, PNP was used in different concentrations (0 µM, 20 µM, 100 µM, 500 µM, and 1000 µM) in the luminal perfusion medium to compare the dose dependency of conjugation reactions and elimination (luminal appearance and biliary excretion) of PNP and its two conjugates in the same animal. Selection of the perfusate concentrations refers to low (0.014 mg and 0.070 mg) and high (0.35 mg and 0.70 mg) per os PNP administrations. The highest perfusate concentration (1.0 mM) refers to about an eightieth of the gastric juice concentration (82.7 mM) of the lower reported per os LD50 value of PNP (considering a 5 mL volume of gastric juice) [32]. The selected doses ensure a lack of acute toxic effects in the investigated organs during the experiments. Furthermore, the therapeutic dose of several phenolic drugs (e.g., estrons [33], capsaicinoids [34]), and the monomer flavonoid content of individual foods [35], fall into the range of our selected concentrations. PNP, having a simple—almost exclusively glucuronide- and sulfate-forming—metabolic profile, seems to be a proper model compound to investigate the relative importance of these two phase II metabolic pathways in the set concentration range.

2. Materials and Methods

2.1. Chemicals

p-Nitrophenol (PNP), the monopotassium salt of p-nitrophenol-glucuronide (PNP-G), p-nitrophenol-sulfate (PNP-S), p-ethylphenol (ETP), and tetrabutylammonium bromide (TBAB) were obtained from Sigma-Aldrich (Budapest, Hungary). All other chemicals and reagents were analytical or HPLC grade.
The standard isotonic perfusion medium had the following composition (mM): NaCl 96.4, KCl 7.0, CaCl2 3.0, MgSO4 1.0, sodium phosphate buffer (pH 7.4) 0.9, Tris buffer (pH 7.4) 29.5, glucose 14.0, mannitol 14.0.

2.2. Animals and Experimental Procedure

The experiments were performed according to the protocol used before [19,20,21,22,23,29,30]. Male Wistar rats (weighing 220–250 g) were used. The animals were fasted 18–20 h prior to the experiments; water was provided ad libitum. The animals were anesthetized with urethane (1.2 g/kg, i.p.). The abdomen was opened by a mid-line incision, and a jejunal loop (distance from the duodeno-jejunal flexure of about 15 cm; length of the jejunal loop of about 10 cm) was “in vivo” isolated and cannulated at its proximal and distal ends. Body temperature was maintained at 37 °C using a heat lamp. The lumen of the jejunal loop was gently flushed with warmed isotonic solution to remove digesta and food residues and then blown empty with 4–5 mL air. Perfusion through the lumen of the jejunal loop with isotonic medium containing PNP in different concentrations (0 μM, 20 μM, 100 μM, 500 μM, and 1000 μM) was carried out at a rate of 13 mL/min in a recirculation mode for 90 min. The volume of the samples obtained from the perfusion medium flowing out of the jejunal loop was 250 µL; the initial volume of the perfusate was 15 mL. The temperature of the perfusate was maintained at 37 °C. For investigation of the biliary excretion rate, the bile duct was cannulated with a PE-10 tubing and the bile collected in 15 min periods. Bile flow was measured gravimetrically, assuming a specific gravity of 1.0. Biliary excretion was calculated as the product of the concentration in bile and bile flow.
Each experimental group had eight animals. The collected samples were refrigerated (−20 °C) until analysis.

2.3. Sample Analysis

2.3.1. Instrumentation

The HPLC system consisted of a Varian 2010 pump (Varian, Palo Alto, CA, USA), a Rheodyne 7724i injection valve (Rheodyne, Northbrook, IL, USA), and a UV-Detector 308 (Labor MIM, Budapest, Hungary) detector. For data collection and integration, a PowerChrom 280 data module and software (eDAQ Europe, Warsaw, Poland) were used. A Nucleosil 100 C18 reversed phase column (250 mm × 4.6 mm I.D., 10 µm particle size) (Phenomenex, Torrance, CA, USA) and a TR-C-160K1 ODS guard column (Teknokroma, Barcelona, Spain) were employed in the HPLC measurements.
UV–Vis measurements were performed on a Pye Unicam PU 8800 UV–Vis spectrophotometer (Philips, Cambridge, UK) at ambient temperature. A Mettler Toledo MP 220 pH meter and a Mettler Toledo Inlab 413 electrode (Mettler Toledo, Budapest, Hungary) were used to adjusting the pH of the electrolyte solutions.

2.3.2. Analytical Conditions

The small intestine perfusate samples were analyzed by a UV–Vis RP-HPLC method developed and published earlier [29]. Briefly, the mobile phase consisted of methanol and distilled water (50:50 v/v%) containing 0.01 M TBAB. The perfusates were vortexed and centrifuged at 3000× g for 10 min before the analysis. The flow rate of the eluent was 1.2 mL/min.
The bile samples were analyzed by an RP-HPLC method with UV–Vis detection as was developed and published earlier [30]. Briefly, 50 µL of bile sample were mixed and vortexed with cold methanol in a total volume of 250 mL containing 2.5 mM ETP as an internal standard. A mixture of 0.01 M citrate buffer (pH 6.2) and methanol (47:53 v/v%) containing 0.03 M tetrabutylammonium bromide was used as a mobile phase. The flow rate of the eluent was 1.0 mL.min−1.
In both analytical methods, the volume of the samples was 20 µL, and the detection was effected at 290 nm because this wavelength proved to be optimal for the simultaneous measurement of PNP, PNP-G, and PNP-S. Before the analysis, the temperatures of samples were allowed to rise to ambient temperature.

2.3.3. Calculations, Statistical Analysis

The luminal appearance and the biliary excretion of PNP metabolites (PNP-G, PNP-S) were calculated on the basis of their concentrations in the perfusion medium and the bile, and the corresponding volumes of the perfusion solution and the bile, respectively. At mass–volume conversion of the bile samples, 1 g/cm3 was considered [36]. The data show the average values ± S.D. of eight experiments. Significant differences were calculated by a two-sample Student’s t-test.

2.3.4. Ethical Approval
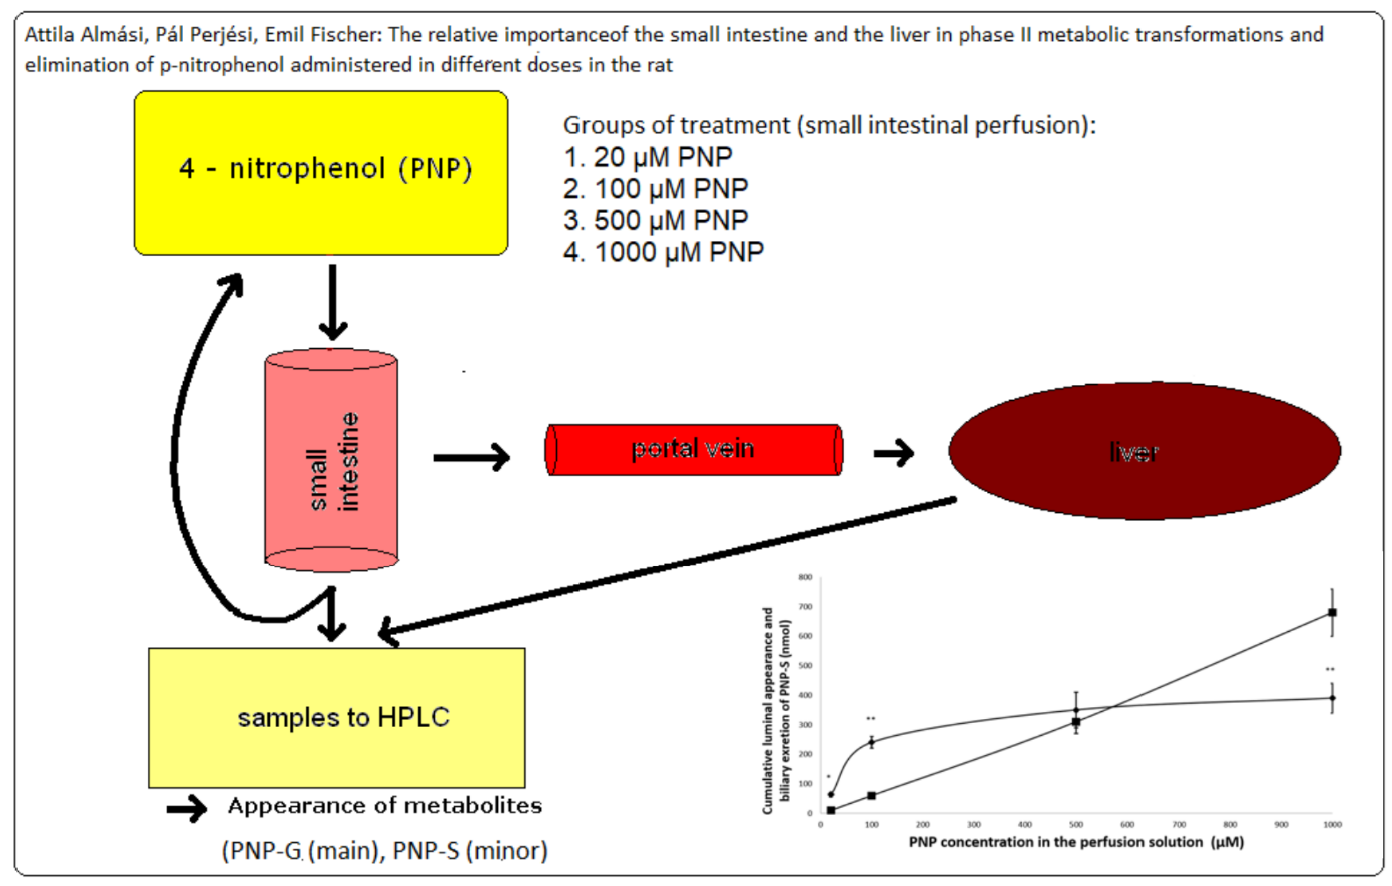
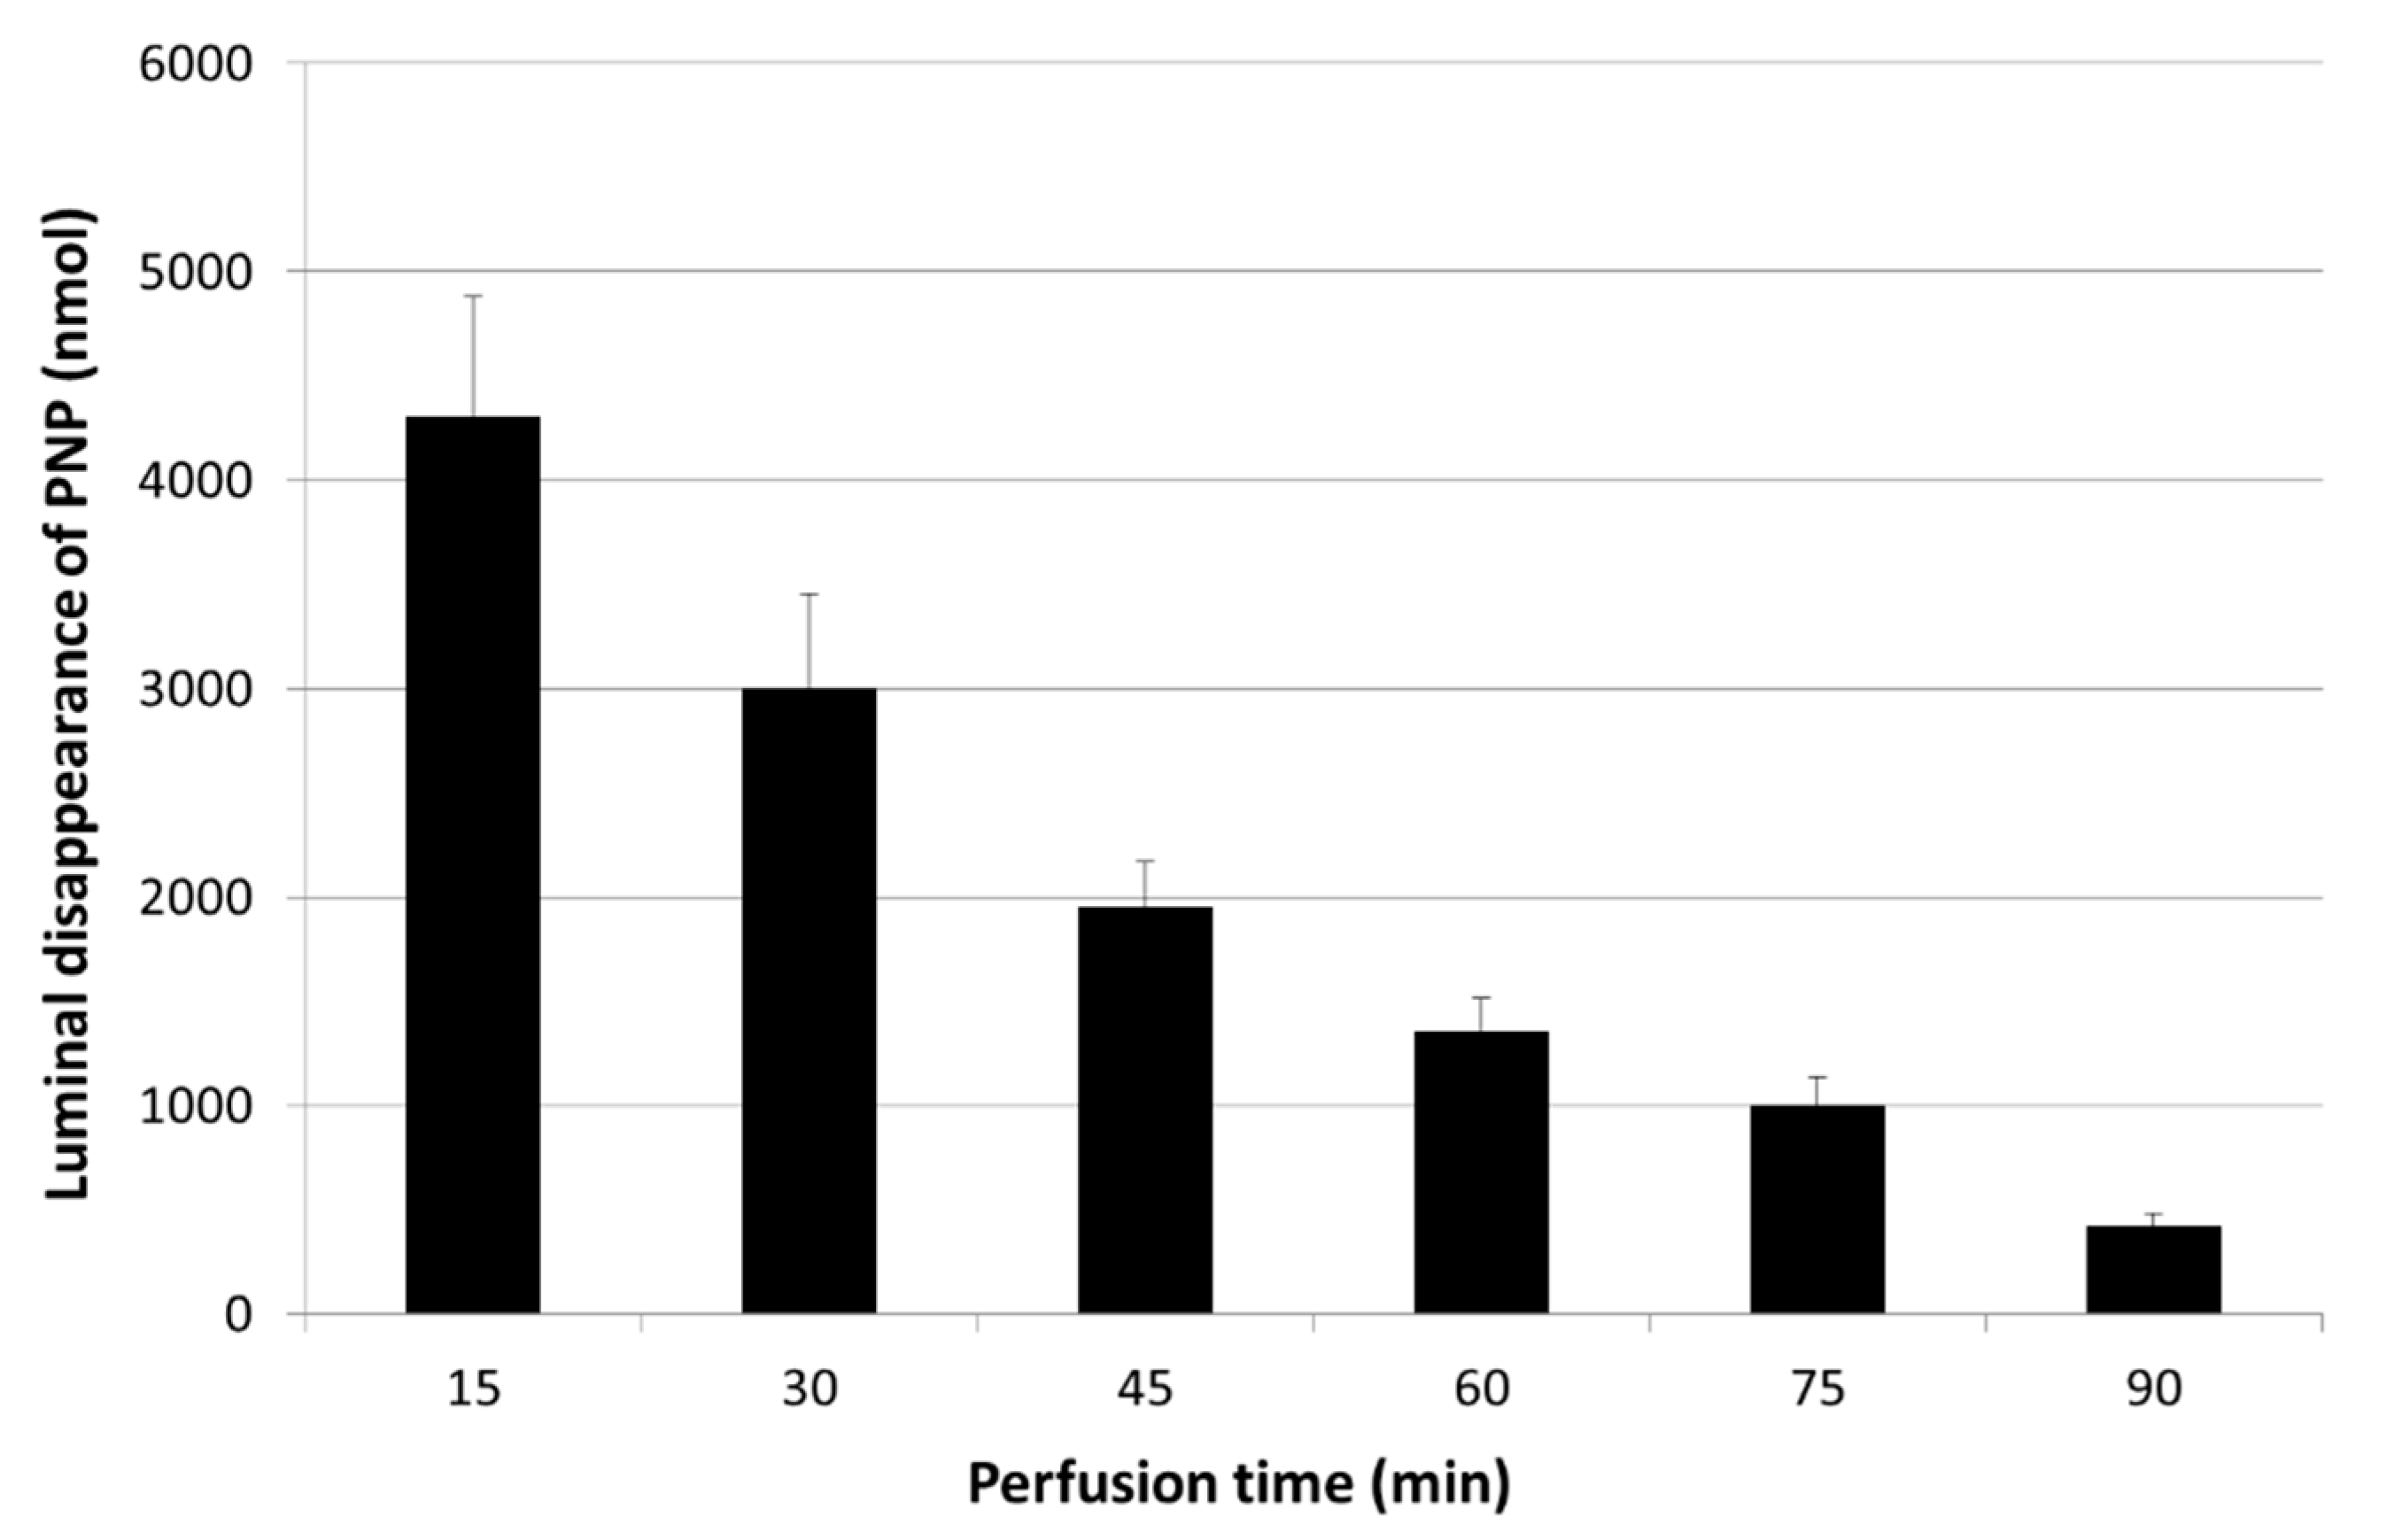
All procedures were carried out on animals according to the Hungarian Animal Protection Act (Hungarian Act XXVIII, 1998). The study was approved by the Ethics Committee on Animal Research of the University of Pécs.

3. Results

The luminal disappearance of PNP (500 μM) from the intestinal perfusion solution is shown in Figure 1.

3.1. Luminal Disappearance of p-Nitrophenol (PNP) from the Small Intestine Measured in 90 min Perfusion of 500 µM PNP

This figure shows that the amount of PNP rapidly and continuously decreased in the intestinal perfusion medium. The disappearance of PNP from the luminal perfusion medium can be explained by the intestinal absorption and metabolism of the parent compound (PNP). A similar convex curve characterized the luminal disappearance of capsaicin and dihydrocapsaicin (other phenolic xenobiotics) from the intestinal perfusate under similar experimental conditions [37].

3.2. Luminal Appearance of p-Nitrophenol-Glucuronide (PNP-G) and p-Nitrophenol–Sulfate (PNP-S) in the Small Intestine Measured in 90 min Perfusion of 500 µM PNP

During the perfusion of the 500 μM PNP solution, the PNP metabolites (PNP-G, PNP-S) appeared in the intestinal lumen. The appearance of PNP-G increased linearly in 90 min of the perfusion period. The PNP-S—as expected—appeared in the intestinal lumen in a much lower amount. The result is in agreement with the known biochemical difference (low affinity–high capacity vs. high affinity–low capacity, respectively) of the two competing phase II metabolic pathways. (Figure 2).

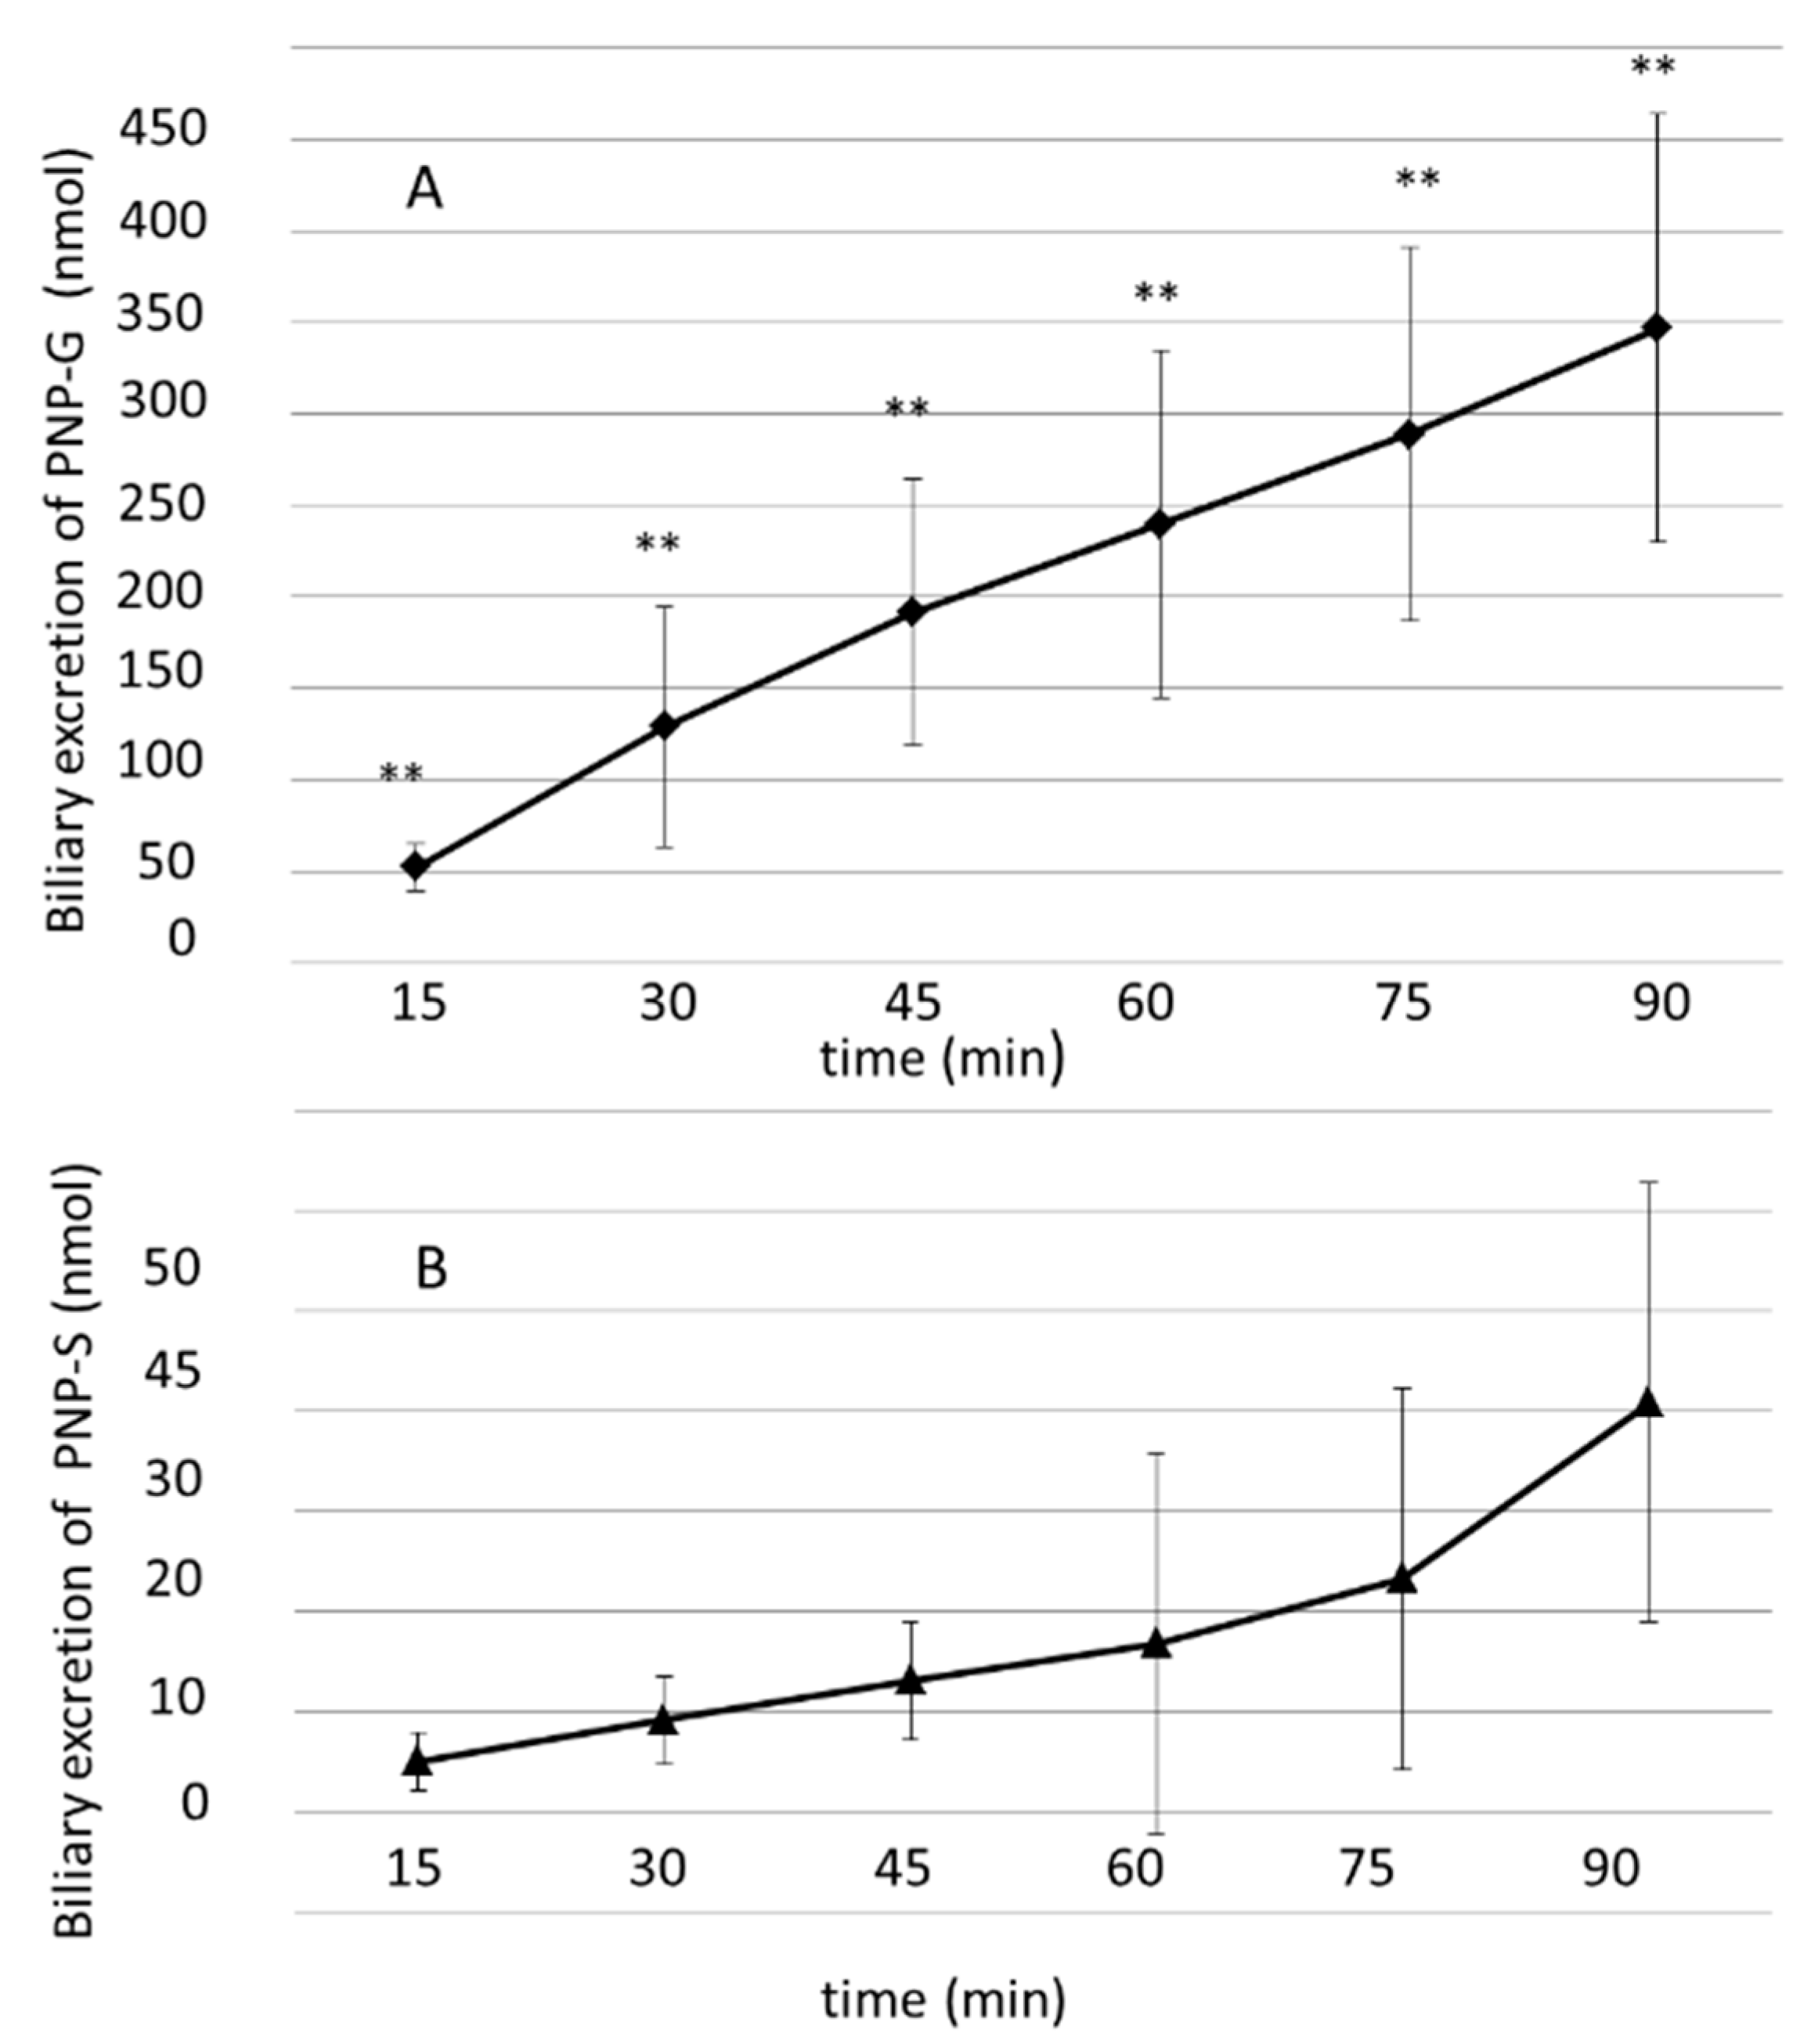
3.3. Biliary Excretion of PNP-G and PNP-S Measured in 90 min Perfusion of 500 µM PNP in the Small Intestine

Under the same experimental conditions (intestinal perfusion of 500 μM PNP solution), the PNP-G and PNP-S metabolites were excreted into the bile as well (Figure 3). The biliary excretion rate of PNP-G, similar to its intestinal appearance, was significantly higher than that of the PNP-S. The course of the respective curves in the intestinal perfusate and the bile is similar. It is a remarkable finding, at this perfusate concentration, that the amount of the excreted PNP-S is much higher in the bile than in the intestinal perfusate. On the other hand, the amounts of PNP-G in the two fluids are similar (see also Figures 5 and 6).

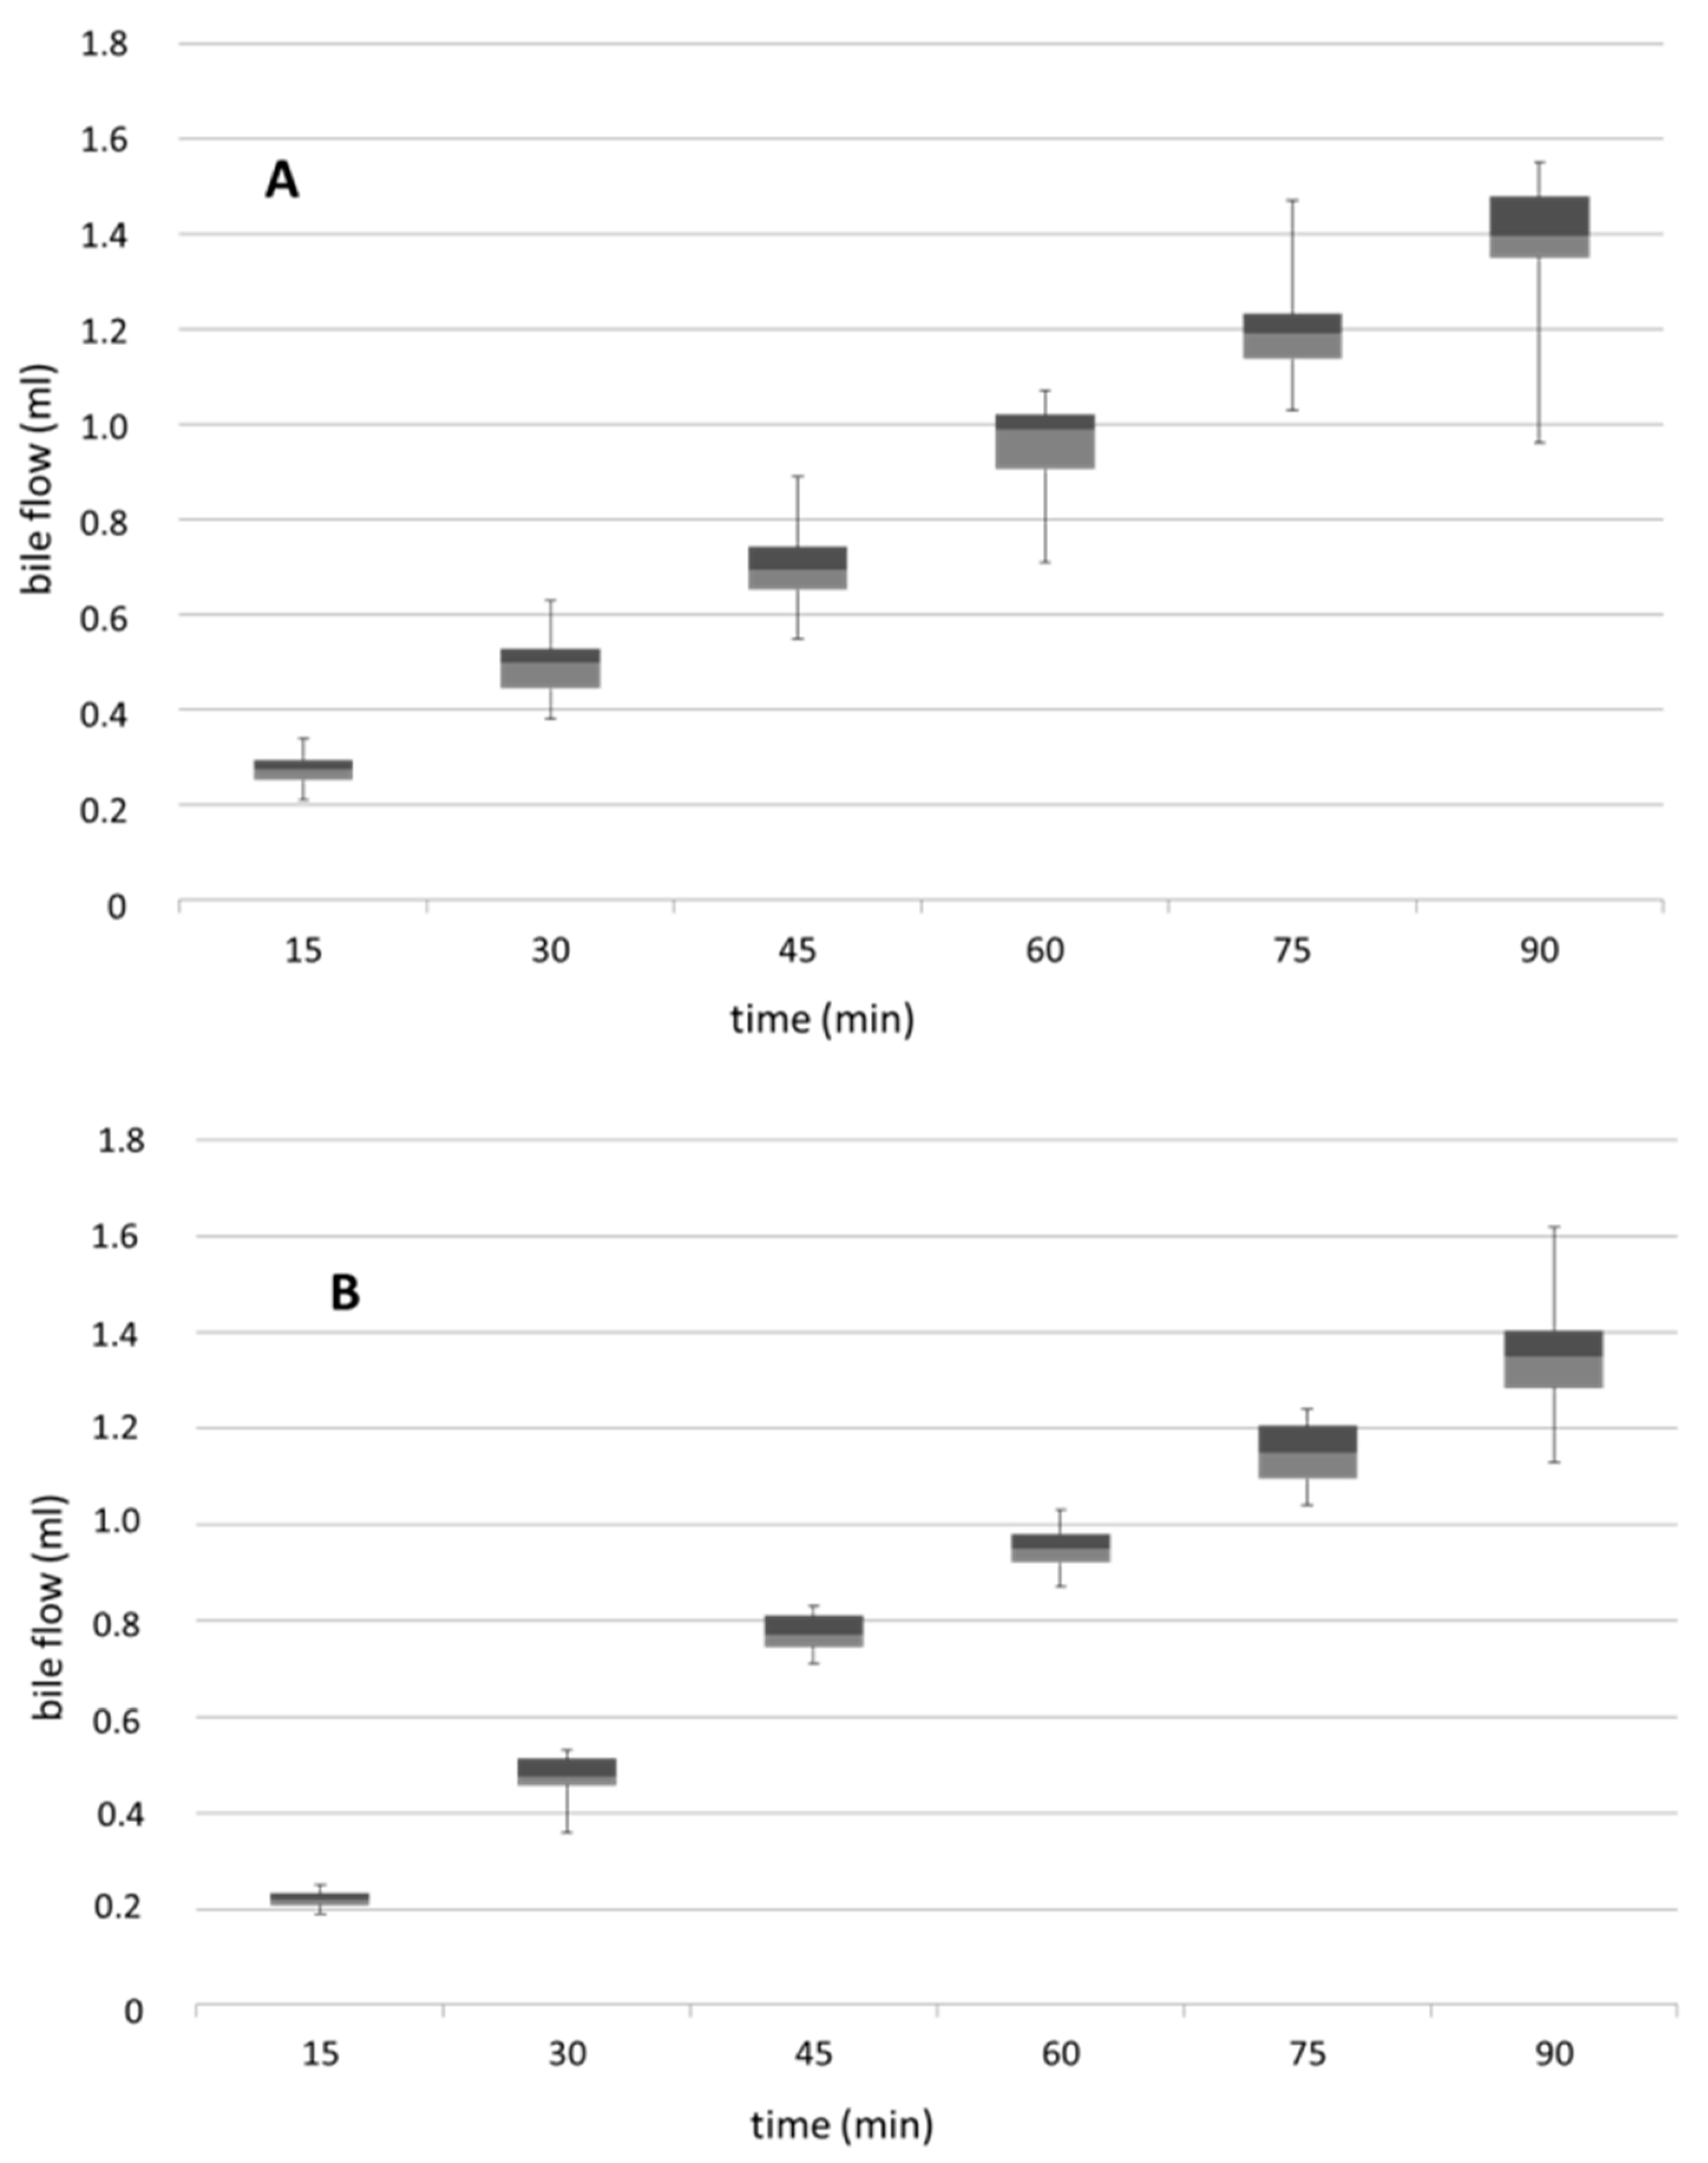
3.4. Biliary Flow Measured in Control and PNP-Perfused Rats Measured in 90 min Perfusion of 500 µM PNP in the Small Intestine

The biliary flow rates in control and PNP-perfused rats measured in a 90 min perfusion of 500 µM PNP in the small intestine are demonstrated in Figure 4. The bile production was relatively constant (0.23 mL/15 min period) in the control rats and was not changed significantly during the biliary excretion of PNP-G and PNP-S. These results show that the luminal perfusion of PNP did not influence the bile production of the liver.
The cumulative luminal appearance and the biliary excretion rate of PNP-G and PNP-S are demonstrated in Figure 5 and Figure 6, respectively. Data refer to the amounts of PNP-G and PNP-S measured over 90 min of luminal perfusion of PNP in different concentrations (20 µM, 100 µM, 500 µM, and 1000 µM) of PNP.

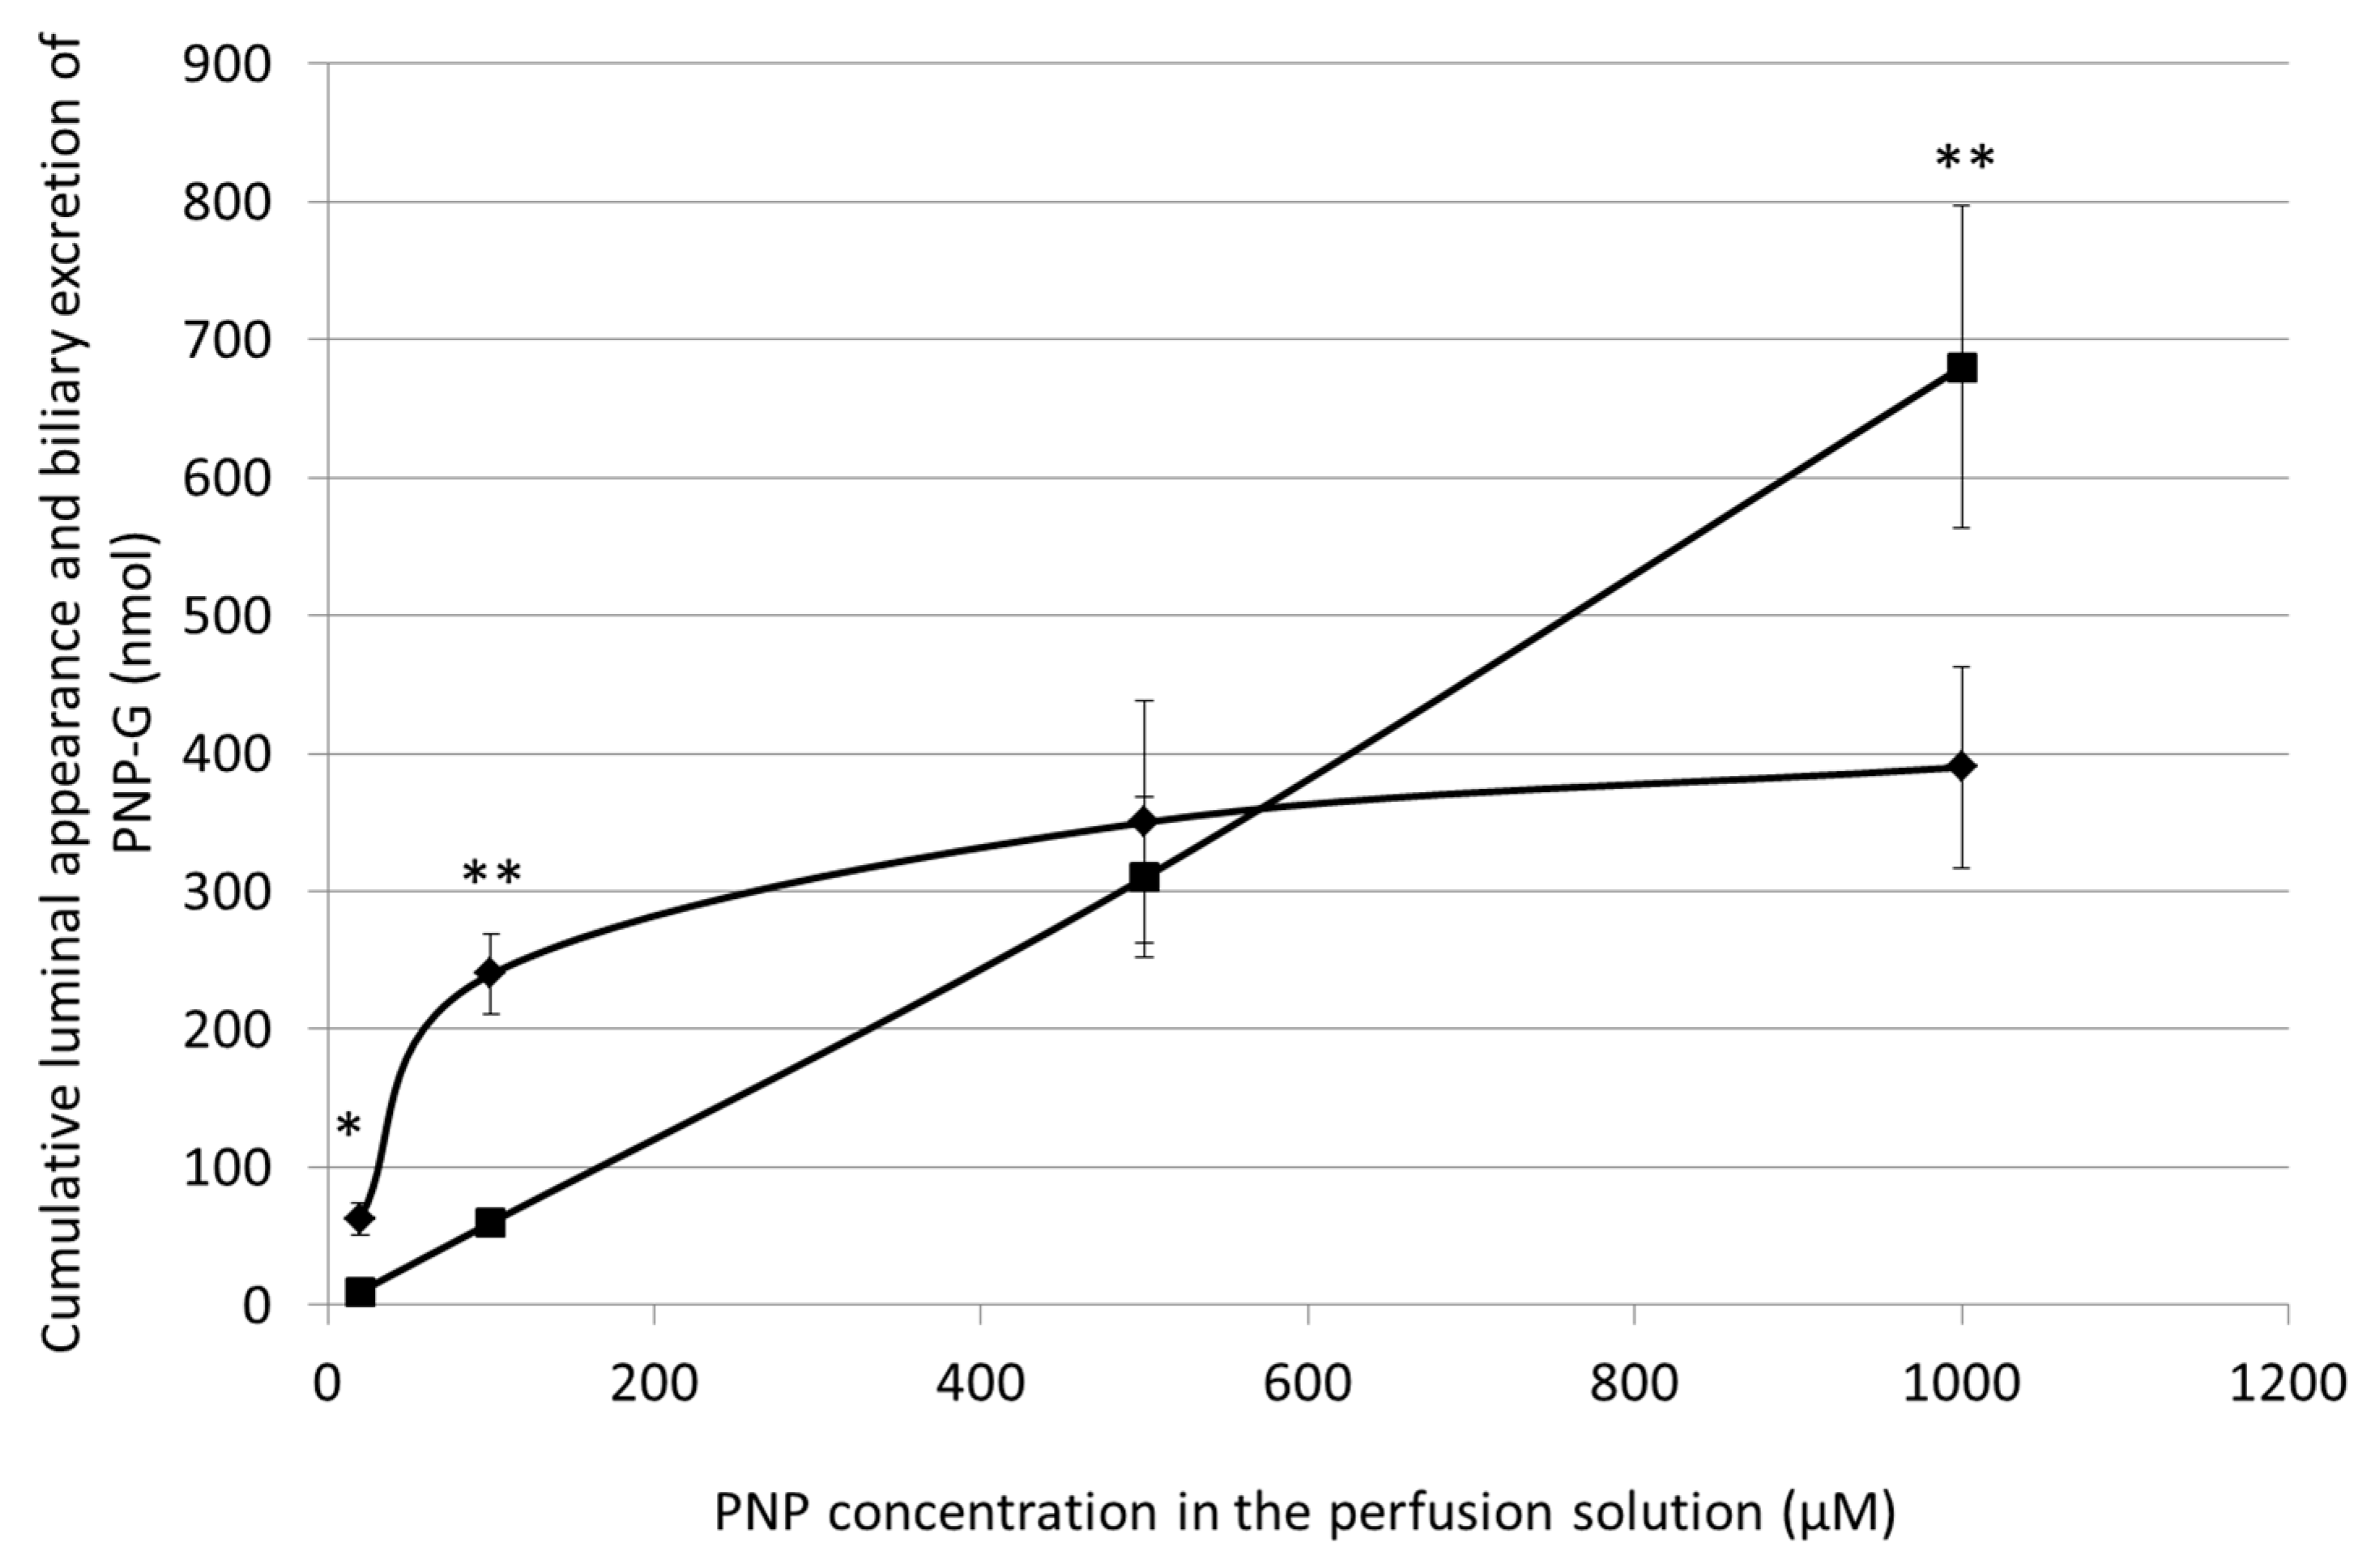
3.5. Cumulative Luminal Appearance and Biliary Excretion of PNP-G Measured in 90 min Perfusion of 20 µM, 100 µM, 500 µM, and 1000 µM PNP in the Small Intestine

Figure 5 illustrates the cumulative luminal appearance and biliary excretion of PNP-G in the same figure and at the same scale, allowing for an adequate comparison of the metabolic and excretory function of the small intestine and the liver. As can be seen, at the lower PNP concentrations (20 µM and 100 µM), the luminal appearance of PNP-G exceeded the biliary excretion of this metabolite; however, at the 500 µM PNP concentration, no significant difference was found between these values. Moreover, when the PNP concentration was further elevated (up to 1000 µM), the biliary excretion of PNP-G was significantly higher than the luminal appearance of the PNP-glucuronide. These results suggest the saturability of the luminal appearance of PNP-G; however, the biliary excretion showed a continuous and dose-dependent increase while the perfused PNP concentration was elevated up to 1000 µM.

3.6. Cumulative Luminal Appearance and Biliary Excretion of PNP-S Measured in 90 min Perfusion of 20 µM, 100 µM, 500 µM, and 1000 µM PNP in the Small Intestine

Figure 6 demonstrates the cumulative luminal appearance and the biliary excretion of PNP-S under the same experimental conditions as was mentioned with data of Figure 5.
It can be seen that PNP-S appeared in a considerably lower amount in the intestinal lumen than in the bile. In contrast to the dose-dependent increase in the biliary excretion of the sulfate metabolite (PNP-S), the luminal appearance of PNP-S remained at a relatively low level even at higher PNP concentrations. The results are in agreement with the previously demonstrated quantitative difference between the differences between the intestinal and biliary excretions of PNP-S, which were statistically significant at each PNP concentration.

4. Discussion

p-Nitrophenol has been reported to be effectively absorbed from the small intestine [20,21,22,29]. To obtain comparable data on the intestinal absorption as well as intestinal and hepatic metabolism from the same animals, HPLC–UV–Vis determination of the disappearance of PNP from the small intestine (proximal jejunum) was carried out. As shown in Figure 1 and Figure 2, the luminal amount of PNP decreased rapidly and continuously, and PNP-G and PNP-S metabolites appeared in the lumen of the in vivo isolated jejunal loop. At the same time, both PNP-G and PNP-S were also excreted into the bile (Figure 3).
The appearance of the glucuronide metabolite in the perfusate is in accordance with the results of our previous investigation with capsaicinoids [37]. On the contrary, results with ibuprofen—an NSAID with carboxyl moiety—showed no respective glucuronide in the perfusate [38]. The explanation of these differences can be rationalized by previous results, which demonstrated that the conjugation reaction on the carboxyl moiety with glucuronic acid is mediated by UGT2B1 (UDP-glucuronosyltransferase 2B1), in the rat [39]—UGT2B7 in humans [40]—which is expressed at an insignificant level in the rat small intestine. On the contrary, formation of the phenol–glucuronide conjugates is presumably associated with the preference of the UGT1A1, UGT1A6, and UGT1A8 isoforms, which catalyze ether-O-glucuronidation reactions [41,42].
Luminal appearance and biliary excretion of the PNP-G and PNP-S metabolites were investigated with experiments with different PNP concentrations (20 µM, 100 µM, 500 µM, and 1000 µM) in the small intestinal perfusate. These experiments demonstrated dose-dependent changes in the relative luminal appearance of PNP-G. At the lower PNP concentrations (20 µM and 100 µM), the luminal appearance of PNP-G was higher than its biliary excretion. However, while elevating the substrate (PNP) supply, the luminal appearance of PNP-G tended to be saturated: at a 500 µM PNP concentration, there was no significant difference between the intestinal and biliary excretion of PNP-G. Furthermore, at the 1000 µM PNP concentration, the biliary excretion exceeded the luminal appearance of PNP-G. Theoretically, excretion of the PNP-G (and the PNP-S) metabolites formed in the small intestine to the bile cannot be excluded. In our earlier study, it was demonstrated that the activity of UDP-glucuronyltransferase and sulfotransferase (SULT) was about three times higher in the rat liver than in the small intestine. The activity of the β-glucuronidase was about six times higher and that of the of the arylsulfatase, which was approximately seven times greater in the liver than in the small intestine [21]. Taking into consideration these experimental data, it can be concluded that most of the PNP-G and the PNP-S conjugates excreted to the bile are formed in the liver. Further experiments are needed to obtain a more detailed quantitative aspect of the question.
The luminal appearance of PNP-S was lower than the biliary excretion of the sulfate conjugate and showed a tendency to saturation. However, the biliary excretion of the sulfate metabolite was increased with elevation of the PNP concentration of the perfusate. Similar to our results, different rates of sulfation were measured by other authors in the human liver and intestinal cytosol with various drugs [2].
These results demonstrate that in contrast to the saturability of the metabolic and excretory function of the small intestine, the hepatic elimination of PNP-glucuronide is continuously elevated with the increasing concentrations (20–1000 µM) of the luminally perfused PNP. Similar results were also found by other authors while investigating glucuronidation of drugs by the human liver and intestinal microsomes [12,13,43].
Activity and expression of the relevant metabolic enzymes (glucuronyl transferases/glucuronidases and sulfotransferases/sulfatases) and transporters are different in the two organs. The main UGT isoforms expressed in the rat liver and intestine are UGT1A1, UGT1A6, UGT1A7, and UGT1A8 [44,45]. In rats, the PNP-dependent UGT activity of the liver has been reported to be about ten times higher than that of the different segments of the small intestine [46]. In rodents, cytosolic sulfotransferases are present in the liver, gut, adrenal, kidney, lung, skin, brain, and other extrahepatic tissues. The overall expression level of SULTs in the intestine, however, is much lower than that in the liver [47]. In published reports, many glucuronide conjugates were demonstrated to be substrates of ATP-dependent efflux (ABC) transporters, including breast cancer resistance protein (BCRP) and multidrug resistance-associated protein (MRP) 1/2/3/4 [48,49,50,51]. These efflux transporters function as efflux pumps to extrude intracellular conjugates and facilitate their excretion into the lumen and bile or uptake into the blood. BCRP and MRP2, which can transport glucuronide conjugates into the lumen and the bile, are rather non-selective transporters and accept most of the glucuronides. The expression of MRP2 is higher in the liver than along the intestine. [52,53]. Besides glucuronide conjugates, BCRP can also transport sulfate conjugates. The kinetics of the metabolic enzymes and the transport of most of the substrates follows the Michaelis–Menten kinetics [54]. Accordingly, the observed differences could be the result—at least partially—of the different local concentrations of the substrate (PNP) in the enterocytes and the hepatocytes.
Another aspect of the concentration-dependent differences in the metabolic and excretory function of the small intestine and the liver is the microsomal uncoupling effect of PNP [55]. Both conjugation reactions, as well as the transportation of the metabolites, are ATP-dependent processes. Since the local concentration of PNP is higher in the epithelial cells of the small intestine than in the liver, the higher PNP concentrations (500 µM and 1000 µM) have a higher impact on the ATP-dependent metabolic transformations and transportations in the small intestine. Since glucuronidation has a much higher capacity than sulfation, the changes are more highly expressed in the glucuronidation processes.
These results indicate that both the small intestine and the liver can conjugate PNP with glucuronic acid and sulfate. Our data show that at the lower doses (20 µM and 100 µM), the small intestine can rapidly and efficiently metabolize PNP to form PNP-G and PNP-S. At these concentrations, the luminal appearance of PNP-G was higher than its biliary excretion; i.e., at the 20 µM and 100 µM PNP concentrations, the metabolic activity of the small intestine is more important than that of the liver. In our experimental protocol, the data of the luminal appearance of the conjugates represent only the function of the cannulated jejunal loop (length about 10 cm). In contrast, the biliary excretion rate indicates the metabolic function of the whole liver. On the other hand, when the concentration of PNP was elevated (500 µM and 1000 µM), and the luminal appearance of PNP-G tended to be saturated, the relative metabolic activity of the liver became more pronounced, and the biliary excretion of PNP-G exceeded its luminal appearance.
Formation of phenyl glucuronides and phenyl sulfates are generally considered to be detoxification processes [56]. As our present and previous results [22,23,29,30,34] demonstrate, the formed phenol conjugates can be reexcreted into the gastrointestinal system both by the liver and the small intestine. At the lower PNP concentrations (up to 500 µM), a higher fraction of the absorbed dose is reexcreted into the small intestine in the PNP-G form. Accordingly, reduction of the phenolic drug’s dose results in its lower bioavailability. Furthermore, the glucuronide and the sulfate conjugates of phenolic drugs can be hydrolyzed by gut microbial glucuronidases and sulfatases. Acetylases, methylases, and glucuronidases are particularly widespread in the gut microbiome, as they are a rich carbon source for energy metabolism. Accordingly, the phenolic drugs with high efficacy and potency—after reactivation of the gut microbiome—can exert their (desired or undesired) effects on the lower part (colon) of the gastrointestinal system [57].

5. Conclusions

Our investigations showed—although the liver has the highest metabolic capacity—the intestinal metabolism to have significance in the case of substrates (drugs) that can be glucuronidated and sulfated. Such metabolic transformations have higher impact on the biotransformation of drugs applied in low doses. Under such conditions, the formed phenolic metabolites can be effectively excreted back to the small intestine, resulting in a low bioavailability of the pharmacons. Using the same drug in somewhat higher concentrations, however, the metabolic capacity of the enterocytes can be saturated, allowing a higher portion of the dose to reach the liver. The enzyme activities, the types and localizations of transporters, and the integrity of the ATP required processes are also able to influence the metabolized and excreted amounts of substrates. These data draw attention to the importance of the metabolic activity of the small intestine whose effect can result in different pharmacokinetic and pharmacodynamic features of the phenolic substrates used in different doses.

Author Contributions

Conceptualization, funding acquisition, E.F., P.P.; writing—original draft preparation, A.A., E.F., P.P.; methodology and investigation and formal analysis, P.P., A.A.; writing—review and editing, P.P. All authors have read and agreed to the published version of the manuscript.

Funding

The research was funded by financed by the European Social Fund (EFOP-3.6.1.-16-2016-00004).

Acknowledgments

The authors express their special thanks to Reiszné Horváth Mária (Department of Pharmacology) for her excellent technical assistance.

Conflicts of Interest

The authors declare no conflict of interest. The funders had no role in the design of the study; in the collection, analyses, or interpretation of data; in the writing of the manuscript, or in the decision to publish the results.

References

  1. Laitinen, M.; Watkins, J.B. Mucosal biotransformations. In Gastrointestinal Toxicology; Rozman, K., Hänninen, O., Eds.; Elsevier Press: Amsterdam, The Netherlands, 1986; pp. 169–192. [Google Scholar]
  2. Beaumont, K. The importance of gut wall metabolism in determining drug bioavailibility. In Drug Bioavailibility: Estimation of Solubility, Permeability, Absorption and Bioavailability; van de Waterbeemd, H., Lenneräus, H., Artursson, P., Eds.; Willey—VCH Verlag GmbH and Co. KgaA: Weinheim, Germany, 2004; pp. 311–328. [Google Scholar]
  3. van de Kerkhof, E.G.; de Graaf, I.A.M.; Groothuis, G.M.M. In vitro methods to study intestinal drug metabolism. Curr. Drug Metab. 2007, 8, 658–675. [Google Scholar] [CrossRef] [PubMed]
  4. Linn, J.H.; Chiba, M.; Baillie, T.A. Is the role of the small intestine in first–pass metabolism overemphasized? Pharm. Rev. 1999, 51, 135–157. [Google Scholar]
  5. Schwenk, M. Glucuronidation and sulphatation in gastrointestinal tract. Prog. Pharmacol. Clin. Pharmacol. 1989, 7, 155–169. [Google Scholar]
  6. George, C.F. Drug metabolism by gastrointestinal mucosa. Clin. Pharmacokinet. 1981, 6, 259–274. [Google Scholar] [CrossRef]
  7. Hartiala, K.J.W. Metabolism of hormones, drugs and other substances by the gut. Physiol. Rev. 1973, 53, 496–534. [Google Scholar] [CrossRef] [PubMed]
  8. Hänninen, O.; Lindström-Seppä, P.; Pelkonen, K. Role of the gut in xenobiotic metabolism. Arch. Toxicol. 1987, 60, 34–36. [Google Scholar] [CrossRef] [PubMed]
  9. Lauterbach, F.; Schorn, M.; Sprakties, G.; Sund, R.B. Compartmentalization of intestinal conjugation reactions and conjugate transports: Studies with phenols and p-aminobenzoic acid. Prog. Pharmacol. Clin. Pharmacol. 1982, 7, 231–242. [Google Scholar]
  10. Sund, R.B.; Lauterbach, F. Drug metabolism and metabolite transport in the small and large intestine: Experiments with 1-Naphthol and phenolphthalein by luminal and contraluminal administration in the isolated guinea pig mucosa. Acta Pharmacol. Toxicol. 1986, 58, 74–83. [Google Scholar] [CrossRef]
  11. Barnes, S.; Buchina, E.S.; King, R.J.; McBurnett, T.; Taylor, K.B. Bile acid sulfotransferase I from rat liver sulfates bile acids and 3-hydroxy steroids: Purification, N-terminal amino acid sequence and kinetic properties. J. Lipid Res. 1989, 30, 429–440. [Google Scholar]
  12. Brand, W.; Boersma, M.G.; Bik, H.; Hoek-van den Hil, E.F.; Vervoort, J.; Barron, D.; Meinl, W.; Glatt, H.; Williamson, G.; van Bladeren, P.J.; et al. Phase II metabolism of hesperetin by individual UDP-glucuronosyltransferases and sulfotransferases and rat and human tissue samples. Drug Metab. Dispos. 2010, 38, 617–625. [Google Scholar] [CrossRef]
  13. Capiello, M.; Giuliani, L.; Pacifici, G.M. Distribution of UDP-glucuronyltransferase and its endogenous substrate uridine 5′-diphosphoglucuronic acid in human tissues. Eur. J. Pharmacol. 1991, 41, 345–350. [Google Scholar] [CrossRef]
  14. Danovith, S.H.; Laster, R. The development of arylsulfatase in the small intestine of the rat. Biochem. J. 1969, 114, 343–350. [Google Scholar] [CrossRef] [PubMed]
  15. Falany, C.N. Molecular enzymology of human cytosolic sulfortransferases. Trends Pharmacol. Sci. 1991, 12, 255–259. [Google Scholar] [CrossRef]
  16. Inoue, H.; Yokota, H.; Taniyama, H.; Kuwahara, A.; Ogawa, H.; Kato, S.; Yuasa, E. 1-naphthol-β-D-glucuronides formed intraluminally in rat small intestine mucosa and absorbed into the colon. Life Sci. 1999, 65, 1579–1588. [Google Scholar] [CrossRef]
  17. Mojarrabi, B.; Mackenzie, P.I. Characterization of two UDP glucuronosyltransferases that are predominantly expressed in human colon. Biochem. Biophys. Res. Commun. 1998, 247, 704–709. [Google Scholar] [CrossRef]
  18. Tukey, R.H.; Strassburg, C.P. Human UDP-glucuronosyltransferases: Metabolism, expression and disease. Ann. Rev. Pharmacol. Toxicol. 2000, 40, 581–616. [Google Scholar] [CrossRef] [PubMed]
  19. Fischer, E.; Rafiei, A.; Bojcsev, S. Intestinal elimination of p-nitrophenol in the rat. Acta Physiol. Hung. 1995, 83, 355–362. [Google Scholar]
  20. Bojcsev, S.; Almási, A.; Simon, H.; Perjési, P.; Fischer, E. Investigation of drug metabolism in various segments of small intestine in the rat. Acta Physiol. Hung. 2013, 100, 115–123. [Google Scholar] [CrossRef] [PubMed]
  21. Almási, A.; Bojcsev, S.; Fischer, T.; Simon, H.; Perjési, P.; Fischer, E. Metabolic enzyme activities and drug excretion in the small intestine and in the liver in the rat. Acta Physiol. Hung. 2013, 100, 478–488. [Google Scholar] [CrossRef]
  22. Fischer, E.; Almási, A.; Bojcsev, S.; Fischer, T.; Kovács, N.P.; Perjési, P. Effect of experimental diabetes and insulin replacement on intestinal metabolism and excretion of 4-nitrophenol in rats. Can. J. Physiol. Pharmacol. 2015, 93, 459–464. [Google Scholar] [CrossRef] [PubMed]
  23. Almási, A.; Pinto, É.I.L.N.; Kovács, N.P.; Fischer, T.; Markovics, Z.; Fischer, E.; Perjési, P. Changes in hepatic metabolic enzyme activities and biliary excretion of 4-nitrophenol in streptozotocin induced diabetic rats. Braz. J. Pharm. Sci. 2018, 54, e11347. [Google Scholar] [CrossRef]
  24. Eadsforth, C.V.; Coveney, D.C. Measurement of phenol in urine using a high-performance liquid chromatographic method. Analyst 1984, 109, 175–176. [Google Scholar] [CrossRef] [PubMed]
  25. Kothare, A.P.; Zimmerman, C.L. Intestinal metabolism: The role of enzyme localization in phenol metabolite kinetics. Drug Metab. Dispos. 2002, 30, 586–594. [Google Scholar] [CrossRef] [Green Version]
  26. Kuhn, U.D.; Rost, D.; Müller, M. Para-nitrophenol glucuronidation and sulphatation in rat and human slices. Exp. Toxic. Pathol. 2001, 53, 81–87. [Google Scholar] [CrossRef]
  27. Gow, P.J.; Ghabrial, H.; Treepongkaruna, S.; Shulkes, A.; Smallwood, R.A.; Morgan, D.J.; Ching, M.S. Conjugation of para-nitrophenol by the isolated perfused neonatal sheep liver. J. Pharm. Sci. 2000, 89, 36–44. [Google Scholar] [CrossRef]
  28. Toxicological Profile for Nitrophenols: 2-Nitrophenol, 4-Nitrophenol; Agency for Toxic Substances and Disease Registry U.S. Public Health Service: Atlanta, GA, USA, 1992. Available online: https://www.atsdr.cdc.gov/toxprofiles/tp50.pdf (accessed on 30 September 2020).
  29. Almási, A.; Fischer, E.; Perjési, P. A simple and rapid ion-pair HPLC method for simultaneous quantitation of 4-nitrophenol and its glucuronide and sulfate conjugates. J. Biochem. Biophys. Methods 2006, 69, 43–50. [Google Scholar] [CrossRef] [PubMed]
  30. Almási, A.; Fischer, E.; Perjési, P. Isocratic ion-pair HPLC method for quantitation of 4-nitrophenol and it’s conjugated metabolites from bile. Sci. Pharm. 2011, 79, 837–847. [Google Scholar] [CrossRef] [PubMed] [Green Version]
  31. Concise International Chemical Assessment Document 20. In Mononitrophenols; World Health Organization: Geneva, Switzerland, 2000; Available online: http://www.inchem.org/documents/cicads/cicads/cicad_20.htm (accessed on 30 September 2020).
  32. McConnell, E.L.; Basit, A.W.; Murdan, S. Measurements of rat and mouse gastrointestinal pH, fluid and lymphoid tissue, and implications for in-vivo experiments. J. Pharm. Pharmacol. 2008, 60, 63–70. [Google Scholar] [CrossRef]
  33. Kuhl, H. Pharmacology of estrogens and progestogens: Influence of different routes of administration. Climacteric 2005, 8 (Suppl. 1), 3–63. [Google Scholar] [CrossRef]
  34. Kuzma, M.; Fodor, K.; Almási, A.; Mózsik, G.; Past, T.; Perjési, P. Toxicokinetic study of a gastroprotective dose of capsaicin by HPLC-FLD method. Molecules 2019, 24, 2848. [Google Scholar] [CrossRef] [Green Version]
  35. Peterson, J.J.; Dwyer, J.T.; Jacques, P.F.; McCullough, M.L. Improving the estimation of flavonoid intake for study of health outcomes. Nutr. Rev. 2015, 73, 553–576. [Google Scholar] [CrossRef] [PubMed]
  36. Klaassen, C.D. Bile flow and bile composition during bile acid depletion and administration. Can. J. Physiol. Pharmacol. 1973, 52, 334–348. [Google Scholar] [CrossRef]
  37. Kuzma, M.; Fodor, K.; Maász, G.; Avar, P.; Mózsik, G.; Past, T.; Fischer, E.; Perjési, P. A validated HPLC-FLD method for analysis of intestinal absorption and metabolism of capsaicin and dihydrocapsaicin in the rat. J. Pharm. Biomed. Anal. 2015, 103, 59–66. [Google Scholar] [CrossRef] [PubMed]
  38. Kovács, N.P.; Almási, A.; Garai, K.; Kuzma, M.; Vancea, S.; Fischer, E.; Perjési, P. Investigation of intestinal elimination and biliary excretion of ibuprofen in hyperglycemic rats. Can. J. Physiol. Pharmacol. 2019, 97, 1080–1089. [Google Scholar] [CrossRef] [PubMed]
  39. King, C.; Tang, V.; Ngui, J.; Tephly, T.; Braun, M. Characterization of rat and human UDP-glucuronosyltransferases responsible for the in vitro glucuronidation of diclofenac. Toxicol. Sci. 2001, 61, 49–53. [Google Scholar] [CrossRef] [PubMed] [Green Version]
  40. Ji, J.Z.; Huang, B.B.; Gu, T.T.; Tai, T.; Zhou, H.; Jia, Y.M.; Mi, Q.Y.; Zhang, M.R.; Xie, H.G. Human UGT2B7 is the major isoform responsible for the glucuronidation of clopidogrel carboxylate. Biopharm. Drug Dispos. 2018, 39, 88–98. [Google Scholar] [CrossRef]
  41. Wu, B.; Basu, S.; Meng, S.; Wang, X.; Hu, M. Regioselective sulfation and glucuronidation of phenolics: Insights into the structural basis. Curr. Drug Metab. 2011, 12, 900–916. [Google Scholar] [CrossRef]
  42. Dong, D.; Ako, R.; Hu, M.; Wu, B. Understanding substrate selectivity of human UDP-glucuronosyltransferases through QSAR modeling and analysis of homologous enzyme. Xenobiotica 2012, 42, 808–820. [Google Scholar] [CrossRef] [Green Version]
  43. Prueksaritanont, T.; Gorham, L.M.; Hochman, J.H.; Tran, L.O.; Vyas, K.P. Comparative studies of drug metabolising enzymes in dog, monkey and human small intestines and in Caco-2-cells. Drug. Metab. Dispos. 1996, 24, 634–642. [Google Scholar]
  44. Miles, K.K.; Kessler, F.K.; Smith, P.C.; Ritter, J.K. Characterization of rat intestinal microsomal UDP-glucuronosyltransferase activity toward mycophenolic acid. Drug Metab. Dispos. 2006, 34, 1632–1639. [Google Scholar] [CrossRef] [Green Version]
  45. Grams, B.; Harms, A.; Braun, S.; Strassburg, C.P.; Manns, M.P.; Obermayer-Straub, P. Distribution and inducibility by 3-methylcholantrene of family 1 UDP glucuronosyltransferases in the rat gastrointestinal tract. Arch. Biochem. Biophys. 2000, 377, 255–265. [Google Scholar] [CrossRef] [PubMed]
  46. Van der Logt, E.M.; Roelofs, H.M.; Nagengast, F.M.; Peters, W.H. Induction of rat hepatic and intestinal UDP-glucuronosyltransferases by naturally occurring dietary anticarcinogens. Carcinogenesis 2003, 24, 1651–1656. [Google Scholar] [CrossRef] [PubMed] [Green Version]
  47. Zhou, T.; Chen, Y.; Huang, C.; Chen, G. Caffeine induction of sulfotransferases in rat liver and intestine. J. Appl. Toxicol. 2012, 32, 804–809. [Google Scholar] [CrossRef]
  48. Wu, B.; Jiang, W.; Yin, T.; Gao, S.; Hu, M. A new strategy to rapidly evaluate kinetics of glucuronide efflux by breast cancer resistance protein (BCRP/ABCG2). Pharm. Res. 2012, 29, 3199–3208. [Google Scholar] [CrossRef] [Green Version]
  49. Chu, X.Y.; Huskey, S.E.; Braun, M.P.; Sarkadi, B.; Evans, D.C.; Evers, R. Transport of ethinylestradiol glucuronide and ethinylestradiol sulfate by the multidrug resistance proteins MRP1, MRP2, and MRP3. J. Pharmacol. Exp. Ther. 2004, 309, 156–164. [Google Scholar] [CrossRef] [PubMed]
  50. Jedlitschky, G.; Leier, I.; Buchholz, U.; Hummel-Eisenbeiss, J.; Burchell, B.; Keppler, D. ATP-dependent transport of bilirubin glucuronides by the multidrug resistance protein MRP1 and its hepatocyte canalicular isoform MRP2. Biochem. J. 1997, 327, 305–310. [Google Scholar] [CrossRef] [Green Version]
  51. Sun, H.; Zhou, X.; Zhang, X.; Wu, B. Decreased Expression of multidrug resistance-associated protein 4 (MRP4/ABCC4) leads to reduced glucuronidation of flavonoids in UGT1A1-overexpressing HeLa cells: The role of futile recycling. J. Agric. Food Chem. 2015, 63, 6001–6008. [Google Scholar] [CrossRef]
  52. Drozdzik, M.; Busch, D.; Lapczuk, J.; Müller, J.; Ostrowski, M.; Kurzawski, M.; Oswald, S. Protein abundance of clinically relevant drug transporters in the human liver and intestine: A comparative analysis in paired tissue specimens. Clin. Pharmacol. Ther. 2019, 105, 1204–1212. [Google Scholar] [CrossRef]
  53. Burt, H.J.; Riedmaier, A.E.; Harwood, M.D.; Crewe, H.K.; Gill, K.L.; Neuhoff, S. Abundance of hepatic transporters in Caucasians: A meta-analysis. Drug Metab. Dispos. 2016, 44, 1550–1561. [Google Scholar] [CrossRef]
  54. Järvinen, E.; Deng, F.; Kidron, H.; Finel, M. Efflux transport of estrogen glucuronides by human MRP2, MRP3, MRP4 and BCRP. J. Steroid Biochem. Mol. Biol. 2018, 178, 99–107. [Google Scholar] [CrossRef]
  55. Stockdale, M.; Selwyn, M.J. Effects of ring substituents on the activity of phenols as inhibitors and uncouplers of mitochondrial respiration. Eur. J. Biochem. 1971, 21, 565–574. Available online: https://febs.onlinelibrary.wiley.com/doi/pdf/10.1111/j.1432-1033.1971.tb01502.x (accessed on 7 September 2020). [CrossRef] [PubMed]
  56. Parkinson, A.; Ogilvie, B.W.; Buckley, D.B.; Kazmi, F.; Czerwinski, M.; Parkinson, O. Biotransformation of Xenobiotics. In Casarett and Doull’s Toxicology: The Basic Science of Poisons, 8th ed.; Klaassen, C.D., Ed.; McGraw-Hill Education/Medical: New York, NY, USA, 2013; Chapter 6; ISBN 10 9780071769235. [Google Scholar]
  57. Collins, S.L.; Patterson, A.D. The gut microbiome: An orchestrator of xenobiotic metabolism. Acta Pharm. Sin. 2020, 10, 19–32. [Google Scholar] [CrossRef] [PubMed]
Figure 1. Luminal disappearance of p-nitrophenol (PNP) from the small intestine (proximal jejunum) measured in 90 min perfusion of 500 µM PNP. Values represent the mean ± S.D. of eight rats.
Scipharm 88 00051 g001
Figure 2. Luminal appearance of p-nitrophenol-glucuronide (PNP-G) (♦) (Panel A) and p-nitrophenol–sulfate (PNP-S) (■) (Panel B) in the small intestine (proximal jejunum) measured in 90 min perfusion of 500 µM PNP. Values represent the mean ± S.D. of eight rats. Significant difference between the values of PNP-G and PNP-S: ** p < 0.01.
Scipharm 88 00051 g002
Figure 3. Biliary excretion of PNP-G (♦) (Panel A) and PNP-S (▲) (Panel B) measured in 90 min perfusion of 500 µM PNP in the small intestine (proximal jejunum). Values represent the mean ± S.D. of eight rats. At low PNP-S values, the data of S.D. are not indicated, because they are smaller than the symbols. Significant difference between the values of PNP-G and PNP-S: ** p < 0.01.
Scipharm 88 00051 g003
Figure 4. Biliary flow measured in control (Panel A) and PNP-perfused (Panel B) rats measured in 90 min perfusion of 500 µM PNP in the small intestine (proximal jejunum). Data represent the mean ± S.D. of eight rats.
Scipharm 88 00051 g004
Figure 5. Cumulative luminal appearance (♦) and biliary excretion (■) of PNP-G measured in 90 min perfusion of 20 µM, 100 µM, 500 µM, and 1000 µM PNP in the small intestine (proximal jejunum). Values represent the mean ± S.D. of eight rats. Significant difference between the values of luminal appearance and biliary excretion of PNP-G: * p < 0.05; ** p < 0.01.
Scipharm 88 00051 g005
Figure 6. Cumulative luminal appearance (♦) and biliary excretion (■) of PNP-S measured in 90 min perfusion of 20 µM, 100 µM, 500 µM, and 1000 µM PNP in the small intestine (proximal jejunum). Values represent the mean ± S.D. of eight rats. Significant difference between the values of luminal appearance and biliary excretion of PNP-G: * p < 0.05; ** p < 0.01.
Scipharm 88 00051 g006
Publisher’s Note: MDPI stays neutral with regard to jurisdictional claims in published maps and institutional affiliations.

