1. Introduction
Metal ions play crucial roles in maintaining physiological functions inside the human body and are used for diagnostic as well as therapeutic purposes. Some metals are essential for life and their deficiency in the biological system may lead to a variety of ailments. For instance, insufficient zinc in the diet leads to growth retardation and copper deficiency results in cardiovascular complications [
1]. Considering their detoxifying capability, certain metal ions are utilized as chelating agents for the treatment of different types of diseases. Recently, metal-based complexes have been extensively investigated mainly for the development of anticancer agents and many of them have shown encouraging results. Cisplatin, a platinum (IV)-based drug, is the best example of such metal ion complexes and is currently in clinical applications for the treatment of various types of cancers [
2].
The association of metal ions with proteins serves several important functions in the body, such as the transportation of biologically important metal ions to their specific target binding sites as one of the most crucial tasks. In a protein, the amino acid residues provide negatively charged functional groups as potential ligands for cationic metal ions. As a consequence, there exists an attraction between the electron-rich functional groups in proteins and electron-deficient (cationic) metal ions, leading to a binding interaction between the two species. Furthermore, the interaction of metal ions to suitable biological target binding sites also depends on the valency and charge-accepting capacity of the metal ions [
3]. Metal ion interactions with proteins may influence the protein structure and affect structural stability. The impact of metal ions binding to proteins can be seen in the secondary, tertiary and quaternary structures of the proteins. Albumin is the major plasma protein in vertebrates, comprising approximately 60% of the total plasma content, and participates in the transportation of a diverse range of molecules, including nutrients, metal ions, drugs and metabolites. Due to their extraordinary binding ability to a variety of ligands, albumins have several biochemical, pharmaceutical and clinical applications [
4,
5]. Bovine serum albumin (BSA) is among the most commonly investigated proteins for research purposes due to its close structural resemblance to human serum albumin (HSA).
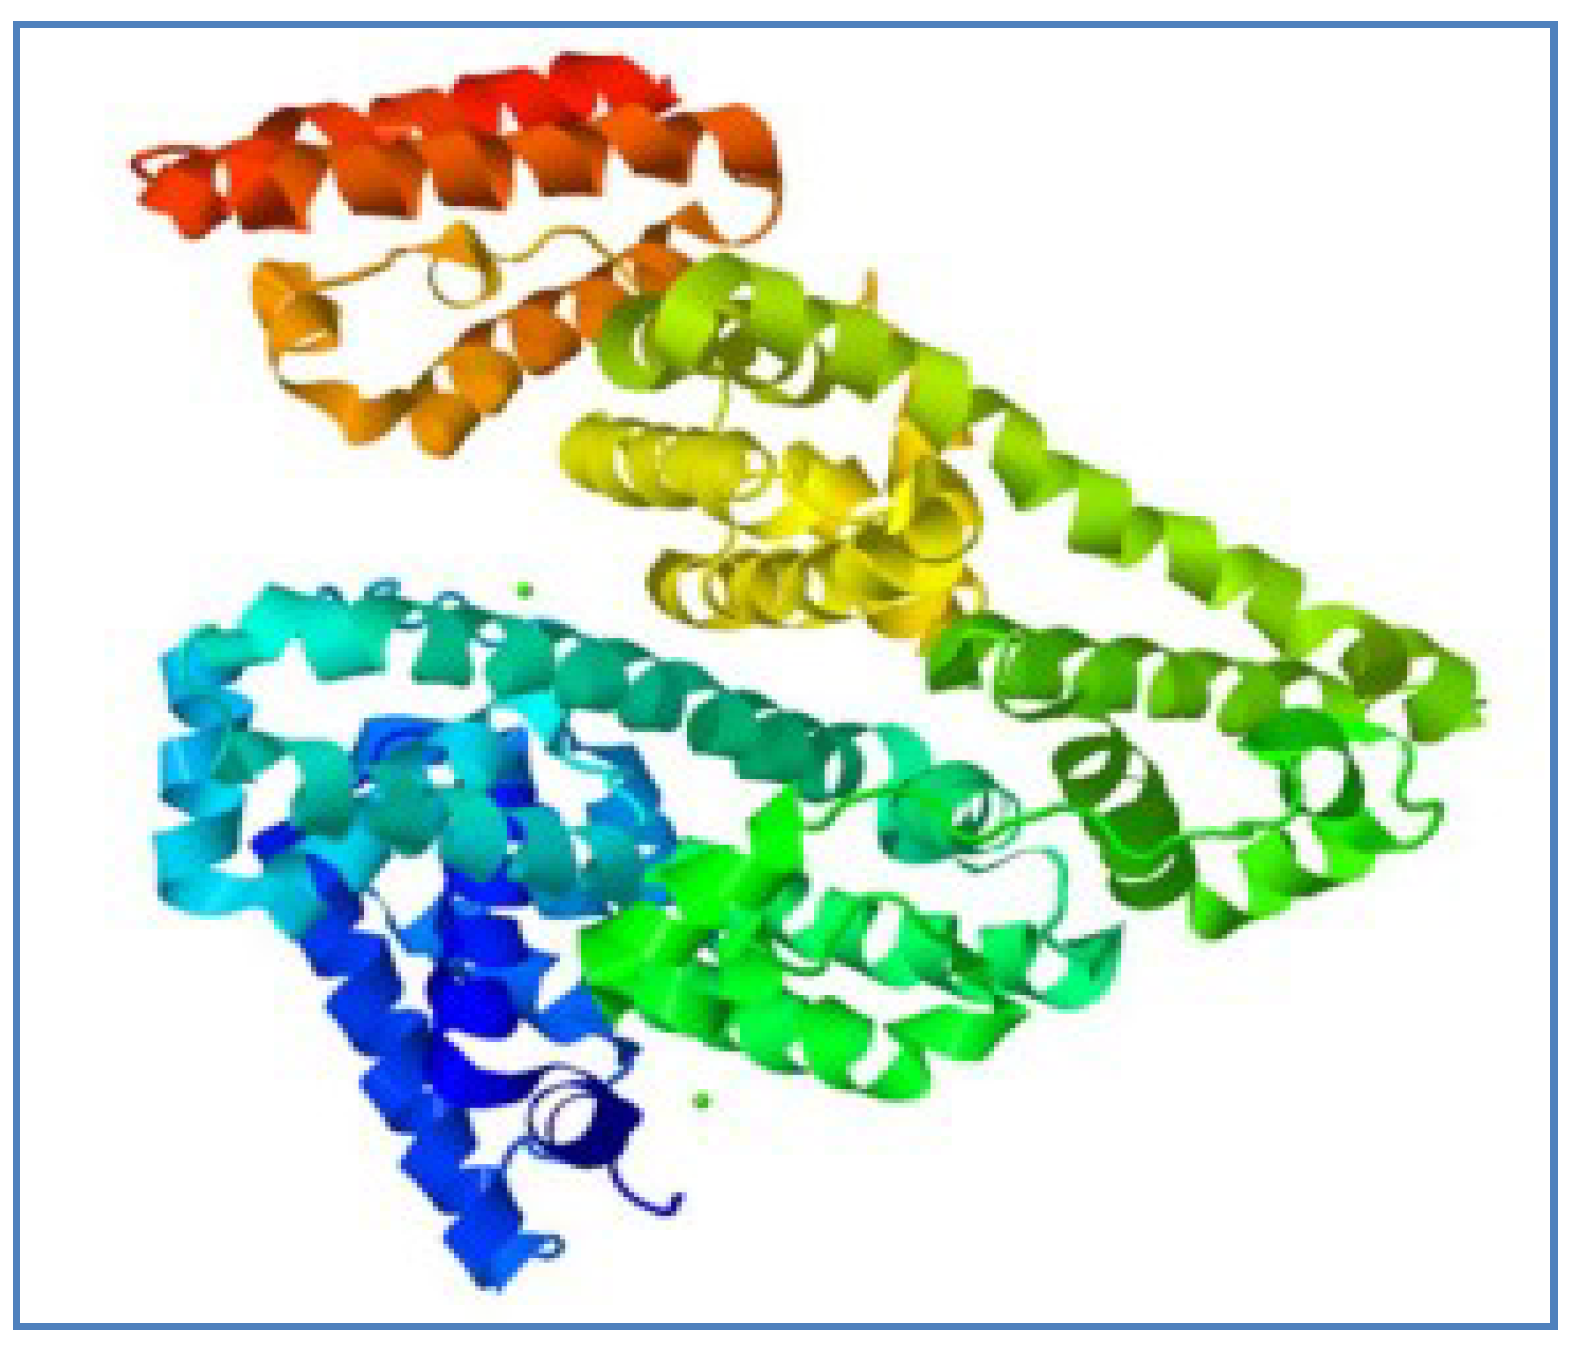
Structurally, the BSA molecule has a single chain consisting of 583 amino acids, which is cross-linked through 17 cystine residues, and its molecular mass is about 66.5 kDa. The BSA molecule is made up of three structurally identical domains (I, II and III), which are divided into nine loops (L1 to L9) through disulfide bonds. Every domain consists of two subdomains (A and B) and the loops in each domain are composed of a sequence of large, small and large loops making a triplet. The BSA molecule predominantly consists of a helical structure, with about 74% helical content. It also has a free thiol group attached to the Cys34 residue [
6,
7]. The three-dimensional structure of BSA is shown in
Figure 1.
The selectivity of the interactions between metal ions and protein binding sites can be best predicted as per the hard and soft acid base (HSAB) Lewis theory (
Table 1). According to the HSAB Lewis theory, metal ion ligands bind preferentially to the protein binding sites of similar hardness or softness. The soft metal ligands react with soft groups and hard metal ligands interact with the hard binding sites of proteins [
8,
9]. Generally, the attraction forces between hard acid metals and hard basic protein sites are ionic, whereas covalent interaction exists between soft acid metals and soft basic protein sites [
8,
10,
11]. The interactions of metal complexes with BSA lead to the disruption of the disulfide bonds, altering the secondary structure of proteins and result in unfolding by significant loss of the α-helix conformation [
12]. The metal complexes–protein interactions may also modify the overall polarity of the environment around the exposure of tryptophan residues, which is due to molecular interactions such as molecular rearrangements, excited state reactions, energy transfer and collision quenching [
13,
14].
A number of analytical techniques, including X-ray crystallography, FT-IR spectroscopy, NMR spectroscopy, circular dichroism (CD) spectroscopy, UV–Vis absorption spectroscopy, fluorescence spectroscopy, ESI-MS, affinity chromatography and capillary electrophoresis, have been employed to investigate the binding interactions between metal ions and proteins [
10,
11,
15,
16]. FT-IR spectroscopy has been accepted as a powerful tool for the analysis of biomolecules. Due to the presence of characteristic functional groups, biomolecules such as proteins, carbohydrates, lipids and nucleic acids possess vibrational fingerprints at specific frequencies of infrared light. Hence, the structure and composition of these groups can be estimated by evaluating the intensity, position and width of the spectral bands in FT-IR [
17,
18,
19].
To the extent of our knowledge, there is no report available regarding the analysis of the interaction between the selected biologically important metal ions and BSA. Hence, in the present work, we intended to study the interactions of group A metal ions (Ca2+ and Ba2+), noble metal ions (Ag+ and Ru3+) and heavy metal ions (Cu2+ and Co2+) with BSA using FT-IR spectroscopy. The change in the secondary structure of BSA was measured, which served as an effective tool to evaluate the qualitative as well as quantitative interactions between metal ions and BSA.
2. Materials and Methods
2.1. Chemicals and Instruments
Bovine serum albumin (BSA, 99.0%) was procured from Sigma-Aldrich (Steinheim, North Rhine-Westphalia, Germany). Analytical grade tris powder, acetic acid, calcium (II) chloride (CaCl2), barium (II) nitrate {Ba(NO3)2}, silver (I) chloride (AgCl), ruthenium (III) chloride (RuCl3), copper (II) chloride (CuCl2), and cobalt (II) chloride (CoCl2.6H2O) were also purchased from Sigma-Aldrich (Steinheim, North Rhine-Westphalia, Germany) and used without further purification. Ultrapure water (resistivity 18.2 Ω) was produced in-house using the milli-Q system (Millipore, Molsheim, France). The IR spectral analysis was carried out by using a FT-IR spectrophotometer (Nicolet iS10 FT-IR, Thermo Fischer Scientific, Waltham, Massachusetts, USA), equipped with a MCT liquid nitrogen cooled detector.
2.2. Preparation of Solutions
Tris buffer (20 mM, pH 7.4) was prepared by dissolving 1.21 g of tris powder in 500 mL of ultrapure water. The pH 7.4 was maintained with dilute acetic acid. Then, 0.5 mM protein (BSA) solution was prepared by accurately weighing and dissolving BSA in 20 mM tris buffer (pH 7.4). Metal ion solutions of 1.0 mM concentrations were prepared in the above tris buffer and diluted to obtain solutions of 0.25, 0.1 and 0.025 mM concentrations. Metal ion solutions and protein solutions were prepared freshly every day of the experiment.
2.3. FT-IR Spectroscopic Analysis
Metal ions and the protein (BSA) solution were mixed together by slowly adding the metal ion solutions to the BSA solution with continuous stirring. The solutions were mixed in such a way to achieve 0.125, 0.25 and 0.5 mM target metal ion concentrations and a final BSA concentration of 0.25 mM. The mixtures were incubated at room temperature for 2 h to allow complex formation between the metal ions and test protein. IR spectra of the pure protein solution and every solution of the metal ion–protein mixture were collected using hydrated films over a transmittance range of 4000–400 cm
−1 at a resolution of 4 cm
−1 and 100 scans. The difference spectrum was produced by subtracting the spectra of the BSA solution from that of the metal ion–BSA complex by following the method described by Dousseau et al., 1989 [
20].
2.4. Analysis of Protein Conformation
Secondary structures of the test protein, before and after interaction with each selected metal ion, were evaluated over a transmittance range of 1700–1600 cm
−1 by following the procedure of Byler and Susi, (1986) [
21]. Intensity variations and the spectral shifting of the BSA amide A band (NH stretching) at 3500 cm
−1, amide I band (C=O stretch.) at 1700–1600 cm
−1 and the amide II band (C–N stretch. coupled to NH bending) at 1550 cm
−1 were monitored after interactions with selected metal ions. For analysis of the secondary structure of the protein, four major peaks were resolved and characterized. The above-mentioned spectral regions were deconvolved by a curve fitting method using Origin 2018 Graphing and Analysis software. These peaks, characteristic to an α-helix (1660–1650 cm
−1), β-sheet (1637–1614 cm
−1), β-turn (1678–1670 cm
−1), and a β-antiparallel (1691–1680 cm
−1), were corrected and the corresponding areas were calculated with the help of Gaussian functions. The area of the respective bands, characteristic to amide I components, was summed-up and divided by the total area to obtain the percentage area of the amide I components [
15,
22,
23].
3. Results and Discussion
The interaction of bovine serum albumin, a major plasma protein, with a variety of metal ions including group A metal ions (Ca
2+ and Ba
2+), noble metal ions (Ag
+ and Ru
3+) and heavy metal ions (Cu
2+ and Co
2+) was estimated by using FT-IR spectroscopy and its derivative methods. The shifting of the spectral signals and the variation in the dimension of the amide I band of the protein at 1700–1600 cm
−1 (C=O stretching), amide II band near 1550 cm
−1 (C–N stretch. coupled with N–H bending), and amide A band near 3500 cm
−1 (NH stretch.) were monitored upon metal ion interaction [
21,
23]. The backbone conformation of the protein is directly related to the amide I band, while the shape of the amide I band is characteristic to the secondary structures as an α-helix (1660–1650 cm
−1), β-sheet (1637–1614 cm
−1), β-turn (1678–1670 cm
−1) and β-antiparallel (1691–1680 cm
−1). The difference spectra were produced by subtracting the spectra of the free protein from that of the BSA–metal ion complexes. These difference spectra were used for monitoring the intensity variations upon complex formation. In order to determine the secondary structures of the protein, self-deconvolution and curve fitting methods were applied [
21]. The secondary structures of the free protein and the protein–metal ion complexes were analyzed and the percentages of α-helix, β-sheet, β-turn and β-antiparallel were calculated to measure the changes on complex formation. The second derivative resolution enhancement curves were obtained for free BSA and its complexes in the range of 1700–1600 cm
−1. The intensity and total area of the peaks were calculated in the corresponding range of the different structural components of the protein.
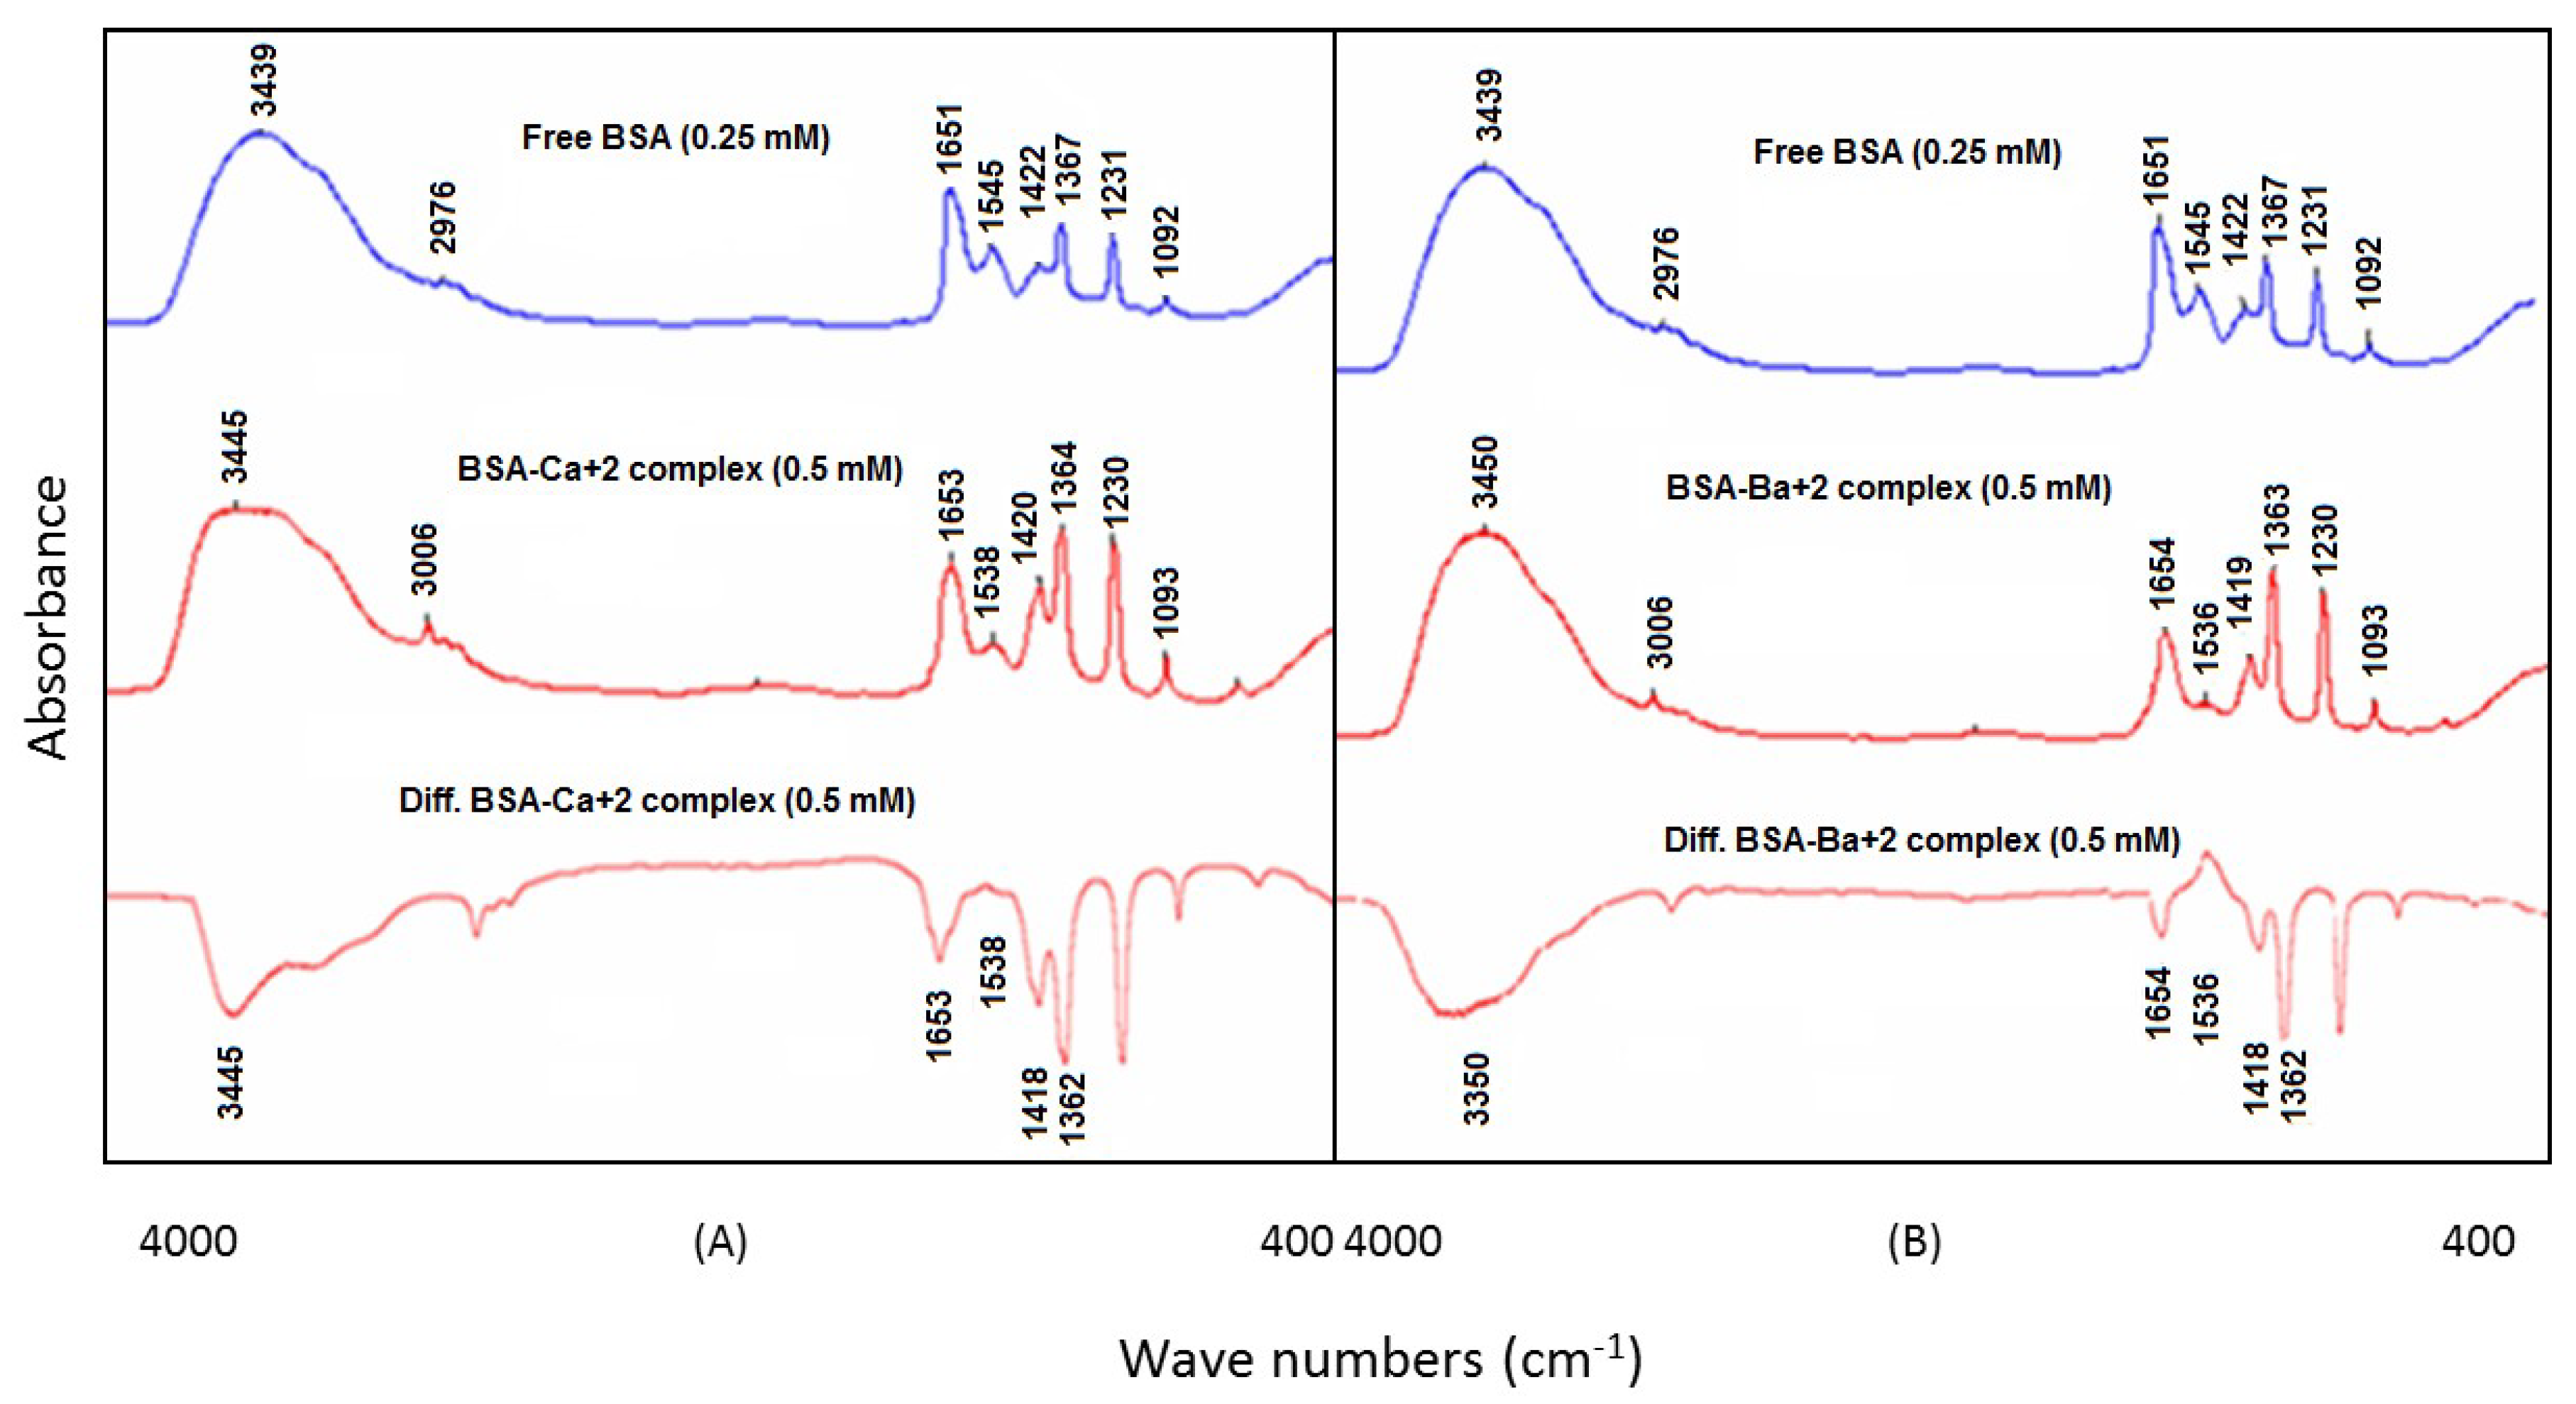
3.1. BSA and Group A Metal Ion (Ca2+ and Ba2+) Interactions
Ca
2+ and Ba
2+ were allowed to interact with BSA at two different concentrations, whereas the protein concentration was kept constant in the sample solutions. At low metal ion concentrations (0.125 mM), the intensity of the BSA amide I peak (1651 cm
−1, free BSA) and amide II peak (1545 cm
−1, free BSA) was slightly reduced in the difference spectra of BSA–Ca
2+ and BSA–Ba
2+ complexes, while at a higher metal ion concentration (0.5 mM), the spectral intensities of the above bands were found to be significantly decreased. In the difference spectrum, strong negative features for the amide I and amide II bands were seen. These bands were at 1653 cm
−1 (negative band) and 1538 cm
−1 (positive band), respectively, for the Ca
2+–BSA complex, whereas, in the case of the Ba
2+–BSA complex, the bands were observed at 1654 cm
−1 (negative band) and 1536 cm
−1 (positive band), respectively (
Figure 2A,B). These reductions in the intensities of bands have indicated the interactions of Ca
2+ and Ba
2+ with the C=O, COO
− and NH groups of BSA as per the HSAB Lewis theory of binding, as shown in
Table 1.
The binding interactions of Ca
2+ and Ba
2+ with the BSA protein were further revealed by the band shifting of the amide A band from 3439 cm
−1 (N–H stretch.) for free BSA to 3445 and 3450 cm
−1 in the BSA–Ca
2+ and BSA–Ba
2+ complexes, respectively, as evident from
Figure 2A,B. The band shifting towards a higher frequency was probably due to the interaction of the Ca
2+ and Ba
2+ ions with the N–H and C–N groups of bovine serum albumin. Furthermore, spectral shifting was also seen for the amide I band from 1651 cm
−1 (free BSA) to 1653 cm
−1 (Ca
2+–BSA complex) and 1654 cm
−1 (Ba
2+–BSA complex). This shifting of the amide I band was due to the interactions of Ca
2+ and Ba
2+ ions with the C–N and C–O groups of the protein, whereas the reduction in the intensity of the amide I band in the spectra of BSA–Ca
2+ and BSA–Ba
2+ at 1651 cm
−1 suggested a significant decrease of α–helix in the secondary protein structure at relatively higher metal concentrations [
24]. The bidentate coordination of the COO
- group of BSA was also evident upon the interaction of the Ca
2+ and Ba
2+ ions as a downshift position of the ν
as (COO
--) band from 1367 cm
−1 (free BSA) to 1364 cm
−1 (Ca
2+–BSA complex) and 1363 cm
−1 (Ba
2+–BSA complex) was observed.
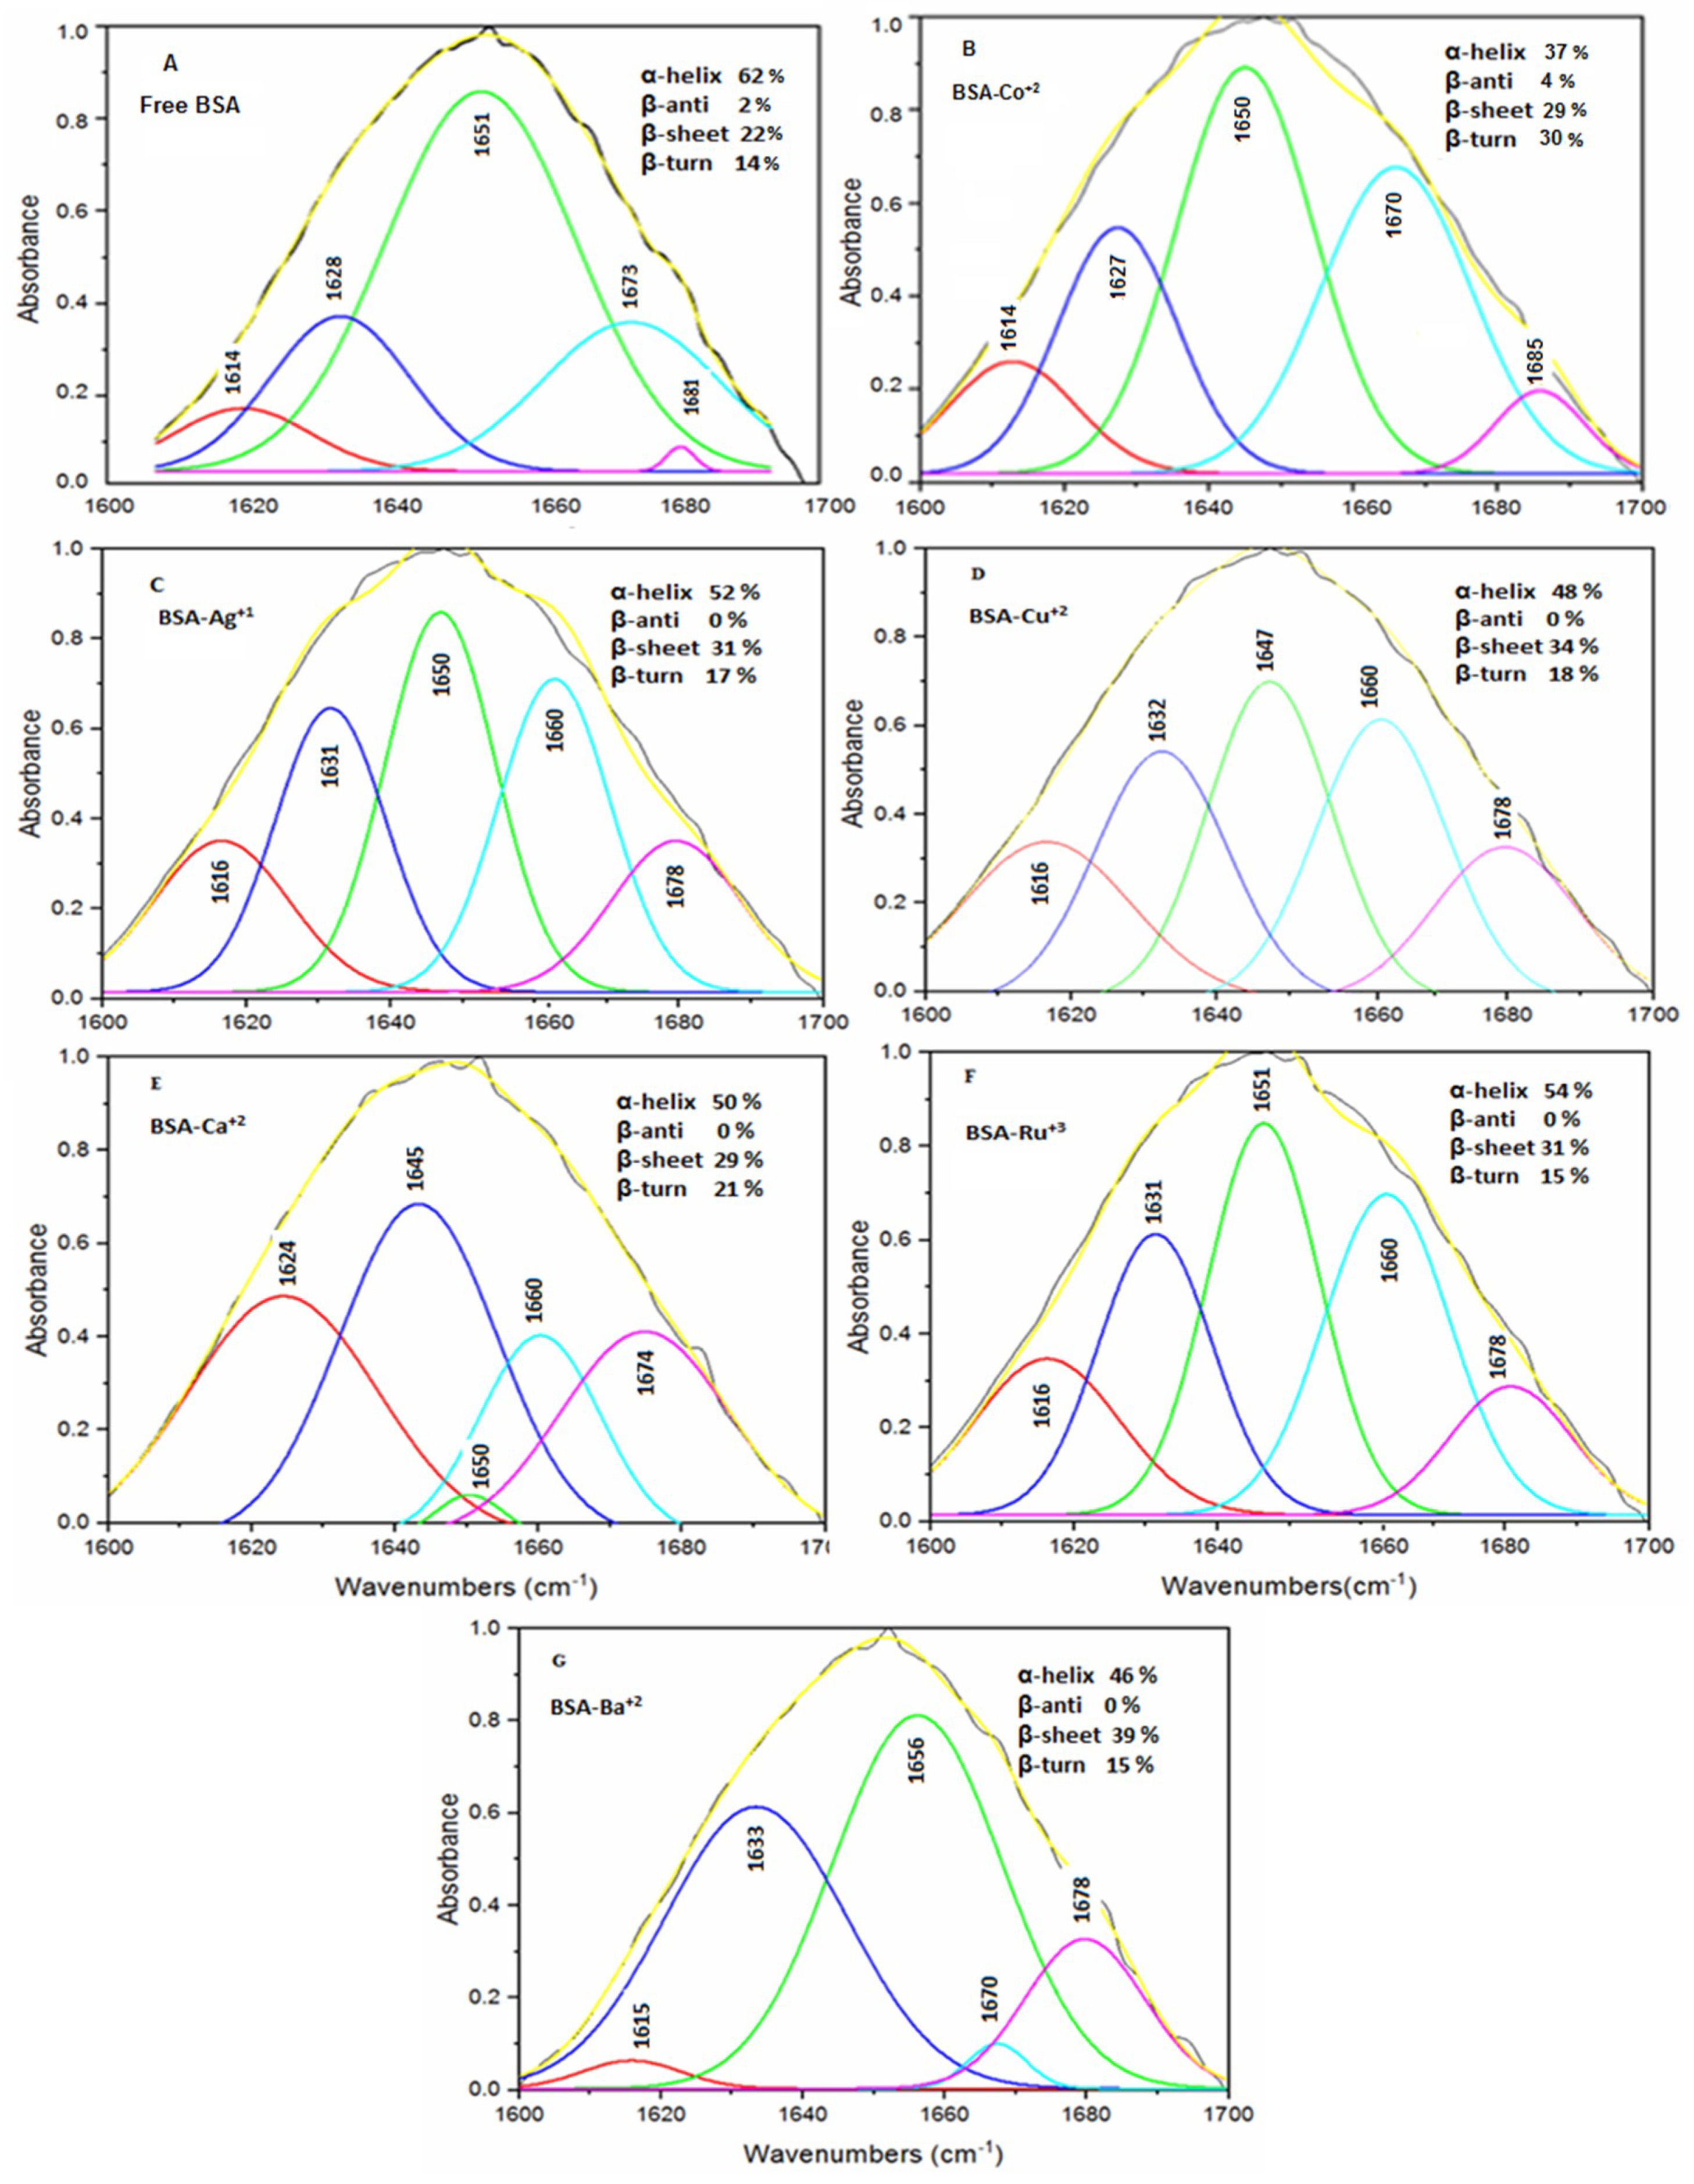
The quantitative estimation of the secondary structure of free BSA and the Ca
2+–BSA and Ba
2+–BSA complexes was carried out in the spectral range of 1700–1600 cm
−1 and the conformational changes after protein–metal ions interactions were evaluated. In agreement with the reported values, the secondary structure of free BSA was found to consist of an α-helix (1651 cm
−1; 62%), β-turn (1673 cm
−1; 14%), β-sheet (1614, 1628 cm
−1; 22%) and β-antiparallel (1681 cm
−1; 2%) [
15]. However, the binding interaction of BSA with the Ca
2+ and Ba
2+ ions resulted in a significant reduction in the α-helix from 62% for free BSA to 50% for the Ca
2+–BSA complex (1645, 1650, and 1660 cm
−1) and 46% for the Ba
2+–BSA complex (1656 cm
−1), with a considerable increase in the β-sheet from 22% in free BSA to 29% in the BSA–Ca
2+ complex (1624 cm
−1) and 39% in the BSA–Ba
2+ complex (1633 cm
−1). The results of the protein’s secondary structure analysis are depicted in
Table 2 and
Figure 3A,E,G.
3.2. BSA and Noble Metal Ion (Ag+ and Ru3+) Interactions
Similar to the BSA–Ca
2+ and BSA–Ba
2+ interactions, the intensities of the amide I and amide II bands (1651 and 1545 cm
−1 respectively; free BSA) were significantly reduced due to the interaction of the protein with the Ag
+ and Ru
3+ ions. Significant reduction in the band intensities was found at higher metal ion concentrations (0.5 mM), with strong negative features in the difference spectrum. The amide I and amide II bands of the BSA–Ag
+ complex were observed at 1649 cm
−1 (negative band) and 1544 cm
−1 (negative band), respectively, whereas, for the BSA–Ru
3+ complex, they were found to be at 1656 cm
−1 (negative band) and 1544 cm
−1 (negative band), respectively (
Figure 4A,B). The variation in the band intensities was due the complexation of the Ag
+ and Ru
3+ ions at the C=O, COO
− and NH groups of the protein. It was noticed that the C=O stretching vibration of free BSA was influenced by the interaction of the protein with the Ag
+ and Ru
3+ ions, whereas the C–N stretching and bending vibrations were less affected by these metal ions, indicating an insignificant effect on the amide II bands. In addition to band intensity variations, spectral shifting was also detected, as the amide I band of free BSA at 1651 cm
−1 was shifted to 1649 and 1655 cm
−1 for the sample solutions containing BSA–Ag
+ and BSA–Ru
3+ mixtures, respectively. This shifting of the amide I band was due to the interactions of the Ag
+ and Ru
3+ ions with the C=O groups of the protein.
The results of the quantitative determination of the secondary protein structure and its complexes with Ag
+ and Ru
3+ ions, over the spectral region of 1700–1600 cm
−1, have indicated significant interactions between the protein and metal ions. The α-helix in free BSA (62%) was remarkably reduced to 52% and 54% in the BSA–Ag
+ (1650 and 1660 cm
−1) and BSA–Ru
3+ complexes (1651 and 1660 cm
−1), respectively. By contrast, a significant increase in the β-sheet from 22% in free BSA to 31% in the BSA–Ag
+ (1616 and 1631 cm
−1) complex as well as the BSA–Ru
3+ (1616 and 1631 cm
−1) complex, with a relatively lesser change in the β-turn from 14% in free BSA (1673 cm
−1) to 17% in the BSA–Ag
+ complex (1678 cm
−1) and 15% in the BSA–Ru
3+ complex (1678 cm
−1), was observed. Interestingly, the β-antiparallel (1681 cm
−1; 2% in free BSA) was absent in both the BSA–Ag
+ and BSA–Ru
3+ complexes (1691–1680 cm
−1, 0%) (
Table 2;
Figure 3A,C,F). The decrease in the intensity of the amide I band was due to the reduction of the α–helix in the secondary structure of the protein [
24].
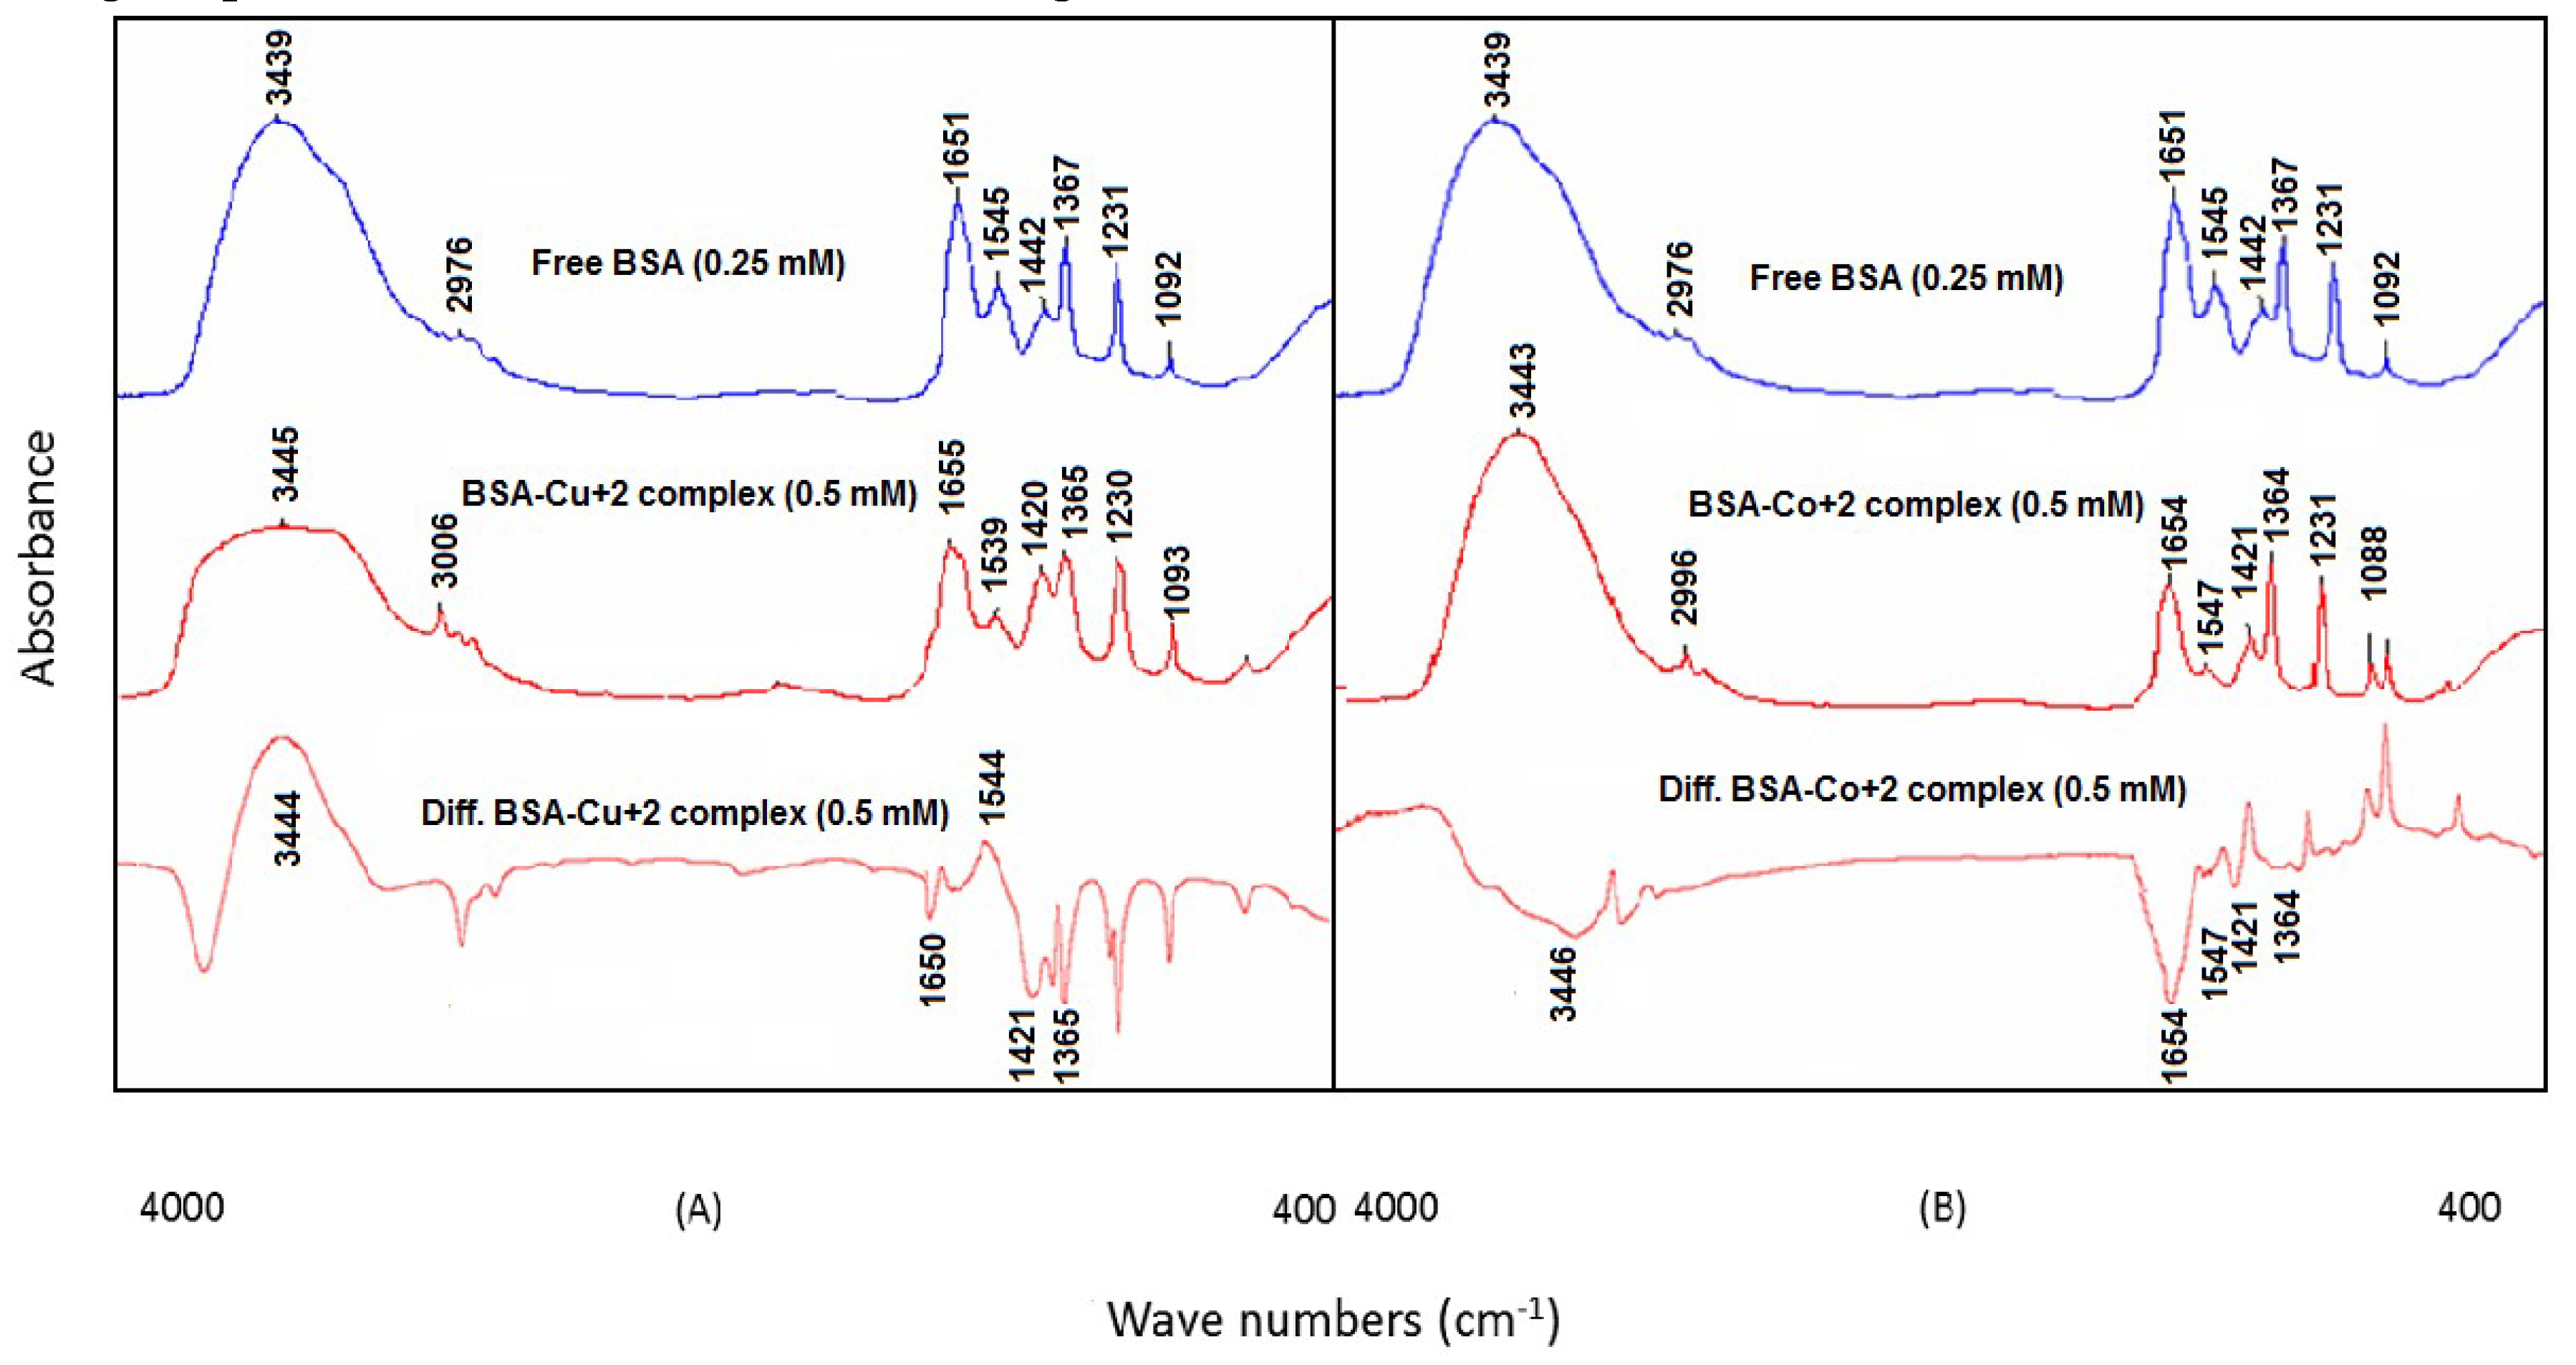
3.3. BSA and Heavy Metal Ion (Cu2+ and Co2+) Interactions
An insignificant reduction in the peak intensities was found for the amide I band (1651 cm
−1, free BSA) and amide II band (1545 cm
−1, free BSA) in the difference spectra of the BSA–Cu
2+ and BSA–Co
2+ complexes at lower metal ion concentrations (0.125 mM). By contrast, at 0.5 mM metal ion concentration, the intensities of the amide I and amide II bands were significantly decreased with remarkable negative characteristics in the difference spectra. The amide I and amide II bands of the BSA–Cu
2+ complex were at 1650 cm
−1 (negative band) and 1544 cm
−1 (positive band), respectively, while these bands were at 1654 cm
−1 (negative band) and 1547 cm
−1 (negative band) for the BSA–Co
2+ complex (
Figure 5A,B). The reduction of the intensities was due to the interaction of heavy metal ions with the C=O, C–N and NH groups of BSA as per the HSAB Lewis theory of binding (
Table 1). The binding interactions between the test protein and the metal ions (Cu
2+ and Co
2+) were further evidenced by the spectral shifting of the amide I band from 1651 cm
−1 in free BSA to 1655 cm
−1 in the BSA–Cu
2+ and 1654 cm
−1 in the BSA–Co
2+ complexes. This spectral shifting was reported due to the interactions of the Cu
2+ and Co
2+ ions with the C=O and C–N groups of the protein. In addition, the shifting of the protein amide A band from 3439 cm
−1 to 3445 and 3443 cm
−1 in the BSA–Cu
2+ and BSA–Co
2+ complexes, respectively, has supported the evidence of metal ion interactions with the C–N and N–H groups of bovine serum albumin (
Figure 5A,B).
The quantitative analysis of the secondary protein structures revealed that the interaction of the Cu
2+ and Co
2+ ions with the test protein has resulted in a major decrease in the proportion of the α-helix structure of free BSA (62%) to 48% in the BSA–Cu
2+ complex (1647, 1660 cm
−1) and 37% in the BSA–Co
2+ complex (1650 cm
−1). On the other hand, there was a significant increase in the β-sheet from 22% for free BSA to 34% for the BSA–Cu
2+ complex (1616, 1632 cm
−1) and 29% for the BSA–Co
2+ complex (1614, 1627 cm
−1). The proportion of the β-turn was also considerably increased due to metal ion–protein interactions and it was found to be 18% in the BSA–Cu
2+ (1678 cm
−1) and 30% in the BSA–Co
2+ (1670 cm
−1) complexes in comparison to 14% present in free protein. The reduction in the band intensities was probably due to the quantitative variation in the protein’s secondary structure. The results of the protein’s secondary structure estimation after interaction with Cu
2+ and Co
2+ ions are presented in
Table 2 and
Figure 3A,B,D.
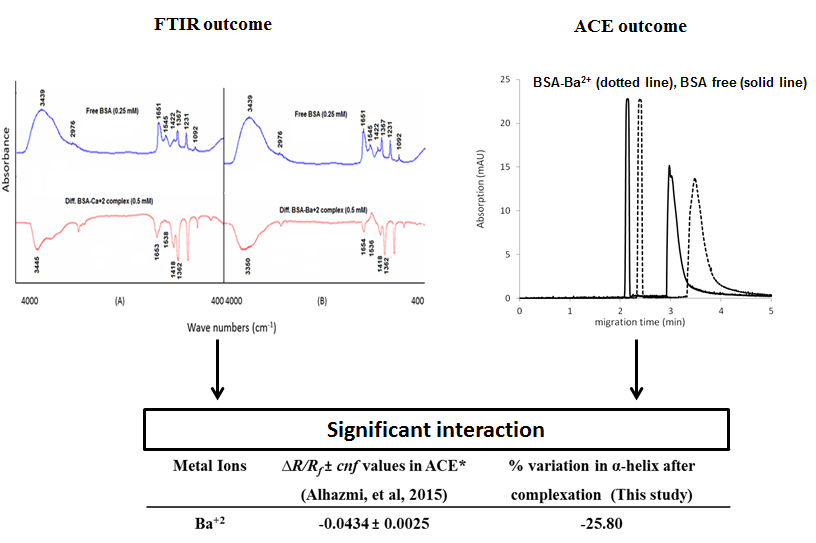
3.4. Comparison of the Interaction Results with Our Previous Study Using Affinity Capillary Electrophoresis (ACE)
The metal ion–protein interaction results obtained in this study were compared with our previous report, where we had investigated the binding interactions between a number of metal ions and biologically significant proteins including BSA using affinity capillary electrophoresis [
10]. In the previous study, the intensity of the interaction was represented by the extent of the mobility shift of analyte proteins in the capillary after interaction with the metal ions. The variation in the mobility shift in ACE was compared with the percent change in the α-helical structure of BSA in this study after interaction with the metal ions. This percent change in the α-helical structure in the secondary structure of the protein was calculated by Equation (1):
The comparison of the interaction results obtained from FT-IR and ACE analysis is summarized in
Table 3. It is evident from the table that the mobility shift (given as
∆R/Rf ±
cnf) obtained in the ACE analysis due to the metal ion–BSA interactions was comparable to the percent change in the α-helical structure of the protein as determined by FT-IR analysis. In both the techniques, similar interaction intensities were obtained, with Co
2+ ions exhibiting the highest binding affinity towards BSA, followed by Ba
2+ ions. However, small differences in the results of the binding interactions of Ag
+ and Ru
3+ to BSA were observed between the two techniques. Ag
+ exhibited the least affinity towards BSA in the ACE analysis, while Ru
3+ showed minimum interaction with the protein when investigated with the FT-IR technique. The similar interaction results proved that both the techniques can be utilized to study the metal ion–protein interactions with accurate binding results. However, the FT-IR technique is supposed to be advantageous due to its simple analytical procedure, rapid analysis and cost effectiveness.
4. Conclusions
In the event of increased drug resistance to traditional medicines, much research is being carried out into developing new agents to overcome these problems. Recently, metal-based complexes have emerged as promising agents with reported antiviral, antimicrobial and anticancer potential. In order to design metallodrugs, a crucial step is to analyze the ability of biologically active metal ions to bind with metalloproteins such as albumin, as it plays important roles in the transportation and distribution of these metal ions. The current research was aimed at delivering an approach to study the interactions of Ca2+, Ba2+, Ag+, Ru3+, Cu2+ and Co2+ ions with the BSA protein at physiological pH using the FT-IR spectroscopic technique. The binding interactions of the selected metal ions were demonstrated by significant variations in the intensities of the amide I band of the BSA after metal complexation. The binding interaction was further revealed by the spectral shifting of the amide I, amide II and amide A bands. The intensity variations and spectral shifting were due to the interaction of the metal ions with the O and N atoms of the polypeptide chain. The binding affinities of the selected metal ions were found to be in the following order: Co2+ > Ba2+ > Cu2+ > Ca2+ > Ag+ > Ru3+. The interactions of the metal ions with the protein have resulted in the alteration of the protein’s secondary structure, which was characterized by a remarkable reduction in the α-helical structure of BSA. The reduction in the α-helix proportion was due to its conversion to a β-sheet and β-turn, resulting in a partial destabilization of the protein. All the prominent interactions were effectively supported by the HSAB Lewis theory of metal ions and ligand binding. The present findings set a benchmark for further investigations on protein–metal ion interactions using FT-IR and are useful in clinical and pharmaceutical research.


