Article

Potential Role of Microfibrillar-Associated Protein 4, Fibrotic Indices and Oxidative Stress in Hepatocellular Carcinoma

by
Mohamed M. Salama
1,2,*,
Manal M. Nomir
3,
Maryan W. Fahmi
4,
Amal M. El-Gayar
2 and
Mamdouh M. El-Shishtawy
2,*
1
Department of Biochemistry, Faculty of Pharmacy, Delta University for Science and Technology, Gamasa 35712, Egypt
2
Department of Biochemistry, Faculty of Pharmacy, Mansoura University, Mansoura 35516, Egypt
3
Department of Clinical Pathology, Students’ Hospital, Mansoura University, Mansoura 35516, Egypt
4
Department of Internal Medicine, Medical Oncology Unit, Oncology Center, Faculty of Medicine, Mansoura University, Mansoura 35516, Egypt
*
Authors to whom correspondence should be addressed.
Sci. Pharm. 2018, 86(4), 44; https://doi.org/10.3390/scipharm86040044
Submission received: 31 August 2018 / Revised: 26 September 2018 / Accepted: 27 September 2018 / Published: 30 September 2018

Abstract

:
Hepatocellular carcinoma (HCC) is the second leading cause of cancer-related mortality worldwide. In an attempt to understand some potential mechanisms of persistence and oncogenicity of Hepatitis C virus (HCV)-related HCC, microfibrillar-associated protein 4 (MFAP4), fibrotic indices and oxidative status biomarkers were assessed in the sera of 50 patients with HCV-associated HCC, 25 patients with HCV-related liver cirrhosis and 15 healthy individuals. Serum oxidized Coenzyme Q10 (CoQ10) and malondialdehyde showed significant elevation in HCC patients compared to the control group (p < 0.001), as well as cirrhotic patients (p < 0.05 and p < 0.001, respectively), while serum glutathione content and superoxide dismutase activity were significantly decreased in HCC patients compared to the control group (p < 0.001). Serum MFAP4, aspartate aminotransferase to platelet ratio index (APRI), fibrosis index based on the 4 factors (FIB-4) and Forns index showed significant increase in HCC patients compared to the control group (p < 0.001), while only APRI and FIB-4 were significantly different between HCC and cirrhotic patients (p < 0.05), with a sensitivity of 86% and 92%, respectively, at cut off ≥0.7 for APRI and ≥1.57 for FIB-4. Therefore, increasing oxidative stress and fibrosis might mediate HCV induced cirrhosis and HCC. APRI and FIB-4 may be used as a simple non-expensive formula for the screening of HCC rather than MFAP4.

Graphical Abstract

1. Introduction

Hepatocellular carcinoma (HCC) is a sophisticated health challenge; it represents the second leading cause of cancer-related mortality worldwide [1]. In Egypt, the National Population-Based Cancer Registry ranks liver cancer as first cancer among males and the second among females after breast cancer [2]. Hepatitis C virus (HCV) attributes to about 90% of the HCC patients in the Egyptian population [3], where Egypt has the highest prevalence of HCV infection in the world (15%) and the main HCV genotype (90%) is type 4 [4].
Hepatic carcinogenesis is a slowly progressive, poorly understood multistep process [5]. Alteration in hepatic microenvironment mediates the carcinogenesis and carries the clues for better treatment strategies [6]. HCV can significantly disturb the cellular redox status which provokes alteration in the liver microenvironment via a change in respiratory, energetic, regenerative capacities, cytokine release, immune response, angiogenesis, collagen genes expression [7,8] and activation of the hepatic stellate cell which is the key in liver fibrogenesis [9].
Oxidative stress, an imbalance between the generation of free radicals and antioxidant defenses, plays a significant role in HCV pathophysiology [10]. CoQ10 is considered the main lipid-soluble antioxidant, which effectively prevents oxidation of lipids, proteins, and DNA [11]. CoQ10 can be easily and reversibly reduced by several dihydronicotinamide adenine dinucleotide phosphate (NADPH) oxidoreductases in both blood and tissues to maintain a high level of the active form (reduced CoQ10) [12]. Reduced CoQ10/total CoQ10 fraction is tightly regulated in healthy adults regardless of age, sex, race or cigarette smoking [13].
The persistent infection with HCV may progress to liver fibrosis [14], a dynamic scarring process due to the accumulation of collagen and extracellular matrix (ECM) proteins, which act as a precursor of cirrhosis and the development of HCC. Many non-invasive methods are used in clinical practice to evaluate liver fibrosis as aspartate aminotransferase to platelet ratio index (APRI) [15], fibrosis index based on the 4 factors (FIB-4) [16] and Forns index [17]. These non-invasive methods were recently introduced in clinical trials for prognosis [18,19], and for diagnosis of HBV-related HCC [20] and HCV-related HCC [21], but up till now no consensus on optimal cut off value for these indices.
Microfibrillar-associated protein 4 (MFAP4) is an extracellular glycoprotein localized to ECM fibers [22]. Since MFAP4 is involved in proper elastin fiber organization [23], the MFAP4 expression is upregulated in fibrotic and cirrhotic septae [22]. Patients with higher amounts of elastin fiber have significantly a higher risk of HCC development [24]. Furthermore, systemic MFAP4 increases significantly with progressive fibrosis stage among HCV infected patients [25] and can be used as a biomarker to assess hepatic fibrosis in HCV patients [26]. However, MFAP4 has not been evaluated before in HCC.
The work is carried out to evaluate the oxidative status and some fibrotic biomarkers in HCV-associated HCC patients, to explore their effects in initiation and progression of HCC, and to evaluate the diagnostic performance of MFAP4 and other fibrotic indices.

2. Materials and Methods

2.1. Patients

This study represents a case-control study. It was carried out from March 2016 to November 2016 with three enrolled groups:
Group I included 50 patients diagnosed with HCC associated with chronic HCV infection at outpatient clinics of Oncology Center of Mansoura University, Mansoura, Egypt.
Group II included 25 patients diagnosed with chronic hepatitis C related cirrhosis without any evidence of HCC at outpatient clinics of Specialized Internal Medical Hospital, Faculty of Medicine, Mansoura University, Mansoura, Egypt.
Group III included 15 healthy individuals as a control group with no apparent evidence of active disease or medical disorders.
All cases involved in this study were clinically, radiologically and pathologically examined in the Oncology Center and the Specialized Internal Medical Hospital, Mansoura University. No prior CoQ10 supplement or HMG-CoA reductase inhibitor was received. Patients with advanced organ failure, any other types of malignancy, advanced medical co-morbidity including diabetes mellitus, hypertension and atherosclerotic cardiovascular disease, active infection and Barcelona Clinic Liver Cancer stage D were excluded from the study. The severity of liver disease was assessed by the Child–Pugh classification [27], and all patients are Child-Pugh score A with performance status ≤ 2 according to Eastern Cooperative Oncology Group Performance Status.
The Research Ethics Committee of the Faculty of Pharmacy, Mansoura University, Mansoura, Egypt reviewed and approved the study on 13 February 2016 with code number 2016-8, which complies with the ethical principles of the 1964 Declaration of Helsinki and its later amendments. Written informed consent was obtained from all participants.

2.2. Blood Sampling

Fasting blood samples were collected from all patients and healthy individuals by vein puncture and then divided into three portions. The first portion was collected in a tube containing ethylene diamine tetraacetic acid for complete blood counts within 5 h. The second portion was collected in tubes containing sodium citrate for determination of prothrombin time within 3 h. The third portion was left to clot for 20–30 min at room temperature, followed by centrifugation at 1700 rpm (Sigma 2–16P) for 15 min to obtain clear non-hemolyzed serum. The serum samples were divided and maintained at −80 °C until use.

2.3. Assessment of Biochemical Parameters

Laboratory investigations, including complete blood count, viral markers (HCV antibodies, hepatitis B surface antigen (HBsAg) and human immunodeficiency virus (HIV) antibodies), liver function tests (alanine aminotransferase (ALT), aspartate aminotransferase (AST), gamma-glutamyl transpeptidase (γ-GT) activities, total bilirubin, albumin levels and prothrombin time) and lipid profile (cholesterol, triglyceride (TG), low-density lipoprotein (LDL) and high-density lipoprotein (HDL) concentrations), were measured using standard methodologies. Enzyme-Linked Immunosorbent Assay (ELISA) kit (DiaMetra Company, Perugia, Italy) was used to measure the serum level of α-fetoprotein. The serum level of MFAP4 and oxidized CoQ10 were measured using commercially available ELISA kits (MyBioSourse, San Diego, CA, USA). Serum malondialdehyde (MDA), glutathione (GSH) levels and superoxide dismutase (SOD) activity were measured using commercially available colorimetric kits (Bio Diagnostic, Giza, Egypt).
The following combination algorithms: APRI, FIB-4, and Forns index were calculated as the following:
  • APRI [15] = ((AST (U/L))/(AST [the upper limit of normal]))/(Platelet [109/L])) × 100
  • FIB-4 [16] = (Age [years] × AST [U/L])/(Platelet [109/L] × √ (ALT [U/L]))
  • Forns index [17] = 7.811 − (3.131 × ln platelet [109/L]) + (0.781 × ln GGT [U/L]) + (3.647 × ln age) – (0.014 × cholesterol [mg/dL])

2.4. Statistical Analysis

All Statistical computations were analyzed using the SPSS version 22 (Chicago, IL, USA), while the graphic presentation of the data was done using Graph Pad Prism version 5 (La Jolla, CA, USA). The results were presented as the mean values ± standard error (SE) for parametric data and the median interquartile range (IQR) for nonparametric data. Student’s t-test was used for comparison between the two groups. One way ANOVA followed by Turkey post hoc test and Kruskal-Wallis were used for comparison between more than two groups. The cut-off value was determined according to the highest sensitivity and specificity of a given marker. Survival analysis was done using the Kaplan–Meier test. p value was considered significant at the level of <0.05, highly significant at the level of <0.01 and extremely significant at the level of <0.001.

3. Results

This study included three groups:
Group I enrolled fifty HCC patients (11 females and 39 males; aged from 50 to 73 years with a mean ± SE of 60.34 ± 0.88 years). All of them developed HCC associated with cirrhosis related to chronic hepatitis C infection and were seronegative to HBsAg and HIV antibodies. The characteristics of HCC patients are summarized in Table 1.
Group II enrolled twenty-five patients with chronic hepatitis C related cirrhosis (13 females and 12 males; aged from 40 to 78 years with a mean ± SE of 59.44 ± 1.81 years). All were seropositive to HCV antibodies and seronegative to both HBsAg and HIV infection.
Group III enrolled fifteen matched apparently healthy individuals (4 females and 11 males; with matched ages ranging from 39 to 63 years with a mean ± SE of 55.73 ± 1.63 years). All were seronegative for HCV, HBsAg and HIV antibodies with normal laboratory and radiological findings.
The liver functions and lipid profile of the study groups were summarized in Table 2.

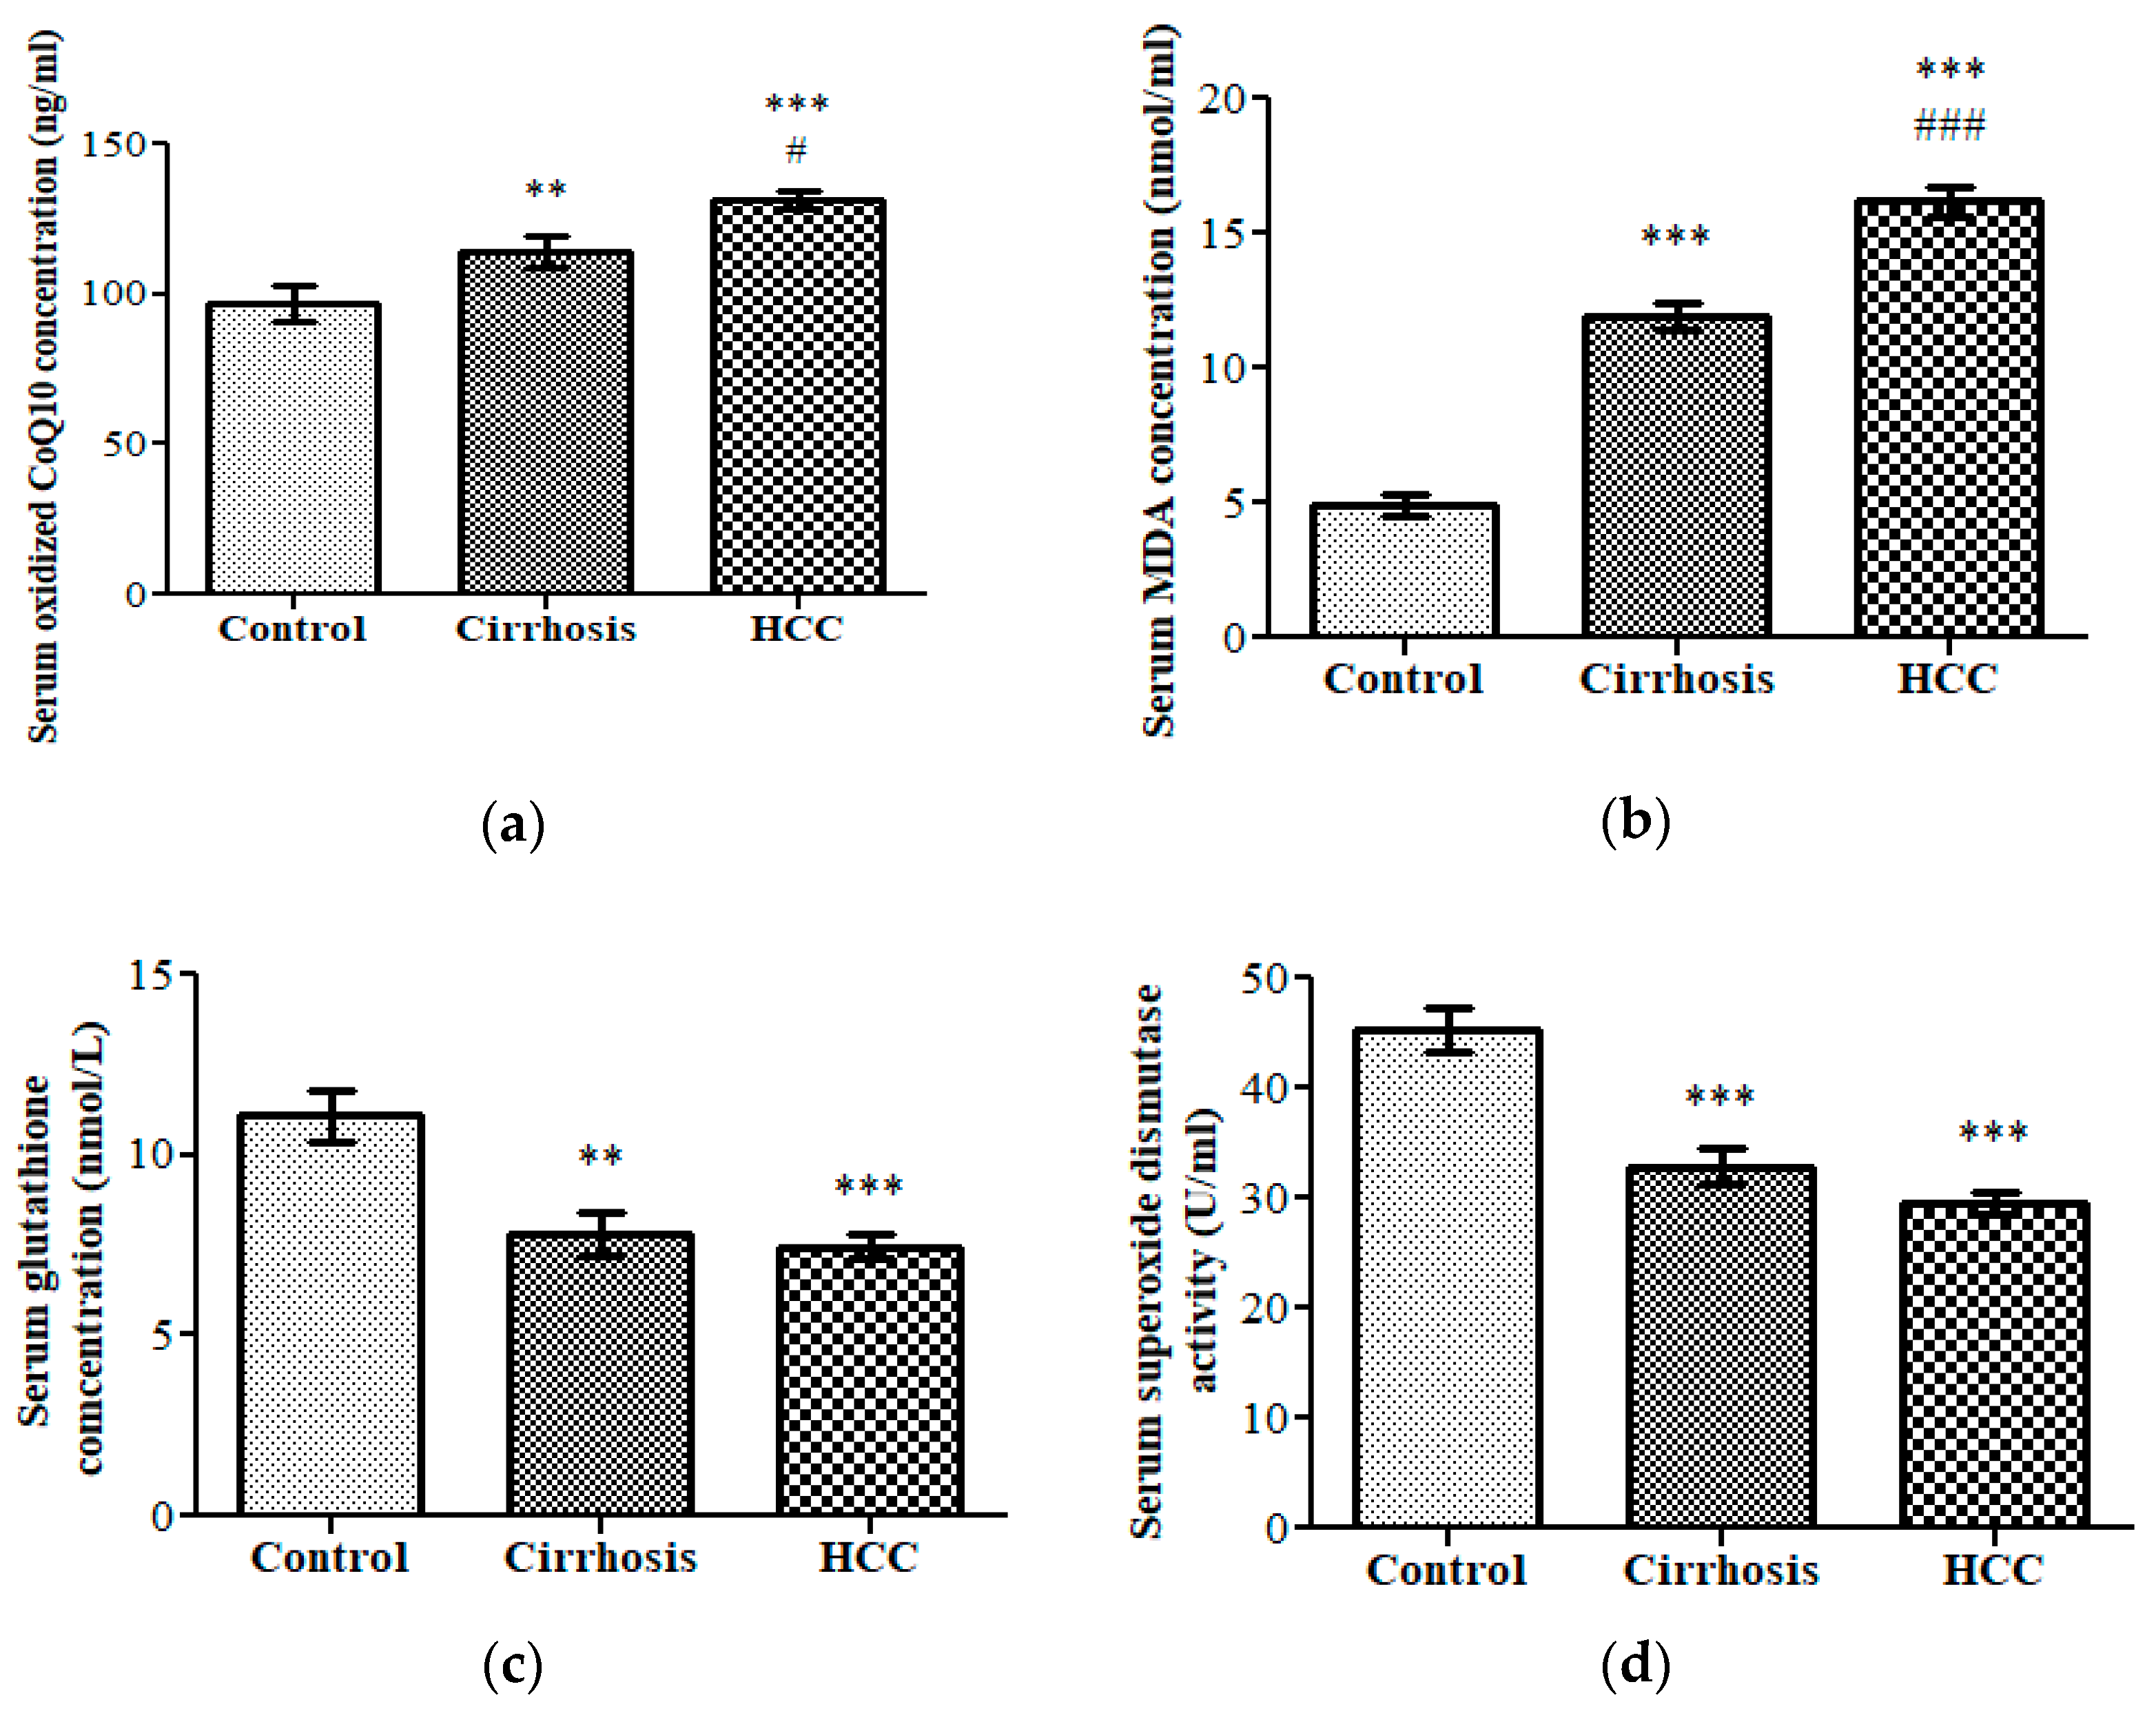
3.1. Oxidative Stress Status

Serum oxidized CoQ10 and MDA concentrations were significantly increased in HCC (p < 0.001 for both) and cirrhotic patients (p < 0.01 and p < 0.001, respectively) compared to the control group. In addition, there was a statistically significant increase in serum oxidized CoQ10 (p < 0.05) and MDA concentrations (p < 0.001) in HCC patients as compared to cirrhotic patients. However, serum GSH concentration and SOD activity were significantly decreased in HCC (p < 0.001 for both) and cirrhotic patients (p < 0.01 and p < 0.001, respectively) compared to the control group, as illustrated in Figure 1.

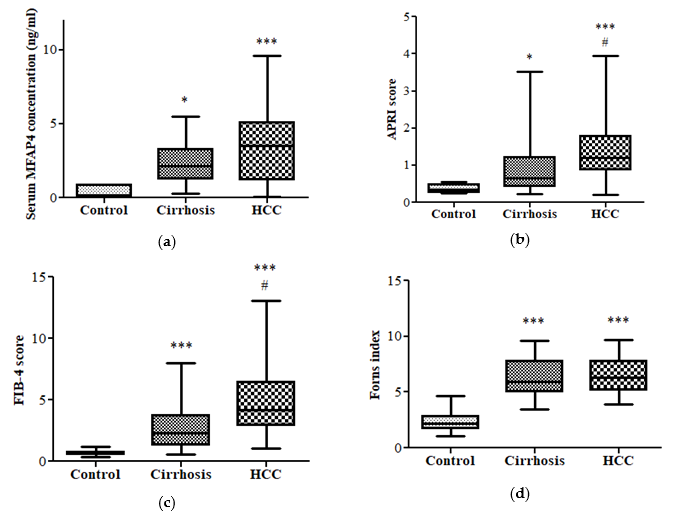
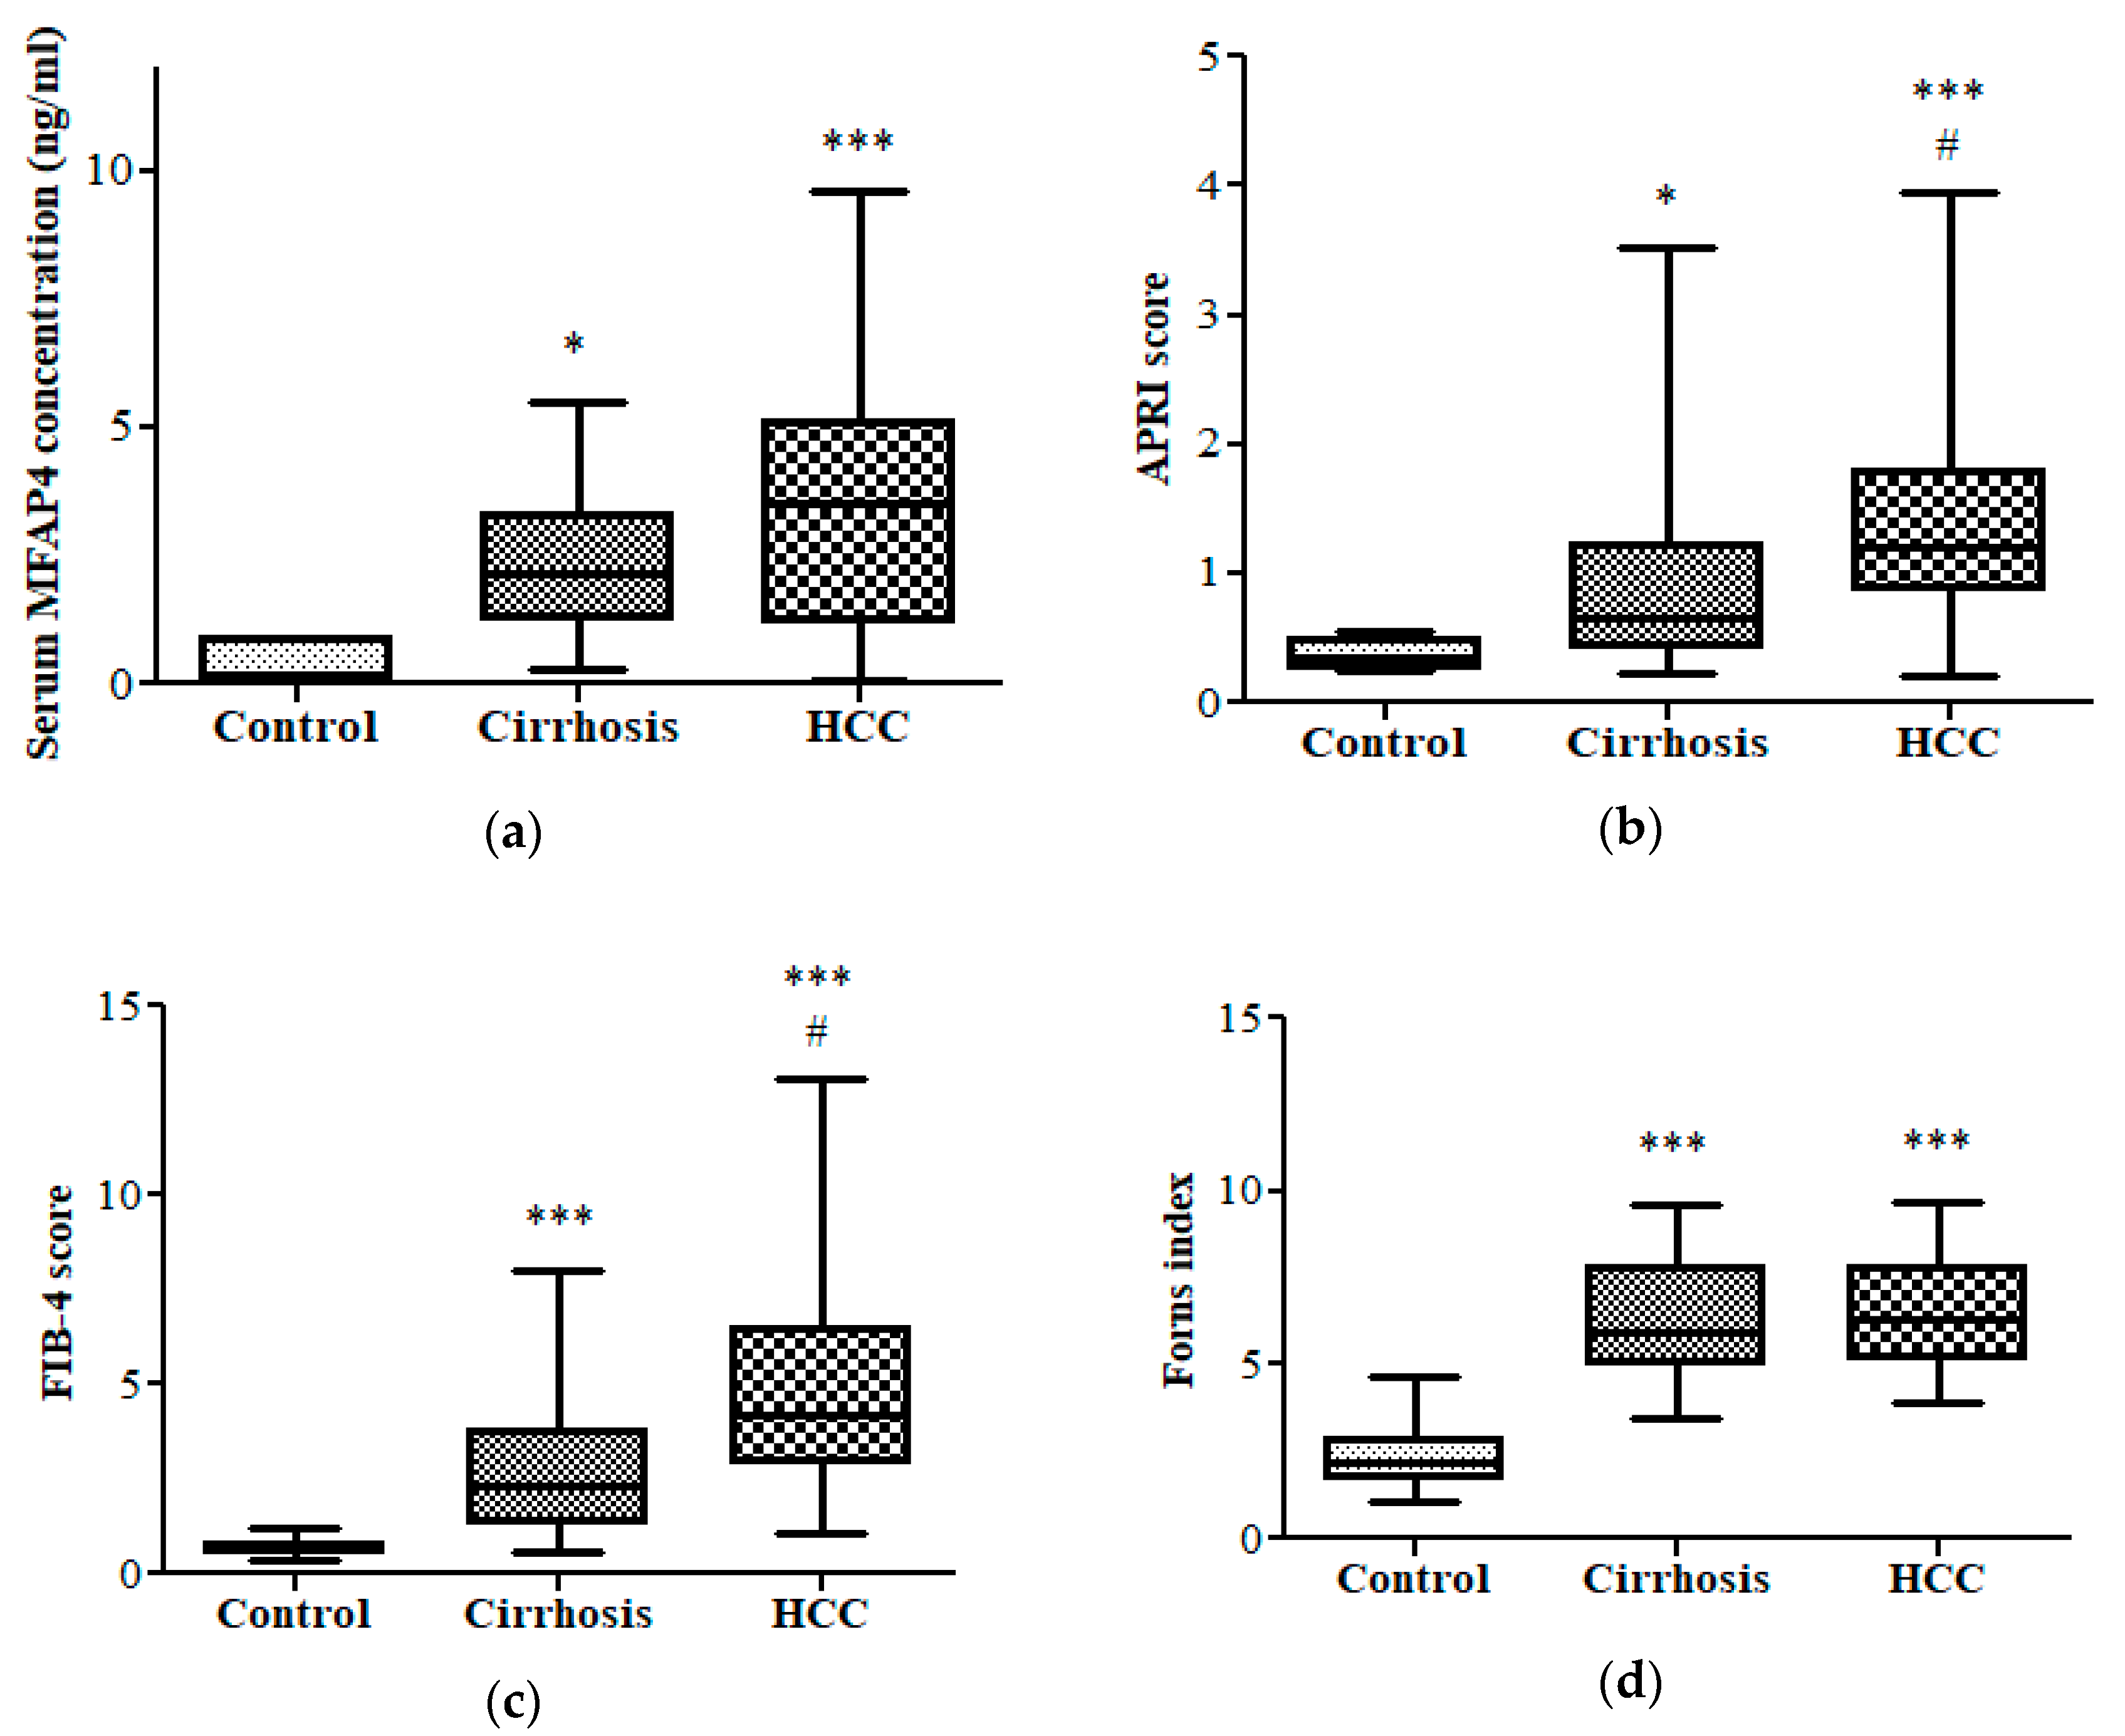
3.2. Fibrotic Biomarkers

Serum MFAP4 concentration, APRI, FIB-4, and Forns index were significantly increased in HCC (p < 0.001 for all) and cirrhotic patients (p < 0.05, p < 0.05, p < 0.001 and p < 0.001, respectively) compared to the control group. While only APRI and FIB-4 showed a significant increase in HCC patients as compared to cirrhotic patients (p < 0.05 for both), as shown in Figure 2.

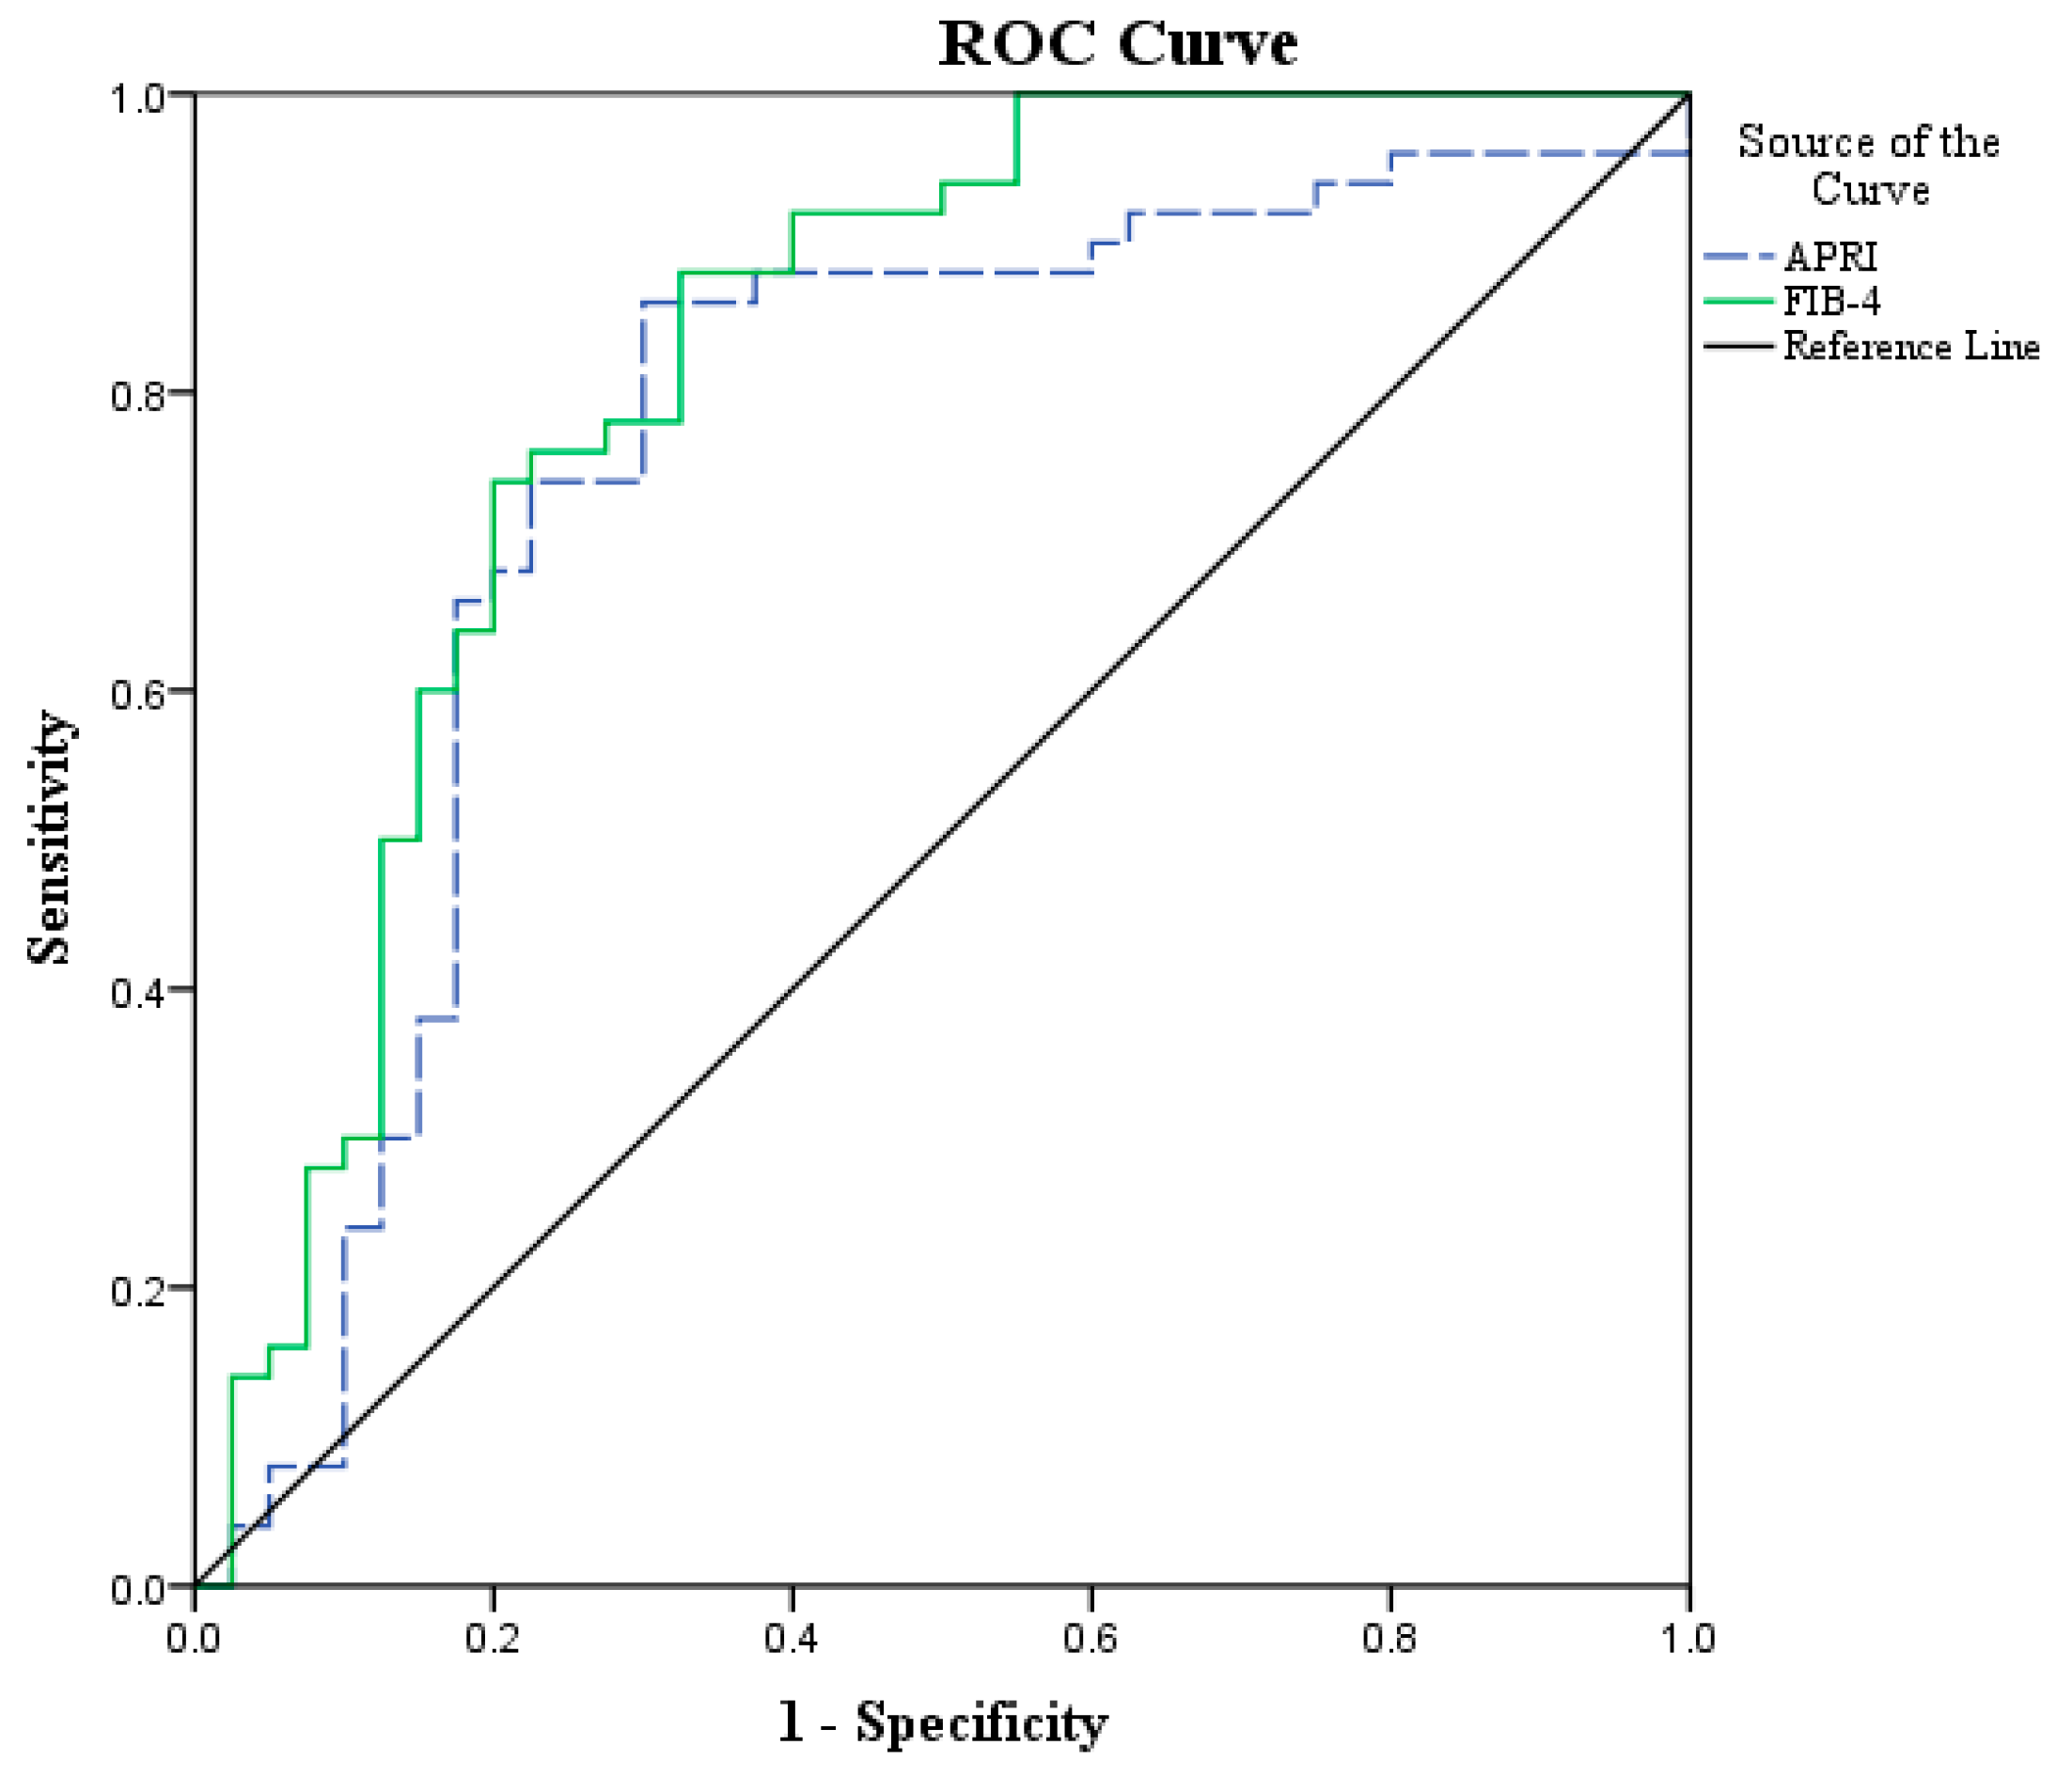
3.3. Diagnostic Performance of APRI and FIB-4 in HCC vs. Cirrhotic Patients and Control Group

At a cut-off of ≥0.7, the diagnostic performance (sensitivity, specificity, positive predictive value, negative predictive value, and accuracy) of APRI in HCC patients were 86%, 70%, 75.18%, 80%, and 78.89%, respectively, while the diagnostic performance of FIB-4 at a cut-off of ≥1.57 were 92%, 60%, 74.19%, 85.17%, and 77.78%, respectively, as illustrated in Table 3 and Figure 3.

3.4. Diagnostic Performance of MFAP4 and Oxidized CoQ10 for the Prediction of Dead HCC Patients

As illustrated in Table 4, the diagnostic performance (sensitivity, specificity, positive predictive value, negative predictive value, and accuracy) of MFAP4 for the prediction of dead HCC patients at a cut-off of ≥1.98 were 76%, 46.7%, 70.4%, 53.8%, and 65%, respectively, while the diagnostic performance of oxidized CoQ10 at a cut-off of ≥126 were 64%, 40%, 63.3%, 35.3%, and 53.2%, respectively.

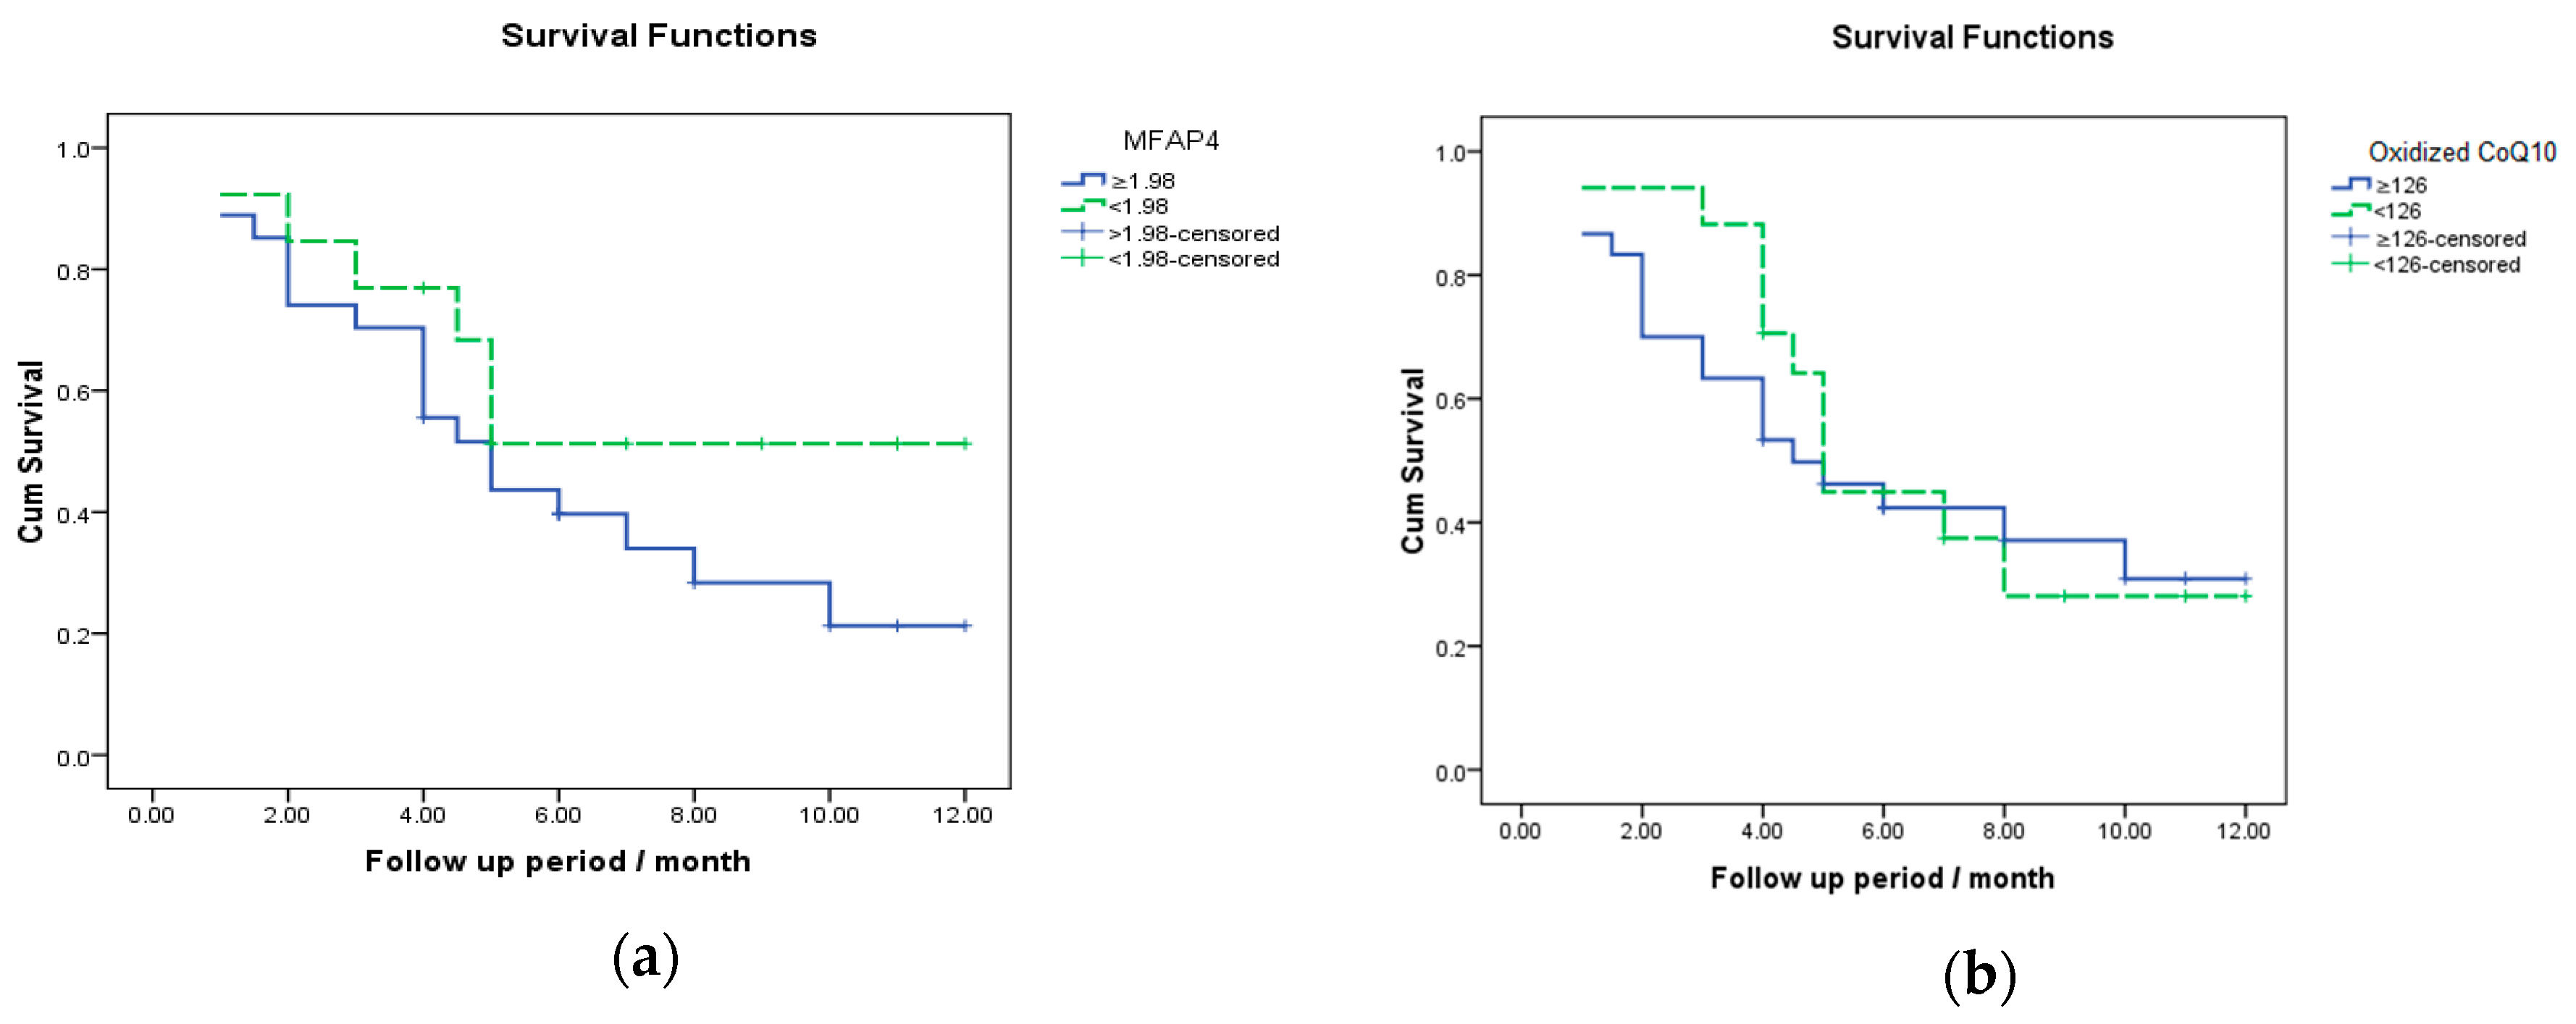
3.5. Survival Analysis for MFAP4 and Oxidized CoQ10 in the Prediction of Death in HCC Patients

Using a cut-off value of 1.98 ng/mL for MFAP4 and 126 ng/mL for oxidized CoQ10, determined by ROC curve analysis (Table 4), two sub-groups that were subsequently analyzed for survival were detected. Patients with MFAP4 levels equal to or higher than 1.98 ng/mL at diagnosis showed no significant difference as regards mean survival time when compared to those with MFAP4 levels lower than the cut-off value (mean survival time: 6.02 vs. 7.85, p > 0.05; Figure 4a). Furthermore, patients with oxidized CoQ10 levels equal to or higher than 126 ng/mL at diagnosis showed no significant difference as regards mean survival time when compared to those with oxidized CoQ10 levels lower than the cut-off value (mean survival time: 6.36 vs. 6.83, p > 0.05; Figure 4b).

4. Discussion

HCV is a single-stranded RNA virus, and its genome is never integrated into the hepatocyte genome. However, HCV-induced HCC is mediated by both direct and indirect oncogenic effects of HCV [5]. Oxidative stress status plays a significant role in HCV pathophysiology. HCV core proteins can stimulate the production of reactive oxygen species (ROS) through the electron transport chain of mitochondria [10], which is known to exacerbate hepatic inflammation, which is responsible for the pathogenesis of liver fibrosis and HCC [21].
CoQ10 is considered to be a frontline antioxidant [28]. In order to act as an antioxidant, CoQ10 must be in the reduced state. NADH-cytochrome b5 reductase and NQO1 (NADPH Quinone reductase 1) are the most principal reductase systems [12]. Our results regarding this only endogenously synthesized lipophilic antioxidant (CoQ10) revealed that serum level of oxidized CoQ10 was significantly increased in both cirrhotic and HCC patients compared to the control group and significantly increased in HCC patients compared to cirrhotic patients. This finding is in agreement with Yamamoto et al., who found that plasma level of an oxidized fraction of CoQ10 was significantly higher in cirrhotic and HCC patients compared to healthy individuals [29].
In the liver of cirrhotic and HCC patients, the synthesis of CoQ10 is not impaired [29]. HCV triggers mitochondrial permeability transition with production of ROS [10], which is more likely to be a cause of an increase in oxidation of CoQ10 and subsequent less efficiency of CoQ10 reduction. Oxidoreductases are down-regulated in HCC compared to normal human liver tissues by about 57% [30]. Moreover, infection with HCV triggers the inflammatory response by expression of proinflammatory cytokines and chemokines [31], and less availability of the reduced form of CoQ10, which has anti-inflammatory effect induces more hepatic inflammation that causes the further production of oxygen radicals. Continuous inflammation and hepatocyte regeneration in chronic hepatitis lead to chromosomal damage and induce hepatocarcinogenesis [21].
In addition, patients with cirrhosis and HCC show a significant elevation in the level of MDA, and a significant decrease in the level of both GSH and SOD when compared to control subjects. Our results regarding oxidative stress status are in agreement with Ansari et al., who found that total antioxidant status and GSH level were decreased, while oxidized glutathione and MDA were increased in different HCV genotypes [32]. Another study revealed that HCC related to HCV infection in the presence or absence of cirrhosis had significantly increased levels of MDA and lower antioxidant enzymes activities, such as SOD, catalase, and GSH peroxidase [33]. Also, a previous study from our lab showed increased serum MDA level and decreased serum GSH level in HCC and cirrhotic patients as compared to healthy individuals [34].
Patients with chronic hepatitis C exhibit an increased production of tumor necrosis factor-α, a cytokine that is able to initiate oxidative stress by stimulating the production of ROS that can further damage hepatic cells by causing lipid peroxidation, and production of toxic and reactive aldehyde metabolites such as MDA, as well as, depletion of intracellular, and/or mitochondrial GSH content [35]. On the other hand, the decrease in SOD activity could be due to either overutilization of this enzymatic antioxidant to scavenge oxidative stress or decrease in synthetic capacity of the liver in patients with HCV-associated HCC.
The aldehyde degradation products of lipid peroxidation are toxic to cells. It can activate hepatic stellate cells (HSCs), which are the major source of ECM, stimulating collagen synthesis and liver fibrosis [36], and also can form covalent adducts altering the structure and function of nucleic acids and proteins, and are responsible for the cytotoxicity of these molecules, and thereby may promote mutagenesis [37]. Moreover, the decrease of GSH content and SOD activity in HCC patients could impair multiple physiological functions and antioxidant defense, which may further facilitate cancer development.
Additionally, we found no significant changes in serum LDL, cholesterol, and TG between different studied groups, but HDL, which has potent anti-inflammatory, anti-oxidant and anti-thrombotic effects [38], was significantly decreased in HCC patients compared to cirrhotic patients and the control group. Besides, HCC and cirrhotic patients exhibited a significant elevation in serum γ-GT activity when compared to control group, which could be correlated with GSH depletion and oxidative stress in these cells. γ-GT enables more cysteine to re-enter these cells so and thereby maintain high GSH concentrations intracellularly to protect the cancer cells from toxicity and maintain redox balance that is critical for cell proliferation and differentiation processes [39].
The risk of hepatic carcinogenesis may persist in those with cirrhosis or severe fibrosis, in spite of achieving sustained viral response after antiviral treatment [5]. Our results revealed a significant increase in serum level of MFAP-4 in patients with HCV-related cirrhosis compared to the control group, and this data is in agreement with many reports [22,25,26]. Additionally, our data revealed a highly significant increase in serum MFAP4 in HCC patients compared to the control group, but the serum level of MFAP4 was non-significantly increased in HCC patients compared to cirrhotic patients.
Patients with HCV have enhanced hepatic fibrosis progression through the generation of ROS inducing transforming growth factor beta 1 (TGF-β1) expression. TGF-β1, one of the most potent profibrogenic cytokines, is involved in the initiation and maintenance of fibrogenesis by triggering the proliferation and transformation of HSCs [40]. Activated HSCs secrete abundant extracellular proteins that contribute to liver fibrosis and cirrhosis, a significant cause of HCC [41]. In the cirrhotic liver, HSCs are the main cell type responsible for the synthesis of MFAP4 in the cirrhotic septa [22], and their activation results in elevated levels of MFAP4 in patients with HCV-related cirrhosis and HCC.
The calculated combination algorisms to evaluate liver fibrosis, APRI and FIB-4, were significantly elevated in HCC patients compared to either cirrhotic patients or the control group, but Forns index showed non-significant difference between HCC and cirrhotic patients. These results are supported by Sato et al., who found that high APRI and FIB-4 in HCC patients compared to HCV patients without HCC [42]. Several studies revealed that APRI could predict the risk of hepatic carcinogenesis in chronic HCV patients after viral eradication [21,43]. However, Nishikawa et al., found that higher FIB-4 rather than APRI was an independent predictor of liver carcinogenesis among treated chronic hepatitis B patients [20].

5. Conclusions

In conclusion, the present study suggests that oxidative stress status and fibrosis are potential mechanisms for HCV persistence and oncogenicity, which might be targeted for better treatment plans for HCV sequels. HCV induces oxidative stress, which activates HSCs to secrete MFAP4 contributing to liver fibrosis and cirrhosis, a significant cause of HCC. Additionally, APRI and FIB-4 potentially are simple, non-expensive, non-invasive and dynamic surrogates for hepatic fibrosis and screening algorisms for risk of carcinogenesis, unlike the serum level of MFAP4 and Forns index that were not statistically different between HCC and cirrhosis.

Author Contributions

Conceived and designed the experiments, M.M.S., M.W.F. and M.M.E.-S.; collected data, M.M.S., M.M.N. and M.W.F.; performed the experiments, M.M.S.; analyzed the data and wrote the manuscript, M.M.S. and M.W.F.; supervised the study and made critical revisions, A.M.E.-G. and M.M.E.-S.; all authors read, reviewed and approved the final manuscript.

Funding

This research received no external funding.

Acknowledgments

The authors acknowledge every participant and technical staff of the biochemistry department for their contribution in this study.

Conflicts of Interest

The authors declare no conflict of interest.

References

  1. Torre, L.A.; Bray, F.; Siegel, R.L.; Ferlay, J.; Lortet-Tieulent, J.; Jemal, A. Global cancer statistics, 2012. Cancer J. Clin. 2015, 65, 87–108. [Google Scholar] [CrossRef] [PubMed]
  2. Ibrahim, A.S.; Khaled, H.M.; Mikhail, N.N.; Baraka, H.; Kamel, H. Cancer incidence in Egypt: Results of the national population-based cancer registry program. J. Cancer Epidemiol. 2014, 2014, 18. [Google Scholar] [CrossRef] [PubMed]
  3. Goldman, R.; Ressom, H.W.; Abdel-Hamid, M.; Goldman, L.; Wang, A.; Varghese, R.S.; An, Y.; Loffredo, C.A.; Drake, S.K.; Eissa, S.A.; et al. Candidate markers for the detection of hepatocellular carcinoma in low-molecular weight fraction of serum. Carcinogenesis 2007, 28, 2149–2153. [Google Scholar] [CrossRef] [PubMed] [Green Version]
  4. Nouroz, F.; Shaheen, S.; Mujtaba, G.; Noreen, S. An overview on hepatitis C virus genotypes and its control. Egypt. J. Med. Hum. Genet. 2015, 16, 291–298. [Google Scholar] [CrossRef]
  5. Hoshida, Y.; Fuchs, B.C.; Bardeesy, N.; Baumert, T.F.; Chung, R.T. Pathogenesis and prevention of hepatitis C virus-induced hepatocellular carcinoma. J. Hepatol. 2014, 61, S79–S90. [Google Scholar] [CrossRef] [PubMed] [Green Version]
  6. Hernandez–Gea, V.; Toffanin, S.; Friedman, S.L.; Llovet, J.M. Role of the microenvironment in the pathogenesis and treatment of hepatocellular carcinoma. Gastroenterology 2013, 144, 512–527. [Google Scholar] [CrossRef] [PubMed]
  7. Loguercio, C.; Federico, A. Oxidative stress in viral and alcoholic hepatitis. Free Radic. Biol. Med. 2003, 34, 1–10. [Google Scholar] [CrossRef]
  8. Arauz, J.; Ramos-Tovar, E.; Muriel, P. Redox state and methods to evaluate oxidative stress in liver damage: From bench to bedside. Ann. Hepatol. 2016, 15, 160–173. [Google Scholar] [CrossRef] [PubMed]
  9. Sebastiani, G.; Gkouvatsos, K.; Pantopoulos, K. Chronic hepatitis C and liver fibrosis. World J. Gastroenterol. 2014, 20, 160–173. [Google Scholar] [CrossRef] [PubMed]
  10. Lozano-Sepulveda, S.A.; Bryan-Marrugo, O.L.; Cordova-Fletes, C.; Gutierrez-Ruiz, M.C.; Rivas-Estilla, A.M. Oxidative stress modulation in hepatitis C virus infected cells. World J. Hepatol. 2015, 7, 2880–2889. [Google Scholar] [CrossRef] [PubMed]
  11. Garrido-Maraver, J.; Cordero, M.D.; Oropesa-Ávila, M.; Fernández Vega, A.; De La Mata, M.; Delgado Pavón, A.; De Miguel, M.; Pérez Calero, C.; Villanueva Paz, M.; Cotán, D. Coenzyme Q10 therapy. Mol. Syndromol. 2014, 5, 187–197. [Google Scholar] [CrossRef] [PubMed]
  12. Navas, P.; Villalba, J.M.; de Cabo, R. The importance of plasma membrane coenzyme Q in aging and stress responses. Mitochondrion 2007, 7, S34–S40. [Google Scholar] [CrossRef] [PubMed]
  13. Miles, M.V.; Horn, P.S.; Morrison, J.A.; Tang, P.H.; DeGrauw, T.; Pesce, A.J. Plasma coenzyme Q 10 reference intervals, but not redox status, are affected by gender and race in self-reported healthy adults. Clin. Chim. Acta 2003, 332, 123–132. [Google Scholar] [CrossRef]
  14. Bose, S.K.; Ray, R. Hepatitis C virus infection and insulin resistance. World J. Diabetes 2014, 5, 52–58. [Google Scholar] [CrossRef] [PubMed]
  15. Wai, C.T.; Greenson, J.K.; Fontana, R.J.; Kalbfleisch, J.D.; Marrero, J.A.; Conjeevaram, H.S.; Lok, A.S.F. A simple noninvasive index can predict both significant fibrosis and cirrhosis in patients with chronic hepatitis C. Hepatology 2003, 38, 518–526. [Google Scholar] [CrossRef] [PubMed] [Green Version]
  16. Vallet-Pichard, A.; Mallet, V.; Nalpas, B.; Verkarre, V.; Nalpas, A.; Dhalluin-Venier, V.; Fontaine, H.; Pol, S. FIB-4: An inexpensive and accurate marker of fibrosis in HCV infection. comparison with liver biopsy and fibrotest. Hepatology 2007, 46, 32–36. [Google Scholar] [CrossRef] [PubMed] [Green Version]
  17. Forns, X.; Ampurdanes, S.; Llovet, J.M.; Aponte, J.; Quintó, L.; Martínez-Bauer, E.; Bruguera, M.; Sánchez-Tapias, J.M.; Rodés, J. Identification of chronic hepatitis C patients without hepatic fibrosis by a simple predictive model. Hepatology 2002, 36, 986–992. [Google Scholar] [CrossRef] [PubMed] [Green Version]
  18. Yang, H.J.; Jiang, J.H.; Yang, Y.T.; Guo, Z.; Li, J.J.; Liu, X.H.; Lu, F.; Zeng, F.H.; Ye, J.S.; Zhang, K.L.; et al. Stratified aspartate aminotransferase-to-platelet ratio index accurately predicts survival in hepatocellular carcinoma patients undergoing curative liver resection. Tumour Biol. 2017, 39. [Google Scholar] [CrossRef] [PubMed] [Green Version]
  19. Peng, W.; Li, C.; Wen, T.F.; Yan, L.N.; Li, B.; Wang, W.T.; Yang, J.Y.; Xu, M.Q. Postoperative aspartate aminotransferase to platelet ratio index change predicts prognosis for hepatocellular carcinoma. Medicine (Baltim.) 2016, 95, e4160. [Google Scholar] [CrossRef] [PubMed] [Green Version]
  20. Nishikawa, H.; Nishijima, N.; Enomoto, H.; Sakamoto, A.; Nasu, A.; Komekado, H.; Nishimura, T.; Kita, R.; Kimura, T.; Iijima, H.; et al. Comparison of FIB-4 index and aspartate aminotransferase to platelet ratio index on carcinogenesis in chronic hepatitis B treated with entecavir. J. Cancer 2017, 8, 152–161. [Google Scholar] [CrossRef] [PubMed] [Green Version]
  21. Ng, K.J.; Tseng, C.W.; Chang, T.T.; Tzeng, S.J.; Hsieh, Y.H.; Hung, T.H.; Huang, H.T.; Wu, S.F.; Tseng, K.C. Aspartate aminotransferase to platelet ratio index and sustained virologic response are associated with progression from hepatitis C associated liver cirrhosis to hepatocellular carcinoma after treatment with pegylated interferon plus ribavirin. Clin. Interv. Aging 2016, 11, 1035–1041. [Google Scholar] [CrossRef] [PubMed]
  22. Mölleken, C.; Sitek, B.; Henkel, C.; Poschmann, G.; Sipos, B.; Wiese, S.; Warscheid, B.; Broelsch, C.; Reiser, M.; Friedman, S.L. Detection of novel biomarkers of liver cirrhosis by proteomic analysis. Hepatology 2009, 49, 1257–1266. [Google Scholar] [CrossRef] [PubMed]
  23. Pilecki, B.; Holm, A.T.; Schlosser, A.; Moeller, J.B.; Wohl, A.P.; Zuk, A.V.; Heumüller, S.E.; Wallis, R.; Moestrup, S.K.; Sengle, G. Characterization of microfibrillar-associated protein 4 (MFAP4) as a tropoelastin-and fibrillin-binding protein involved in elastic fiber formation. J. Biol. Chem. 2016, 291, 1103–1114. [Google Scholar] [CrossRef] [PubMed]
  24. Yasui, Y.; Abe, T.; Kurosaki, M.; Higuchi, M.; Komiyama, Y.; Yoshida, T.; Hayashi, T.; Kuwabara, K.; Takaura, K.; Nakakuki, N.; et al. Elastin Fiber Accumulation in Liver Correlates with the Development of Hepatocellular Carcinoma. PLoS ONE 2016, 11, e0154558. [Google Scholar] [CrossRef]
  25. Saekmose, S.G.; Mossner, B.; Christensen, P.B.; Lindvig, K.; Schlosser, A.; Holst, R.; Barington, T.; Holmskov, U.; Sorensen, G.L. Microfibrillar-Associated Protein 4: A Potential Biomarker for Screening for Liver Fibrosis in a Mixed Patient Cohort. PLoS ONE 2015, 10, e0140418. [Google Scholar] [CrossRef] [PubMed]
  26. Bracht, T.; Mölleken, C.; Ahrens, M.; Poschmann, G.; Schlosser, A.; Eisenacher, M.; Stühler, K.; Meyer, H.E.; Schmiegel, W.H.; Holmskov, U. Evaluation of the biomarker candidate MFAP4 for non-invasive assessment of hepatic fibrosis in hepatitis C patients. J. Transl. Med. 2016, 14, 201. [Google Scholar] [CrossRef] [PubMed] [Green Version]
  27. Pugh, R.; Murray-Lyon, I.; Dawson, J.; Pietroni, M.; Williams, R. Transection of the oesophagus for bleeding oesophageal varices. Br. J. Surg. 1973, 60, 646–649. [Google Scholar] [CrossRef] [PubMed]
  28. Yamamoto, Y. Coenzyme Q10 as a front-line antioxidant against oxidative stress. J. Clin. Biochem. Nutr. 2005, 36, 29–35. [Google Scholar] [CrossRef]
  29. Yamamoto, Y.; Yamashita, S.; Fujisawa, A.; Kokura, S.; Yoshikawa, T. Oxidative stress in patients with hepatitis, cirrhosis, and hepatoma evaluated by plasma antioxidants. Biochem. Biophys. Res. Commun. 1998, 247, 166–170. [Google Scholar] [CrossRef] [PubMed]
  30. Ngoka, L.C. Dramatic down-regulation of oxidoreductases in human hepatocellular carcinoma hepG2 cells: Proteomics and gene ontology unveiling new frontiers in cancer enzymology. Proteome Sci. 2008, 6, 29. [Google Scholar] [CrossRef] [PubMed]
  31. Nishitsuji, H.; Funami, K.; Shimizu, Y.; Ujino, S.; Sugiyama, K.; Seya, T.; Takaku, H.; Shimotohno, K. Hepatitis C virus infection induces inflammatory cytokines and chemokines mediated by the cross talk between hepatocytes and stellate cells. J. Virol. 2013, 87, 8169–8178. [Google Scholar] [CrossRef] [PubMed]
  32. Ansari, M.H.K.; Omrani, M.-D.; Kheradmand, F. Oxidative stress response in patients infected by diverse hepatitis C virus genotypes. Hepat. Mon. 2015, 15, e22069. [Google Scholar] [CrossRef]
  33. Yahya, R.S.; Ghanem, O.H.; Foyouh, A.; Atwa, M.; Enany, S.A. Role of interleukin-8 and oxidative stress in patients with hepatocellular carcinoma. Clin. Lab. 2013, 59, 969–976. [Google Scholar] [CrossRef] [PubMed]
  34. Elewa, M.A.; Al-Gayyar, M.M.; Schaalan, M.F.; El Galil, K.H.A.; Ebrahim, M.A.; El-Shishtawy, M.M. Hepatoprotective and anti-tumor effects of targeting MMP-9 in hepatocellular carcinoma and its relation to vascular invasion markers. Clin. Exp. Metastasis 2015, 32, 479–493. [Google Scholar] [CrossRef] [PubMed]
  35. Levent, G.; Ali, A.; Ahmet, A.; Polat, E.C.; Aytac, C.; Ayse, E.; Ahmet, S. Oxidative stress and antioxidant defense in patients with chronic hepatitis C patients before and after pegylated interferon alfa-2b plus ribavirin therapy. J. Transl. Med. 2006, 4, 25. [Google Scholar] [CrossRef] [PubMed]
  36. Aksoy, H.; Koruk, M.; Akcay, F. The Relationship Between Serum Malondialdehyde and Ceruloplasmin in Chronic Liver Disease. Turk. J. Biochem. 2003, 28, 32–34. [Google Scholar]
  37. Gaschler, M.M.; Stockwell, B.R. Lipid peroxidation in cell death. Biochem. Biophys. Res. Commun. 2017, 482, 419–425. [Google Scholar] [CrossRef] [PubMed]
  38. De Nardo, D.; Labzin, L.I.; Kono, H.; Seki, R.; Schmidt, S.V.; Beyer, M.; Xu, D.; Zimmer, S.; Lahrmann, C.; Schildberg, F.A. High-density lipoprotein mediates anti-inflammatory reprogramming of macrophages via the transcriptional regulator ATF3. Nat. Immunol. 2014, 15, 152–160. [Google Scholar] [CrossRef] [PubMed] [Green Version]
  39. Hanigan, M.H. Gamma-Glutamyl Transpeptidase: Redox Regulation and Drug Resistance. Adv. Cancer Res. 2014, 122, 103–141. [Google Scholar] [CrossRef] [PubMed]
  40. Lin, W.; Tsai, W.-L.; Shao, R.-X.; Wu, G.; Peng, L.F.; Barlow, L.L.; Chung, W.J.; Zhang, L.; Zhao, H.; Jang, J.-Y.; et al. HCV regulates TGF-β1 production through the generation of reactive oxygen species in an NFκB-dependent manner. Gastroenterology 2010, 138, 2509–2518. [Google Scholar] [CrossRef] [PubMed]
  41. Zhang, C.-Y.; Yuan, W.-G.; He, P.; Lei, J.-H.; Wang, C.-X. Liver fibrosis and hepatic stellate cells: Etiology, pathological hallmarks and therapeutic targets. World J. Gastroenterol. 2016, 22, 10512–10522. [Google Scholar] [CrossRef] [PubMed]
  42. Sato, S.; Genda, T.; Ichida, T.; Amano, N.; Sato, S.; Murata, A.; Tsuzura, H.; Narita, Y.; Kanemitsu, Y.; Hirano, K. Prediction of Hepatocellular Carcinoma Development after Hepatitis C Virus Eradication Using Serum Wisteria floribunda Agglutinin-Positive Mac-2-Binding Protein. Int. J. Mol. Sci. 2016, 17, 2143. [Google Scholar] [CrossRef] [PubMed]
  43. Ji, F.; Zhou, R.; Wang, W.; Bai, D.; He, C.; Cai, Z.; Shen, Y.; Wang, S.; Deng, H.; Li, Z. High Post-treatment alpha-Fetoprotein Levels and Aspartate Aminotransferase-to-Platelet Ratio Index Predict Hepatocellular Carcinoma in Hepatitis C Virus Decompensated Cirrhotic Patients with Sustained Virological Response After Antiviral Therapy. J. Interferon Cytokine Res. 2017, 37, 362–368. [Google Scholar] [CrossRef] [PubMed]
Figure 1. (a) Serum oxidized CoQ10 concentration (ng/mL) in cirrhotic, hepatocellular carcinoma (HCC) patients and control group; (b) Serum malondialdehyde (MDA) concentration (nmol/mL) in cirrhotic, HCC patients and control group; (c) Serum glutathione concentration (nmol/mL) in cirrhotic, HCC patients and control group; (d) Serum superoxide dismutase activity (U/mL) in cirrhotic, HCC patients and control group. One way ANOVA followed by Turkey post hoc test was used. Values were expressed as the mean ± standard error. ** = Significance against control group (p < 0.01); *** = Significance against control group (p < 0.001); # = Significance against cirrhotic group (p < 0.05); ### = Significance against cirrhotic group (p < 0.001).
Scipharm 86 00044 g001
Figure 2. (a) Serum microfibrillar-associated protein 4 (MFAP4) concentration (ng/mL) in cirrhotic, hepatocellular carcinoma (HCC) patients and control group; (b) Aspartate aminotransferase to platelet ratio index (APRI) in cirrhotic, HCC patients and control group; (c) Fibrosis index based on the 4 factors (FIB-4) in cirrhotic, HCC patients and control group; (d) Forns index in cirrhotic, HCC patients and control group. Kruskal-Wallis test was used. Values were expressed as median (interquartile range). * = Significance against control group (p < 0.05); *** = Significance against control group (p < 0.001); # = Significance against cirrhotic group (p < 0.05).
Scipharm 86 00044 g002
Figure 3. Receiver Operating Characteristics (ROC) curve for aspartate aminotransferase to platelet ratio index (APRI) and Fibrosis index based on the 4 factors (FIB-4) in hepatocellular carcinoma patients vs. cirrhotic patients and control group.
Scipharm 86 00044 g003
Figure 4. (a) Kaplan–Meier survival analysis for microfibrillar-associated protein 4 (MFAP4) in the prediction of death in hepatocellular carcinoma (HCC) patients; (b) Kaplan–Meier survival analysis for oxidized CoQ10 in the prediction of death in HCC patients. Cum Survival: cumulative survival.
Scipharm 86 00044 g004
Table 1. The characteristics of 50 patients with hepatocellular carcinoma (HCC).
VariableNo. of Patients (%)VariableNo. of Patients (%)
Age Size of lesion
≤60 years21 (42%)≤5 cm21 (42%)
>60 years29 (58%)>5 cm29 (58%)
Gender Portal vein
Male39 (78%)Thrombosed22 (44%)
Female11 (22%)Patent28 (56%)
Number of lesions Lymph node involvement
Single15 (30%)N031 (62%)
Multiple35 (70%)N119 (38%)
Site of lesion Distal metastasis
Unilobar16 (32%)M043 (86%)
Bilobar34 (68%)M17 (14%)
N0, no lymph node involvement; N1, cancer spread to nearby lymph nodes; M0, no distant cancer spread was found; M1, distant metastases were found.
Table 2. Comparison of biochemical parameters in hepatocellular carcinoma (HCC), cirrhotic patients and control group.
ParametersControl (n = 15)Cirrhosis (n = 25)HCC (n = 50)
ALT activity (U/L)37.0 (20.0–55.0)40.22 (28.44–78.5)50.25 (36.59–75.66) *
AST activity (U/L)28.0 (21.0–38.0)48.0 (28.15–69.5) *70.5 (54.7–92.5) *** ##
γ-GT activity (U/L)14.0 (11.0–19.7)33.6 (17.2–62.5) **33.2 (18.28–53.85) **
Total bilirubin (mg/dL)0.61 ± 0.040.94 ± 0.071.28 ± 0.07 *** ##
Albumin (mg/dL)4.48 ± 0.074.04 ± 0.13.8 ± 0.09 ***
Prothrombin time (s)13.05 ± 0.2113.46 ± 0.3314.62 ± 0.28 ** #
α-Fetoprotein (ng/mL)0.86 ± 0.0859.2 ± 3.35636.3 ± 92.57 *** ###
Cholesterol (mg/dL)170.7 ± 9.79170.3 ± 7.42177.7 ± 7.72
TAG (mg/dL)96.6 ± 15.6115.3 ± 9.46130.4 ± 6.77
LDL (mg/dL)103.7 ± 6.8190.8 ± 4.4114.31 ± 7.35
HDL (mg/dL)50.39 ± 3.9755.6 ± 3.737.27 ± 2.0 * ###
ALT, alanine aminotransferase; AST, aspartate aminotransferase; γ-GT, gamma-glutamyl transpeptidase; TAG, triacylglycerol; LDL, low-density lipoprotein; HDL, high-density lipoprotein. Values are expressed as the mean ± standard error (SE) while Values of ALT, AST and γ-GT are given as median (interquartile range) instead of mean ± SE due to non-parametric distribution. n = Number of subjects in each group. * = Significance against control group (p < 0.05); ** = Significance against control group (p < 0.01); *** = Significance against control group (p < 0.001); # = Significance against cirrhotic group (p < 0.05); ## = Significance against cirrhotic group (p < 0.01); ### = Significance against cirrhotic group (p < 0.001).
Table 3. Diagnostic performance of APRI and FIB-4 in hepatocellular carcinoma patients vs. cirrhotic patients and control group.
VariableAUCp-ValueCut Off
Point
Sensitivity
(%)
Specificity
(%)
PPV (%)NPV (%)Accuracy
(%)
APRI0.76<0.001≥0.786.070.078.1880.078.89
FIB-40.82<0.001≥1.5792.060.074.1985.7177.78
AUC, area under the curve; PPV, positive predictive value; NPV, negative predictive value; APRI, aspartate aminotransferase to platelet ratio index; FIB-4, fibrosis index based on the 4 factors.
Table 4. Diagnostic performance of MFAP4 and oxidized CoQ10 for the prediction of dead hepatocellular carcinoma patients.
VariableAUCp-ValueCut Off
Point
Sensitivity
(%)
Specificity
(%)
PPV (%)NPV (%)Accuracy
(%)
MFAP40.5330.727≥1.9876.046.770.453.865.0
CoQ100.5250.791≥12664.040.063.335.353.2
AUC, area under the curve; PPV, positive predictive value; NPV, negative predictive value; MFAP4, microfibrillar-associated protein 4.

