Abstract
Disruptive technology theory receives a lot of attention and has a significant influence on scholars and managers in approaching technology competition. Some studies have formalized the disruptive technology, investigating the mechanism and determinants of disruption. While some modern technologies are understood to be disruptive, they also exhibit increasing return to the adoption properties or network effects. However, how the network effects influence the disruption mechanism has only received little attention in the previous formal disruptive technology models. Therefore, in this study, we developed a formal model to investigate the dynamics of disruption by exploring the interaction of technology development, the consumer’s choice, firm’s decision, and structure of demand under the influence of different degrees of network effects. The model is simulated using agent-based software of the Laboratory for Simulation Development (LSD). We argue that weak network effects allow for different competitive outcomes (i.e., competitive isolation, convergence, and disruption), where the heterogeneity of the consumers’ preferences matters in determining the outcomes. Therefore, this study suggests that weak network effects enhance the likelihood of disruptive innovation, depending on the heterogeneity in customer preference. Strong network effects, however, lead to a winner-takes-all situation regardless of the heterogeneity in the consumers’ preferences.
1. Introduction and Motivation
Since its introduction by Christensen in his seminal book the Innovator’s Dilemma in 1997, disruptive technology theory has had a significant influence on scholars and managers in approaching technology competition. While previous literature on technology competition has highlighted the displacement of established firms and technologies, which is driven by the superior performance of the entrants and new technology [1,2], the notion of disruptive technology offers the possibility that technology with inferior performance can displace or disrupt the incumbent.
After a careful review on some studies investigating the formal model in the mechanism of disruptive innovation, we identified a lack of the explicit formulation of the influence of the network effects in the formal model of disruptive innovation [3,4,5,6,7]. Previous studies have shown that many examples in ICT are disruptive technologies [8,9] that exhibit network effects, however, how the network effects influence the mechanism of disruption has only received limited attention. In this paper, we would like to place more attention on how the increasing return to the adoption or network effects will influence the likelihood of a potentially disruptive technology to disrupt the established technology. Therefore, we are motivated to combine these two streams of research by taking into account the network effects into the disruptive innovation mechanism. This purpose would be achieved by developing a formal disruptive technology model that explicitly includes the increasing the returns to adoption or network effects.
To investigate how the network effects influence the likelihood of disruption as well as determine the competitive outcomes, we employed agent-based modeling and simulation (ABMS). We formulated a model that incorporated technology development, the consumers’ decision, the firms’ allocation as well as the structure of demand as we were interested in simulating the interaction or interplay among these factors. This was our first objective. Our second objective was to identify the influence of the network effects on the likelihood of disruption as one of the competitive outcomes.
Aside from all of the other advantages and reasons for employing agent-based modeling and simulation, we were particularly interested in its extension possibilities. For example, in our study, we set up the consumers’ preferences and network effects as determining parameters among all of the other parameters. Depending on the requirements and purpose of the research, some parameters, which were exogenously and arbitrarily determined, can be turned into variables and endogenously generated. Another extension possibility could be to relax some strong assumptions such as the assumption of the perfect knowledge of consumers in evaluating the product characteristics.
2. Literature Review
2.1. Disruptive Technology/Innovation and Creative Destruction
Disruptive technology theory was advanced by Christensen in his famous book entitled the Innovator’s Dilemma in 1997. According to Christensen, disruptive technologies are technologies that provide different values from to the mainstream technologies and are initially inferior to the mainstream technologies along the dimension of performance, which is the most important to mainstream customers [10]. Christensen introduced the aspects of changing performance with time, plotted the trajectories of product performance provided by firms and those demanded by the customers for different technologies and market segments, and showed that technology disruption occurred when these trajectories intersected.
Each product based on disruptive technology could only serve a niche segment in its early stage. Further development could raise the performance of disruptive technology to a level sufficient to satisfy mainstream customers. Although improved, the performance of disruptive technology remains inferior compared to the performance of the established mainstream technology, which is also improving as well. Over time, the performance of mainstream technology will have exceeded the demand of the mainstream customers, resulting in a performance overshoot. The market disruption occurs when the new product (from disruptive technology) displaces the mainstream product in the mainstream market [8]. In their book The Innovators’ Solution (2003), Christensen and Raynor widened the scope of the theory into disruptive innovation to also include services and business model innovation [11]. Christensen et al. [12] clarified the theory’s core concept that had been misunderstood. Many writers and analysts have loosely used the concept to describe any breakthrough that changes the competitive landscape (i.e., Uber is not a disruptive innovation but seem to be a sustaining innovation) and argued that different types of innovation requires different strategic approaches.
Creative destruction is still used in hi-tech sectors to describe the idea of how innovation transforms the economy and society [13]. Schumpeter [14] coined “creative destruction” in his book Capitalism, Socialism, and Democracy as a metaphor for a series of processes that sometimes revolutionized the economy. Schneider [13] stated that these two theories of disruptive innovation and creative destruction were complementary, in a sense that Christensen’s theory is based on an analytical background with more inductive power at the microeconomic level and Schumpeter’s is supported by strong intuition and allows for a macroeconomic perspective.
2.2. Network Effects
When two or more technologies compete, the increasing return to adoption creates positive feedback (i.e., more adoption makes the technologies more familiar to the users and become more improved) [15]. This in turn makes the users adopt the technologies more and eventually creates customer lock-in. When two or more technologies compete for a market of potential adopters, an ‘insignificant event’ might favor one technology, make it achieve sufficient adoption, and eventually dominate, resulting in a winner-takes-all outcome. Arthur [16] provided a dynamic model that showed how insignificant or random a historical event influenced the selection of the market outcome of multiple equilibria. Lock-in might result in the inefficiency problem (i.e., the dominance of inefficient technology that prevents new better technology coming onto the market).
Arthur [15] suggested that the consumers (users) value a product or technology for two reasons: the intrinsic preference of the consumers (potential users), but also by the number of consumers (users) that have already adopted the technology. In other words, the intrinsic preference and the number of users determine the utility of a technology for new adopters. Arthur was specifically interested in the increasing returns to adoption where the utility of a technology for a new user increased with the number of users who had already adopted the technology (network effects).
This study focused on the demand side of the network effects. Related to disruptive innovation, the network of startups and companies on the supply side can also be found [17], investigating how a homogeneous and heterogeneous network might benefit startups pursuing low-end and new market disruption.
2.3. Review on Some Disruptive Innovation Models and Simulations
Some scholars have worked on formalizing disruptive technology theory and offered some theoretical insights of the mechanism and determinants of disruption [3,4,5,7,9]. Other scholars have formalized the technology competition dynamics in a manner similar to disruptive technology theory without mentioning the terminology [18].
Adner [3] emphasized a demand structure that determines the dynamics of disruptive technology and its impact on the competitive regime. He proposed preference overlap and preference asymmetry as new constructs that characterize different market segments and how these constructs lead to disruption as one of its competitive regimes. Based on field research, Vaishnav [6] offered his analysis on why a potentially disruptive technology failed to challenge the incumbent and dominant technology by looking at the technical, market, and organizational uncertainties. Building on an existing model of innovation diffusion, Mount [7] suggested that the development dynamics, preference structure, and demand structure had an effect on market disruption. Buchta et al. [4], in investigating the effect of the firm’s inertia and technology efficiency on the likelihood of disruption, developed a model that included technology, the market, and the firm’s decision.
This study focused on a previous study by Adner and Malerba [3,18], since they placed attention on the demand dynamics of competing technologies for adoption, as we attempted to do in our study. Adner [3] demonstrated how his proposed new constructs of preference asymmetry and overlaps determined the disruption in the hard-disk drive market. Malerba [18] investigated the role of consumers with different preferences and experimental users on the innovation and industry dynamics. They argued that the existence of a fringe market with different preferences and experimental users are crucial for new entrants to eventually become competitive in the main market. Although the model we developed here has some similarities with those, we propose some significant differences. Adner [3] developed a model for disruptive innovation and argued that demand structure in terms of consumers’ preference overlap and asymmetry determined the competitive outcome including competitive disruption. However, Adner’s model did not take into account the network effects in the consumer’s adoption decision. Malerba [18] investigated how consumers with different preferences created space for a new technology to be able to compete in the mainstream market segment. This model distinguishes itself from Malerba’s [18] model by incorporating the core and secondary functional characteristics as well as the cheapness characteristic of technological products. Hence, firms are allowed to develop their products at different trajectories in the product space as well as commit themselves to product and process innovation.
3. Methodology
3.1. Hypothesis Development
In this study, the first hypothesis is as follows:
Hypothesis 1.
Dynamics and the outcome of disruption are affected by the interplay between technological development, the consumer’s choice, the firm’s decision, and the demand structure.
Keller and Hüsig [19], in their work on developing an identification framework of disruptive innovation, argued that even if a potentially disruptive technology such as web application had the potential to satisfy the performance requirement of consumers in the mainstream segment, due to network effects, it was unlikely to pose a disruptive threat to established technology in the software industry. On the other hand, Vaishnav [6] suggested that while strong network effects can create a winners-take-all market, weak network effects might favor the entrant. In other words, he argued that the strength of the network effects might determine the outcome of the competition. Hence, we would like to propose the second hypothesis as follows:
Hypothesis 2.
The strength of the network effects influences the likelihood of disruptive innovation as one of the competitive outcomes.
3.2. Model Setup
3.2.1. Supply Dynamics
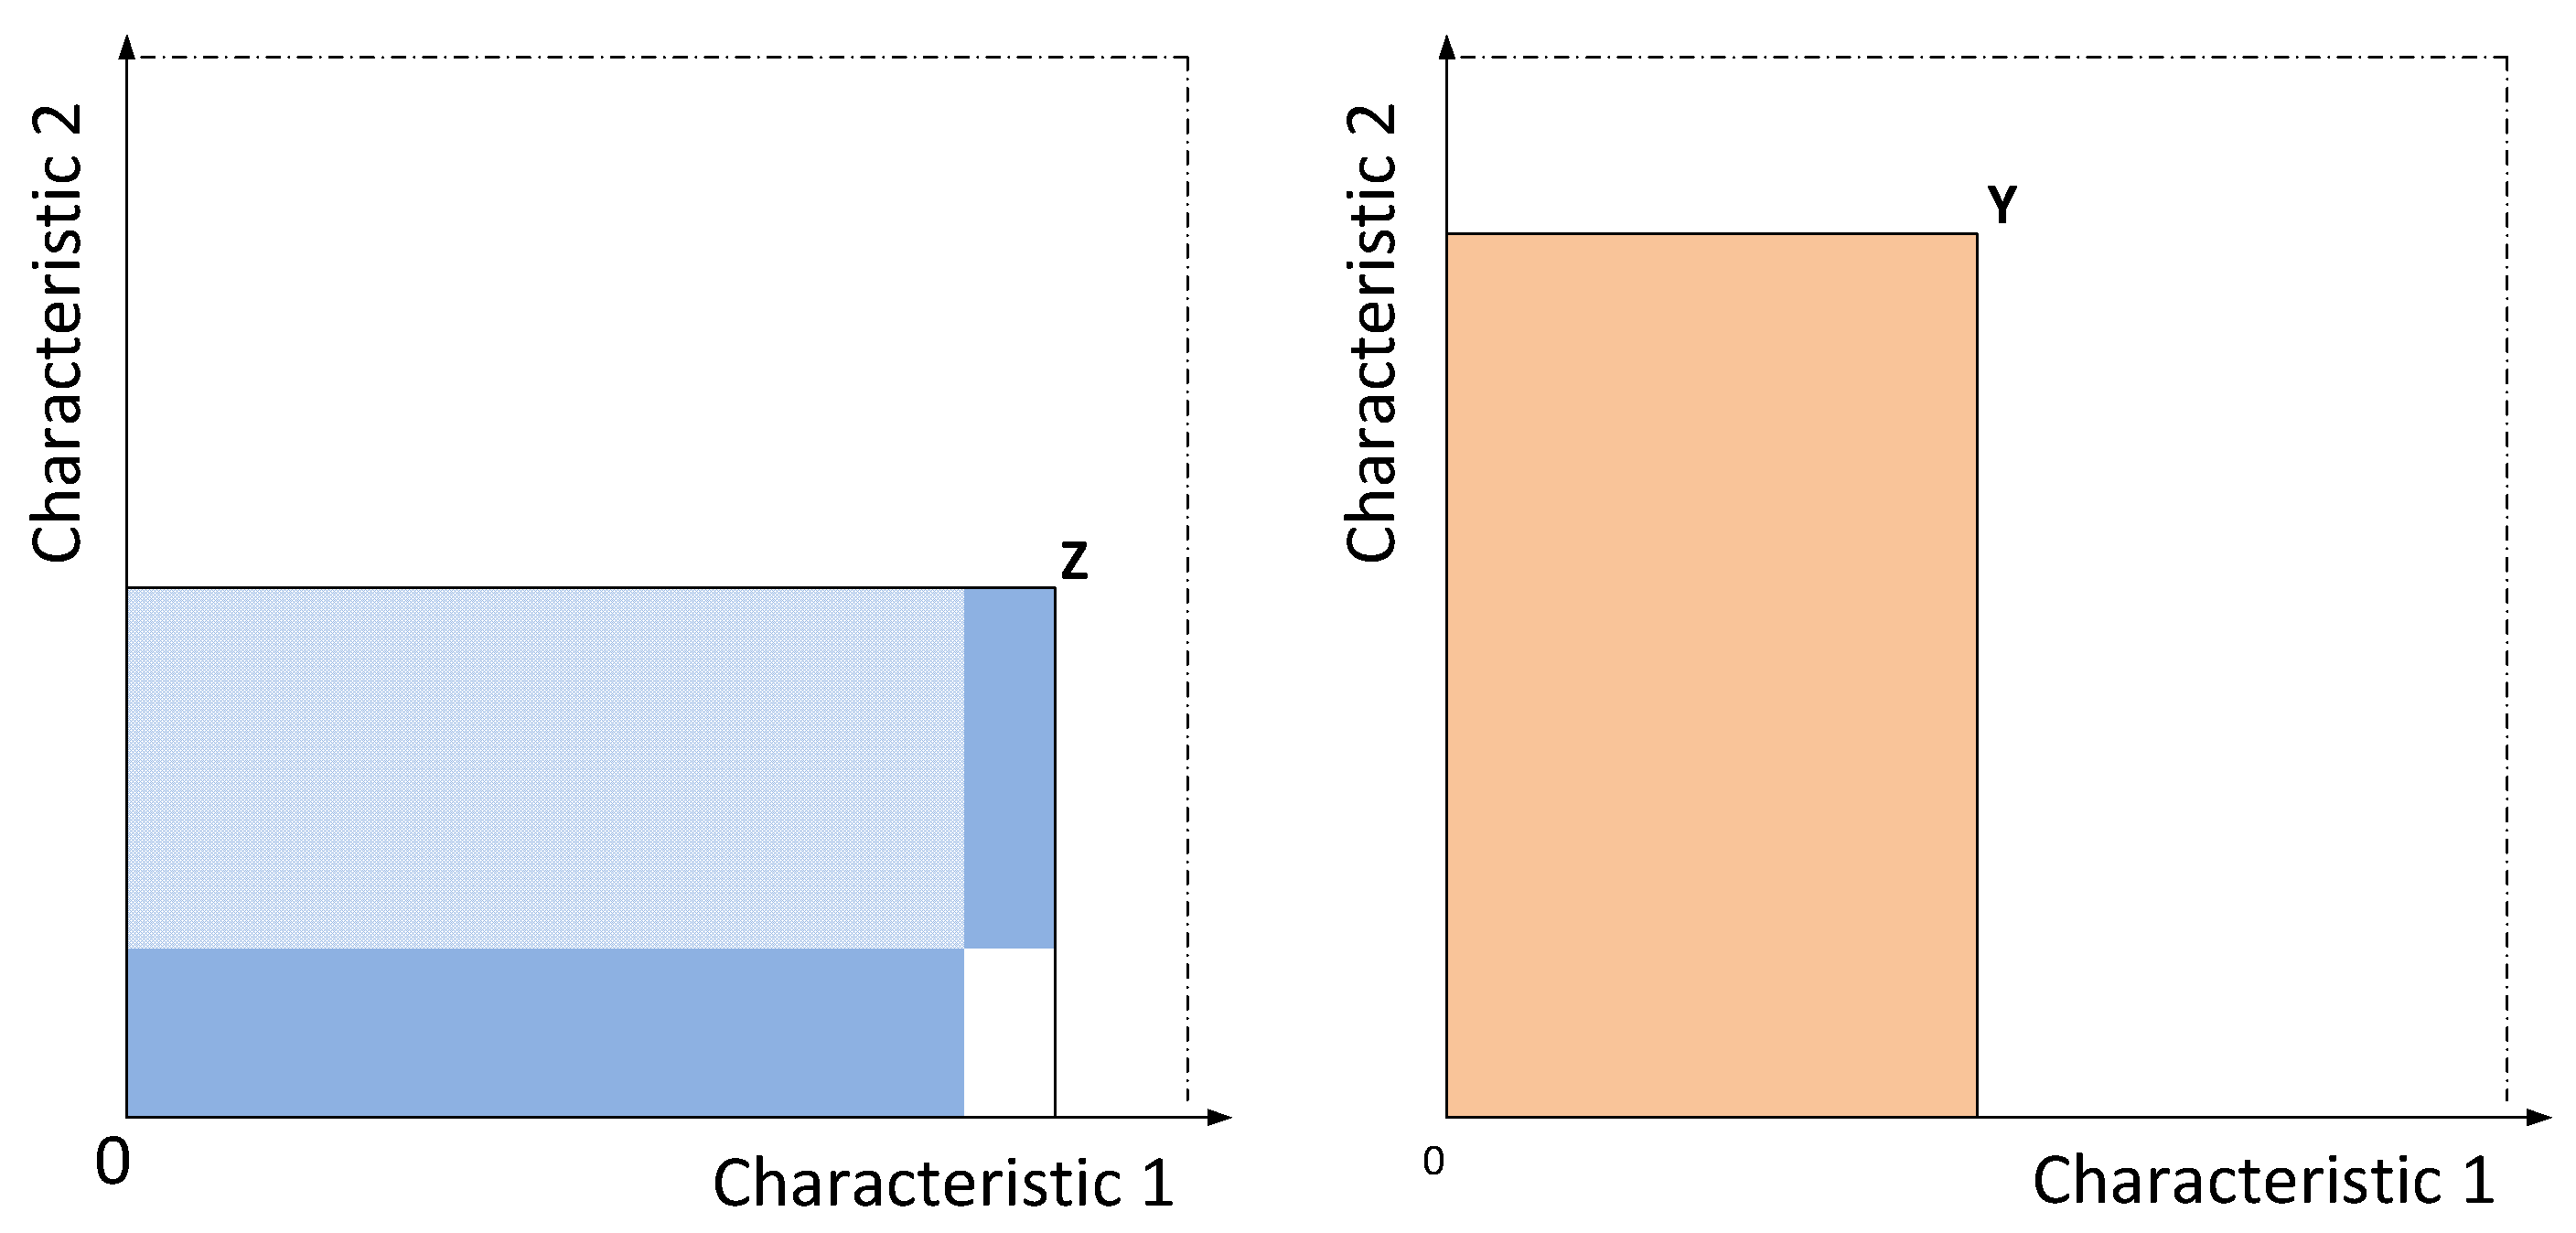
Firms develop their products in a two-dimensional product space consisting of characteristic 1 in the abscissa and characteristic 2 in the ordinate. Characteristic 1 might represent the core characteristic of the product such as the quality and characteristic 2 might represent the secondary characteristic such as convenience, ease of use, and portability.
The setup consisted of one group of firms that focused on developing their products in characteristic 1 (blue-shaded area), whereas the other group of firms focused on characteristic 2 (orange-shaded area), as illustrated in Figure 1 below. In the beginning, every firm is endowed with initial financing, and every firm commits to allocating the endowment fund into a product and process innovation. The share of the endowment fund allocation varies among firms. In every time period, firms that gain profit will allocate further into product and process innovation.

Figure 1.
The product development areas in the product space.
Product Innovation
Firms that pursue the technological frontier (i.e., the most advanced technology achieved by (other) firms) is a particular characteristic in the industry. When one particular firm is in the frontier, they will develop their own path of product development. Nevertheless, a firm may decide to focus more on one characteristic than on another (e.g., one firm develops a product along the product trajectory from 0 point to Z, and another firm develops along the other trajectory from 0 to Y). The product’s characteristics are defined as , where = 1, 2. Hence, denotes the functional characteristic 1 or the core characteristic, and is the functional characteristic 2 or secondary characteristic, respectively.
Firms spend the initial endowment to conduct R&D and develop along each dimension—characteristic 1 () and characteristic 2 (), according to the equations below:
where
characteristic at time ;
change in characteristic ;
; improvement increment on characteristic due to product innovation when the firm is in frontier;
improvement increment on characteristic due to product innovation when the firm is pursuing the technological frontier;
technological frontier of characteristic at .
The probability of product innovation success is determined by the allocation of the profit for R&D expenditure, .
where
R&D expenditure as a share of profit at:
= coefficient of probability function;
= constant fraction of profit for R&D expenditure.
Profit is calculated in each period as:
where
= the number of products sold;
= the product’s price;
= the production cost.
Price is obtained by adding a mark-up to cost :
Cheapness is the inverse of price and defined as the third characteristic of the product, ,
Process Innovation
Firms allocate their initial endowment and later on their profit into process innovation to reduce the cost by a negative value of if the process innovation is successful.
The probability (P) of the success of process innovation is expressed in the equation below:
where
R&D expenditure as a share of profit at:
= coefficient of probability function.
3.2.2. Demand Dynamics
Minimum Requirement and Functional Benefit
Consumers are endowed with a set of minimum requirements (i.e., for an individual is associated to a vector , which means is the minimum requirement of consumer for functional characteristic 1, is the minimum requirement of consumer for functional characteristic 2, and is the minimum requirement for cheapness. The potential set for a consumer of all products is for all characteristic .
Therefore, the functional benefit () that consumer obtains from product is defined by
where coefficient a, b, and c represent the weight that a consumer places on the first and second functional characteristics, and cheapness
Consumer Utility and Adoption Decision
Consumers assess the products available on the market based on the product benefit, , which comprises their functional characteristics and cheapness as the inverse of price, and the share of consumers who adopt the product or network effect, .
In the utility function, we assigned a variable of adoption in a previous time period, to prevent a shift in adoption just because of the identical utility value, which is defined as follows:
Consumer will adopt product at time t, which gives the highest utility , which is defined by
where q represents the strength of the functional benefit; n represents the strength of the network effect; and s is a small constant. represents the network effect or number of adopters of product at
3.3. Simulation Setup
The simulation was developed with the Laboratory for Simulation Development (Lsd), an agent-based simulation programming platform built on C++. Lsd was written by Marco Valente and developed to facilitate the use of computer simulations in economic research [20].
In Lsd, we set up a market that consisted of firms and consumers. Similar to Adner’s [3] approach, the supply side is represented by two firms competing in the market. It is, of course, a simplification, however, a firm in our simulation can be considered as representing a group of firms whose product characteristics are similar. Firm 1 can be considered as a group of firms that focus more on functional characteristic 1 and vice versa. Firm 1 and Firm 2 start from different initial conditions of their respective functional characteristics 1 and 2 as well as the magnitude of the development or improvement step of functional characteristics 1 and 2 as the result of product innovation, α1 and α2. Firms 1 and 2 conduct product innovation and the success of the innovation will determine the value of functional characteristics 1 and 2 at the next time period. Firms 1 and 2 also carry out process innovation and its success will determine the cost reduction and price accordingly at the next time period. Firms allocate the portion of profit, which influences the success probability of product and process innovation.
The market consists of two segments (i.e., mainstream and niche), hence consumers are either part of the mainstream or niche segment. We set up 250 individual consumers in the mainstream and 75 individual consumers in the niche segments, respectively. Consumers were characterized by their heterogeneity in the minimum requirements of functional characteristic 1, functional characteristic 2, and cheapness. The minimum requirements of functional characteristic 1 of the consumers were normally distributed with a mean of 75 and a standard deviation of 25. A similar setup was used for the minimum requirement of functional characteristic 2 of the consumers. For cheapness, the minimum requirements were uniformly distributed between 0 and 2. Every consumer evaluated the functional characteristics 1, 2, and the cheapness of the product technology provided by Firms 1 and Firm 2 at every time period. The consumer will only consider buying a product if it offers functional characteristics that exceed their minimum requirements and has a functional benefit.
Every consumer put weight either on characteristics 1, 2, and cheapness as a notion of consumer preference. We set up this weight as a power in the consumer’s benefit function. This way, we can set up the heterogeneity of the consumers preferences in a given segment. In our simulation, we initially set up homogenous and then heterogeneous consumer preferences in the mainstream and niche segments, respectively.
This functional benefit, together with the network effects, will determine the product’s utility that can be derived by a consumer. If both products have a positive utility value, a consumer will choose a product that offers a higher value of utility. In every time period, consumers make a purchasing decision. Consequently, Firm 1 and Firm 2 will recapitulate the product sold (i.e., number of adopters) at every time period. The number of products sold will subsequently determine the firms’ profit, and profit determines the sustainability of the product and process innovation for the next time periods, and so on.
Parameters indicating the strength of the functional benefit and network effects are stored in the object market. We adjusted the value of these parameters to investigate the influence of the weak and strong network effects on the performance of the firms in the mainstream and niche segments, respectively. We set up the parameter value for functional benefit q at 2.0, and set up the parameter value of network effects n was 0.75 for weak network effects and 4.0 for the strong network effects, respectively. This extreme setup in the parameter values of the network effects were conducted to obtain the differences in the weak and strong network effects, since fine and step-by-step adjustments in the parameter values of network effects resulted in relatively identical results.
4. Results
4.1. Homogenous Consumer Preferences
Homogeneous preferences were defined as all consumers in a given segment having the same preferences (e.g., all consumers in the mainstream segment put more weight on functional characteristic 1, whereas all consumers in the niche segment on functional characteristic 2). From an aggregate (market) perspective, however, we can say that the consumers’ preferences are heterogeneous. The setup of the simulation was to capture the idea of Christensen [21] by addressing a niche segment whose preferences were different to the mainstream segment. This similar approach was also used by Malerba [19] in investigating the role of experimental users and users with different preferences on innovation.
In this case, consumers in the mainstream segment put more weight on characteristic 1 than characteristic 2 (a = 2.0, b = 1.0), while consumers in niche segments did the opposite (a = 1.0, b = 2.0).
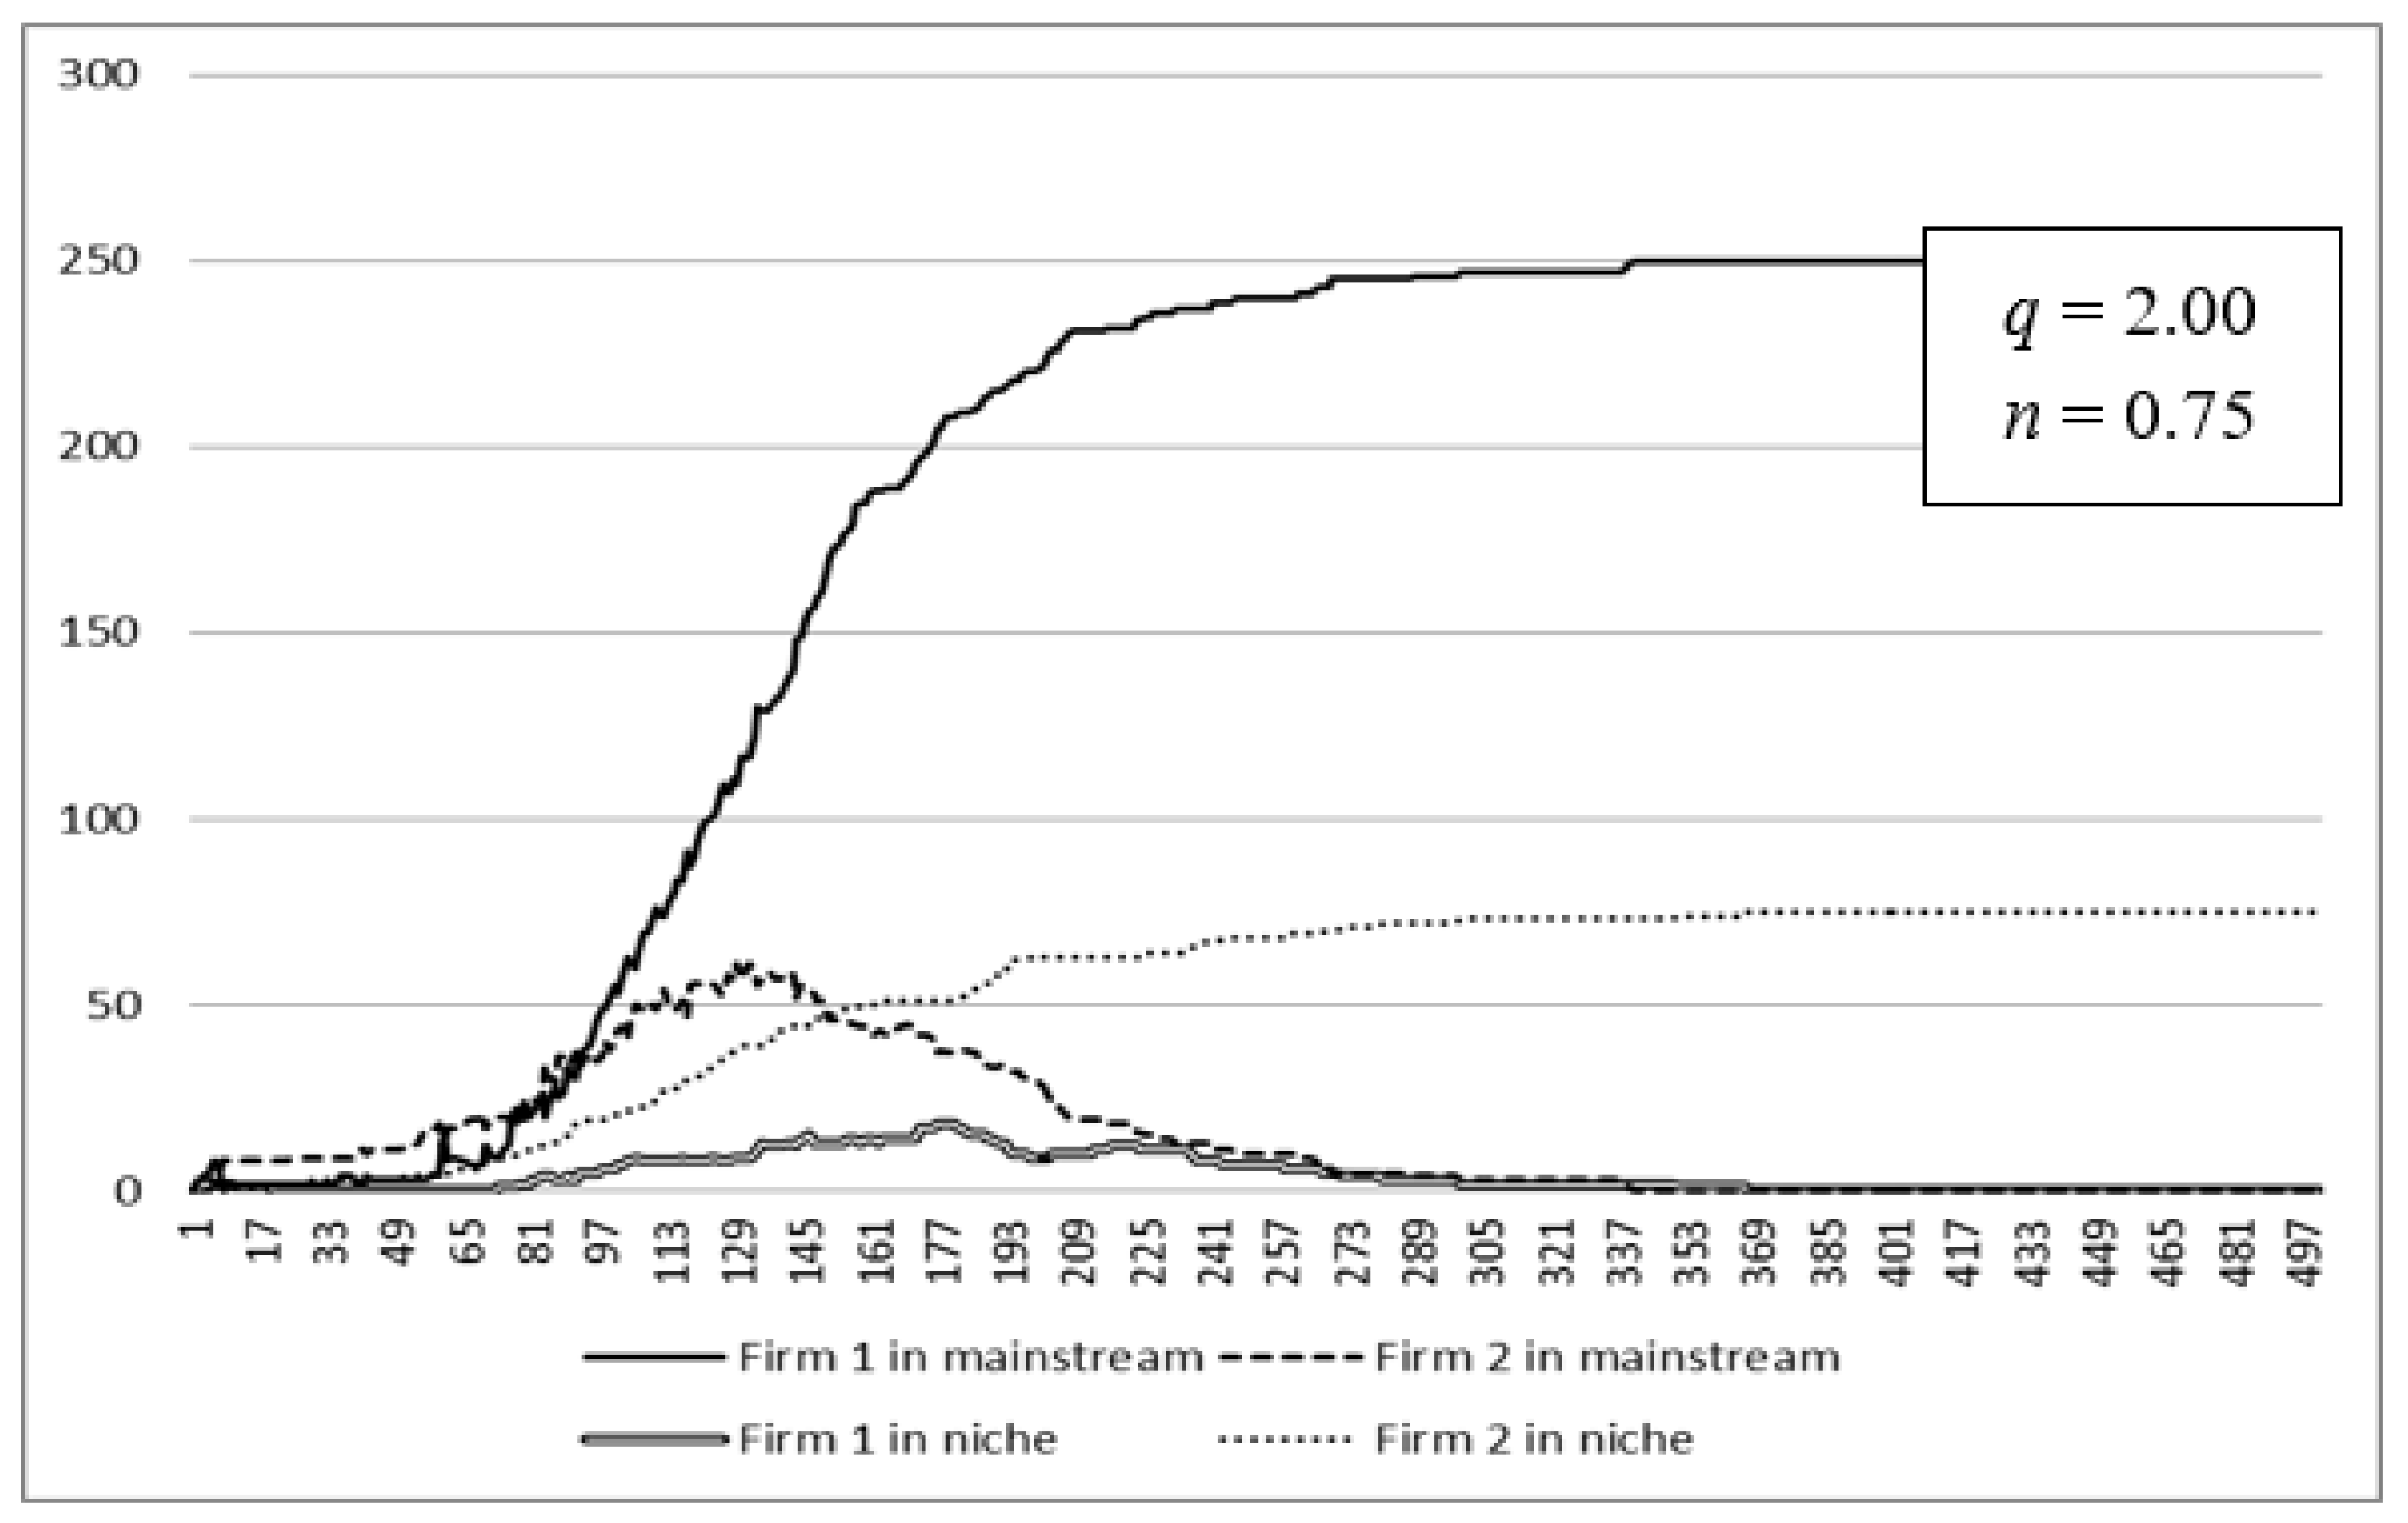
4.1.1. Weak Network Effect
In weak network effects situation (n = 0.75), the result is as expected, as shown in Figure 2 below. The parameter of benefit from the product characteristics (q) was maintained at the value of 2.0 across all simulations.

Figure 2.
Competitive isolation, Firm 1 operates in mainstream and Firm 2 operates in niche segments when the network effects are weak and the preference in each segment is homogeneous.
Firm 1 operates and dominates in the mainstream segment and Firm 2 in the niche segment. In this weak network effect situation, the consumer preferences in each segment matter, and therefore determine the competitive outcome (i.e., competitive isolation). The consumers’ minimum requirement of functional characteristics 1 and 2, which are normally distributed, determine the shape of the S-adoption curve either in the mainstream or niche segments.
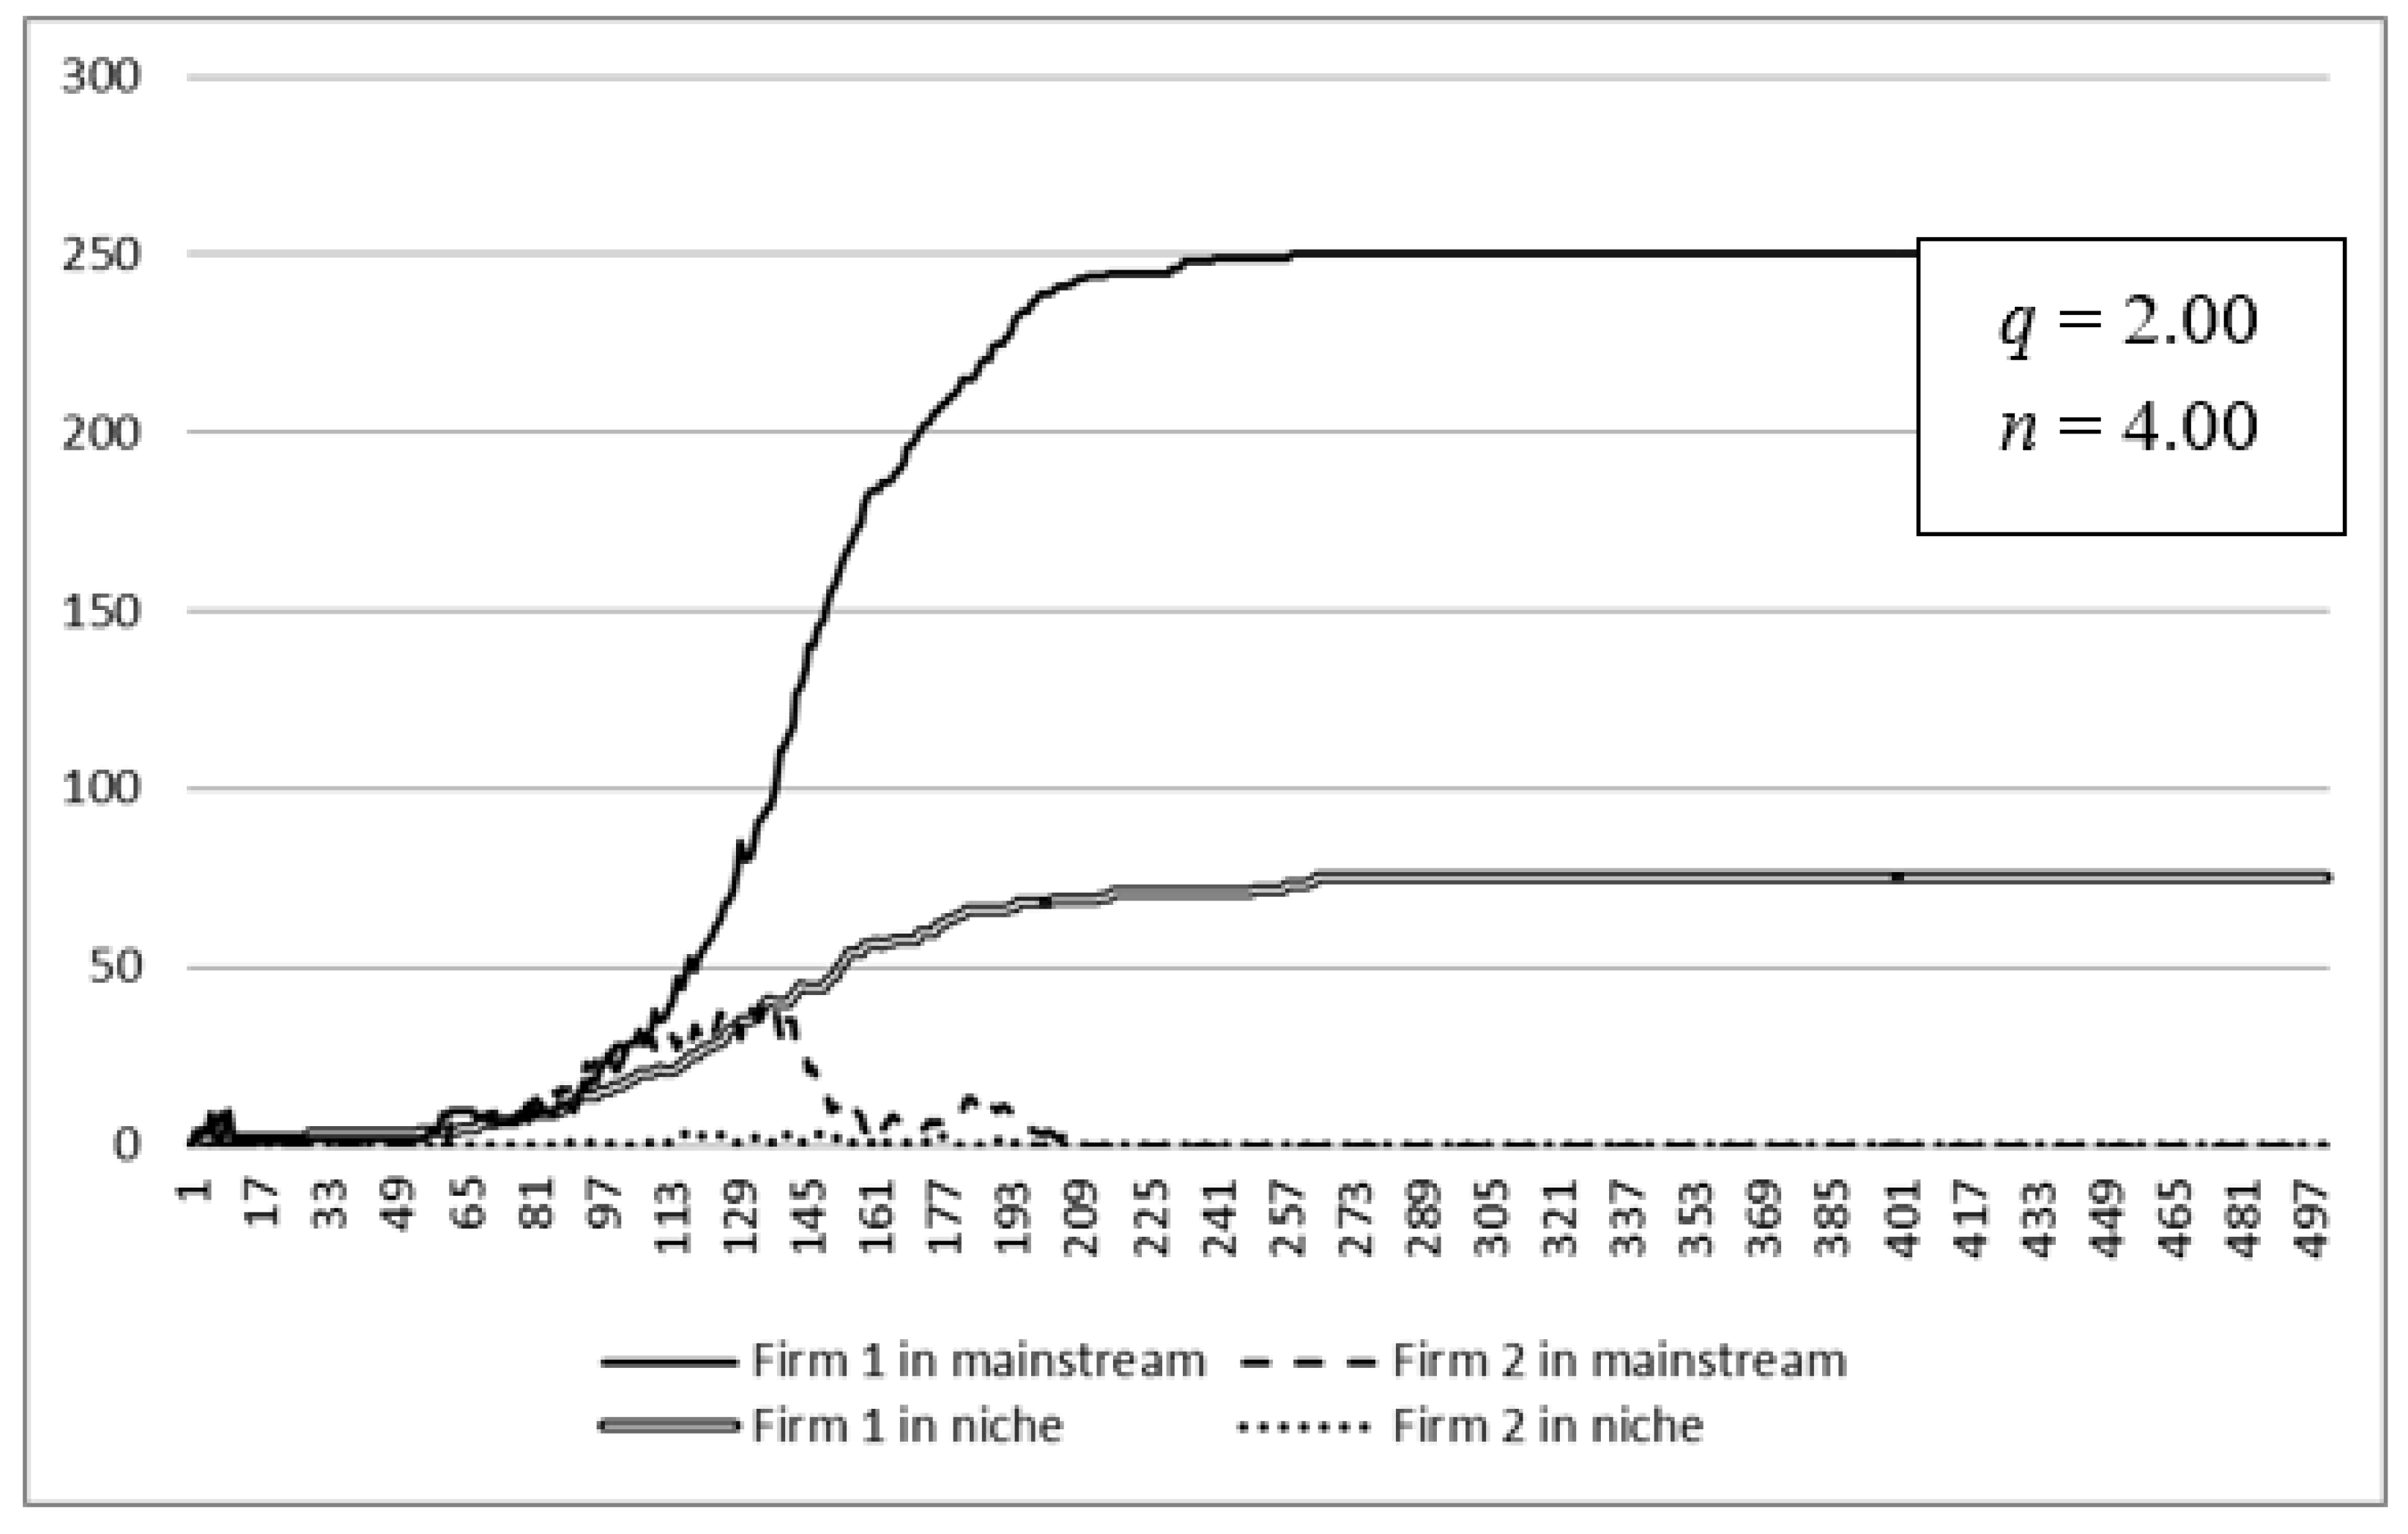
4.1.2. Strong Network Effect
Firm 1 dominates the mainstream as well as the niche segment in the situation where the network effects are strong (n = 4.0). Even if all consumers in the niche segment put more weight on functional characteristic 2 than functional characteristic 1, whereas all consumers in mainstream segment did the opposite, eventually, all consumers in the mainstream and niche segments adopted the product technology of Firm 1 due to the strong network effects, as shown in Figure 3.

Figure 3.
Firm 1 dominates in the mainstream and niche segments when the network effect is strong (the consumers’ preferences in each segment are homogeneous).
4.2. Heterogeneous Consumer Preferences
4.2.1. Weak Network Effect
In a previous scenario of homogenous preferences, all consumers in the mainstream segment put more weight on functional characteristic 1 than on functional characteristic 2; and vice versa for all consumers in the niche segment.
The heterogeneity of preferences in the mainstream segment was introduced by modifying the proportion of consumers who had different preferences. Initially, all consumers in the mainstream segment put more weight on functional characteristic 1 than functional characteristic 2. Then, 50 (out of 250) consumers were set up to put more weight on functional characteristic 2 than 1 by setting up a = 1.0 and b = 2.0. The focus was the adoption of product technology from Firm 2 in the mainstream segment. In the niche segment, the homogeneity of consumer preference toward functional characteristic 2 was maintained. The parameter of functional benefit q was set at 2.0 and the parameter of the network effects n was 0.75. The results are as follows.
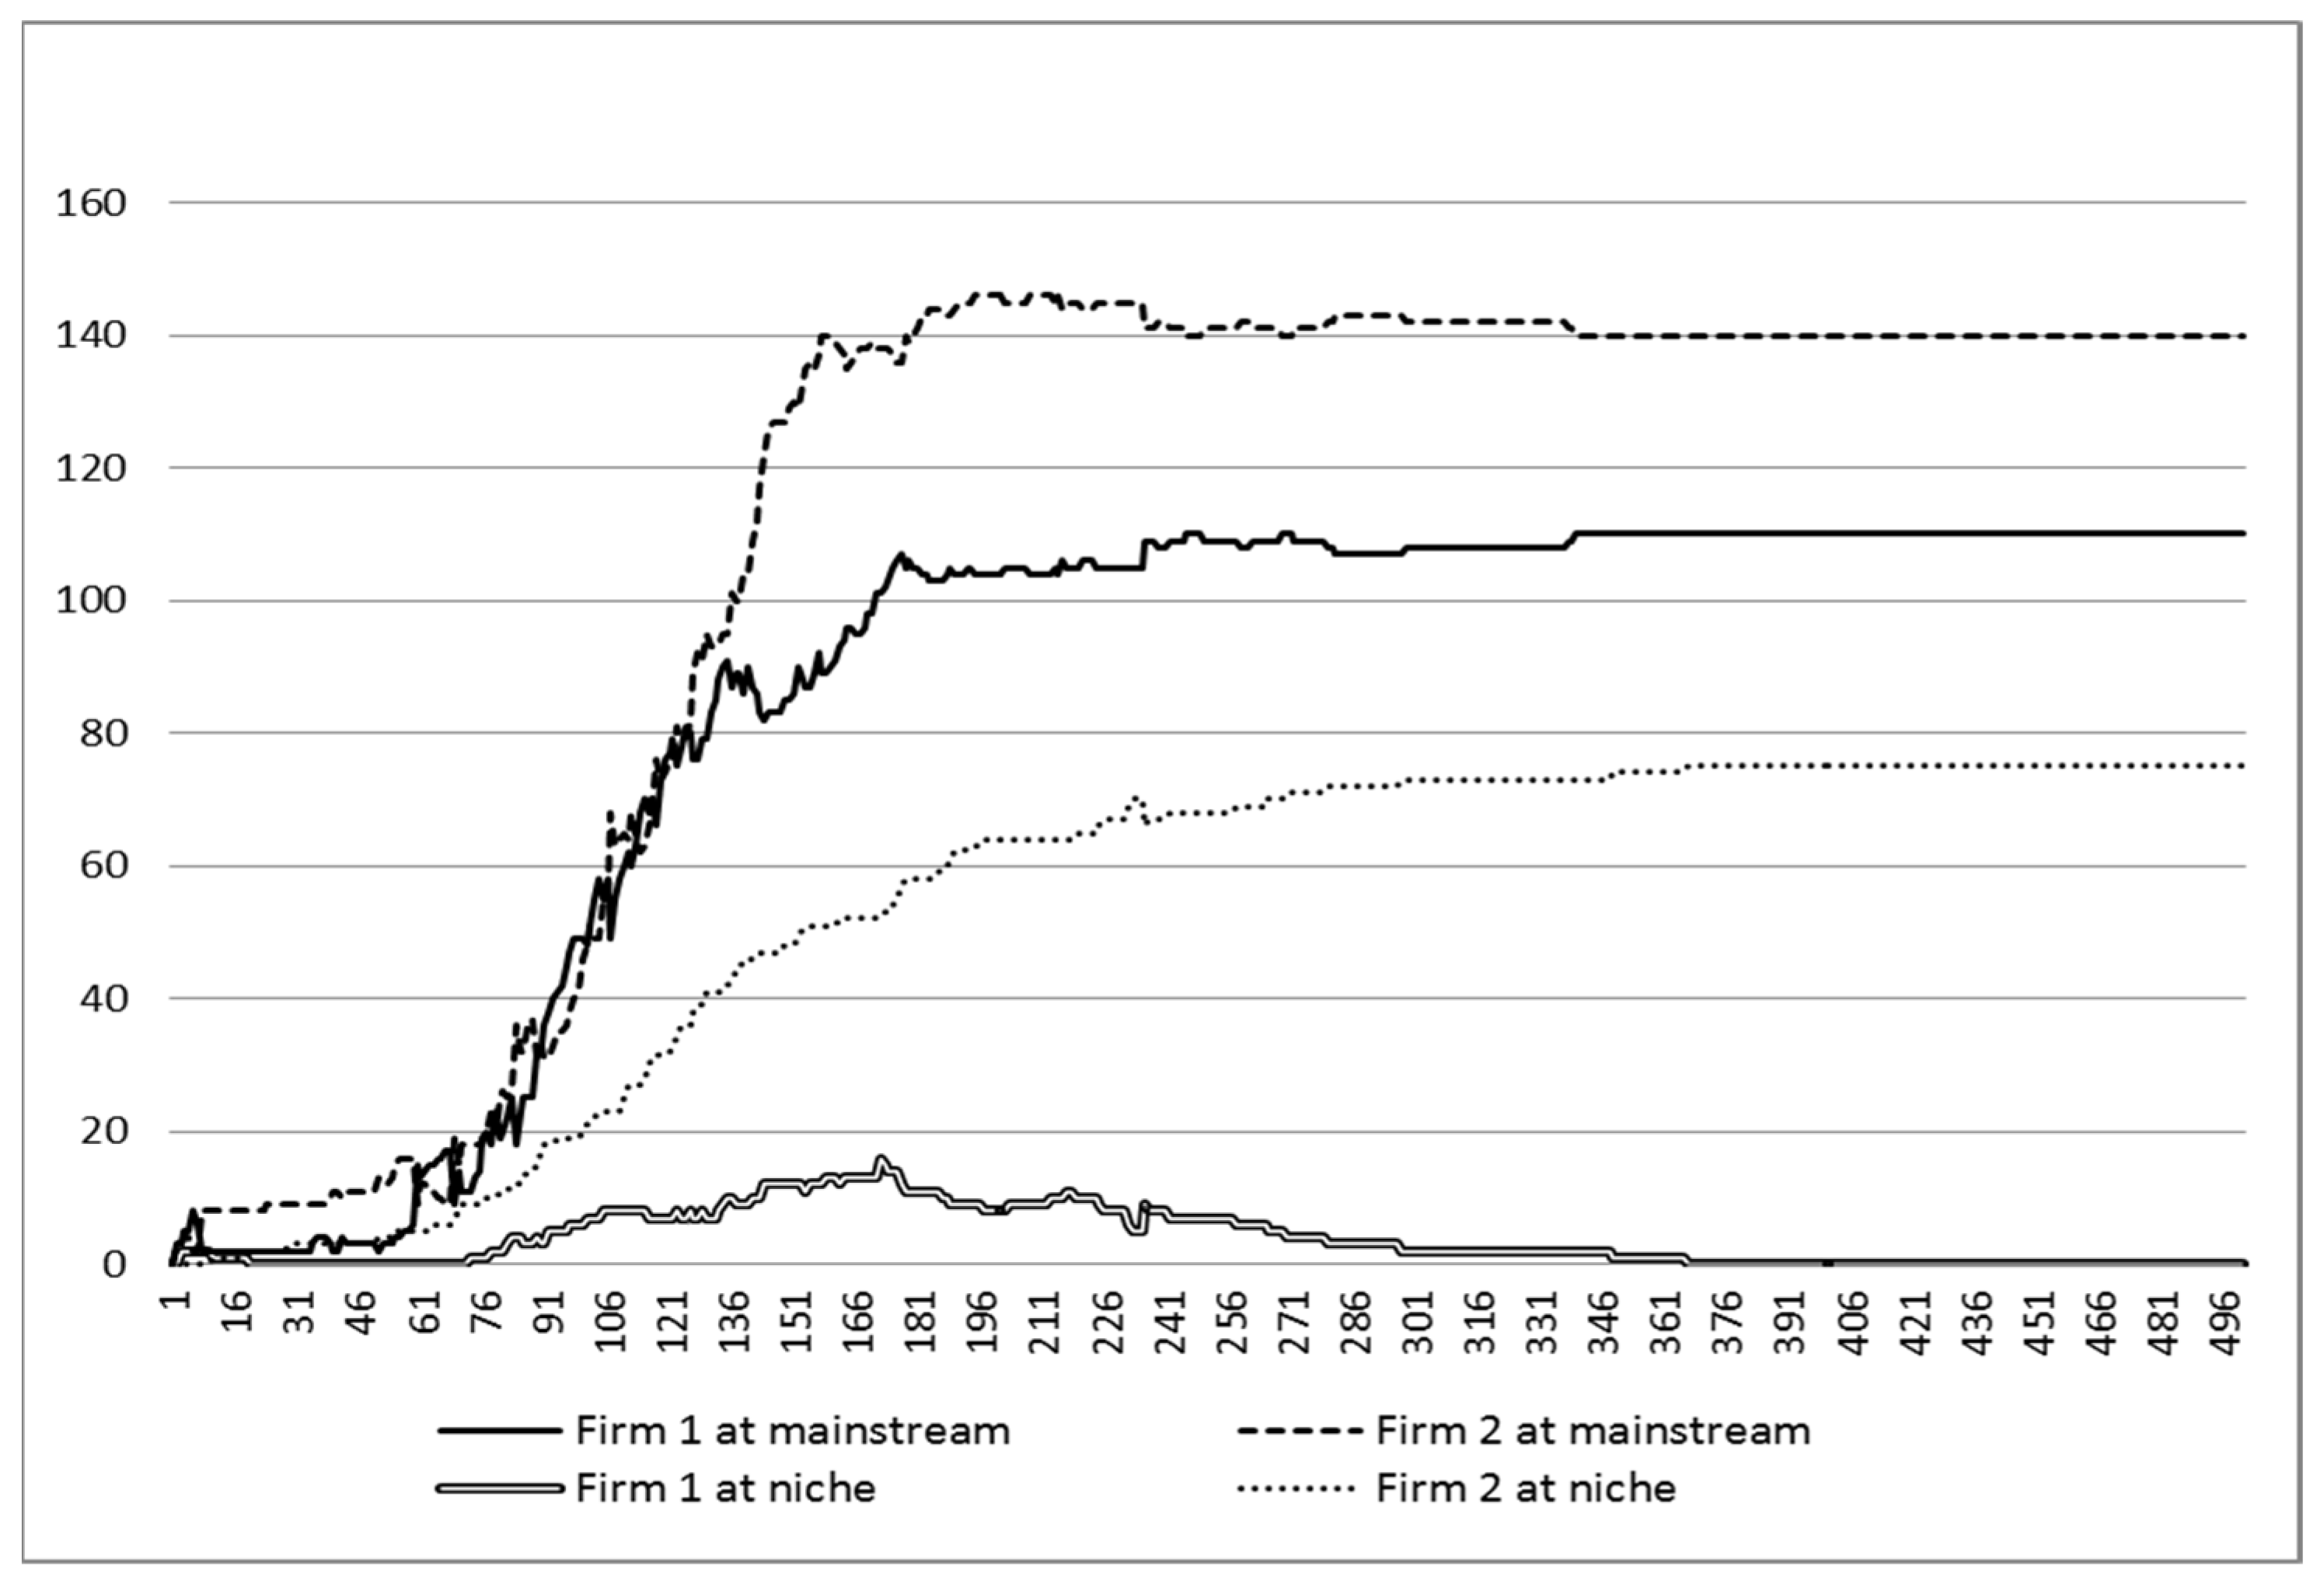
The results in Figure 4 show that some consumers in the mainstream segment adopted product technology from Firm 2. Firms 1 and 2 both co-existed in the mainstream segment (i.e., competitive convergence), while Firm 2 kept operating in the niche segment.

Figure 4.
Competitive convergence, Firm 1 and Firm 2 both operate in the mainstream segment while Firm 2 operates in the niche segment (the network effect is weak and the preference in the mainstream segment is heterogeneous).
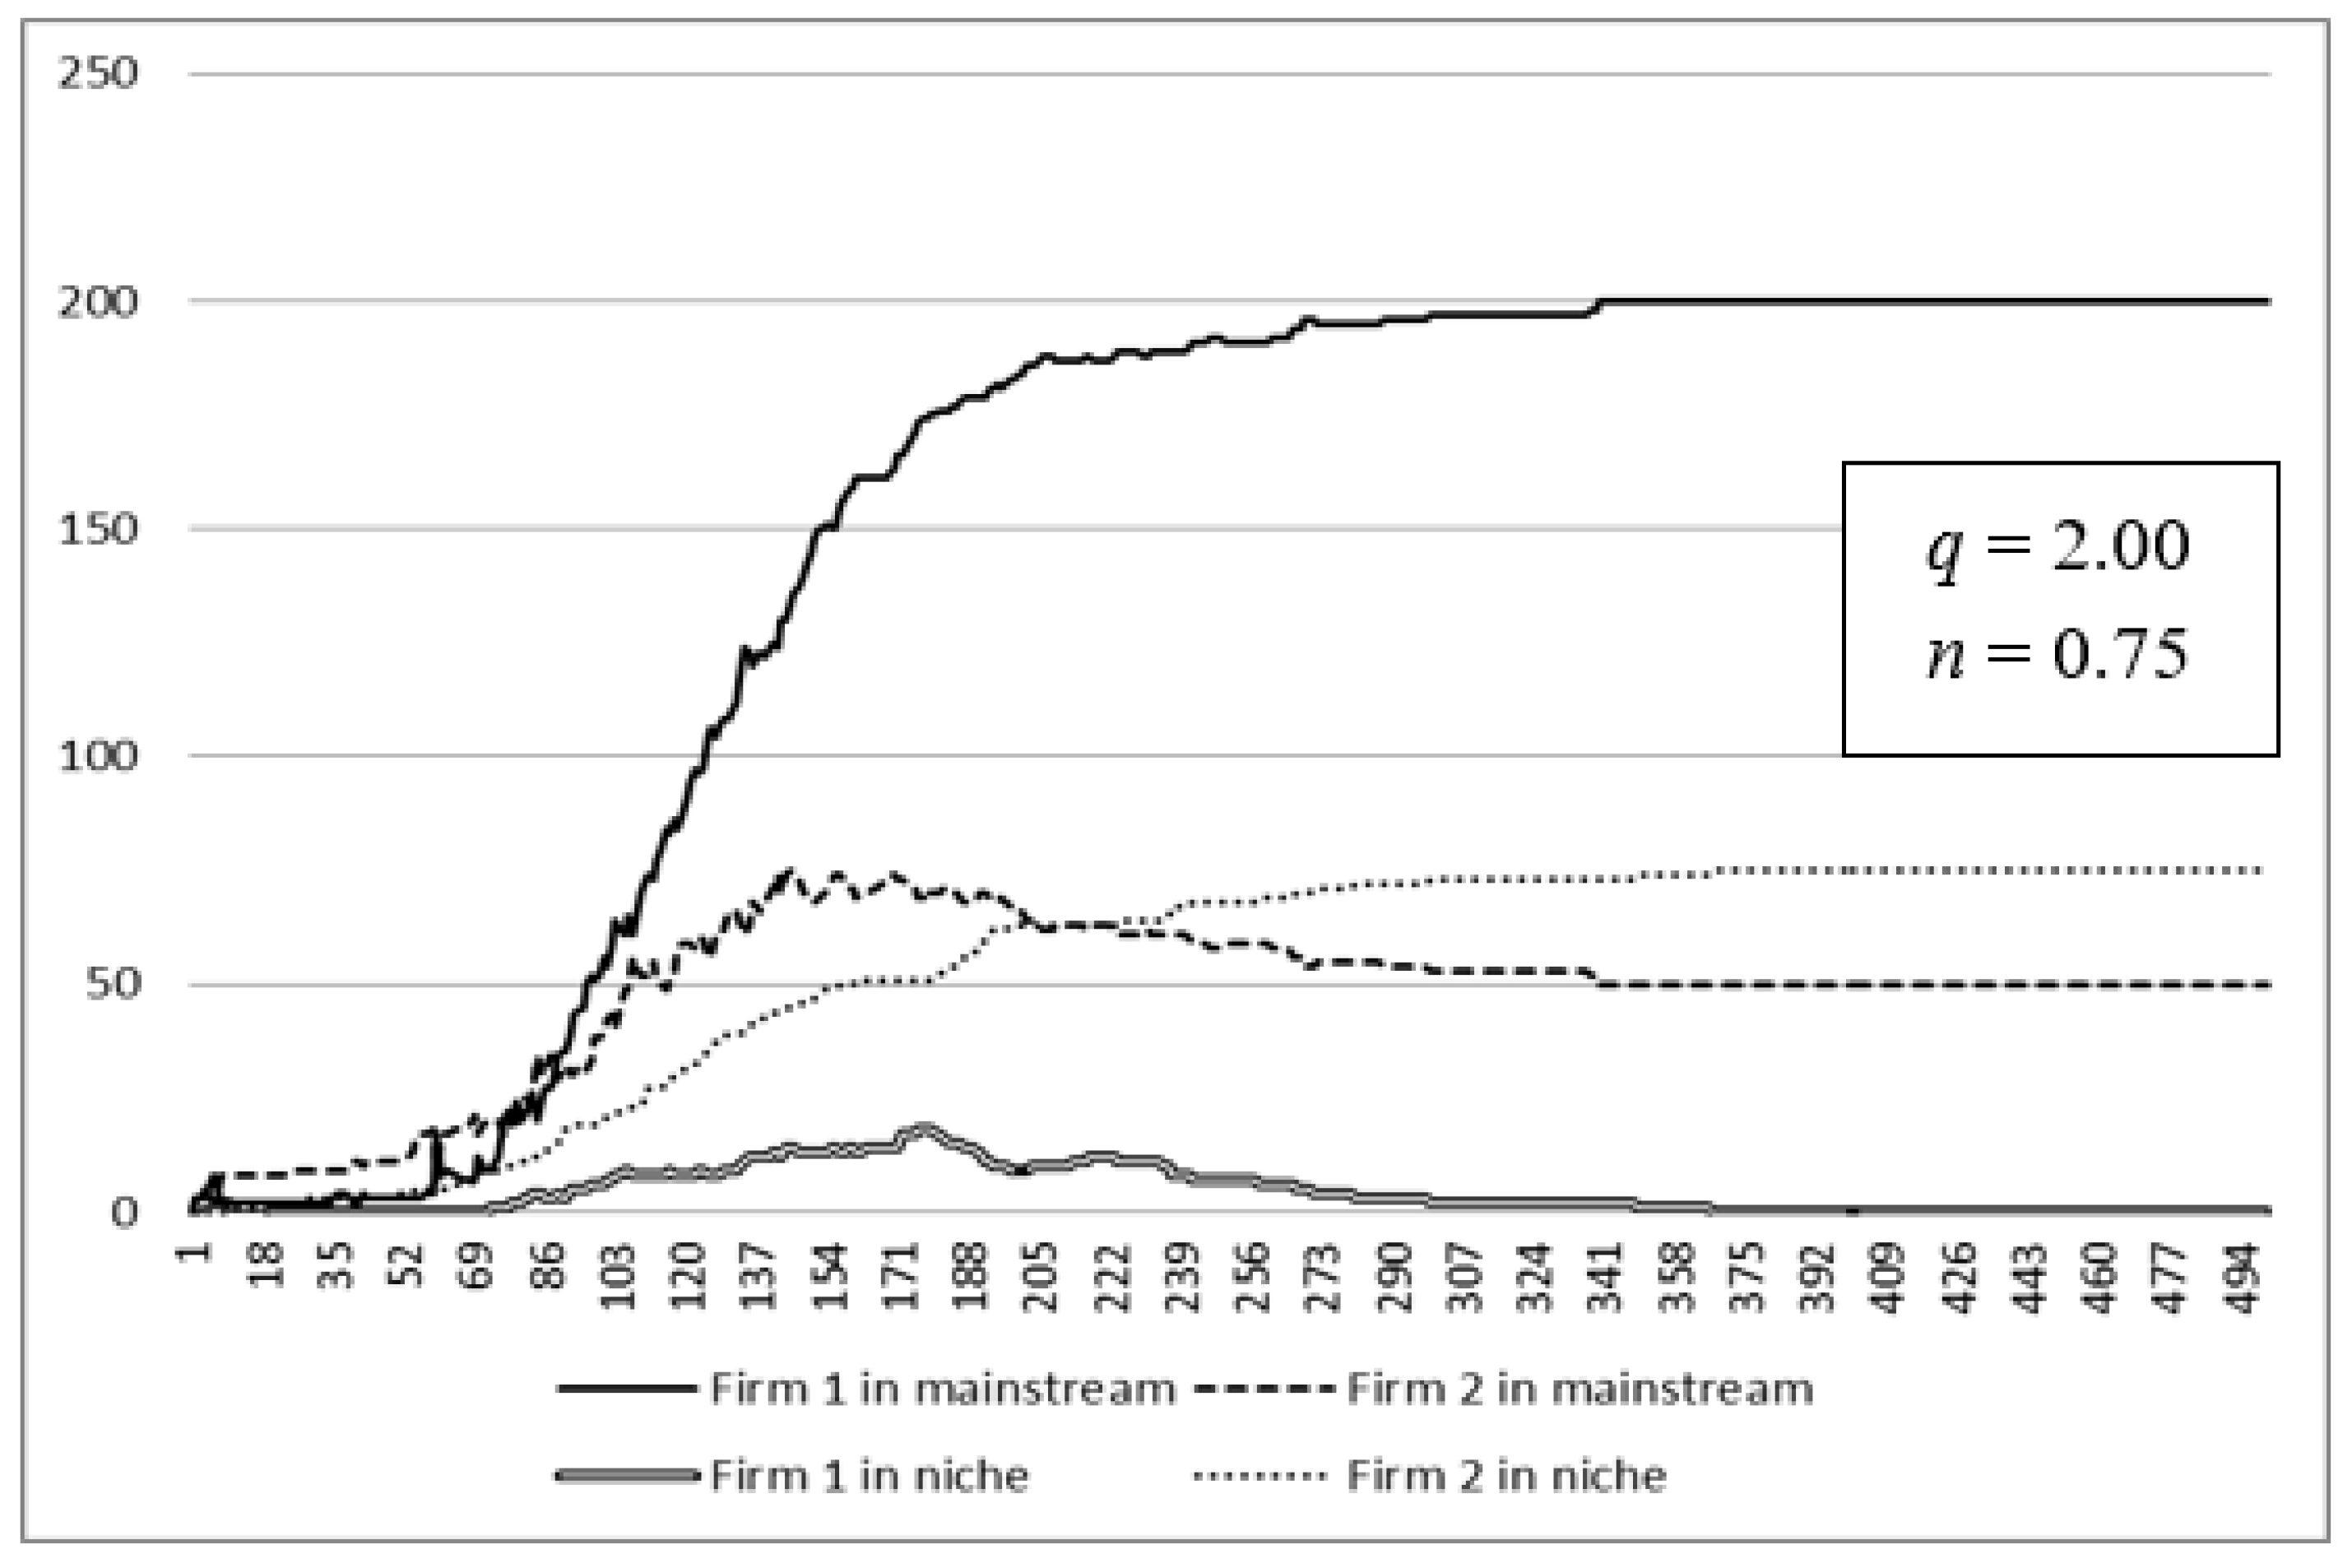
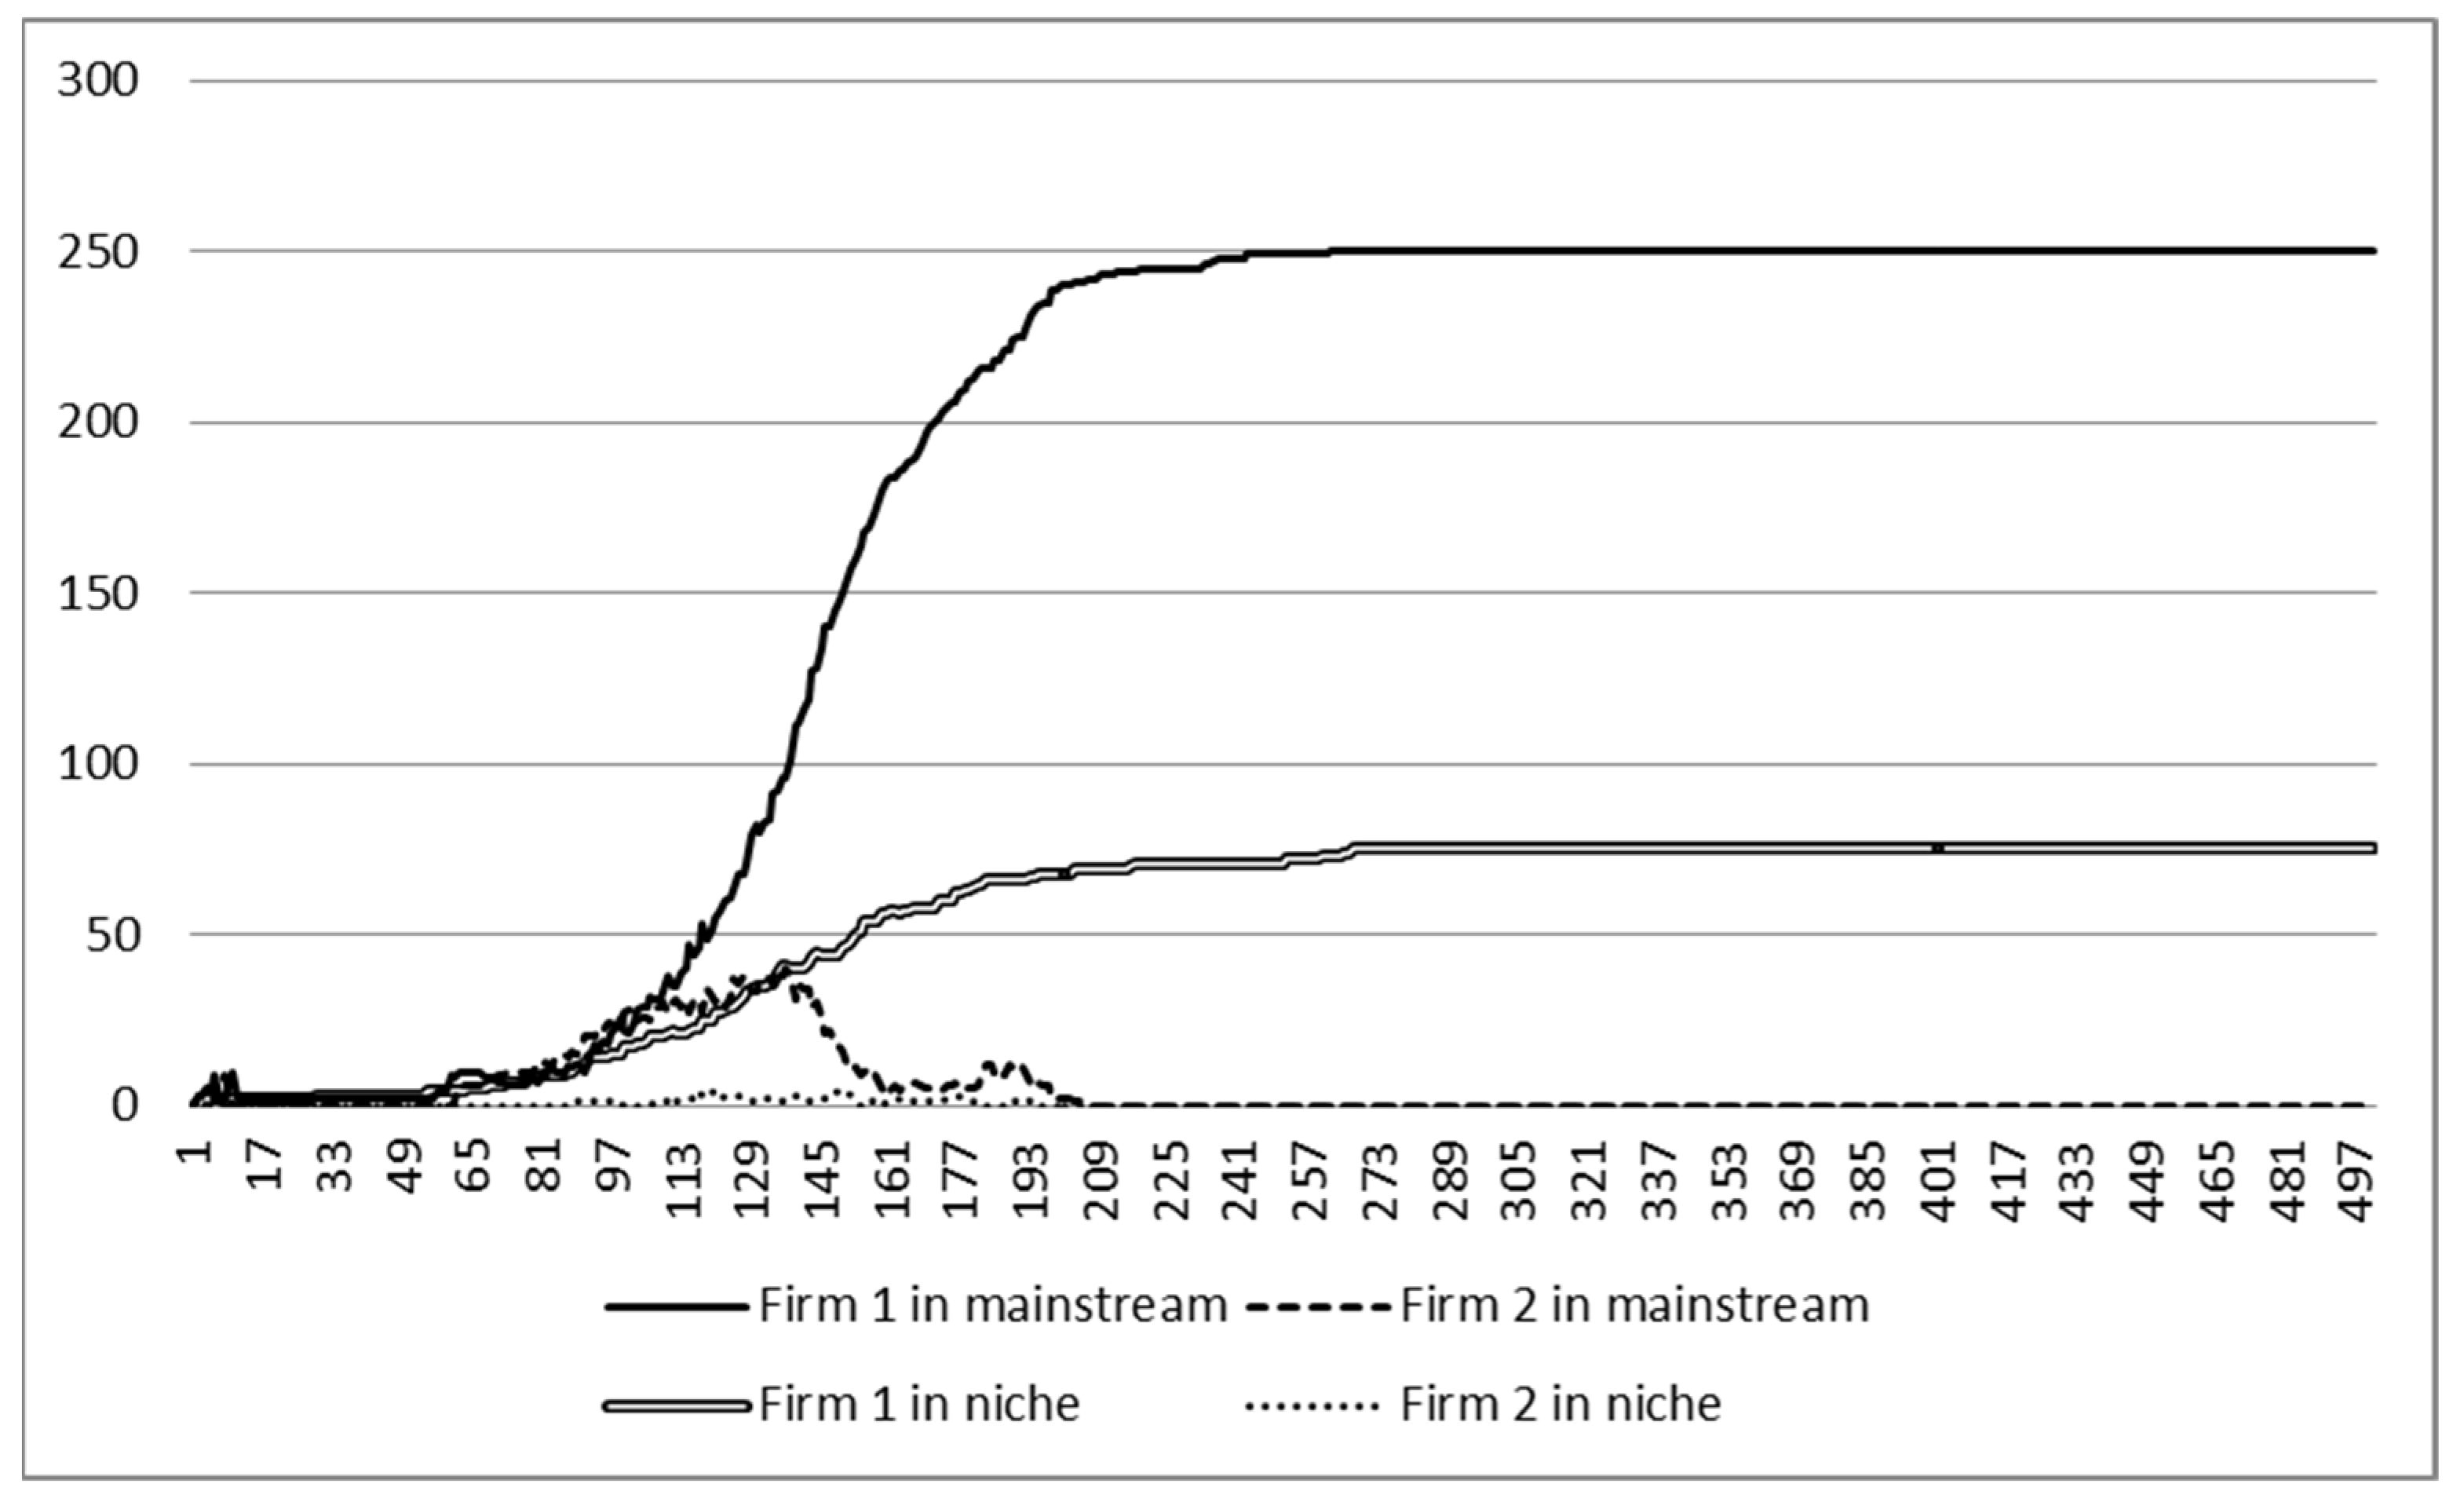
The proportion of consumers in the mainstream segment whose different preferences were adjusted to be larger, where 140 consumers were set to put more weight on functional characteristic 2 than functional characteristic 1 by setting parameter a = 1.0 and b = 2.0, as previously conducted. There was no adjustment for the consumers in the niche segment, neither the parameters of functional benefit q nor the network effects n. The results are shown in Figure 5.

Figure 5.
Competitive disruption, Firm 2 overtakes Firm 1 in the mainstream segment, the network effects is weak, and the preference in each segment is heterogeneous.
Now, in the mainstream segment, more consumers adopt product technology from Firm 2, while Firm 2 maintains its operation in the niche segment. This result suggests competitive disruption since the product technology of Firm 2 is adopted more than the product technology of Firm 1.
4.2.2. Strong Network Effect
Similar to the case of homogeneous preferences above, Firm 1 dominated the mainstream as well as the niche segment in the situation where the network effects were strong (n = 4.0). Even if all consumers in the niche segment had a preference toward functional characteristic 2 that was higher than functional characteristic 1, and consumers in the mainstream segment were characterized by heterogeneous preferences, eventually, all consumers in the niche segment adopted the product of Firm 1 due to the strong network effects, as shown in Figure 6.

Figure 6.
Firm 1 dominates in the mainstream and niche segments when the network effect is strong (the consumers’ preferences in the mainstream segment are heterogeneous).
A multi-segment market with homogeneous preferences in a weak network effects situation allowed for a competitive isolation outcome. A multi-segment market, in this study, was meant to be a market consisting of the mainstream and niche segments. A multi-segment market with homogeneous preferences is when the consumers in the mainstream segment have uniform preference toward certain product technology characteristics, whereas consumers in the niche segment also have aa uniform preference albeit toward different characteristics.
The simulation results showed that only when the network effect is weak may competitive isolation occur. Competitive isolation suggests that consumers in the mainstream market adopt product technology with a certain characteristic whereas consumers in the niche market adopt product technology with the other characteristic. From the supply-side perspective, Firm 1 operates in the mainstream segment while Firm 2 works in the niche segment in isolation. However, in the market with a homogeneous preferences situation and the network effects are strong, monopoly occurs. Firm 1 dominates in the mainstream and niche segments together. This is a situation similar to Arthur’s model where the winner takes all.
A market with a heterogeneous preference situation and weak network effects allows for competitive convergence and competitive disruption to occur. The heterogeneous preferences situation refers to the situation where consumers in the mainstream segment have different preferences (i.e., part of them have a preference toward characteristic 1 and part of them have a preference toward characteristic 2). Competitive convergence occurs when Firm 1 and Firm 2 both co-exist and operate in the mainstream segment. This result confirms the notion of the role diverse preferences that allows new firms with new technology to survive, as argued by Malerba [18].
At some point, when the consumers in the mainstream segment whose preferences for functional characteristic 2 are larger than 1, competitive disruption might occur in the market with heterogeneous preferences and a weak network effects situation. For the simulation purpose, the proportion of consumers in the mainstream segment whose different preferences was set up exogenously; the sources and mechanisms of changing the consumers’ preferences were not addressed since they were out of the scope of this study. In the literature, the changing preferences of consumers can be derived from psychological research, although recently, economists have discussed the relevance of the preference change into economic research [22,23]. The situation of strong network effects, however, leads again to a monopoly, regardless of the heterogeneity of the consumers’ preferences.
5. Discussion
5.1. Lock-in and Heterogeneity of the Consumers’ Network Effects: A Discussion
In the discussion, we would like to touch on the issue of lock-in since it is one of the competitive outcomes in our simulation. When strong network effects yield an identical result of a winner-takes-all situation and consumers are locked into one technology, the question is how to prevent such lock-in or, which situations can avoid lock-in from occurring? Heterogeneity in the consumers’ preferences does not seem to be to overcome the strong network effects. However, real life examples have shown us that despite the presence of network effects, competing technologies can operate simultaneously in the same market (multiple equilibria).
In a typical economic model, Shurmer [24] pointed out that network effects are assumed to be uniform across all consumers. In his empirical study of software program applications, he further argued that network effects vary among consumers since the network effects are derived from different sources. Albeit popular examples such as the domination of the QWERTY keyboard or alternating current on the technology of the electric light and power system in U.S. and Europe [15,25], he described his casual observations of competing product technologies with network effects that co-exist in the market such as WordPerfect and WordStar, which dominated the word-processing market in the UK in the early 1980s. He showed that the network effects of any software packages were derived from several sources including add-ons, books, training courses, and so forth. He also found that the relative importance of each source varied across different types of users. Therefore, he introduced the notion of the heterogeneity of network effects across individual consumers.
In our study, strong network effects were represented by parameter n, which had a value of 4.0 (while the functional benefit parameter q derived from the product features had a value of 2.0) across all consumers in the mainstream as well as in the niche segment. The variety of the network effects among consumers means that every consumer has their own strength of network effects according to the strength of every component of the network effect, as explained above. Applying this to our simulation, we may set the network effects of every consumer in the mainstream and niche segments as random values that are uniformly distributed between 0 and 4; hence the average network effects for all of the consumers’ value will be 2.0, which means relatively low or weak network effects. Weak network effects allow for competing technologies to co-exist in the market, or in other words, avoid lock-in. Cantner and Vanuccini [16] addressed the notion of escaping lock-in by the presence of the users’ heterogeneity. With our result, we might be able to refine the notion of the users’ heterogeneity to not only be heterogeneous in the users’ preferences but also heterogeneous in the network effects across the users or consumers.
Following on from the line of thought above, heterogeneity in the network effects across consumers allows for weak total network effects, and subsequently allows for multiple equilibria to occur. Strong network effects might suggest that the heterogeneity of network effects across consumers is not present. To investigate why and how this is the case might be good for future research directions.
Previous empirical studies have provided actual examples of how strong network effects prevent disruption. Keller and Hüsig [19] analyzed how Google’s web-based office applications had a small likelihood of disrupting the established Microsoft’s desktop office applications due to strong network effects. Vaishnav [6] observed that while some technologies in the information and communications sector (e.g., P2P service providers) caused major industry changes and showed a promising prospect of disruption, other technologies (e.g., open source software and Wi-Fi mesh network) showed no sign of causing industry disruption.
5.2. Limitations
In this study, it is the total number of users in the population or global network that influences any individual’s utility derived from a product, and subsequently influences their adoption decision. The underlying assumption is that any individual consumer is connected to every other individual in the population. This is, of course, a strong assumption, since we observed that in reality, the decision of any individual might be influenced only by the local network (e.g., family, friends, or working colleagues). This limitation could pave the way for future research endeavors. In the next step, the assumption will be relaxed and further steps will be taken by considering the local network in the adoption decision of consumers. In so doing, the incorporation of social network analysis and the utilization of the complex network structure such as a small-world network will be conducted. It will be interesting to see how the network structure influences the competitive outcome and likelihood of disruption.
Second, an assumption of perfect knowledge by consumers in evaluating the product characteristics was employed. Again, this must be a strong assumption because more often than not, consumers do not have perfect knowledge of the product characteristics. The reasons for the consumers’ knowledge imperfection could be because consumers have limited access to information or they have the lack of time to conduct proper research, or they are just being lazy because they think it is not worth the effort [26]. Addressing the consumers’ imperfection of evaluating the product characteristics in the realm of the bounded-rationality concept would be an exciting future research direction.
Third, empirical validation is lacking in this study. Case studies where disruptive technologies work in different degrees of network effects situation, along with the corresponding competitive outcomes, might be preferable to provide empirical support.
6. Conclusions and Recommendations
The first hypothesis was addressed by incorporating technology development, the firms’ allocation and actions, the consumers’ decision, and the structure of demand in the model. The hypothesis was also addressed by running a simulation that performed the interaction between the firms and consumers in the market segments and interplays between the market segment preferences and different degrees of network effects.
The second hypothesis was tested and by the simulation results, it was argued that a weak or low degree of network effects allows for different competitive regimes to occur (i.e., competitive isolation, convergence, or disruption). Heterogeneity in the consumers’ preferences matter and influence the competitive outcomes. Competitive isolation, where two product technologies operate in their own segment, results when consumers in a segment possess homogeneous preferences toward one product technology. Competitive convergence, where one product technology operates not only in its own segment but also in the other segment, creating a situation where two product technologies co-exist in a segment, results from the heterogeneity of the consumers’ preferences. Competitive disruption occurs when product technology from the niche segment manages to become adopted more in the mainstream segment, and results when the proportion of the consumers’ preferences toward ‘new’ product technology becomes larger in the mainstream segment. Strong network effects, on the other hand, will always lead to a winner-takes-all and eventual lock-in situation.
New entrants or startups might start from a niche, targeting a specific type of consumer segment. Since the weak network effects allow for competitive convergence, where two or more players can operate in the mainstream segment, startups with new technology might be able to penetrate the mainstream market through a certain business model and enjoy a portion of the market share. Not only the performance of the new product technology that needs to improve and eventually be at par with the incumbent, but disruption to the mainstream market, however, might be determined by the heterogeneity of the consumers’ preference, that is, allowed by the shift in consumer preference (e.g., preference toward green products).
Incumbents that currently dominate the mainstream market, on the other hand, need to be aware of their existing customers. Lock-in and strong network effects might help to retain their leadership position in the market, however, a shift in customer preference might need to be considered and anticipated early on to defend from disruptive threats.
Funding
This research was funded by German Academic Exchange Service or Deutscher Akademischer Austauschdienst (DAAD) grant number A/12/78063 and the APC was funded by Management of Technology (MoT) Laboratory, School of Business and Management, Bandung Institute of Technology.
Institutional Review Board Statement
Not applicable.
Informed Consent Statement
Not applicable.
Data Availability Statement
The data presented in this study are available on request from the corresponding author.
Conflicts of Interest
The authors declare no conflict of interest.
References
- Dosi, G. Technological paradigms and technological trajectories: A suggested interpretation of the determinants and directions of technical change. Res. Policy 1982, 11, 147–162. [Google Scholar] [CrossRef]
- Foster, R. Innovation, the Attacker’s Advantage; Simon and Schuster: New York, NY, USA, 1986. [Google Scholar]
- Adner, R. When are technologies disruptive? A demand-based view of the emergence of competition. Strateg. Manag. J. 2002, 23, 667–688. [Google Scholar] [CrossRef]
- Buchta, C.; Meyer, D.; Pfister, A.; Mild, A.; Taudes, A. Technological efficiency and organizational inertia: A model of the emergence of disruption. Comput. Math. Organ. Theory 2004, 9, 127–146. [Google Scholar] [CrossRef]
- Adner, R.; Zemsky, P. Disruptive technology and the emergence of competition. RAND J. Econ. 2005, 36, 229–254. [Google Scholar] [CrossRef]
- Vaishnav, C. Does technology disruption always mean industry disruption? In Proceedings of the 26th International Conference of the System Dynamics Society 2008, Athens, Greece, 20–24 July 2008. [Google Scholar]
- Mount, P.M. The Mechanism That Drive Disruptive Innovation. Ph.D. Thesis, University of York, York, UK, 2008. [Google Scholar]
- Yu, D.; Hang, C.C. A reflective review of disruptive innovation theory. Int. J. Manag. Rev. 2010, 12, 435–452. [Google Scholar] [CrossRef]
- Hüsig, S.; Hipp, C.; Dowling, M. Analyzing the disruptive potential: The case of wireless local area network and mobile communications network companies. R&D Manag. 2005, 35, 17–35. [Google Scholar]
- Christensen, C.M. The Innovator’s Dilemma: When New Technologies Cause Great Firms to Fail; Harvard Business School Press: Boston, MA, USA, 1997. [Google Scholar]
- Christensen, C.; Raynor, M.E. The Innovator’s Solution, Creating and Sustaining Successful Growth; Harvard Business School: Boston, MA, USA, 2003. [Google Scholar]
- Christensen, C.M.; Raynor, M.; Mcdonald, R. What Is Disruptive Innovation? Harvard Business Review: Brighton, MA, USA, 2015; Volume 93, pp. 44–53. [Google Scholar]
- Schneider, H. Creative Destruction and the Sharing Economy: Uber as Disruptive Innovation; Edwar Elgar Publishing: Chentelham, UK, 2017. [Google Scholar]
- Schumpeter, J.A. Capitalism, Socialism, and Democracy; Harper: New York, NY, USA, 1942. [Google Scholar]
- Arthur, W.B. Competing technologies, increasing returns and lock-in by historical events. Econ. J. 1989, 99, 116–131. [Google Scholar] [CrossRef]
- Cantner, U.; Vanuccini, S. Innovation and Lock-in. Jena Economic Research Paper. 2016, pp. 156–181. Available online: https://econpapers.repec.org/paper/jrpjrpwrp/2016-018.htm (accessed on 8 July 2022).
- Yu, W.; Dai, S.; Liu, F.; Yang, Y. Matching disruptive innovation paths with entrepreneurial networks: A new perspective on startups’ growth with Chinese evidence. Asian. Bus. Mgmt. 2022, 1–25. [Google Scholar] [CrossRef]
- Malerba, F.; Nelson, R.; Orsenigo, L.; Winter, S. Demand, innovation, and the dynamics of market structure: The role of experimental users and diverse preferences. J. Evol. Econ. 2007, 17, 371–399. [Google Scholar] [CrossRef]
- Keller, A.; Hüsig, S. Ex ante identification of disruptive innovations in the software industry applied to web applications: The case of Microsoft’s vs. Google’s office applications. Technol. Forecast. Soc. Change 2009, 76, 1044–1054. [Google Scholar] [CrossRef]
- Valente, M. Laboratory for Simulation Development—LSD.; Working Paper Series; Laboratory of Economics and Management, Sant’Anna School of Advanced Studies: Pisa, Italy, 2008. [Google Scholar]
- Bowles, S. Endogenous preferences: The cultural consequences of markets and other economics institutions. J. Econ. Lit. 1998, 36, 75–111. [Google Scholar]
- Janssen, M.A.; Jager, W. Fashion, habits and changing preferences: Simulation of psychological factors affecting market dynamics. J. Econ. Psychol. 2001, 22, 745–772. [Google Scholar] [CrossRef] [Green Version]
- Witt, U. Lock-in vs. critical masses—Industrial change under network externalities. Int. J. Ind. Organ. 1997, 15, 753–773. [Google Scholar] [CrossRef]
- Shurmer, M. An investigation into sources of network externalities in the packaged PC software market. Inf. Econ. Policy 1993, 5, 231–251. [Google Scholar] [CrossRef]
- David, P.A.; Bunn, J.A. The economics of gateway technologies and network evolution: Lessons from electrical supply history. Inf. Econ. Policy 1988, 3, 165–202. [Google Scholar] [CrossRef]
- Valente, M. Evolutionary demand: A model for boundedly rational consumers. J. Evol. Econ. 2012, 22, 1029–1080. [Google Scholar] [CrossRef]
Publisher’s Note: MDPI stays neutral with regard to jurisdictional claims in published maps and institutional affiliations. |
© 2022 by the author. Licensee MDPI, Basel, Switzerland. This article is an open access article distributed under the terms and conditions of the Creative Commons Attribution (CC BY) license (https://creativecommons.org/licenses/by/4.0/).