Abstract
This is an analytical, descriptive, and cross-sectional case study to identify a pharmaceutical company’s organizational life cycle (OLC) situation using clustering methods. Data came from Iran’s pharmaceutical firms in 2001–2018. We used sales growth, dividend per ratio, and performance indicators, including the return on assets, return on equity, Qtubin, and net profit of 342 firm-years to identify the OLC situation of pharmaceutical companies. We used principal component analysis and cluster analysis to define the company’s OLC situation. Results show that 41.39% of the firm-years was in the growth stage, 34.14% in the maturity stage, and 17.22% in the decline stage. There was no significant difference between the average age in the three pharmaceutical companies’ clusters. Study findings may guide policymakers towards more evidence-informed planning, and generic producers by providing more insights about their situation from an organizational life cycle perspective, giving them proper strategies to overcome accompanying challenges in pharmaceutical firms in Iran and countries with similar situations.
1. Introduction
On the basis of the organizational life cycle (OLC), firms, like any living entity, are born, grow, and eventually die [1]. Any firm develops through a predictable trend, specified by progressive stages [2]. One of the most critical OLC theory applications is defining managerial strategies and policies during the life cycle. OLC theory helps managers in changing inappropriate and ineffective strategies on the basis of a company’s current situation. The OLC suggests appropriate strategies to move the OLC to the next stage. There are various approaches to analyzing life cycle stages [3,4,5], and the most common approach uses four stages: introduction, growth, maturity, and decline [1]. There is no agreement about the precise amount of time that firms should spend to reach a particular development stage. However, each stage brings together a unique organizational structure, activities, systems, and leadership [6]. Table 1 shows the essential characteristics of the OLC stages.

Table 1.
Special characteristics of the OLC stages based on the published literature.
Return on investment is equal to or greater than the financing rate.
Although the OLC stages are presented as a series of phases, these stages should not be considered sequential levels over time, because the organizations may have several revival phases throughout their life cycle [8]. However, the hierarchical progression of OLC stages is not easily possible, and requires many company activities and organizing [9]. Overall, thinking about firms and their development is moved away from the linear growth trajectory to a multidimensional firm situation, where crises can appear at different points of organizational development. Growth and survival in a competitive environment bring proportional crises to the firm’s size and complexity that managers should be able to face [10]. Regardless of how the various stages of the organization’s life cycle progress, using the firm life cycle theory can predict which solutions and management practices are the best for the corporation to improve itself and company performance [9]. The problem is that identifying the situation of firms from the organizational life cycle perspective is not easily possible, and requires considering many of the companies’ financial indicators and interpreting financial statements [11]. This study identified the OLC situation of 20 large pharmaceutical companies in Iran on the basis of their most critical financial indicators over 18 years with a comprehensive new approach. Pharmaceutical firms are an important sector of the healthcare system in any country and are directly related to public health [12]. Recognizing the strengths and weaknesses of these firms provides opportunities to challenge this growing industry and pave the way for fundamental changes [13]. The Iranian pharmaceutical market has grown significantly and rapidly compared to those in developing countries [14]; with an average age of 50 years old [15], it is not far-fetched that they are in the final stages of their life cycle. Sharing their success with countries in similar situations may help them in improving their performance.
The paper is organized as follows. Section 2 discusses the literature on organizational life cycle theory and models, and then provides a background about the method that we used in this study. Section 3 details our data and the analytical method. In Section 4, we present the study results. We discuss the findings in Section 5. Lastly, the conclusion and study limitations are reported in Section 6 and Section 7, respectively.
2. Background and Related Studies
The employment of the organizational life cycle goes back to several decades ago, when researchers accepted a biological life for the companies; since then, several models have been developed to identify each OLC stage with specific characteristics [4,7,16]. One of the OLC models with high acceptance among previous studies is the Anthony–Ramesh model [17]. In 1992, Anthony and Ramesh developed a model to examine the relationship between financial performance measures and stock value on the basis of organizational life cycle theory. Their study investigated the stock market’s response to two sales growth variables and investment costs at each stage of the organizational life cycle. The dividend-per-share ratio identifies an organization’s position at each stage of the organizational life cycle; then, researchers determined the factors that affected the corporate market value. They showed that the rate of sales growth and investment costs decreased uniformly from the growth stage to the decline stage [4]. Researchers used this model to identify the OLC stages for companies [1,18]; for example, Havener (2001) expressed that the organizational life cycle comprised three main phases: formative, normative, and degenerative. During that cycle, organizational performance increases through the formative phase, becomes stable in the normative phase, and lastly declines in the degenerative phase [16]. According to Santana et al. (2017), organizational decline is the decrease in firm resources that, if not prevented, leads to the company vanishing. The authors also suggested that recognizing the decline phase is unclear, and requires financial indices such as ROA and ROE [11]. Therefore, companies may use performance measurements to determine the company’s achievable goals. The most well-known measures are profitability and Tobin’s index:
Profitability shows that management, investment, and financing decisions are performed well. Profitability ratios such as return on assets, return on equity, net profit, and dividend payout ratio can measure the effectiveness of a company’s management in sales profits, total assets, and, most importantly, shareholder investment [19].
Tobin’s q index is another indicator that compares the firm’s past performance and the future expectations of the firm’s success using three elements: equity market value, the book value of liabilities, and equity book value.
Using firm life cycle theory can predict which management practices are best for the corporation to improve company performance. For example, in the introduction stage, the firm needs more innovation and dynamic management to encounter more stable competitors. At this stage, significant fixed-asset investment should be avoided until internal resources are increased to support this investment. On the basis of OLC theory, each stage has its specific characteristics that are different from other stages [6].
One of the techniques for seeking groups with similar specifications is the clustering method [20]. Clustering can give researchers more insight into data distribution and outlier detection, and has various applications in many fields such as marketing research, data analysis, biology, and pattern recognition [21]. Some researchers have adopted this approach to categorize companies on the basis of the life cycle stage and their specific characteristics, and to recognize the number of appropriate OLC stages [22]. This section focuses on clustering, namely, the method that we used for this study.
2.1. Clustering Methods
One often employed technique in the management field to identify firms with specific characteristics is the clustering method. This a well-known widely used method; for example, Wang and Lee (2008) used a clustering method to identify four aspects of shipping companies’ financial performance: solvency, profitability, and asset and debt turnover indicators [23]. Momeni and Soofi (2015) used the K-means method (a popular clustering method) to classify three industries’ types (cement, metal and automotive, and parts industries) on the basis of performance ratios [24].
Numerous clustering methods, including cluster analysis, discriminant analysis, factor analysis, principal component analysis, grey relational analysis, and K-means have been used for a long time. Some of these methods, such as cluster analysis and principal component analysis, can be helpful even for large samples or long-term data, and are very applicable in classical statistical subjects [23]. In some OLC studies, such as Hanks et al. (1993), Gupta and Chin (1994), and Matthew W. et al. (2003) [25], and in newer studies such as Li and Chen (2007) [26], and Xu et al. (2009), clustering methods were used to classify companies on the basis of strategic factors [26]. Lester et al. (2003) adopted a clustering method to identify competitive advantages and performance through OLC stages from the managers’ perspectives about their firms’ position. The study, designed on the basis of a questionnaire, helped in making managerial decisions in each OLC stage [7]. In the current study, we used two clustering methods, namely, cluster analysis and principal component analysis, to rank the pharmaceutical companies on the basis of their OLC situation. In the next section, we briefly describe these two techniques.
2.2. Principal Component Analysis (PCA)
This is a mathematical tool designed to demonstrate diversity in a dataset using a small number of factors [27]. Every PC is one linear combination of the primary responses (which retain some correlation between) and orthogonal PCs. PCs repeatedly calculate variety as much as possible from the original dataset, in which PC1 explains data changes more than PC2 can, and PC2 also explains more data diversity than PC3 does. That is why few PCs can explain the change in a large number of replies. The Kaiser criterion explains that eigenvalues above 1 are considered to be significant in PCA, and are used to define a significant number of PCs as a possible method to determine the number of PCs [28]. PCA is a technique helping to reduce data dimensions and complexity; it can use unfolding-cluster structures and extract them from complex data [29]. The previous literature showed that using PCA before CA can improve cluster structures’ quality compared to the original data due to dimensional reduction [30,31].
2.3. Cluster Analysis (CA)
This is a handy classification method used in many fields, including management and marketing for positioning, strategy formulation, market segmentation, and business system planning [26]. This method splits data into sections or clusters of files that have similar patterns of input fields. As they are only interested in inputs and have no output fields, segmentation models do not include any target or outcome. Examples of clustering models are Kohonen networks, K-means clustering, two-stage clustering, and anomaly detection. Cluster models help in cases where the specific result is unknown, and they focus on identifying groups with similar records and on placing them in the same groups, a potential benefit when there is no prior knowledge about the predefined output for predictions by the model [32].
3. Materials and Methods
After data gathering from 2001–2018, we performed multistep analysis to identify the firms’ situation from an organizational life cycle perspective. We report the study method in detail below.
3.1. Data Collection
The current study is an analytical, descriptive, and cross-sectional case study of the pharmaceutical firms between 2001–2018 in Iran. We adopted the applicable Anthony–Ramesh’ method in determining the organizational life cycle using financial performance indicators. In this study, PCA and CA were used to detect generic pharmaceutical firms’ organizational life cycles in Iran. For this purpose, financial variables were calculated for 18 years. We limited the study to pharmaceutical companies listed on the Tehran Stock Exchange because of their financial transparency and annual publication of audited financial statements; firms that had financial information for fewer than six years were excluded.
Financial information was not completed for four companies because they joined the Tehran Stock Exchange Organization after 2001. So, prior that these years, their information was not published, and the total variables for 342 firm-years were calculated. Of 342 firm-years, 11 were excluded due to outlier amounts, and 331 firm-years were lastly entered into subsequent analytical stages.
We included annual sales growth (SG), dividend payout ratio (DPR), the age of the organization (as a control variable), and Qtubin, net profit (NP), return on assets (ROA), and return on equity (ROE) as financial performance indicators to identify the organizational life cycle. We considered each company’s age as a control variable to monitor its effect on the other studied variables.
According to life cycle theory, every stage of an organization’s life cycle is specified by financial characteristics. Firms, for example, show more sales growth in the first phase of their organizational life cycle. These companies invest large amounts of equipment and land while having a lower dividend payout ratio [4]. In the maturity stage, the firms experience stable sales, and the dividend payout ratio is usually more than that of the growth phase. Lastly, in the decline stage, sales growth decreases, and the firms increase the DPR to signal to the market that profitability has improved [1,33].
The firm’s performance also increases through the growth and maturity stages, and decreases in the end of the maturity stage and in the decline stage [16]. On the basis of the previous literature, the studied variables had different amounts in each OLC stage, as shown in Table 2. These qualitative values are related to each firm-year, measured relative to each other in this study.
Table 2.
Supposed variable amounts in each stage of OLC.
3.2. Statistical Analyses
The steps performed in this study are presented below:
- (1)
- Calculating variables
The SG, DPR, ROA, ROE, Qtubin, NP, and age of the organization for each firm-year of the companies in the study population were calculated on the basis of the following formulas [1]. For this purpose, financial statement information for 18 years was gathered for each company. Then, each of the variables was calculated on the basis of the following formula [1,34,35]:
where DPS = dividends per share, and EPS = earnings per share.
- (2)
- Principal component analysis
An essential step before using more statistical analyses on data is normalization, which leads to the normal distributions of data and the comparability of inputs with different scales. The SPSS modeler has this option that provides an output of the transformed data to select the form closest to normal distribution [32]. So, in this study, before any analysis, we transformed non-normal inputs and chose the forms with a normal distribution. Then, for dimensional reduction and to improve the clustering method’s quality, all of the mentioned variables were analyzed with the PCA method. In other words, this analysis allows for the variables to be transformed into lower numbers of factors in which their counterparts are combined and build pithy indices. This leads to more accessible and accurate analysis for clustering the firms.
- (3)
- Cluster analysis
After PCA, the developed variables are analyzed by the autocluster option proposed by IBM SPSS modeler 18.0, and the best method for clustering was chosen for the classification of the pharmaceutical firms on the basis of fitness indices. In this stage, considering the indices’ similarity in firm-years, we classified them into the most accurate and conforming groups.
4. Results
4.1. Descriptive Statistic
Compared to developing countries, the Iranian pharmaceutical market has grown significantly, and domestic firms produce 95% of medicines in Iran [36,37]. The Iranian pharmaceutical market was worth USD 4.5 billion in 2018 (domestic and imported drugs), of which USD 3.15 billion belong to domestic companies [38]. This study included 20 pharmaceutical companies that annually publish their financial statements in the Codal website [39]. These companies constitute a large portion of Iran’s pharmaceutical firms; their total market share is 35% of the total pharmaceutical revenue [38].
We calculated each variable for each firm on the basis of the formula in the above section, and normalized them with SPSS modeler 18.0 software. The descriptive statistics and normalized forms of each variable are presented in Table 3. The normal form of the variables is the most matched formation with Gaussian distribution. Table 3 shows that, for the sales growth and Qtubin variables, the log10 of the variables was the closest form to normal distribution, and other variables had proper normal distribution on their own.
Table 3.
Descriptive statistics and normalized forms of each variable (SG, sales growth; DPR, dividend per ratio; ROA, return on assets; ROE, return on equity; NP, net profit; St. Dev, standard deviation).
4.2. PCA Analysis Results
We performed PCA for the calculated standard variables. For PCA, the maximal number of extract factors was set to be 2, and with this configuration, the two first PCs explained 61.09% of the eigenvalue variance. ROA, NP, Qtubin-log, and ROE-log10 constituted PC1 and DPR, and SG constituted PC2 (Table 4 and Table 5).
Table 4.
Total variance explained by developed PCs in PCA.
Table 5.
Component matrix developed by PCA (SG, sales growth; DPR, dividend per ratio; ROA, return on assets; ROE, return on equity, NP, net profit; St. Dev, standard deviation).
So, on the basis of PCA, two variables for clustering analysis were developed:
Variable 1 = performance index (ROA, NP, Qtubin-log, and ROE-log10);
Variable 2 = Log10SG-DPR.
Variable 1 was considered to analyze the firms’ performance, which runs up to the maximum in the maturity stages and drops in the decline stage. Higher amounts show earlier phases of the organizational life cycle for Variable 2, which is the subtraction of the dividend per ratio from the sales growth. As the firms move towards the decline stage, this index decreases (Section 3.1).
4.3. Cluster Analysis Results
The developed variables from PCA were entered into the autoclustering node of SPSS modeler 18.0 as inputs, and the software suggested a two-step clustering method based on the Silhouette index. Two-stage cluster analysis is a binary method that uses the distance measurement for individual groups, and then statistically merges them step by step until all clusters are in one set. This technique has several advantages, such as determining the number of clusters on the basis of a statistical fitness measurement (AIC or BIC) rather than on arbitrary selection, using simultaneously stratified and continuous variables, and managing large datasets. Studies have shown that two-stage cluster analysis is one of the most reliable clustering methods in terms of the number of recognized clusters and the probability of classifying individuals into subgroups [40].
The optimal number of clusters for the developed model was 3 on the basis of the Silhouette index (Table 6). This index, in a fitting model criterion, measures the cohesion and separation of the developed clusters and indicates poor, fair, or good results. The model’s Silhouette index was 0.6 (more than 0.5), so the clustering model had good quality [41].
Table 6.
Model fitting criteria for different numbers of inputs cluster in two-step clustering analysis.
On the basis of the two-step model, the pharmaceutical firm-years of Iran were divided into three groups:
- Cluster 1: 57 (17.22%) of the firm-years belonged to this cluster. According to Table 7, the mean ± SD performance and SGlog10-DPR index were 0.06 ± 0.12 and −0.70 ± 0.25, respectively. Compared to the two other groups, the performance of Cluster 1 can be considered to be medium-upward. Concerning the SGlog10-DPR variable, this cluster had minimal amounts of SGlog10-DPR. According to Ebadi (2016), the firm’s SG and DPR usually move against each other: younger firms based on the OLC concept have more SG and less DPR, and the older ones are the opposite [1]. Compared to other clusters, this group with middle financial performance and minimal SGlog10-DPR ranges was almost in the early decline stage.
Table 7. Statistical characteristics of the developed clusters.
- Cluster 2: 113 (34.14%) of the firm-years belonged to Cluster 2. This class achieves maximal financial performance (mean ± SD = 0.15 ± 0.09) and medium-upward SGlog10-DPR amount (mean ± SD = −0.10 ± 0.09). Compared to the other clusters, the firm-years belonging to this cluster were in the maturity stage of OLC.
- Cluster 3: This cluster comprised 137 (41.39%) of the firm-years. According to Figure 1 and Table 7, its financial performance index was in the minimal range (mean ± SD = −0.08 ± 0.09), and its SGlog10-DPR index was in the medium range (mean ± SD = −0.12 ± 0.12). According to the low financial performance and medium SGlog10-DPR index of these firm-years compared to those of other clusters, the best-interpreted OLC situation for this cluster is the growth stage (Figure 1).
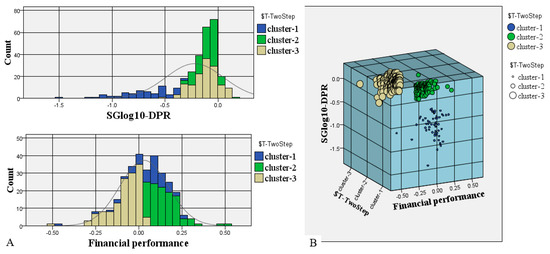 Figure 1. Cluster characteristics in (A) two and (B) three dimensions. (data: Iran’s pharmaceutical firms 2001−2018).
4.4. The Effect of Age on the OLC Situation
According to the compared means approach, there was no significant difference between the average age of the three developed clusters (Figure 2). As presented in Figure 2, although the mean age for the firm-years in the decline stage (Cluster 1) was 45.8 years old, and for the ones in maturity and growth stages (Clusters 2 and 3) was 42.93 years, this is not an essential statistical difference. The mean age of the growing and mature firms was also the same, which shows that older companies were not necessarily in the decline stage or vice versa. In other words, age cannot be considered to be an influential variable for moving toward the decline stage.
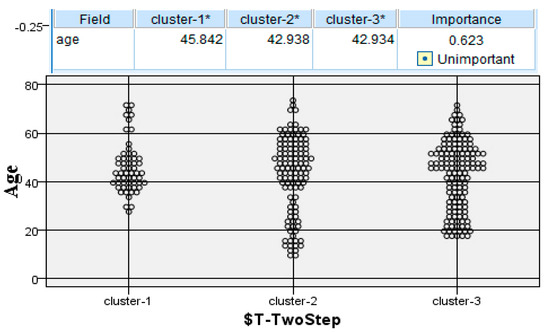
Figure 2.
Average age variable in three developed clusters (data: Iran’s pharmaceutical firms, 2001−2018), (* Cells contains: Means).
We also plotted the pattern of changes in the OLC situation of the Iranian pharmaceutical firms from 2001 to 2018, shown in Figure 3, which also indicates that some companies had some changes in their OLC situation during this time (move towards OLC stages or in the opposite direction), and others had no changes between 2001 and 2018.
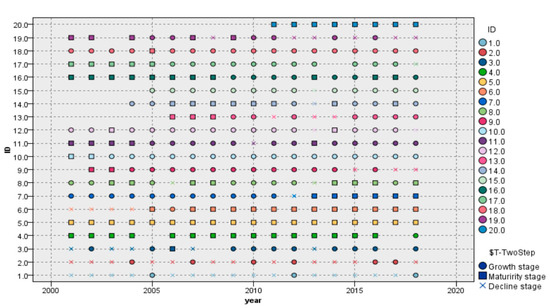
Figure 3.
OLC situation pattern of Iranian pharmaceutical companies (each ID shows one firm) during 2001–2018 (data: Iran’s pharmaceutical firms 2001–2018).
5. Discussion
In this study, we proposed an innovative approach to identify the OLC situation in Iranian pharmaceutical firms. We used the SG and DPR introduced by Anthony and Ramesh [4] with financial performance indicators to cluster the firms on the basis of the OLC concept. We also proposed different strategies, including open innovation in each stage of the OLC based on the study’s results, to allow for the more sustainable performance of generic pharmaceutical companies.
5.1. Organizational Life Cycle of the Generic Industry in Iran
Most Iranian pharmaceutical firm-years showed growth stage characteristics based on OLC theory during 2001–2018. As time went by, as expected, more companies entered the decline phase, but some companies showed the opposite conditions. During 2001–2018, many of the firms maintained maturity or growth, and some others oscillated between the growth and maturity stages. This indicates that company age does not necessarily indicate the aging and decline of a firm. On the basis of studies, older companies are more experienced in finding better routes for building external relationships, technical competencies, and product development [42]. Our findings show that Iranian pharmaceutical firms are old enough (age mean = 43.5) and experienced in different mentioned fields. So, although in previous studies age was recognized as an essential factor in the organization’s aging and could be the reason for the burnout of facilities and equipment [43], our results show that age cannot solely be a valid variable in OLC identification, and should be considered along with the other performance measurements that were discussed in this study.
Some of the studied firms were shifting from the maturity or decline stage to a better condition such as the growth or maturity stage, respectively. This means that such companies recover, and begin to grow and accumulate resources [44]. Another explanation for returning to the growth stage after maturity or decline is called the timing of breaking even. This can usually occur in traditional and stable firms that tend to prove their profitability and gain more resources to restart the growth stage. Therefore, our results are in the same direction as that of studies that mentioned that organizational life cycle stages should not be considered to be entirely sequential, as they may go through several stages of recovery and fluctuate [10,44].
5.2. The Role of Open Innovation in Firms’ Survival
In the growth and maturity phases of the organizational life cycle, there are different strategies that a firm can adopt to sustain its profitability; some of them are shown in Table 1. In the following, we discuss another concept, namely, open innovation, and its benefits for the pharmaceutical industry.
The generic pharmaceutical industry has fundamental differences from global brand producers [45]; therefore, OLC management during different stages is likewise different. On the basis of the study results, generic pharmaceutical firms in Iran are mainly in the maturity and growth stages or shifting between these two phases; therefore, efficiency [46] is the critical point for long-term survival. In the highly competitive market of the generic industry in Iran, managers should focus on innovative ways to maintain competitive advantages [46] and their market share. In this situation, open innovation, which manages innovation through a company’s open boundaries, can help generic pharmaceutical companies in developing their projects through externally oriented knowledge [47,48]. As open innovation encompasses all aspects of innovation in products and processes, knowledge sharing can be achieved regarding these processes from the company’s external environment [49]. One managerial consideration previously shown to enhance open innovation in the generic pharmaceutical industry is proper product life cycle management [37]. This can maintain the sales growth of products as an OLC indicator and the long-term survival of firms, and also establish information-sharing flow as a core requirement for open innovation through the internal and external resources of a company.
Another approach to maintain long-term survival based on the generic pharmaceutical situation is the collaboration of the industry and universities. Industry–university association plays a crucial role in growth and innovation in any industry in both developed and developing countries, as was mentioned in the literature [50,51,52,53]. As a developing country, Iran has a weak infrastructure for university–industry collaboration, which has led to insufficient innovation in different sectors [52]. Their focus is on developing the capacity for producing the range of domestic pharmaceutical products [54]. In these conditions, taking advantage of professional resources in the academic sector can, besides saving costs, also enhance the technological and human capital capacity, the economic competitiveness of firms, risk sharing, subcontracting the research and development sector, etc. [55]. These benefits can improve open innovation in generic pharmaceutical companies and contribute long-term competitive advantages for performance and survival.
5.3. Declined Organizations: Causes and Solutions
As presented by our results, the lowest identified stage in the studied companies was the decline phase. This result is not surprising, because some studies have shown that the decline phase frequently happens in new companies due to a lack of leadership and coordination mechanisms or the inability to generate resources to sustain the firms’ operation [44]. Most Iranian pharmaceutical companies are well-established, and as our results show, they seem to have reached a stable and promising situation. In firms that belonged to the decline stage in the last year of the study, we see low sales growth and high DPR. In these firms, the performance index is also mainly upward-medium, which shows that the companies were trying to maintain their performance by reducing costs, thereby increasing net profits or maintaining the market value while the total sales growth trend was dropping.
The main point about the declined firms, and as an actual application of the OLC concept that had been discussed, is providing solutions to pass them from the decline stage. This concept is known as “turnaround” in the literature, which means that the firm recovers in the decline stage and revives itself [11,56].
Dropping sales growth. Concerning the Iranian pharmaceutical companies, there are some possible reasons for declining sales growth and entering the decline stage: sanctions, which in recent years have caused problems in the supply of raw materials and currency transfers, and a lack of investment in research and development activities or its imbalance with public needs and declining sales growth [57,58].
Lack of efficient innovation approach. As mentioned above, the pharmaceutical industry in Iran suffers from innovation in different sectors, from product to process. Price setting by Iran’s Ministry of Health is another factor that leads to low financial resources for investing in the R&D sector and formulation-based production, and there is little interest in exportation. In this case, by reforming pricing methods, the government can increase the financial capacity of pharmaceutical companies to invest in the research and development sector. This can enhance product-oriented innovation, which leads to domestic competition through enhancing product quality and differentiation, and strengthens exports to other countries [37,57]. Another solution for enhancing the performance of the R&D sector, sales growth and open innovation in the generic industry were suggested by Mousavi et al. (2022) [37]. They mentioned that generic companies can gain more profits by merging the R&D and marketing sectors through information and resource sharing, and reducing costs [37].
High competition. Another factor in the literature that is considered to be a reason for the shortened life cycle of organizations, declining sales growth, and entry into the decline stage that can be applied to the pharmaceutical market of Iran is competition [59]. There is a competitive situation in the generic pharmaceutical market of Iran [45], which may lead to some companies having low sales growth and entering the decline stage. The increasing quality, differentiation, and attractiveness of products, the proper selection of the target market, recognizing and meeting the needs of target markets, and effective marketing plans [37,60] are suggested strategies according to the generic industry situation that can enhance the competitive advantage of the firms and turn the decline stage around.
High DPR. High DPR is another factor that leads to the decline stage of some Iranian pharmaceutical organizations. Policies related to the high distribution of DPR give a positive impression to the company’s shareholders, enhancing the share price, and earning a better reputation and more external finance [61,62]. On the other hand, according to our results, high amounts of DPR are one of the causes of organizational decline. Despite high DPR advantages for the companies, some studies showed that a low DPR creates more investment opportunities for companies [62].
In other words, there should be a balance between the company’s profitability and DPR, earning stakeholders’ satisfaction, improving its reputation, fundraising from external sources, and the existence of enough internal financial resources to invest in equipment and modernize technologies. Therefore, one strategy for the generic industry of Iran may be reducing the dividend per ratio, through which companies can increase profits for future investments in upgrading facilities and turning the decline stage around. This is very relevant for the Iranian pharmaceutical industry because it includes mainly semigovernmental organizations, and has little tendency to invest in facilities and technology [15].
6. Conclusions
This study provides more profound insights into the managerial situation and financial performance of generic companies in Iran, which can apply to other countries with generic pharmaceutical firms. Findings show that, in the two recent decades, Iran’s pharmaceutical firms have been in the growing stage of OLC. Over time, more companies have entered the decline phase, which was expected, but some companies have also seen the opposite. The age of the firms (which have shifted from the maturity or decline stage into earlier phases of OLC, i.e., growth and maturity, respectively, over 18 years) positively enhances their experience to recover through building external relationships, improving product development, and accumulating resources. In many cases, the OLC should not be considered to be sequential phases over time. The decline stage of OLC is mainly due to dropping sales growth and high amounts of DPR. DPR should be reduced to enhance financial capacity and invest in facilities, increase open innovation in different sectors such as the R&D sector to enhance medicine quality and competitive advantages, and proper marketing strategies should exist to assess and meet the target market’s needs are strategies for turning around the decline stage for generic pharmaceutical companies in Iran and countries with the same situation.
The study findings may guide policymakers towards more evidence-informed planning, such as modifying pricing and offering more financial support for the R&D sector, to overcome accompanying challenges in pharmaceutical firms in Iran and countries with similar situations.
7. Limitations
One of the study’s limitations is the lack of access to the companies’ financial statements before 2000 in the Codal Internet portal [39], so it was impossible to analyze the companies’ OLC situation from their formation. Another limitation was the lack of access to financial information of companies outside the Tehran Stock Exchange. Although the studied companies constitute a large part of the country’s pharmaceutical industry (the market share of the 20 companies in 2017 was equal to 35%) [38], complete access to other companies’ financial statements can provide more helpful analysis.
Author Contributions
A.M. contributed to the conception and design of the study, analysis, and drafting the article. H.Z. contributed to interpretation and drafting, and provided a critical revision of the article. M.M. contributed to the interpretation and critical revision of the article. All authors have read and agreed to the published version of the manuscript.
Funding
This research received no external funding.
Institutional Review Board Statement
Not applicable.
Informed Consent Statement
Not applicable.
Data Availability Statement
Data that we used for this study are publicly available at www.codal.ir (accessed on 20 March 2020).
Acknowledgments
We thank Martin F. Blair for his great edit of the paper.
Conflicts of Interest
The authors declare no conflict of interest.
References
- Ebadi, T. The Effect of Corporate Life Cycle on the Accounting Conservatism. Scinzer J. Account. Manag. 2016, 2, 1–11. [Google Scholar]
- Dodge, H.R.; Robbins, J.E. An Empirical Investigation of the Organizational Life Cycle. J. Small Bus. Manag. 1992, 30, 27. [Google Scholar]
- Adizes, I. Corporate Lifecycles: How and Why Corporations Grow and Dies and What to Do About It; Prentice Hall: Paramus, NJ, USA, 1989. [Google Scholar]
- Anthony, J.H.; Ramesh, K. Association between Accounting Performance Measures and Stock Prices. A Test of the Life Cycle Hypothesis. J. Account. Econ. 1992, 15, 203–227. [Google Scholar] [CrossRef]
- Miller, D.; Friesen, P.H. A Longitudinal Study of the Corporate Life Cycle. Manage. Sci. 1984, 30, 1161–1183. [Google Scholar] [CrossRef]
- Stepanyan, G.G. Revisiting Firm Life Cycle Theory for New Directions in Finance. SSRN Electron. J. 2012. [Google Scholar] [CrossRef]
- Lester, D.L.; Parnell, J.A.; Carraher, S. Organizational Life Cycle: A Five-Stage Empirical Scale. Int. J. Organ. Anal. 2003, 11, 339–354. [Google Scholar] [CrossRef]
- Jirásek, M.; Bílek, J. The Organizational Life Cycle: Review and Future Agenda. Qual. Innov. Prosper./Kval. Inovácia Prosper. 2018, 22, 1–18. [Google Scholar] [CrossRef]
- Mosca, L.; Gianecchini, M.; Campagnolo, D. Organizational Life Cycle Models: A Design Perspective. J. Organ. Des. 2021, 10, 3–18. [Google Scholar] [CrossRef]
- Robert Phelps, R.A.; Bessant, J. Life cycles of growing organizations: A review with implications for knowledge and learning. Int. J. Manag. Rev. 2007, 9, 1–30. [Google Scholar] [CrossRef]
- Santanaa, M.; Vallea, R.; Galan, J.-L. Turnaround Strategies for Companies in Crisis: Watch out the Causes of Decline before Firing People. BRQ Bus. Res. Q. 2017, 20, 206–211. [Google Scholar] [CrossRef]
- Reinhardt, U.E. The Pharmaceutical Sector in Health Care. In Pharmaceutical Innovation: Incentives, Competition, and Cost-Benefit Analysis in International Perspective; Sloan, F., Hsieh, C., Eds.; Cambridge University Press: Cambridge, UK, 2007; pp. 25–53. [Google Scholar] [CrossRef]
- Shahangian, S.; Snyder, S.R.; Et, G.; Mekuria, B. A Qualitative Review of Strengths, Weaknesses, Opportunities and Threats of Clinical Pharmacy Services Provided by Tirunesh Beijing General Hospital Pharmaceutical Care & Health Systems. J. Pharm. Care Health Syst. 2019, 131, 418–431. [Google Scholar] [CrossRef]
- Kebriaeezadeh, A.; Koopaei, N.N.; Abdollahiasl, A.; Nikfar, S.; Mohamadi, N. Trend Analysis of the Pharmaceutical Market in Iran; 1997-2010; Policy Implications for Developing Countries. DARU J. Pharm. Sci. 2013, 21, 52. [Google Scholar] [CrossRef] [PubMed]
- Cheraghali, A.M. Trends in Iran Pharmaceutical Market. Iran. J. Pharm. Res. IJPR 2017, 16, 1–7. [Google Scholar] [CrossRef] [PubMed]
- Maldonado, C.; Beruvides, M.G.; Simonton, J. Influence of Intellectual Capital Intermediaries on Technical, 1st ed.; Maldonado, C., Ed.; Texas Tech University: Lubbock, TX, USA, 2008. [Google Scholar]
- Karacaer, S.; Gulec, O.F. Corporate Life Cycle Methods in Emerging Markets: Evidence from Turkey. Pressacademia 2017, 4, 224–236. [Google Scholar] [CrossRef]
- Aharony, J.; Falk, H.; Yehuda, N.; Technion, T.; Kemsley, D.; Thomas, J.; Ziv, A. Corporate Life Cycle and the Relative Value—Relevance of Cash Flow versus Accrual Financial Information. Available online: https://www.researchgate.net/publication/228170690_Corporate_Life_Cycle_and_the_Value_Relevance_of_Cash_Flow_versus_Accrual_Financial_Information (accessed on 23 June 2021).
- Bayaraa, B. Financial Performance Determinants of Organizations: The Case of Mongolian Companies. J. Compet. 2017, 9, 22–33. [Google Scholar] [CrossRef]
- Joudaki, H.; Rashidian, A.; Minaei-Bidgoli, B.; Mahmoodi, M.; Geraili, B.; Nasiri, M.; Arab, M. Improving Fraud and Abuse Detection in General Physician Claims: A Data Mining Study. Int. J. Health Policy Manag. 2016, 5, 165–172. [Google Scholar] [CrossRef]
- Swarndepp, S.J.; Pandya, S. An Overview of Partitioning Algorithms in Clustering Techniques. Int. J. Adv. Res. Comput. Eng. Technol. 2016, 5, 1943–1946. [Google Scholar]
- Rutherford, M.W.; Buller, P.F.; McMullen, P.R. Human Resource Management Problems over the Life Cycle of Small to Medium-Sized Firms. Hum. Resour. Manag. 2003, 42, 321–335. [Google Scholar] [CrossRef]
- Wang, Y.; Lee, H. A Clustering Method to Identify Representative Financial Ratios. Inf. Sci. 2008, 178, 1087–1097. [Google Scholar] [CrossRef]
- Momeni, M.; Mohseni, M.; Soofi, M. Clustering Stock Market Companies via K-Means Algorithm. Kuwait Chapter Arab. J. Bus. Manag. Rev. 2015, 4, 1–10. [Google Scholar] [CrossRef][Green Version]
- Jianfeng, L.; Yan, C. Application of Fuzzy Clustering Method in Classifying Steel Companies. In Proceedings of the Second International Conference on Innovative Computing, Informatio and Control (ICICIC 2007), Kumamoto, Japan, 5–7 September 2007; pp. 6–9. [Google Scholar] [CrossRef]
- Xu, X.; Liu, X.; Chen, Y. Applications of Axiomatic Fuzzy Set Clustering Method on Management Strategic Analysis. Eur. J. Oper. Res. 2009, 198, 297–304. [Google Scholar] [CrossRef]
- Chi-Hsien, K.; Nagasawa, S. Applying Machine Learning to Market Analysis: Knowing Your Luxury Consumer. J. Manag. Anal. 2019, 6, 404–419. [Google Scholar] [CrossRef]
- Granato, D.; Santos, J.S.; Escher, G.B.; Ferreira, B.L.; Maggio, R.M. Use of Principal Component Analysis (PCA) and Hierarchical Cluster Analysis (HCA) for Multivariate Association between Bioactive Compounds and Functional Properties in Foods: A Critical Perspective. Trends Food Sci. Technol. 2018, 72, 83–90. [Google Scholar] [CrossRef]
- Kettenring, J.R. The Practice of Cluster Analysis. J. Classif. 2006, 23, 3–30. [Google Scholar] [CrossRef]
- Gaitani, N.; Lehmann, C.; Santamouris, M.; Mihalakakou, G.; Patargias, P. Using Principal Component and Cluster Analysis in the Heating Evaluation of the School Building Sector. Appl. Energy 2010, 87, 2079–2086. [Google Scholar] [CrossRef]
- Ding, C.; He, X. K-Means Clustering via Principal Component Analysis. In Proceedings of the Twenty-First International Conference on Machine Learning, Banff, AB, Canada, 4–8 July 2004; pp. 225–232. [Google Scholar]
- IBM. IBM SPSS Modeler, 18.1.1; Modeler Modeling Nodes; IBM: New York, NY, USA, 2017; p. 422. Available online: https://ftp://public.dhe.ibm.com/software/analytics/spss/documentation/modeler/18.1.1/en/ModelerModelingNodes.pdf (accessed on 25 January 2018).
- Bulan, L.T.; Subramanian, N. Dividends and Dividend Policy; Citeseer: Boston, MA, USA, 2009. [Google Scholar]
- Wang, M.C. Value Relevance of Tobin’s Q and Corporate Governance for the Taiwanese Tourism Industry. J. Bus. Ethics 2015, 130, 223–230. [Google Scholar] [CrossRef]
- Daniswara, H.P.; Daryanto, W.M. Earning per Share (EPS), Price Book Value (PBV), Return on Asset (ROA), Return on Equity (ROE), and Indeks Harga Saham Gabungan (IHSG) Effect on Stock Return. South East Asia J. Contemp. Business Econ. Law 2019, 20, 11–27. [Google Scholar]
- Yousefi, N.; Mehralian, G.; Rasekh, H.R.; Tayeba, H. Pharmaceutical Innovation and Market Share: Evidence from a Generic Market. Int. J. Pharm. Healthc. Mark. 2016, 10, 376–389. [Google Scholar] [CrossRef]
- Mousavi, A.; Mohammadzadeh, M.; Zare, H. Developing a System Dynamic Model for Product Life Cycle Management of Generic Pharmaceutical Products; Its Relation with Open Innovation. J. Open Innov. Technol. Mark. Complex. 2022, 8, 14. [Google Scholar] [CrossRef]
- IFDA. Official Iranian Drug Statistics. Available online: https://www.fda.gov.ir/ (accessed on 20 March 2020).
- Securities and Exchange Organization. Available online: https://www.codal.ir/ (accessed on 20 March 2020).
- Benassi, M.; Garofalo, S.; Ambrosini, F.; Sant’Angelo, R.P.; Raggini, R.; De Paoli, G.; Ravani, C.; Giovagnoli, S.; Orsoni, M.; Piraccini, G. Using Two-Step Cluster Analysis and Latent Class Cluster Analysis to Classify the Cognitive Heterogeneity of Cross-Diagnostic Psychiatric Inpatients. Front. Psychol. 2020, 11, 1085. [Google Scholar] [CrossRef]
- Wendler, T.; Gröttrup, S. Data Mining with SPSS Modeler; Springer: Berlin, Germany, 2016. [Google Scholar] [CrossRef]
- Bierly, P.E.; Daly, P.S. E T & P Performance in Small Manufacturing Firms. Small 2007, 540, 493–517. [Google Scholar]
- Agarwal, R.; Sarkar, M.B.; Echambadi, R. The Conditioning Effect of Time on Firm Survival: An Industry Life Cycle Approach. Acad. Manag. J. 2016, 45, 971–994. [Google Scholar]
- Martin, R.; Sunley, P. Conceptualising Cluster Evolution: Beyond the Life-Cycle Model? Reg. Stud. J. 2011, 45, 1299–1318. [Google Scholar] [CrossRef]
- Mousavi, A.; Zare, H.; Asadian, A.; Mohammadzadeh, M. Factors Affecting the Product Life Cycle of Generic Medicines. Iran. J. Pharm. Res. 2022, 21, e127039. [Google Scholar]
- Sirmon, D.G.; Hitt, M.A.; Ireland, R.D.; Gilbert, B.A. Resource Orchestration to Create Competitive Advantage: Breadth, Depth, and Life Cycle Effects. J. Manag. 2011, 37, 1390–1412. [Google Scholar] [CrossRef]
- Steiner, A.; Morel, L.; Camargo, M. Well-suited organization to open innovation: Empirical evidence from an industrial deployment. J. Innov. Econ. Manag. 2014, 13, 93–113. [Google Scholar] [CrossRef]
- Guffarth, D.; Knappe, M. Patterns of Learning in Dynamic Technological System Lifecycles—What Automotive Managers Can Learn from the Aerospace Industry? J. Open Innov. Technol. Mark. Complex. 2018, 5, 1. [Google Scholar] [CrossRef]
- Tsinopoulos, C.; Sousa, C.M.P.; Yan, J. Process Innovation: Open Innovation and the Moderating Role of the Motivation to Achieve Legitimacy. J. Prod. Innov. Manag. 2018, 35, 27–48. [Google Scholar] [CrossRef]
- Yun, J.H.J.; Liu, Z. Micro- and Macro-Dynamics of Open Innovation with a Quadruple-Helix Model. Sustainability 2019, 11, 3301. [Google Scholar] [CrossRef]
- Rostoka, Z.; Locovs, J.; Gaile-Sarkane, E. Open Innovation of New Emerging Small Economies Based on University-Construction Industry Cooperation. J. Open Innov. Technol. Mark. Complex. 2019, 5, 10. [Google Scholar] [CrossRef]
- Kharazmi, O.A.; Nedaei, A.; Nejad, N.J. University-Industry Collaboration in the Iranian National System of Innovation: University Perspective Universities as Interactive Partners. In Proceedings of the Triple Helix International Conference 2013, London, UK, 8–10 July 2013. [Google Scholar]
- Perkmann, M.; Walsh, K. University Industry Relationships and Open Innovation: Towards a Research Agenda. Int. J. Manag. Rev. 2007, 9, 259–280. [Google Scholar] [CrossRef]
- Mytelka, L.K. Pathways and Policies to (Bio) Pharmaceutical Innovation Systems in Developing Countries. Ind. Innov. 2006, 13, 415–435. [Google Scholar] [CrossRef]
- Ankrah, S.; Al-Tabbaa, O. Universities—industry Collaboration: A Systematic Review. Scand. J. Manag. 2015, 31, 387–408. [Google Scholar] [CrossRef]
- Rico, M.; Puig, F. Successful Turnarounds in Bankrupt Firms? Assessing Retrenchment in the Most Severe Form of Crisis. BRQ Bus. Res. Q. 2021, 24, 114–128. [Google Scholar] [CrossRef]
- Fardazar, F.E.; Asiabar, A.S.; Safari, H.; Asgari, M.; Saber, A.; Azar, A.A.E.F. Policy Analysis of Iranian Pharmaceutical Sector; A Qualitative Study. Risk Manag. Healthc. Policy 2019, 12, 199–208. [Google Scholar] [CrossRef]
- Khayatzadeh-Mahani, A.; Fotaki, M.; Harvey, G. Priority Setting and Implementation in a Centralized Health System: A Case Study of Kerman Province in Iran. Health Policy Plan. 2013, 28, 480–494. [Google Scholar] [CrossRef]
- Monferrer, D.; Blesa, A.; Ripollés, M. Born Globals Trough Knowledge-Based Dynamic Capabilities and Network Market Orientation. BRQ Bus. Res. Q. 2015, 18, 18–36. [Google Scholar] [CrossRef]
- Mohammadzadeh, M.; Bakhtiari, N.; Safarey, R.; Ghari, T. Pharmaceutical Industry in Export Marketing: A Closer Look at Competitiveness. Int. J. Pharm. Healthc. Mark. 2019, 13, 331–345. [Google Scholar] [CrossRef]
- Flávio Morais, Z.S.; Ramalho, J.J. The Zero-Leverage Phenomenon in European Listed Firms: A Financing Decision or an Imposition of the Financial Market? BRQ Bus. Res. Q. 2021. [Google Scholar] [CrossRef]
- Rahmadia, R.; Hosen, M.N.; Muhari, S. Analysis of Factors That Impact Dividend Payout Ratio on Listed Companies at Jakarta Islamic Index. Int. J. Acad. Res. Account. Financ. Manag. Sci. 2016, 6, 87–97. [Google Scholar]


Publisher’s Note: MDPI stays neutral with regard to jurisdictional claims in published maps and institutional affiliations. |
© 2022 by the authors. Licensee MDPI, Basel, Switzerland. This article is an open access article distributed under the terms and conditions of the Creative Commons Attribution (CC BY) license (https://creativecommons.org/licenses/by/4.0/).