Article

Regional Open Innovation Systems in a Transition Economy: A Two-Stage DEA Model to Estimate Effectiveness

1
Graduate School of Industrial Economics, Institute of Industrial Management, Economics and Trade, Peter the Great Saint-Petersburg Polytechnic University, 195251 St. Petersburg, Russia
2
Institute of Economic Sciences, Brandenburg University of Technology Cottbus-Senftenberg, 101344 Brandenburg, Germany
*
Authors to whom correspondence should be addressed.
J. Open Innov. Technol. Mark. Complex. 2022, 8(1), 41; https://doi.org/10.3390/joitmc8010041
Submission received: 12 December 2021 / Revised: 9 February 2022 / Accepted: 11 February 2022 / Published: 16 February 2022

Abstract

:
The development of innovation at a regional level in a transition economy is characterised by complex multidirectional processes of generating and commercialising innovation, indicating the need for systematic research and rethinking of the existing methods of managing such territorial entities to stimulate innovation. For the successful introduction and implementation of innovative solutions, the deployment of appropriate amounts of intellectual, material and financial resources as well as their concentration in space and time is important. This article aims to develop a model for assessing the effectiveness of regional innovation systems (RISs) during the shift from the transition economy to the market economy. The authors developed a two-stage data envelopment analysis (DEA) model connected with patent activities and the output of innovative goods and services. The model’s application made it possible to build maps describing the rating of regions concerning the performance indicator and to identify the availability of unutilised resources. For example, we identified efficient and inefficient regions in terms of producing innovative products, which is especially important for developing additional measures for developing the institutional environment of regions with considerable resources but very low utilisation efficiency. The data obtained will allow for more effective management of the structural elements of RISs as well as the detection of changes in the dynamics of key development indicators by identifying the size of efficiency reserves and the causes of their occurrence at the individual subject level.

1. Introduction

A changing marketplace demands that increasingly complex products and services be produced to meet the rising demand from various social groups. Searching for new methods to increase one’s level of competitiveness within the framework of the open innovation concept is one way to gain market share.
The concept of open innovation has been extensively considered a promising field of activity [1,2,3,4,5]. However, several researchers have regarded it as a rather risky research topic due to the low level of control, its complex implementation in terms of both organisational and marketing tools, and the increased costs [6].
This concept can simplify the process of implementing new solutions at different stages of the innovation process such as during the stages of finding the solution, partners, and external financing [7,8,9]. However, open innovation is often a poorly formalised instrument, preventing some companies from managing them effectively. Thus, large companies that aim to implement advanced innovative projects but have not created the necessary organisational infrastructure cannot implement their projects properly [10,11]. In addition to resource constraints, cultural or psychological barriers might arise when implementing innovative solutions, as indicated by the information secrecy level within companies [12,13,14].
In the context of open innovations, the issue of collaboration between market participants who develop knowledge and can direct their efforts to create innovative projects is also considered. Such cooperation positively affects the market if the interaction outcome is successful, and innovations can be formed as measured by specific indicators such as economic indicators (e.g., profit, income, customer satisfaction, and market share increase) [15,16]. However, in this field of activity, not only the economic aspect of the issue but also aspects, such as reducing the rate of environmental pollution, resource efficiency, and other factors related to the region’s sustainable development, are important. Within this issue’s framework, the concept of open innovations allows for rethinking the goods and services presented on the market in terms of their compliance with the requirements of sustainable development programs [17,18]. Open innovation-related activities enable us to unlock additional opportunities for the involved companies through interaction with partners who reduce barriers to introducing knowledge and competencies into the finished product. Furthermore, mutual information exchange improves the participants’ level of competitiveness [19,20]. Researching innovations requires coordinated interactions at both the organisational and systemic levels, which are associated with the infrastructure to be provided [4,15,16].
This study is especially relevant for countries whose economies have shifted from a transitional to market economy. Here, comprehending the benefits of open innovations will allow countries with transitional economies to adapt to the new conditions of economic activity [21,22,23,24]. In this case, the concept of open innovations must be considered as part of the innovation system. Innovation systems facilitate an increase in the efficiency of interaction between economic agents in transferring and creating knowledge at the national, regional and local levels. Meanwhile, the issue of organising the activities of the open innovation system at the regional level and evaluating its effectiveness is being actively explored [2,25,26].
In this article, the authors developed a theory of applying the concept of open innovations in a regional innovation system (RIS) of transit countries from the viewpoint of assessing the effectiveness of their activities. The article is organised into several sections. In Section 2, the Literature Review, the authors indicate the basic concepts related to the implementation of open innovations at the regional level. In addition, they analyse the impact of open innovations on the RIS as well as the indicators that are used to assess the activities of such systems. In Section 3, Research Methods, the authors justify the choice of DEA modelling for assessing the activities of RISs, propose an algorithm for developing a specific model and determine the main parameters that can be used in further analysis based on the literature review. In Section 4, the Results, the authors analyse the descriptive statistics of resource allocation of the Russian Federation by region. Then, they use DEA modelling, based on which they build performance maps for the analysis stages, identify performance gaps and derive appropriate conclusions. In Section 5, the Discussion section, the authors compare the results of the present study with those obtained previously on this topic and provide additional comments. Finally, Section 6 presents the main conclusions based on the study’s results and avenues for future research.

2. Literature Review

An RIS is a geographical clustering of economic activities that facilitates innovative solutions due to the localisation of knowledge, which leads to further endogenous growth [17].
First, it is necessary to consider the basic concepts that determine how the concept of open innovations is implemented within the RIS framework. The regional innovation policy affects how precisely and successfully the concept of open innovations will be introduced into the economic system of the selected entity. The concept of this policy should be considered from the viewpoint of Kroll, who indicated that this is a step-by-step process of translating political choice into practice based on the specific decisions of the government at a selected time [27,28]. In this case, the theory of clusters is associated with a specific innovation policy to be developed and implemented, making it possible to consider the advantages and disadvantages of a particular territorial entity. Nestle and Santos found that regional clusters can considerably boost production indicators, patent activity and employment and can lead to the emergence of new industrial areas of activity [29,30].
However, according to Asheim’s research, the importance of establishing an innovation policy at a regional level, which affects the final effectiveness of economic agents’ interactions in implementing innovative products, is also set out. It is the development of flexible approaches to innovation policy that facilitates an increase in the ability of regions to diversify into new types of activities [31,32]. In this case, a regional innovation policy facilitates the principle of production specialisation, which can solve the key problems of this territory. Meanwhile, new ways of interaction through digital infrastructure facilitate the involvement of local authorities, institutions, companies and populations in the process of creating open innovations. Based on the relation between open innovations and RISs, the state policy in the field of innovation can facilitate the development of innovation activities by encouraging cooperation between small- and medium-sized businesses and external organisations in various industries. This allows for an increase in transmitted information flows [33,34,35]. In this context, the stimulating factors are reduction in costs and that in risks (e.g., financing R&D projects (subsidies, tax incentives, and loans)).
In this article, the concept of an RIS is considered from the viewpoint of Doloreux; it is a system of interaction between private and public interests built on organisational and institutional mechanisms for creating, using and disseminating knowledge [36]. A necessary stage in building an understanding of an innovation system is the definition of boundaries. Within an RIS, boundaries are formed by the territorial location of the participants in the innovation activities [37]. A vivid example of cooperation between participants in an RIS in the framework of creating open innovations is the living labs concept. This tool encourages users to create breakthrough ideas. Such concepts help small- and medium-sized enterprises in particular, as they provide additional opportunities for the application of technological, scientific and innovative infrastructure. For the successful functioning of RISs, it is important to create an environment that is beneficial for productive interaction among enterprises, academia and the public sector of the economy. One of the most popular concepts that can address such a problem is open innovations. According to Chesbrough, open innovation refers to a set of methods that contribute to profiting from innovation activities and a cognitive model for creating and interpreting such practices [38,39]. The successful interaction of the key market actors involves creating a special type of system called an open innovation ecosystem. This concept, in turn, is understood as a “network system within which product enterprises, governments, customers etc. interact, communicate and promote innovations” [40]. Thus, the concept of open innovations can enhance the positive impact of RIS activities (Table 1).
The Table 1 data determine the relationship between open innovations and RISs. Although open innovations directly affect the organisation of an RIS, the opposite effect is also noted.
Thus, among the RIS conditions affecting the implementation of open innovations, it is worth highlighting:
Level of urbanisation;
Distance to major industrial centres;
Industrial diversity of the region;
The number of research and educational organisations.
Along with the concept of open innovations, the development of an RIS increases cooperation among the participants in innovation activities to a new level by strengthening trust between the study participants. Accelerated feedback and participants’ sense of shared local affiliation facilitate the implementation of new solutions much more efficiently compared to online platforms, where it is more difficult to follow the common vector of interaction. In accordance with this information, we defined regional open innovation systems as networks, where actors support the exchange of information and collaborate on the creation of innovations. In addition, common regional affiliation encourages participants from various sectors of the innovation ecosystem to develop indicators of competitiveness and solve shared social problems. Given the positive aspects of interaction between participants in a regional open innovation system for creating and implementing high-tech products, research on the efficiency of such an interaction based on DEA modelling has recently gained popularity in the scientific community (Table 2).
Most of the considered articles assumed the use of DEA in terms of two-stage modelling, where first-stage outputs are transformed into second-stage inputs (Table 2). Among the variables used in the research, those related to the educational and industrial sectors are most clearly distinguished. However, maximum attention is paid to evaluating the effectiveness of implementing innovation in the commercial sector based on available resources and not how the patents issued are converted into a final product.
Following Table 2, it is worth arguing that the concept of open innovation significantly impacts RIS development [44,51,56]. However, the successful introduction of such a concept depends on the type of economic system to which the entity belongs. For example, in developed countries, innovation aims to establish and develop competitive advantages in the market [68]. In contrast, numerous countries belong to the transition economy—the post-Soviet countries: Belarus, Bulgaria, Lithuania, Russia, Montenegro, Bosnia and Herzegovina. Such countries are trying to adapt to the new market conditions to rebuild their personnel and management systems [21]. However, most post-Soviet countries are not ready to operate under new market conditions. The most common barriers to development include cultural characteristics (e.g., distrust of innovations and closed principles of interaction among the system’s participants), lack of resources and technologies, the legislative system, and insufficient development of the institutional environment [22,23,24,69].
When studying publications that have developed a theory of open innovations in post-Soviet countries, the authors revealed several key facts [22,23,24,69]:
This topic has been insufficiently studied;
Existing studies have considered this topic superficially and generally focused on building models for an advanced economic system rather than a transitional one;
All studies have emphasised further development of this topic.
This article aimed to develop a model for assessing the effectiveness of RISs during the shift from a transition economy to a market economy. The materials of this article develop a theory of implementing the concept of open innovations in countries with transition economies from the viewpoint of identifying the most optimal model for assessing innovative activity. Such an assessment can identify numerous regions in which the interaction between the RIS elements is ineffective and the reasons for this situation. This information can facilitate the development of a list of activities to improve RISs. Despite apparent barriers to innovation in countries with transition economies, the authors note the evident advantages of such conditions for the functioning of the system, which is confirmed by the literature review.

3. Research Methods

The study of performance evaluation at the regional level is associated with the concept of technical efficiency, as it allows us to interpret the maximum possible impact of a given set of resources. Thus, when assessing technical efficiency at the regional level, it becomes possible to identify entities that use their resource capabilities inexpediently. The reasons why regions might be technically inefficient are related to managerial, economic, technological and other problems. Thus, the assessment of technical efficiency allows us to identify the fact of inefficiency and the possible causes of such a situation. Therefore, technical efficiency is understood as the ratio of actual resources to potentially possible results. The value of this indicator varies from 0 to 1 [70,71].
For the purposes of this study, DEA was chosen as the method for evaluating RIS effectiveness. The DEA model assumes the identification of reference regions in terms of efficiency in relation to which the rest of the objects under analysis can be compared. The further other regions are located from the reference regions, the less effectively they will use their capabilities [62]. An advantage of the DEA method is the opportunity it provides to identify a generalised performance indicator (theta) that can include many variables of resources and results. Unlike many other approaches, the DEA method is rather universal because it does not require determining the normability of inputs and outputs. The normability of indicators is one of the most common factors that complicate RIS efficiency analysis [72,73]. When applying DEA modelling, the multidimensional result, which is a linear combination of costs and outputs, is a simplified application, so the initial data for analysis should be carefully selected. Although the interpretation of the outputs of DEA modelling sometimes requires additional expert opinions, this analysis tool yields significant results that can be used to make managerial decisions at the regional level. Thus, the rating of regions can be created by efficiency (to identify leaders), and the reasons behind the lower performance of other subjects can be determined [74].
When studying the issue of effectiveness of RIS subjects based on DEA modelling, it is worth recalling the main limitations [75,76,77]:
Limited set of indicators: In the case of a country-specific RIS study, the model will be limited to the list of indicators collected, which are characteristic of the selected territorial entity. In some cases, indicators related to the same database interpret different sides of the phenomenon but are correlated. In such cases, these indicators should not be excluded from the model; however, it is necessary to consider the correlation between them when interpreting the obtained data;
Uneven development of regions: When evaluating RISs, generalised indicators that characterise the activities of the key subjects are used. In some cases, it is not enough to conclude from the results of the constructed model focusing only on numerical data, because it is important to involve experts in this subject area, since the presence of differentiation in the development of RIS subjects can distort the conclusions;
When using DEA modelling, the model’s specification plays a decisive role, since an erroneous choice of input and output parameters can lead to an incorrect interpretation of the data obtained [75,76,77].
When performing DEA modelling, the standard principle of conducting statistical studies should be followed [78,79]. This paper proposes an algorithm for conducting DEA modelling as shown in Figure 1.
The authors suggested conducting DEA modelling in five stages. Considering the features of each of them, first it is important to define the model parameters, which implies the following:
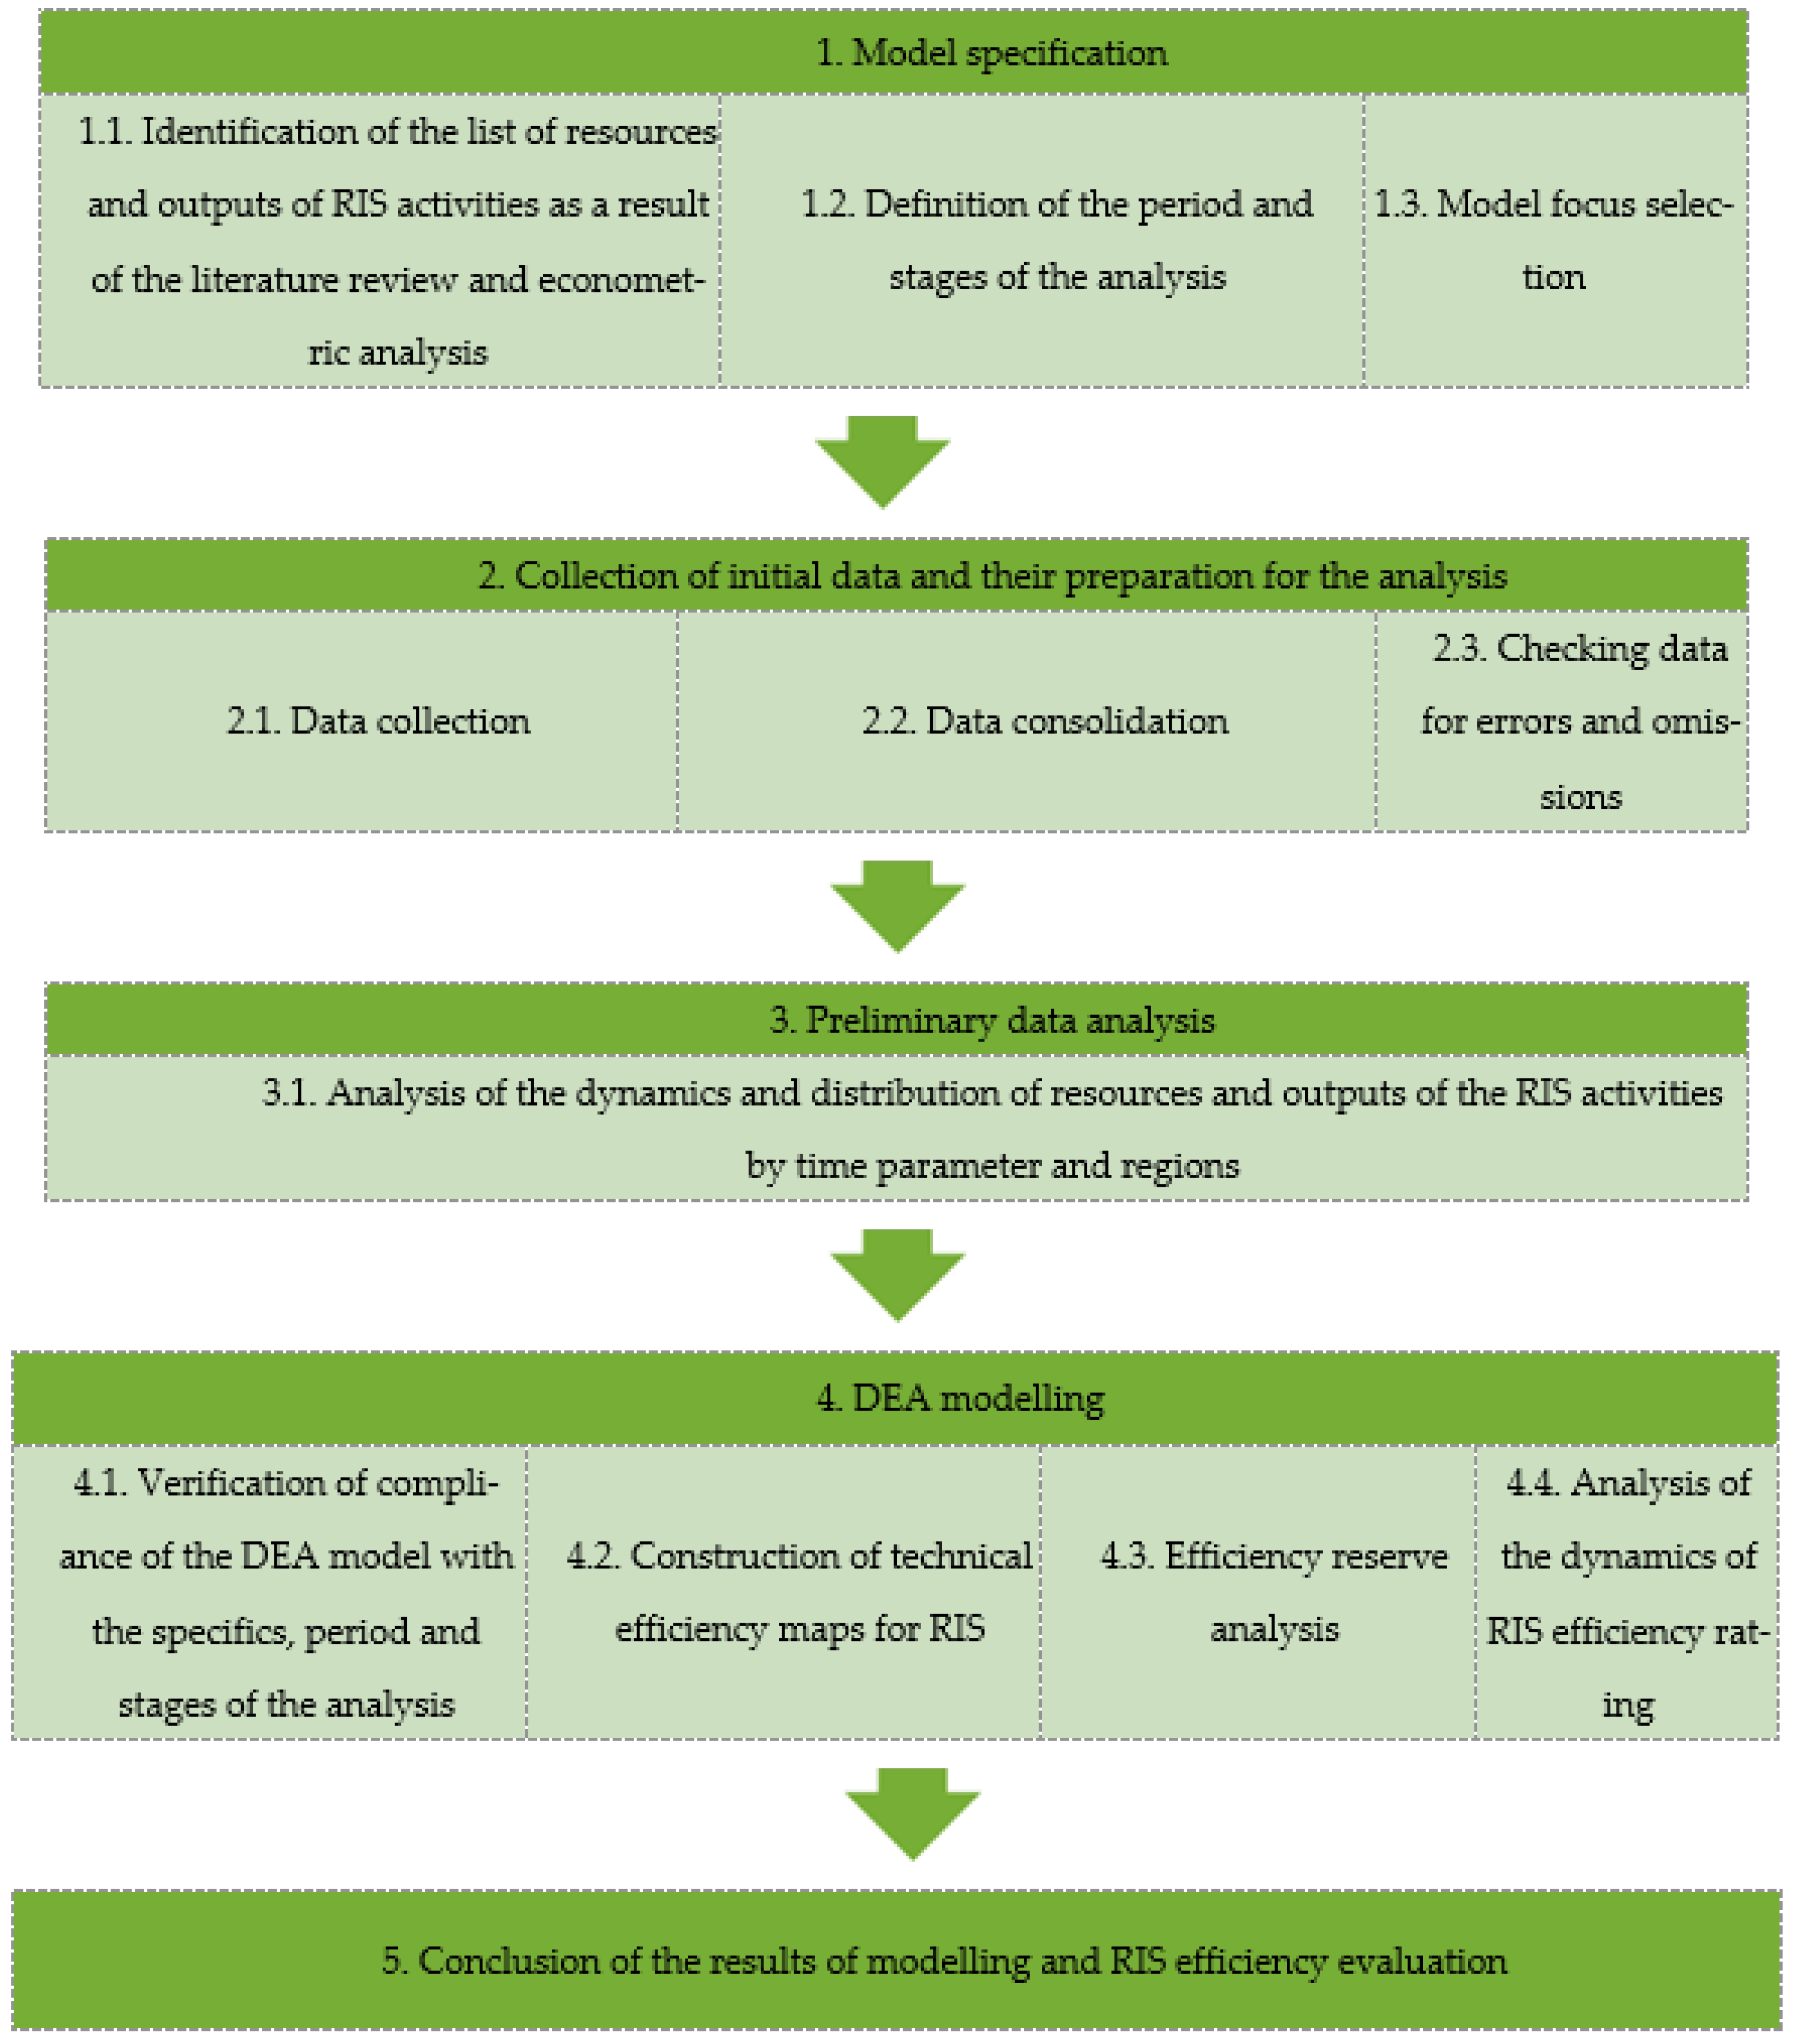
Identification of a list of resources (inputs) and results (outputs). The choice should be justified by the experience of research evaluating the technical effectiveness of RIS activities at the international level. DEA modelling does not require the formulation or testing of hypotheses about the functional relationships among the selected set of variables; however, the authors decided not to ignore this question [63];
Definition of the period and stages of the analysis: DEA modelling is based on the analysis of a set of input and output parameters, which is “particular” for each of the considered years. Thus, although modelling can be performed over a long interval, the model should still be built every year. However, even if such conditions were possible, it is worth determining the analysis stages. In international practice concerning the application of DEA modelling, typically two to three stages are specified, depending on the formulation of the hypothesis. In addition, in most cases, part of the output indicators of one of the stages becomes input data for the next stage. The standard formulation of the DEA analysis task ignores the fact that the condition for achieving the regional innovation production system’s efficiency is often its coordination with other systems—at least, the knowledge production system (science) and the human capital production system (education). Therefore, this point should also be considered when selecting the variables to be analysed [73,80,81];
Model focus selection: In this case, the model can be input- or output-focused. The choice will impact how the results are interpreted further, either in terms of maximising outputs with the given set of inputs or somehow differently [62].
The results of the modelling made it possible to create maps of RIS efficiency for 183 of each of the periods under consideration. It was also necessary to identify efficiency gaps (slacks) that showed opportunity reserves for regions to further transform into specific innovative goods and services. Further analysis of the dynamics of changes in the RIS efficiency rating will reveal intensive or extensive reasons for the changing positions of the regions. When conducting DEA modelling, the StataCorp Stata MP 16.0 software product and the built-in DEA package were used. Thus, this implies not only the detection of key parameters of the model but also the identification of gaps that affect decision-making in the field of regional management [83]. The conclusion, which was based on the results of the analysis, included the detection of reasons for the efficiency gap by region. For example, one of the reasons for weak innovation activity in the region may be low demand for innovative products and an underdeveloped information infrastructure, which makes information on innovative products inaccessible to consumers [84,85].
In analysing RIS efficiency, this problem formulation facilitates a purposeful transfer of additional resources to the region (e.g., subsidies, investments, and grants). In other words, does it make sense to provide additional resources to the region to increase the output of innovative goods, services, knowledge, technologies, etc., or would that be acting sub-optimally; that is, its technological structure should first be improved and only then should the region be provided additional resources [86]. It is also important to identify the model’s focus, the set of indicators to be studied and the analysis period.
1. Identification of the model as input- or output-focused: The DEA model was output-focused, which is explained by the fact that most of the studies evaluating RIS efficiency focus on the final product. The application of an output-focused model also facilitates the definition of current efficiency gaps based on the correspondence between the input resources available and the final product. This efficiency resource is called “slacks” [87,88,89]. Slacks (slacks or input (output) excess) demonstrate “the unused efficiency” of the regions and that part of the resources requires changing inputs (decrease) and outputs (increase) to reach the efficiency limit [90]. They are of two types: output and input. In the first case, a value is assumed that characterises the opportunity to increase the output given with the fixed resource reserve. In the second case, there is a reserve for applying the resource reserve, which will reduce the volume of use without changing the production volume [87]. Slacks can take values from 0 to 1, where zero means that the object researched has no opportunity to increase its efficiency. As part of the analysis of the regional structures of the Russian Federation, this approach can detect unused resource potential [91].
In the case of specific organisations, the presence of slacks is considered a good thing, since the efficiency reserve facilitates an increase in the volume of technological innovations produced; that is, the company will receive additional resources for innovative project activities [92,93]. Slacks can also be used during crises in the market. In this case, efficiency reserves will reduce the negative consequences of unsuccessful project activities [94]. Despite the advantages of having slacks, this process also has a downside. The activities of companies with slacks can be described as inefficient because of their irrational use of available resources [95,96]. It is also important to account for not only the presence of slacks but also their quality. The research object is not always free to use the available reserves of efficiency in terms of their transformation into the final product [97]. Therefore, it is necessary not only to detect the presence of slacks but also to create the conditions required for their implementation [98]. Therefore, an output-focused DEA model should be used;
2. Identification of sources of initial data for analysis: In the DEA methodology, the application of expert assessments is possible but unnecessary, which reduces subjective opinion regarding the analysis being conducted. Thus, official statistical sources should be used. The initial data for analysing the efficiency of the functioning of open innovation systems in the Russian Federation, using DEA methodology, were collected from the official data source—the Report of the Federal State Statistics Service “Regions of Russia. Socioeconomic indicators–2020”. Information was collected on the indicators necessary for building the model, relative to 85 subjects of the Russian Federation;
3. Determination of the indicators to be studied and the analysis period. Many researchers have considered the innovation process in relation to several aspects [70,99,100]:
Consistent performance in research, scientific and technical, production and marketing activities;
Duration of product lifecycle from the origin of the idea to commercialisation;
Availability and use of financial, technological and human resources [70,99,100].
The innovation activity comprises several stages, each of which is part of the overall innovation cycle, although it has many independent processes [101]. The first stage is associated with the process of conducting R&D. In this stage, the idea and current theoretical basis takes the form of a patent, which is defined as “an exclusive right granted for the invention”. Granting patents is the most significant process related to scientific activities, as it allows for the protection of the research/invention until the idea is transformed into the final product. In the second stage, the first details and prototypes of the innovative product are manufactured and tested. In the third stage, a full-fledged production process is launched, the sense of which is technological support for creating the finished product. In this stage, the interaction between the scientific and industrial elements of the activity occurs. The timing of the new product’s development and its introduction into the market as well as its competitive advantages will depend on the success of the organisation of this interaction. In the final stage, the products are sold and begin to be used by the consumer segment of the market [102,103].
Regarding the innovation process, it is worth focusing on the need for the final stages of one innovation process to facilitate the emergence of the initial stages of another innovation process. The importance of this condition is attributed to the fact that its implementation facilitates the organisation of a continuous development process and the production of innovations that will be highly competitive in the marketplace [104,105]. The creation of a particular innovative product does not always involve the process of filing a patent and then commercialising it. For example, an organisation might not even attempt to obtain a patent for its invention but only markets the finished product. However, the authors in this article assumed that all patents granted were converted into final products. The choice of this condition is associated with the specifics of innovative activity in the Russian Federation and a limited set of indicators. For example, in Russia, innovative development programs began to be approved not so long ago; thus, in many cases, an extensive set of indicators characterising the innovative development of subjects is available only for a period of no more than two years. According to the theory of Kondratiev cycles and research on this topic, it can be conditionally argued that an innovation process lasts, on average, from seven to ten years [106,107,108]. Since it was planned to analyse an RIS, the impact of many stages is difficult or almost impossible to define. In connection with this, obtaining the innovative product at the regional level can be broadly divided into two stages: developing an innovative solution and transforming it into the patent and the process of converting the patent into the final material form [109,110]. Overall, these stages last for six years, with each stage lasting for three years [104,105]. For the proposed model, the period from 2014 to 2019 was considered (Table 3). Thus, we identified the parameters that allowed us to assess the RIS activities in a country with a transition economy, accounting for the transition to open innovation systems. The proposed model is based on the premise of translating patent activity into specific goods and services.
The choice of variables presented in Table 3 is based on the literature review. Thus, the variables most commonly used in the articles for model construction were selected and adjusted following the RIS specifics in Russia. When choosing indicators, the authors faced many limitations:
Many variables used in international practice were not present in the statistical databases of the Russian Federation;
Some variables were correlated but could not be excluded from the analysis, since they described different parts of the same phenomenon (Table 4).
As part of the first stage of the RIS, the resource component (x) for creating a patent is the personnel and finance associated with R&D. Thus, for the first stage, the following variables are used as input data (x): organisations to perform R&D (units), internal costs for R&D (million roubles) and the number of personnel engaged in R&D (persons). As output data (y), issuance of patents in Russia (qty.) is considered. The second stage is related to the production of innovative goods and services. Therefore, it is advisable to consider how efficiently regions use the costs associated with technological innovations to create the final product. The input data for this stage (x) are the issuance of patents in Russia (qty.) and the costs for technological innovations (millions of roubles (RUB)). The output data (y) are the volume of innovative goods, works and services (millions of roubles (RUB)).
Outputs: In considering the possibility of using different indicators in DEA modelling, there is no need to formulate or test hypotheses about the functional relationships between the input and output parameters or a correlation between them, unlike the requirements for regression analysis. Nevertheless, it is important to prove that the selected variables are interrelated. For this purpose, we built regressions for both stages. For the first stage, the significance of the variables corresponded to the 0.05 level in two out of the three cases. This means that the selected indicators explain the y parameter.
The data in Table 4 confirm a statistical relationship between the variables relative to each of the modelling steps. The correlation between the variables was analysed using the VIF command. The normative value of this indicator should not exceed 10. The high-level correlation between the variables used in the first stage of modelling can be explained by the fact that these values are somehow related. For example, the indicator of internal costs for R&D includes expenses for researchers’ salaries. Thus, in the first stage, paired regressions were built for the output parameter and for each input datapoint. Carrying out this analysis for the second stage, all indicators were significant. Next, we analysed the correlations between them. Then, we analysed the correlations between them. If VIF does not exceed the normative values, the indicators will not be correlated. When using the output-focused DEA model, a specific set of input variables (x) is converted into one output (y). Considering this condition and the fact that when analysing data for the subjects of the Russian Federation, the data change every year and are reflected in reports on official resources, it is worth building the DEA model for each year.

4. Results

Before starting the modelling, it was necessary to analyse the descriptive statistics for resource allocation by region in the Russian Federation.
Following paragraph 1, the model being developed comprised two stages; therefore, the resource allocation should also be considered in terms of two time periods:
  • 2014–2016;
  • 2017–2019.
The initial data for some indicators and years were partly missing, which was attributed to the following two reasons: no data were collected for the region in question or the data were unavailable because of commercial confidentiality.
At this stage, we considered the distribution of the model’s input parameters for the first stage relative to the regions of the Russian Federation. In the first stage, the resource characterising the financial component of the patent creation process is an indicator of internal costs for R&D (vtz). From 2014 to 2016, the vtz volume increased by RUB 96,226.5 million, or 11.37%.
Table 5 presents the list of the top 10 regions with the highest vtz for 2014–2016.
The data in Table 5 indicate that Moscow, Moscow Region, St. Petersburg, Nizhny Novgorod Region, Sverdlovsk Region and Novosibirsk Region consistently occupied the first six positions in terms of vtz.
The indicator of the number of organisations that have carried out R&D are shown in Table 6.
The opsrd indicator describes organisations that have carried out R&D. The opsrd value increased by 428 units, or 11.87%, from 2014 to 2016.
Only the first three positions in the rating remained unchanged (i.e., Moscow, St. Petersburg and Moscow Region). A significant increase in the number of organisations performing R&D in Krasnodar Krai is worth noting. This region improved its position from tenth to sixth between 2014 and 2016 (1.83% compared to 2.60%).
Then, the distribution of human resources engaged in R&D were analysed (Table 7).
The number of scientific staff members decreased by 9726 people (−1.33%) from 2014 to 2016.
The next stage was building the rating for the top 10 regions with the highest res_hum indicator for 2014–2016. Moscow, Moscow Region, St. Petersburg and Nizhny Novgorod Region consistently occupied the first four rating lines for the entire period under review.
Analysing the distribution of the output parameters in the model’s first stage, the output parameter patent decreased by 5838 (−16.52%) from 2014 to 2016. The ratings of the 10 largest regions by the number of patents granted for the period under review are presented in Table 8.
As shown in Table 8, the overall situation was stable. However, although Moscow occupied the first position in terms of the patent indicator for the entire period, there was a sharp drop from 2014 to 2015 (by a total of 10%), returning to the previous value in 2016.
Next, we analysed the input and output data of the second stage associated with the manufacturing of innovative goods and services.
To begin with, we considered the number of patents granted that might become innovative goods and services in the future (Table 9). Regarding the number of patents granted, there was a negative trend from 2016 to 2019: they decreased by 945 (−3.21%).
We identified the 10 regions with the highest number of patents granted for the period under review (Table 9). From 2016 to 2019, the number of patents granted was distributed relatively evenly among the top 10; however, there were many cases in which the regions changed their position by several points. Thus, improvement in rank was observed in the Novosibirsk Region (from tenth to seventh position) and Sverdlovsk Region (from seventh to fifth position), and a drop in rank was observed in the Rostov Region (from sixth to tenth position).
Next, we considered how the input parameter in the second stage of modelling, namely, the cost of technological innovations (millions of roubles (RUB)), was distributed. The cost distribution for technological innovations, together with the patents granted, further determines the potential number of readymade innovative solutions to be presented on the market.
The cost of technological innovations increased by RUB 549,541.8 million (+34.74%). The significant rise in this parameter is attributable to the fact that, in 2017, many regulatory documents aimed at developing the area of innovative production and information and communication technologies were approved (e.g., one dated 28 July 2017, No 1632-r, on the approval of the Digital Economy of the Russian Federation program).
We consider the cost distribution for technological innovations in the top 10 regions in terms of their % of total (Table 10).
The costs of technological innovation for 2017–2019 led to the following shifts in position: St. Petersburg (from second to fourth position), Nizhny Novgorod Region (from fourth to second position) and Moscow Region (from fifth to third position). Compared to all previously considered indicators, only cfti included other regions as well in the top three, not just Moscow, Moscow Region and St. Petersburg.
We analysed the distribution of the output parameter in the second stage of the model (Table 11). The volume of innovative goods, works and services reached the value of RUB 4,951,955 million by 2019, which was RUB 696,263.6 million (16.36%) more than that in 2017. Unlike the previous lists of regions with the largest share of the indicator of the total volume of the resource, in relation to qing, Moscow did not occupy the first position for the period under review. Thus, not all resource opportunities were used efficiently in this region, which can be proved by analysing the results obtained from the DEA model. The Republic of Tatarstan has become the leading subject of the Russian Federation in the production of innovative goods and services (it occupies first place in the ratings).
According to the previously presented data, the leaders’ terms of available resources were, in the first instance, Moscow, the city of St. Petersburg and Moscow Region. This is explained by the fact that these are the largest scientific centres and, consequently, patent activity is much higher there. Additionally, the high level of financial support provided by the state for these subjects of the Russian Federation should be kept in mind. Moreover, a high concentration of resources within a particular territorial entity should not be taken to indicate that they will be used efficiently. Therefore, it is necessary to analyse RIS efficiency to reveal the qualitative aspect of resource expenditure.
When building the DEA model and further interpreting the results obtained, it is worth considering the following limitations:
A set of indicators was selected by accounting for the specifics of innovative development programs in the Russian Federation. This is because further strategies for the operation of both commercial and budgetary organisations are being designed, depending on which direction of innovative development is established by the state institutions according to the regulatory documents. The innovative development strategies established at the moment affect not only the behaviour of RIS entities but also the presence of indicators in statistical databases and the period for which they are available for collection [111,112,113];
In the model, conditionally, all patents obtained were completely converted into specific innovative goods and services, and all organisations that carried out R&D were engaged in patent activity. This limitation is attributed to the fact that Russia is just beginning the transition to innovative economic activity. Therefore, such an assumption will determine how effectively measures related to the development of patent activity in Russia are being implemented [114,115,116].
The results of DEA modelling for the last period of the first stage (2016) are presented in Figure 2.
This map makes it possible to see regions with the highest level of RIS efficiency related to patent activity. They are the Ivanovo Region (1), Kursk Region (1), the Republic of Mari El (1), Kostroma Region (0.8604), Khanty-Mansi Autonomous Okrug (0.8561), Belgorod Region (0.8358) and Voronezh Region (0.8109).
Next, we analysed the performance rating map of RISs for 2019 (the last period of the second stage of the analysis) (Figure 3).
According to Figure 3, the highest level of efficiency in innovation activity in the production of goods and services was found in the Murmansk Region (1), Tyumen Region (1), Lipetsk Region (0.8833), Sakhalin Region (0.7629) and Yamalo-Nenets Autonomous Okrug (0.7141).
The next step was to consider the changing trends in the efficiency of the regional innovation systems of the Russian Federation. For this purpose, we calculated the compound annual growth rate (CAGR) indicator, which is expressed as a ratio and shows that the percentage change in the studied parameter increases over the year. First, we identified the regions with the highest positive and negative CAGR values. Positive CAGR, with a value exceeding 10%: Sakhalin Region 128.13%; the Republic of Adygea 113.98%; the Republic of Altai 84.65%; Murmansk Region 67.16%; Kamchatka Krai 57.63%; Khanty-Mansi Autonomous Okrug–Yugra 47.09%; the Republic of Tyva 45.27%; Tyumen Region 35.33%; the Komi Republic 33.67%; the Republic of Mordovia 29.66%; Smolensk Region 29.08%; Lipetsk Region 28.69%; the Republic of Ingushetia 26.53%.
Negative CAGR, with a value exceeding 20%: Novosibirsk Region 20.07%; Altai Krai 21.15%; Kostroma Region 21.28%; Ulyanovsk Region 21.46%; Irkutsk Region 21.69%; the Republic of Mari El 22.71%; Voronezh Region 22.91%; Trans-Baikal Krai 23.60%; Kursk Region 24.07%; Saratov Region 26.23%; Kemerovo Region 26.35%; Novgorod Region 27.67%; Ivanovo Region 28.33 Omsk Region 31.36%; Tomsk Region 31.69%; the city of Moscow 32.73%; Amur Region 35.42%; Astrakhan Region 36.00%; the Republic of Crimea 36.23%; Republic of North Ossetia–Alania 36.87%; Kaliningrad Region 43.07%; the Chechen Republic 49.69%; the Kabardino-Balkar Republic 50.54%; Sevastopol 53.28%; the Republic of Dagestan 53.64%. Magadan Region (92.74%) and the Jewish Autonomous Region (−30.67%) were excluded from the lists, as for these regions, data for only two periods instead of the required five were available.
After identifying the largest deviations in the indicator of RIS efficiency, it was necessary to define the reason for this situation. The change in the indicator can be caused by extensive (due to the increase in resources) and intensive (due to the increase in the performance parameter) reasons. The efficient use of resources can be detected by calculating “slacks”. Slacks are a standard element in the DEA model and show whether the available resources are fully intended to obtain the final product or whether there are efficiency reserves. For instance, we considered the value of slacks for the first and second stages of building the model for each input indicator. In this study, an output-focused model was used that aimed at maximising the output parameter with the constant value of inputs. Therefore, the indicator of incoming slacks by parameter will reveal how much the input can be reduced to obtain the same result at the output and indicate the efficiency reserve.
According to the parameters in the first stage of 2016 (10 regions with the highest value), the incoming slacks’ size can be seen in Figure 4, Figure 5 and Figure 6.
Thus, there was an efficiency reserve in terms of funds for R&D: RUB 132,624 million for 2016; RUB 101,786 million for 2015; RUB 173,980 million for 2014, which can be converted into patents in the future. Moscow has the largest reserve of efficiency for patents.
Consequently, there is a reserve of human resources engaged in R&D that can be deployed for research activities; in Moscow, the number was 117,570 people in 2016; 56,045 people in 2015; 131,076 in 2014.
Two additional R&D organisations might be involved in scientific projects in the Lipetsk Region in 2014, 2015 and 2016.
We analysed slacks for the second stage of the DEA modelling (see Appendix A). The largest amount of incoming slacks in terms of patent issuance in Russia was observed in the Republic of North Ossetia-Alania. Therefore, only three patents were issued in 2019. In 2018, the slacks achieved their maximum values in the Kursk Region (152 more patents could be issued), and in 2017, 60 patents could be issued for the same region. In cases where there were slacks in the number of patents granted due to the fact of certain circumstances, the developed models of intellectual property could not acquire the material form of the finished product.
According to the indicator of incoming slacks, relative to the costs for technological innovations, the Nizhny Novgorod Region became the leader in 2019 with a value of RUB 58,199 million; in 2018, the Republic of Tatarstan became the leader, with RUB 40,945 million; in 2017, Khanty-Mansi Autonomous Okrug–Yugra became the leader, with RUB 32,118 million.
Thus, the proposed version for estimating RISs facilitates the identification of the following parameters for each object considered:
A performance indicator;
Rankings including all subjects of the Russian Federation;
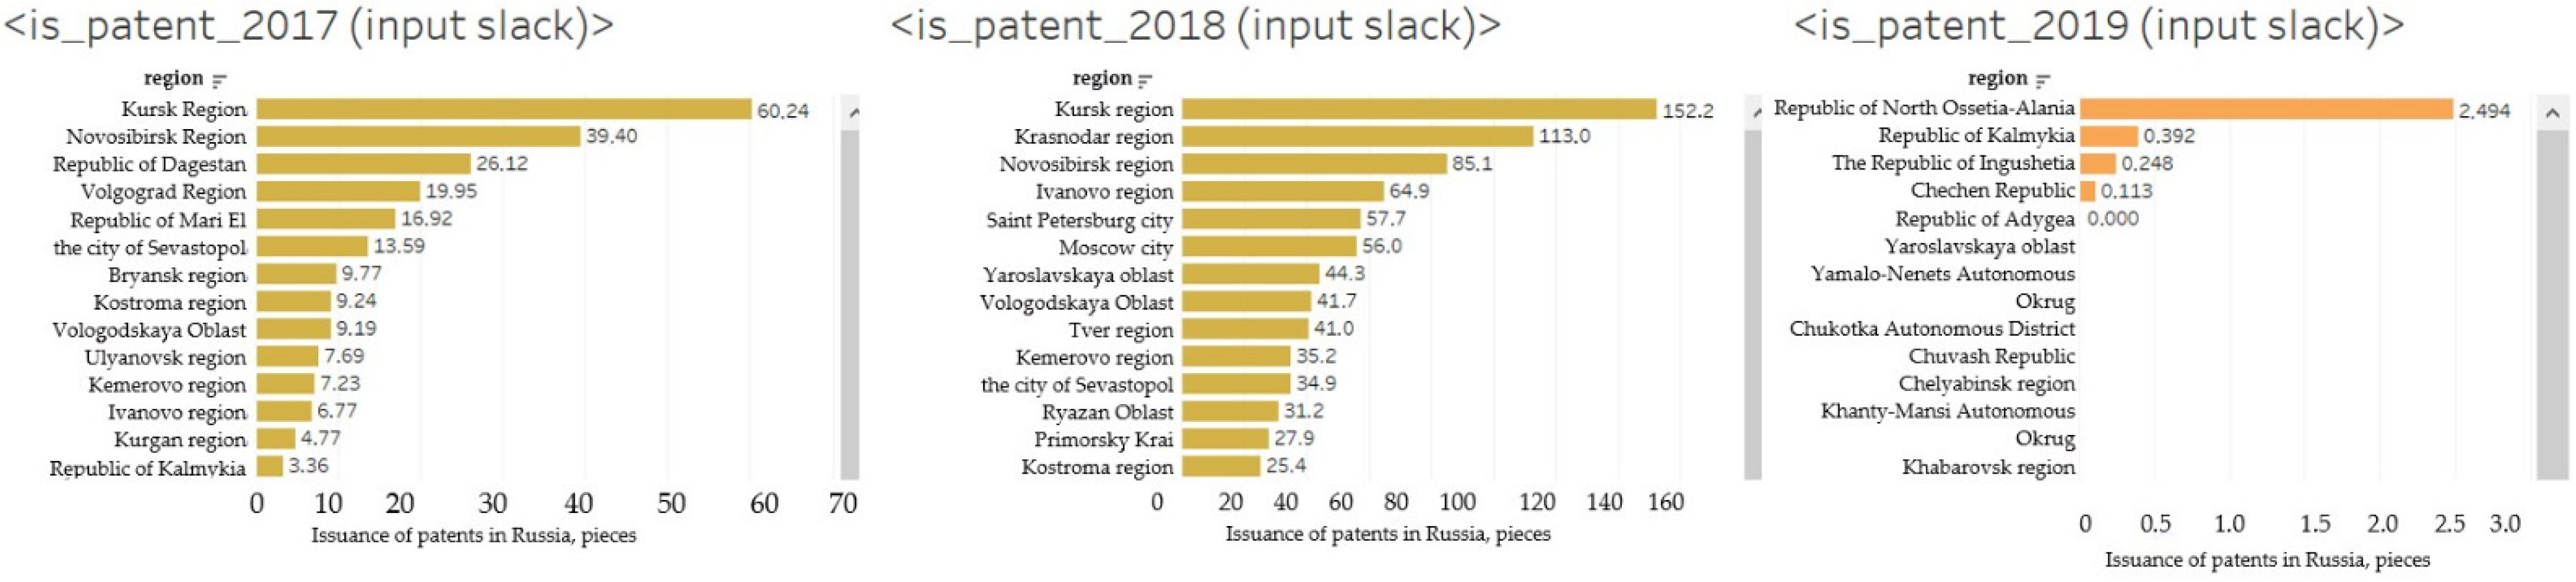
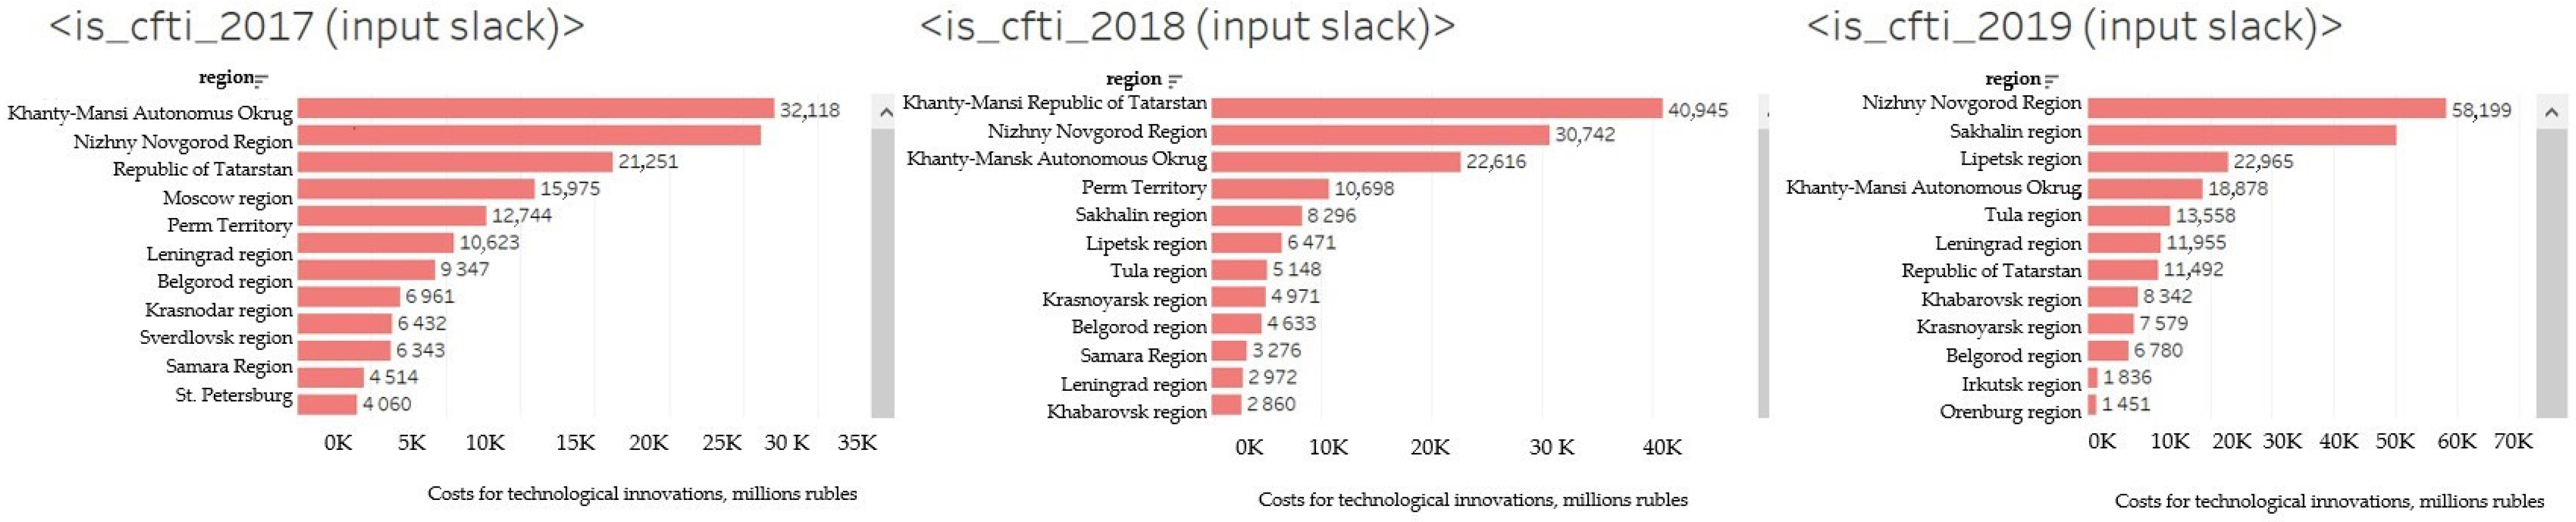
The value of incoming slacks describing efficiency reserves. This parameter enables the redistribution of the financial and human resources involved in creating innovative goods and services among the subjects of the Russian Federation in the most efficient manner possible. Furthermore, slacks can partially explain the possible intensive reasons for changes in the ranking of RIS efficiency in the Russian Federation.
Data by indicators can be used to identify the intensive or extensive reasons for changing the RIS ranking.

5. Discussion

The proposed model characterises the translation of patent activity into a specific number of innovative goods and services. However, in some countries with transition economies, it is too early to discuss the concepts of “open innovations” and “innovativeness”. This is mainly because their institutional environment is not sufficiently developed to implement these concepts. On the one hand, this is because the transition from a planned economy to a market economy has destroyed the established ties among scientific, educational and real sector organisations [117]. At the same time, the market institutions formed in Russia are not working effectively. This is because the results of fundamental scientific research cannot be instantly converted into final goods and services. This is especially important given the unstable economic situation in the country, where the long-term planning horizon is often less than a year. Under these conditions, neither scientific organisations nor organisations in the real sector know what form of interaction will turn out to be efficient. This picture can be seen most clearly in inefficient regions [118,119,120].
The construction of performance maps facilitated the identification of the following pattern: the regions that occupy leading positions in relation to the issued patents do not always produce larger quantities of innovative products compared to other subjects. For example, the Murmansk Region presented a relatively low level for the first stage (0.0880) but showed the greatest efficiency in the second stage (1.000). Thus, the Murmansk Region has become a leader in the efficiency of resource use for producing innovative goods and services. In contrast, the opposite situation can be observed. This might mean, for example, the availability of a reserve of resources that can be directed to an additional scope of work related to innovative developments. From the viewpoint of management activities, it might be necessary to implement a policy in this region to build an effective system of interaction between participants in innovative activities. Consequently, further analysis is required to identify the possible causes of the situation.
Thus, this study can aid in attracting additional attention from the international scientific community to develop the theory of assessing RIS effectiveness in the context of open innovations in countries with transition economies.
Many researchers have discussed the issue of innovative regional development but have paid less attention to open innovations. For example, Zemtsov [121] used the model with the patent activity output parameter but arrived at different results regarding the ranking. This can be explained by the fact that Zemtsov’s model focused only on patent activity, while this study used a two-stage algorithm. In addition, different time intervals were considered; therefore, other internal and external conditions influenced the functioning of the economic agents. In addition, Zemtsov considered the period before implementing the national program to develop the digital economy (since 2017). Many DEA models focus on patents when analysing the efficiency of regional structures.
When considering the results of the second stage of modelling, we should focus on Suprun et al.’s [122] study in which innovation activities were researched in terms of the production of innovative goods and service output parameters. The authors used a different model but focused on the presence of the nonlinear relationships between the level of attractiveness of innovations and those of administrative barriers, state support and business efficiency in the industry, which confirms the need to implement innovative goods and services concerning the concept of open innovations, proving the theses proposed in this article.
The importance of state support for the implementation of innovative activities and the establishment of an efficient system of interaction among economic agents were also indicated by Zhang [123], Sholeh [124] and other authors [4,116,117,125,126].
When applying descriptive statistics of resource allocation, the regions with the highest concentration of innovative opportunities were evidently the federal cities of St. Petersburg and Moscow. However, as mentioned above, this resource availability does not always lead to a high level of innovative production [127,128,129].

6. Conclusions

In this article, the authors considered the issue of assessing RIS effectiveness in the context of the shift from a transition economy to open innovations. It was clarified that the development of the approach to open innovations in countries with transition economies would draw the attention of innovation system participants towards the importance of establishing mechanisms for interactions with each other. First, this model helps identify efficiency reserves in the subjects, and the information obtained can be used to design measures for developing RISs.
The development of the open innovation concept affects the activities of key economic subjects, even in countries with transition economies. For example, building an innovation ecosystem implies creating a relationship between the network of companies and organisations aimed at joint development within the current set of technological, information and other resources through the creation and implementation of new products and services. Universities are the core link in innovative ecosystems. The effectiveness of the science and education sector determines its capability to address the tasks facing the ecosystem. The creation and implementation of advanced solutions within open innovation systems will efficiently redistribute the available resources among the participants and obtain the best quality characteristics of the finished products.
In assessing RIS efficiency in a transition economy, the authors propose the DEA model, which is associated with identifying reference regions in terms of efficiency, with which the rest of the objects to be analysed will be compared. The further other regions are removed from the reference regions, the less effectively they will use their capabilities. This approach is based on the theoretical provisions of the concept of an “ideal” system.
This model assumes that all organisations that have carried out R&D create patents, all of which are converted into specific innovative goods and services. The authors chose this approach because in the transition to a market economy, it is important to focus on the interaction between scientific organisations and businesses. Currently, in countries with transition economies, some barriers prevent further innovative development, such as cultural barriers and information secrecy. In this case, it is important to find a common goal, depending on which model of participant behaviour in the system will be designed. The turnover of patents into specific goods and services can become such an element. Establishing an effective system of interaction between the scientific and commercial sectors of the economy is possible only under the conditions of open innovations, when the information exchange is freely carried out between the system’s participants, without restrictions. In addition, the effective use of resources was detected by calculating the slacks. When using the DEA model, slacks are standard components that show whether any available resources are fully deployed to produce the final product or whether there are efficiency reserves.
In the process of the analysis, the authors identified many patterns:
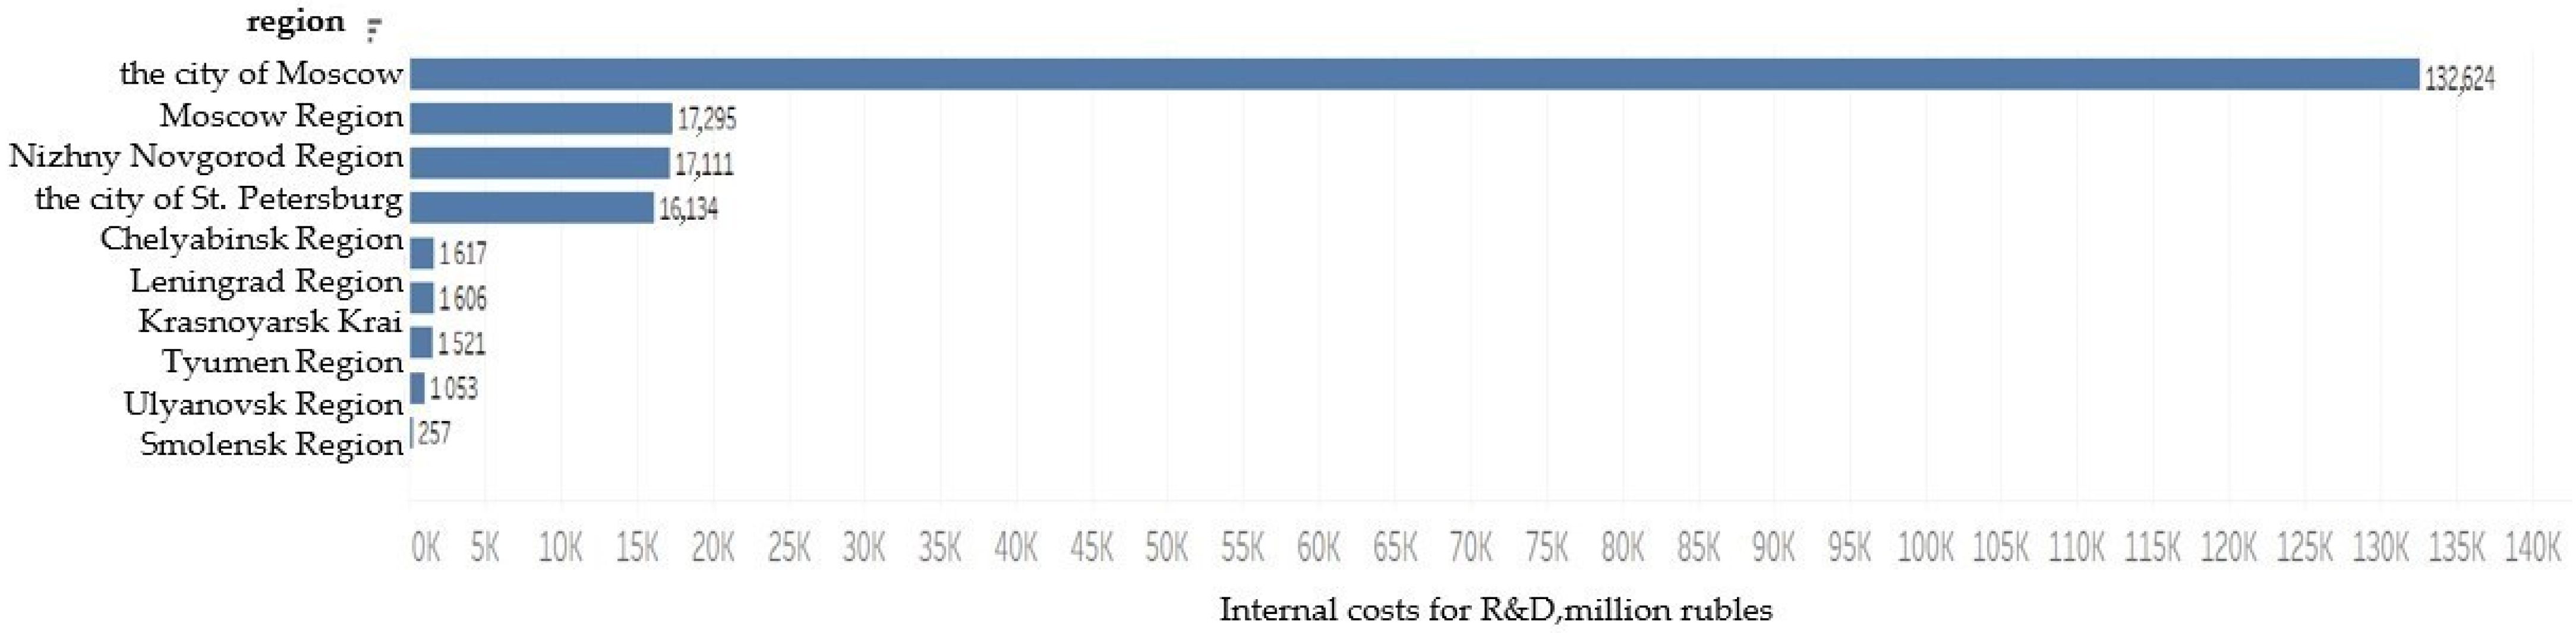
The presence of large quantities of available resources did not always imply their highly efficient use. For example, regions such as Moscow and St. Petersburg are scientific centres in Russia and aggregate several intellectual and technological capabilities but have a high level of slack. This indicates the need to establish a more effective management system for the competent use of available additional opportunities;
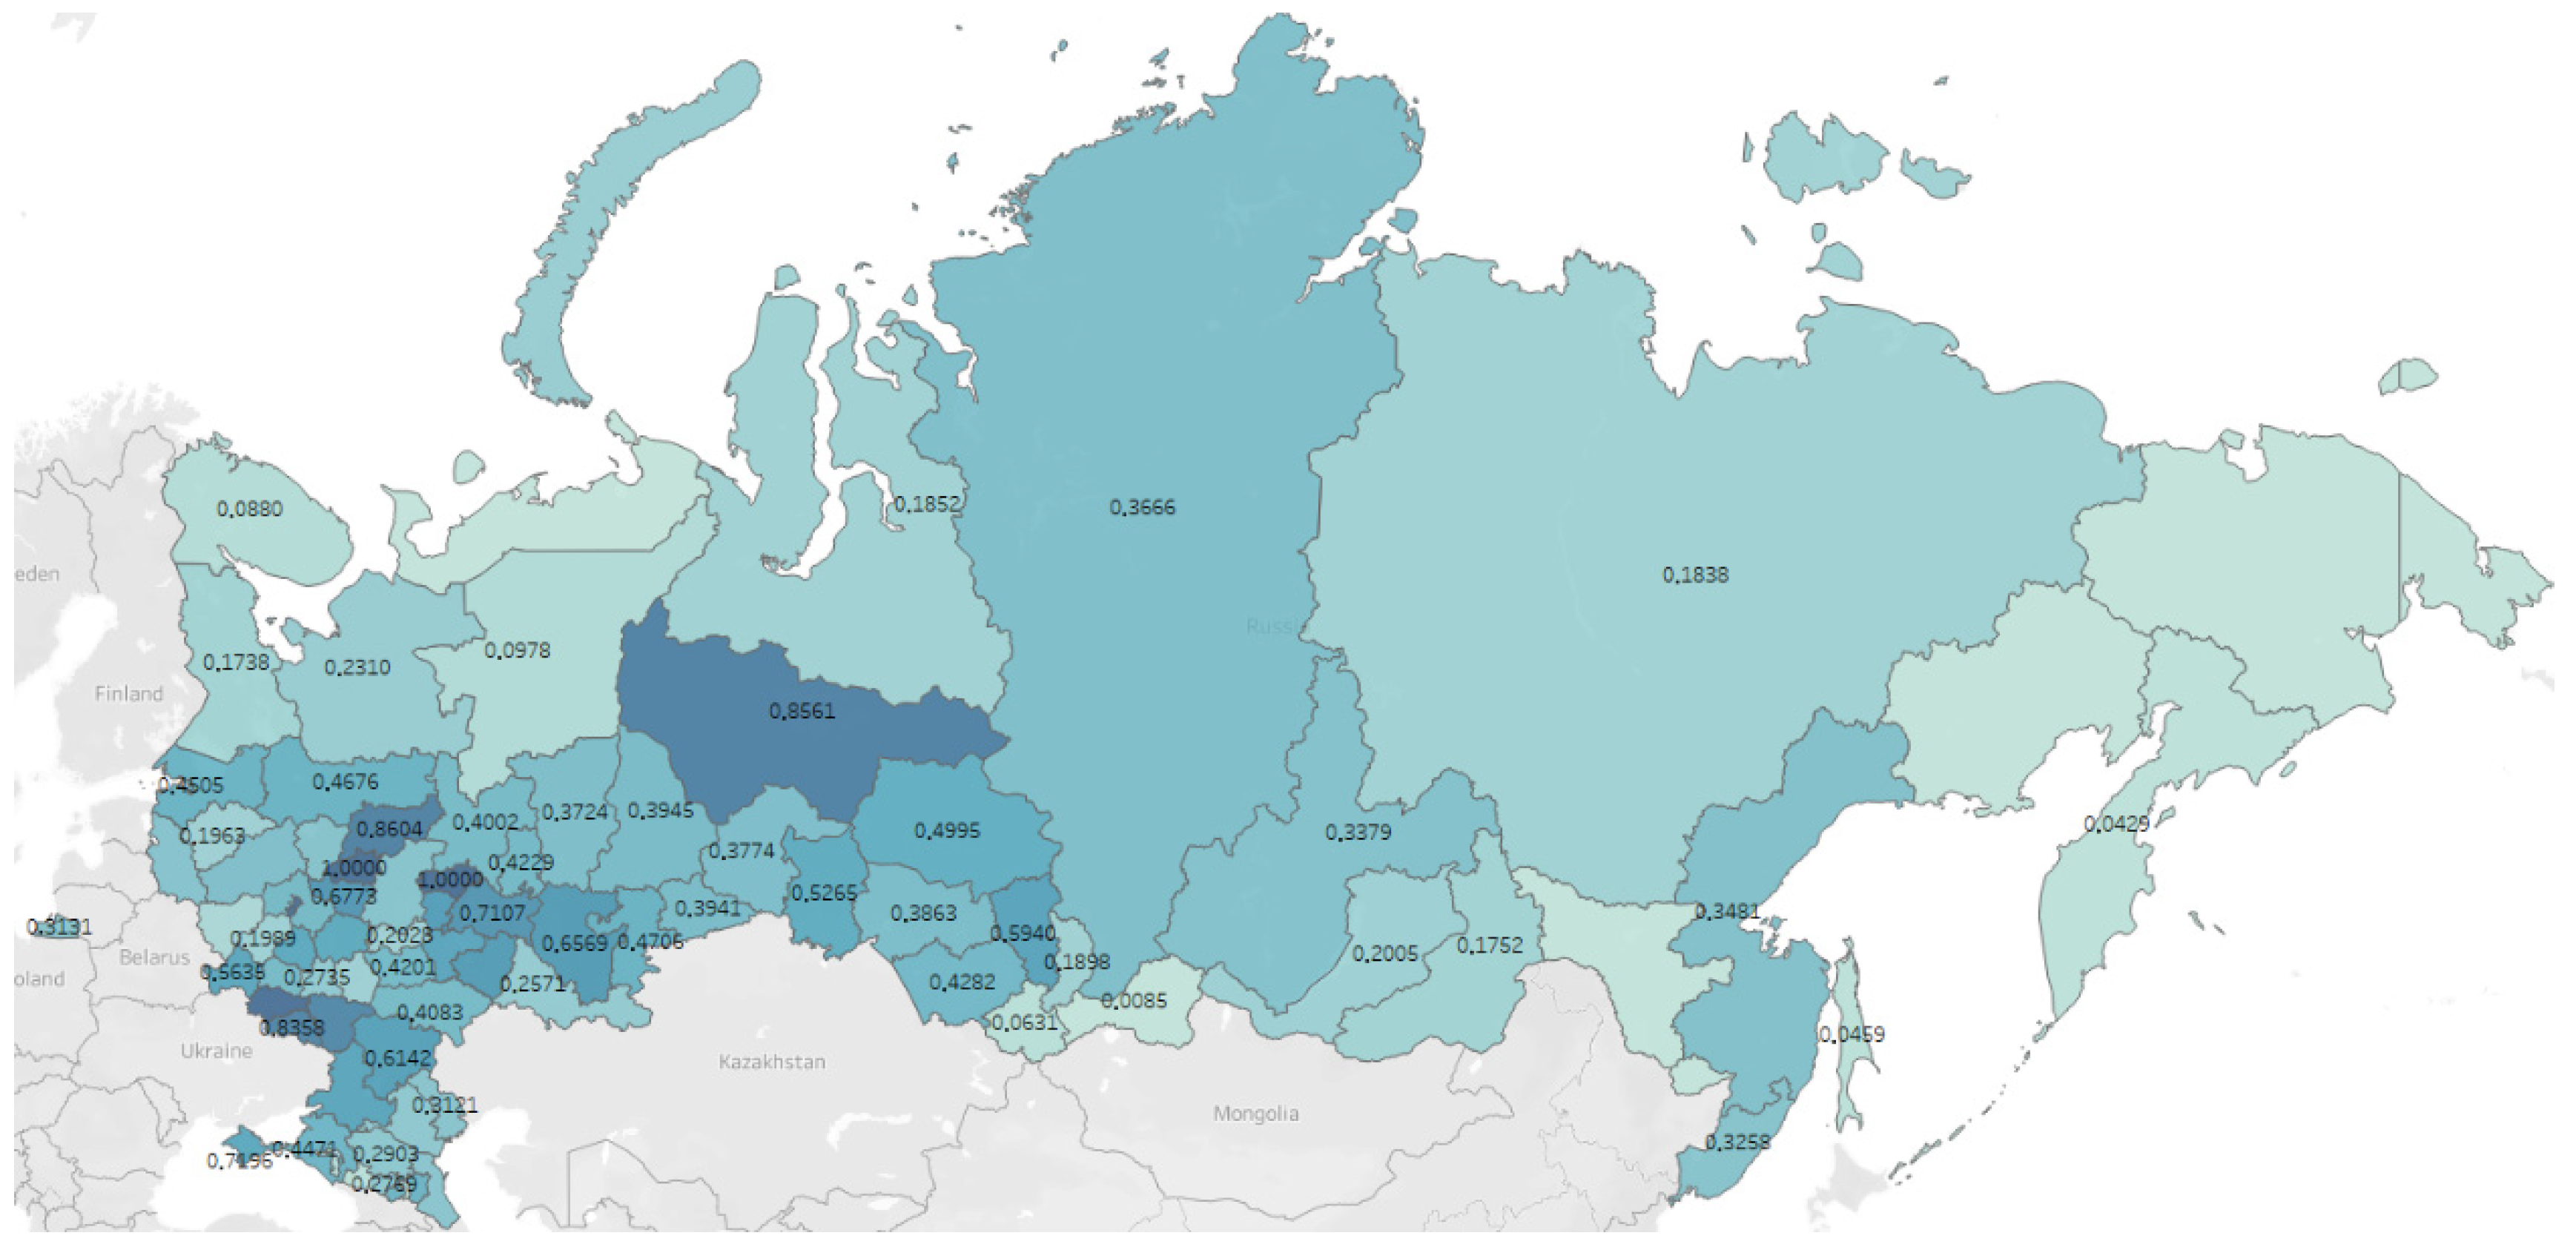
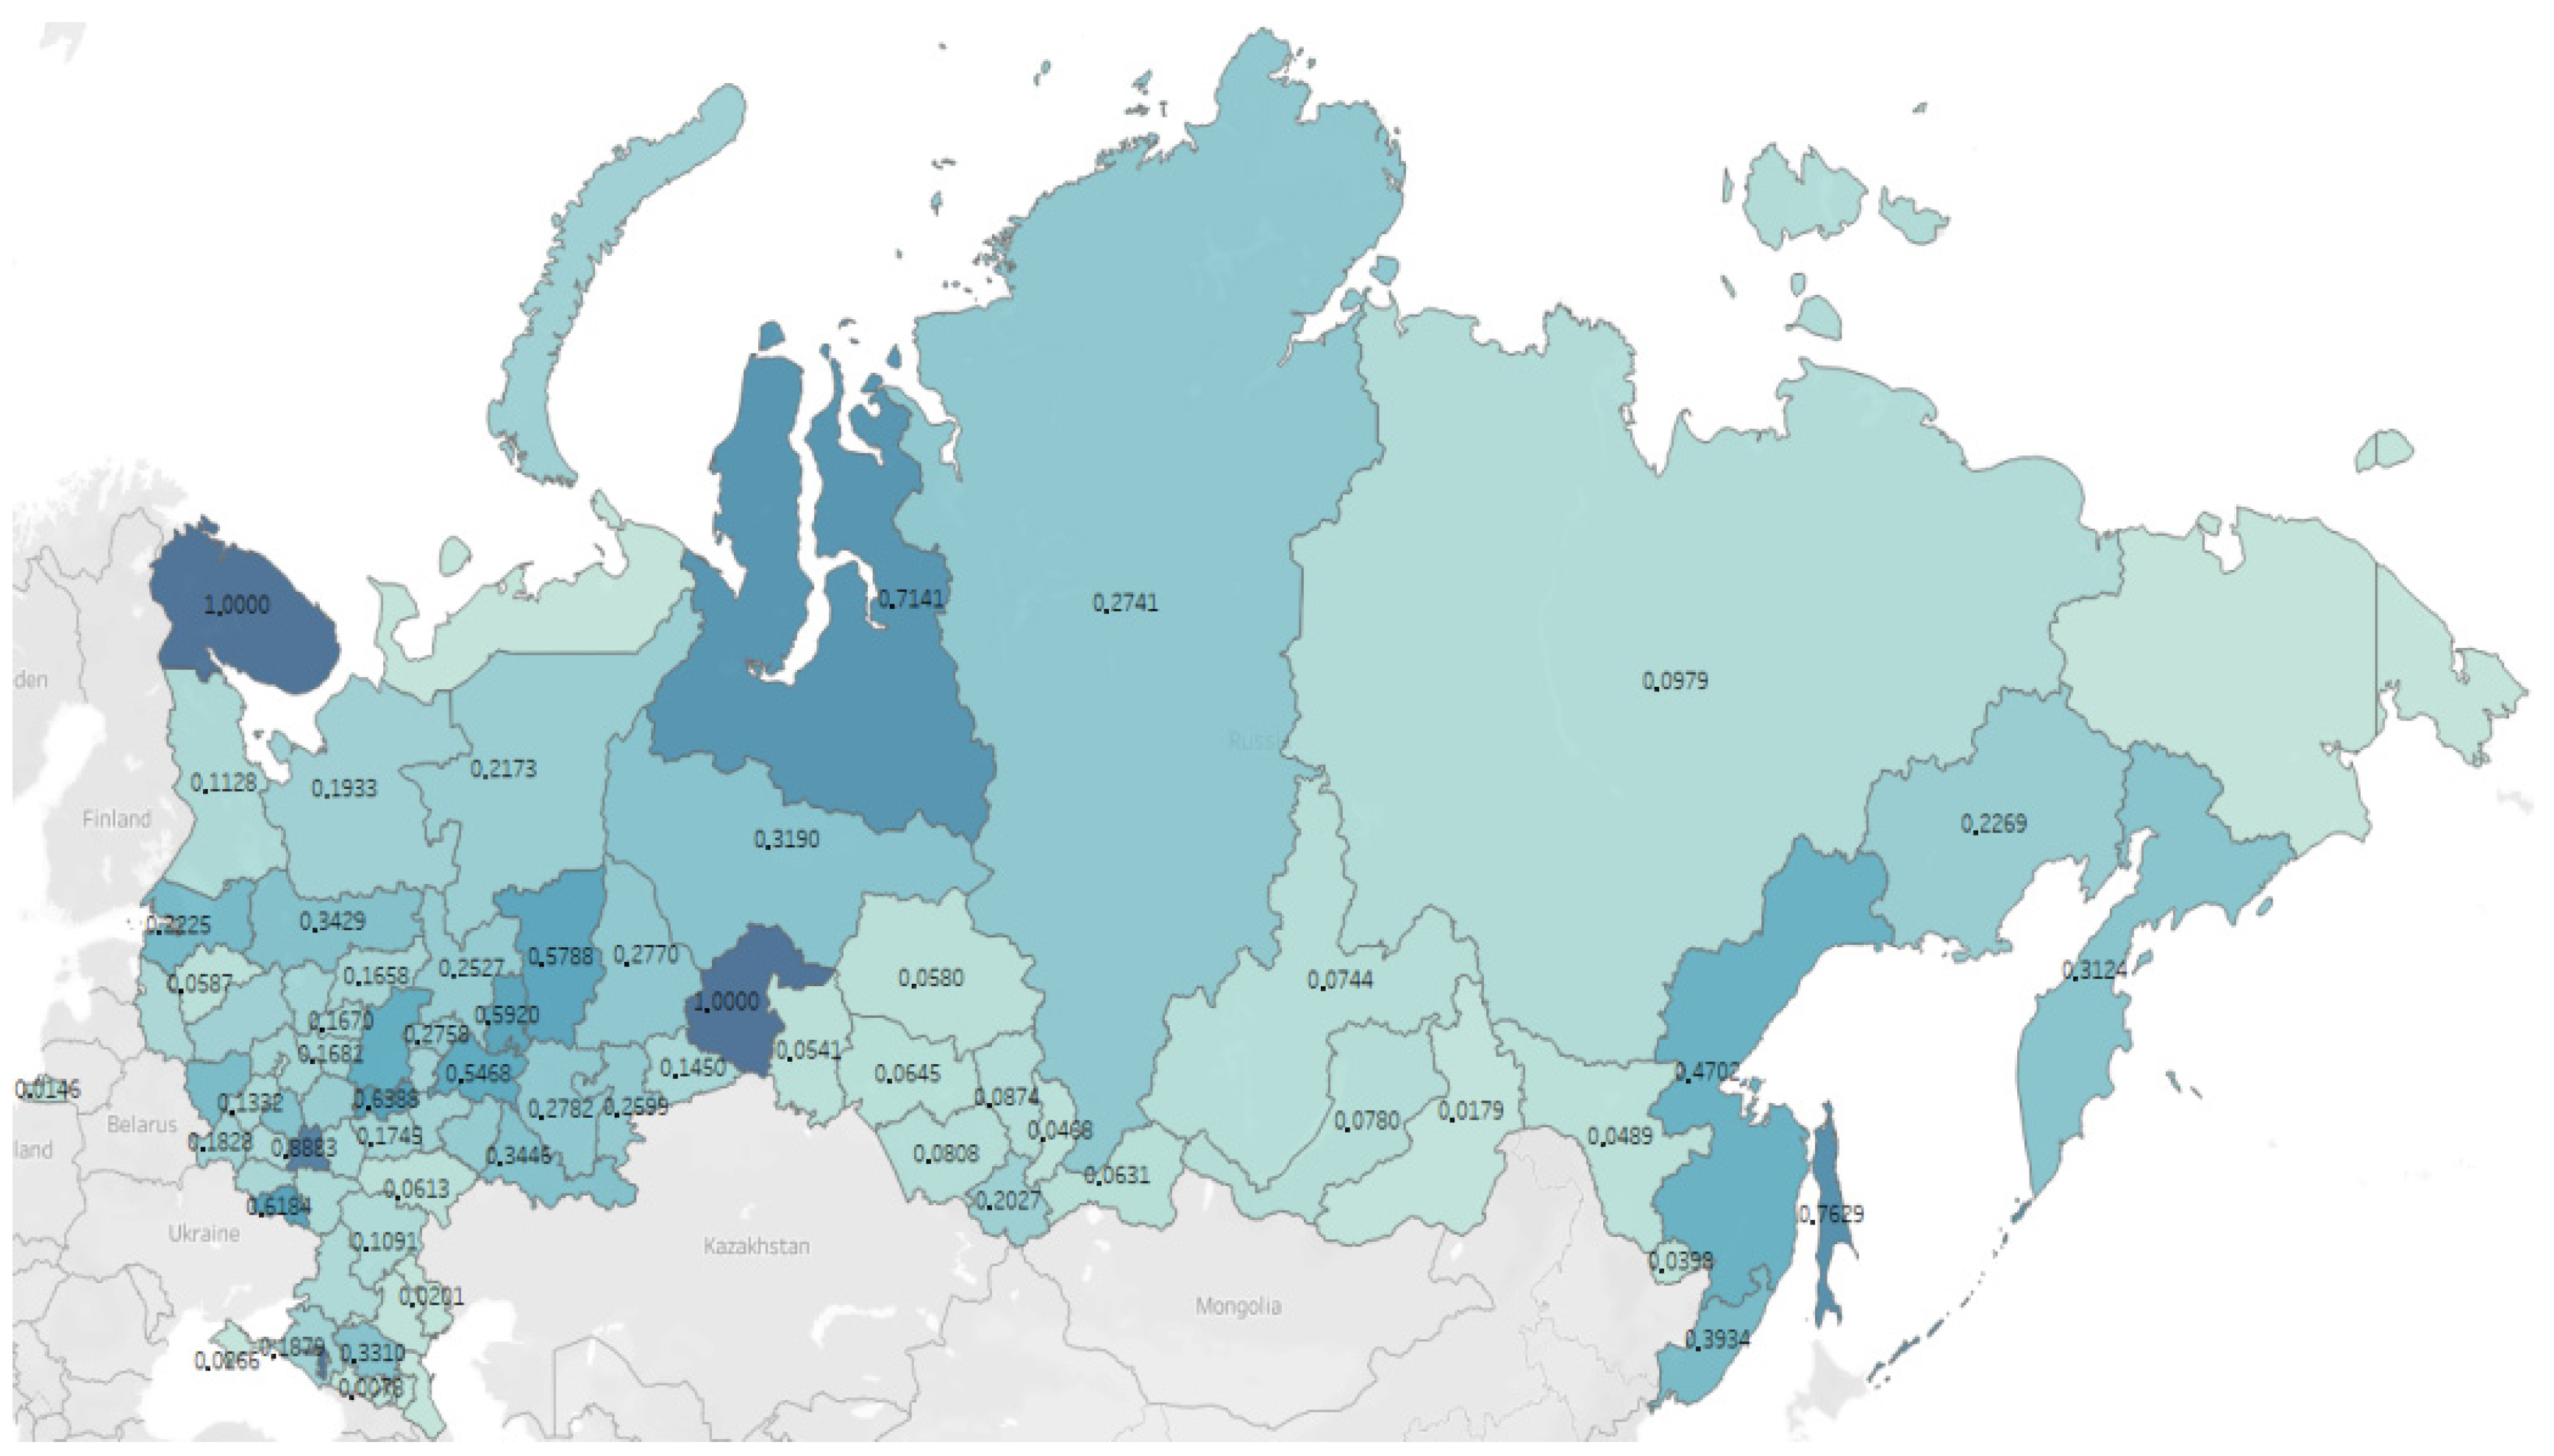
Regions that have fewer resources compared to other subjects can show high results in the process of creating innovative products. For example, the Murmansk Region did not belong to the top 10 regions in terms of available resources for the entire period under consideration but showed highly innovative production (1.000).
With a high level of patent activity, the region might not be capable of a high level of commercialisation of research. For instance, while the Khanty-Mansi Autonomous Okrug (0.8561) yielded high results in patent issuance, it did not enter the top 10 regions (0.3190) in the manufacturing of innovative products. The current situation raises the problem that the region might have a sufficient number of highly qualified labour resources, but the financial, managerial or technological component of the innovation process in the region requires improvement.
The region can show a high level of production of innovative solutions with a few issued patents. For example, Yamalo-Nenets Autonomous Okrug showed a value of 0.1852 in the first stage of modelling, but the level of innovation activity was high, at 0.7141. Thus, it is worth focusing on the development R&D organisations in this region since there are enough technological capacities for the sale of innovative products. The involvement of additional R&D organisations can lead to even greater feedback in terms of generating innovation.
When developing the model, the authors revealed that conducting such an analysis was associated with considerable labour costs in terms of information collection at the preparatory stage of the analysis. In the future, when building a model, the amount of data obtained will be equally large, which makes it difficult to interpret the information. In this regard, as a further direction of research, the authors suggest the development of a specific software product that will more clearly present the data obtained and simplify their collection and processing.

Author Contributions

Conceptualization, I.R. and D.K.; methodology, D.K. and A.S.; software, D.K. and A.S.; validation, D.K., A.S. and I.R.; formal analysis, A.S.; investigation, D.K.; resources, D.K.; data curation, D.K. and A.S.; writing—original draft preparation, D.K.; writing—review and editing, D.K. and A.S.; visualization, D.K.; supervision, M.M.-B.; project administration, I.R.; funding acquisition, I.R. All authors have read and agreed to the published version of the manuscript.

Funding

This research was funded by the Russian Science Foundation (project No. 20-78-10123).

Institutional Review Board Statement

Not applicable.

Informed Consent Statement

Not applicable.

Data Availability Statement

Not applicable.

Conflicts of Interest

The authors declare no conflict of interest.

Appendix A

Figure A1. Size of incoming slacks by the indicator insurance of patents in Russia 2017–2019.
Joitmc 08 00041 g0a1
Figure A2. Size of incoming slacks by the indicator costs for technological innovations in Russia 2017–2019.
Joitmc 08 00041 g0a2

References

  1. Lopes, J.; Gomes, S.; Oliveira, J.; Oliveira, M. The Role of Open Innovation, and the Performance of European Union Regions. J. Open Innov. Technol. Mark. Complex. 2021, 7, 120. [Google Scholar] [CrossRef]
  2. Erol, S.; Klug, S. Together We are Less Alone—A Concept for a Regional Open Innovation Learning Lab. Procedia Manuf. 2020, 45, 540–545. [Google Scholar] [CrossRef]
  3. De Oliveira, L.S.; Echeveste, M.E.S.; Cortimiglia, M.N.; Gonçalves, C.G.C. Analysis of determinants for Open Innovation implementation in Regional Innovation Systems. RAI Rev. Adm. Inovação 2017, 14, 119–129. [Google Scholar] [CrossRef] [Green Version]
  4. Radziwon, A.; Bogers, M. Open innovation in SMEs: Exploring inter-organizational relationships in an ecosystem. Technol. Forecast. Soc. Change 2019, 146, 573–587. [Google Scholar] [CrossRef]
  5. Burchardt, C.; Maisch, B. Digitalization needs a cultural change—Examples of applying Agility and Open Innovation to drive the digital transformation. Procedia CIRP 2019, 84, 112–117. [Google Scholar] [CrossRef]
  6. Manzini, R.; Lazzarotti, V.; Pellegrini, L. How to Remain as Closed as Possible in the Open Innovation Era: The Case of Lindt & Sprüngli. Long Range Plan. 2017, 50, 260–281. [Google Scholar] [CrossRef]
  7. Shabunina, T.V.; Shchelkina, S.P.; Rodionov, D.G. An innovative approach to the transformation of eco-economic space of a region based on the green economy principles. Acad. Strateg. Manag. J. 2017, 16, 176–185. [Google Scholar]
  8. Lee, K.; Yoo, J. How does open innovation lead competitive advantage? A dynamic capability view perspective. PLoS ONE 2019, 14, e0223405. [Google Scholar] [CrossRef] [Green Version]
  9. Xie, X.; Wang, H. How can open innovation ecosystem modes push product innovation forward? An fsQCA analysis. J. Bus. Res. 2020, 108, 29–41. [Google Scholar] [CrossRef]
  10. Carmona-Lavado, A.; Cuevas-Rodríguez, G.; Cabello-Medina, C.; Fedriani, E.M. Does open innovation always work? The role of complementary assets. Technol. Forecast. Soc. Change 2021, 162, 120316. [Google Scholar] [CrossRef]
  11. Lee, M.; Yun, J.J.; Pyka, A.; Won, D.; Kodama, F.; Schiuma, G.; Park, H.; Jeon, J.; Park, K.; Jung, K.; et al. How to Respond to the Fourth Industrial Revolution, or the Second Information Technology Revolution? Dynamic New Combinations between Technology, Market, and Society through Open Innovation. J. Open Innov. Technol. Mark. Complex. 2018, 4, 21. [Google Scholar] [CrossRef] [Green Version]
  12. Onetti, A. Turning open innovation into practice: Trends in European corporates. J. Bus. Strat. 2021, 42, 51–58. [Google Scholar] [CrossRef]
  13. Ferraris, A.; Santoro, G.; Bresciani, S. Open innovation in multinational companies’ subsidiaries: The role of internal and external knowledge. Eur. J. Int. Manag. 2017, 11, 452. [Google Scholar] [CrossRef]
  14. Hosseini, S.; Kees, A.; Manderscheid, J.; Röglinger, M.; Rosemann, M. What does it take to implement open innovation? Towards an integrated capability framework. Bus. Process Manag. J. 2017, 23, 87–107. [Google Scholar] [CrossRef] [Green Version]
  15. Pratono, A.H. Network structure and open innovation: The role of trust in product development. Int. J. Bus. Innov. Res. 2018, 15, 44–61. [Google Scholar] [CrossRef]
  16. Oltra, M.J.; Flor, M.L.; Alfaro, J.A. Open innovation and firm performance: The role of organizational mechanisms. Bus. Process Manag. J. 2018, 24, 814–836. [Google Scholar] [CrossRef]
  17. Rodionov, D.G.; Kichigin Oleg, E.; Selentieva Tamara, N. Features of assessing the competitiveness of innova-tive regional clusters: An institutional approach. J. Econ. 2019, 75, 43–58. [Google Scholar] [CrossRef]
  18. Rauter, R.; Globocnik, D.; Perl-Vorbach, E.; Baumgartner, R.J. Open innovation and its effects on economic and sustainability innovation performance. J. Innov. Knowl. 2019, 4, 226–233. [Google Scholar] [CrossRef]
  19. Su, J.; Yang, Y.; Zhang, X. Knowledge transfer efficiency measurement with application for open innovation networks. Int. J. Technol. Manag. 2019, 81, 118–142. [Google Scholar] [CrossRef]
  20. Vanhaverbeke, W.; Roijakkers, N.; Lorenz, A.; Chesbrough, H. The Importance of Connecting Open Innovation to Strategy. In Strategy and Communication for Innovation; Springer: Berlin/Heidelberg, Germany, 2017; pp. 3–15. [Google Scholar]
  21. Pilav-Velić, A.; Marjanovic, O. Integrating open innovation and business process innovation: Insights from a large-scale study on a transition economy. Inf. Manag. 2016, 53, 398–408. [Google Scholar] [CrossRef]
  22. Lahi, A.; Elenurm, T. Catalysts and barriers of open innovation for SMEs in transition economy. In Proceedings of the 2nd International Conference on Innovation and Entrepreneurship: ICIE 2014, Bangkok, Thailand, 6–7 February 2014; p. 149. [Google Scholar]
  23. Kushekbayev, Y. Cultural barriers to open innovation in countries with a transitional economy: Case of Kazakhstan. In European Conference on Innovation and Entrepreneurship; Academic Conferences International Limited: England, UK, 2014; p. 527. [Google Scholar]
  24. Tran, H.T.; Santarelli, E.; Wei, W.X. Open innovation knowledge management in transition to market economy: Integrating dynamic capability and institutional theory. Econ. Innov. New Technol. 2020, 1–29. [Google Scholar] [CrossRef]
  25. Saleh, H.; Surya, B.; Ahmad, D.A.; Manda, D. The Role of Natural and Human Resources on Economic Growth and Regional Development: With Discussion of Open Innovation Dynamics. J. Open Innov. Technol. Mark. Complex. 2020, 6, 103. [Google Scholar] [CrossRef]
  26. Gamidullaeva, L.A.; Vasin, S.M.; Mkrttchian, V. Regional Economic Growth and Open Innovation Platforms. Int. Explor. Technol. Equity Digit. Divid. 2019, 163–184. [Google Scholar] [CrossRef]
  27. Kroll, H. Eye to eye with the innovation paradox: Why smart specialization is no simple solution to policy design. Eur. Plan. Stud. 2019, 27, 932–951. [Google Scholar] [CrossRef]
  28. Peters, B.G.; Capano, G.; Howlett, M.; Mukherjee, I.; Chou, M.-H.; Ravinet, P. Designing for Policy Effectiveness; Cambridge University Press: Cambridge, UK, 2018. [Google Scholar]
  29. Nestle, V.; Täube, F.A.; Heidenreich, S.; Bogers, M. Establishing open innovation culture in cluster initiatives: The role of trust and information asymmetry. Technol. Forecast. Soc. Change 2019, 146, 563–572. [Google Scholar] [CrossRef]
  30. Santos, A.B.; Mendonça, S. Open Innovation Adoption in Clusters: The Portuguese Case/The Quadruple Innovation Helix Nexus; Springer: Berlin/Heidelberg, Germany, 2017; pp. 245–264. [Google Scholar]
  31. Asheim, B.T.; Isaksen, A.; Trippl, M. Advanced Introduction to Regional Innovation Systems; Edward Elgar Publishing: Cheltenham, UK, 2019. [Google Scholar]
  32. Asheim, B.; Herstad, S. Regional innovation strategy for resilience and transformative industrial path development: Evolutionary theoretical perspectives on innovation policy. East. J. Eur. Stud. 2021, 12, 43–75. [Google Scholar] [CrossRef]
  33. Huggins, R.; Prokop, D.; Thompson, P. Universities and open innovation: The determinants of network centrality. J. Technol. Transf. 2019, 45, 718–757. [Google Scholar] [CrossRef] [Green Version]
  34. Baron, M. Open Innovation Capacity of the Polish Universities. J. Knowl. Econ. 2017, 12, 73–95. [Google Scholar] [CrossRef] [Green Version]
  35. Paiva, T.; Ribeiro, M.; Coutinho, P. R&D Collaboration, Competitiveness Development, and Open Innovation in R&D. J. Open Innov. Technol. Mark. Complex. 2020, 6, 116. [Google Scholar] [CrossRef]
  36. Doloreux, D. Regional Innovation Systems in the Periphery: The Case of the Beauce in Québec (Canada). Int. J. Innov. Manag. 2003, 7, 67–94. [Google Scholar] [CrossRef]
  37. Rodionov, D.G.; Kudryavtseva, T.J.; Skhvediani, A.E. Human Development and Income Inequality as Factors of Regional Economic Growth; University of Piraeus: Pireas, Greece; International Strategic Management Association: Pireas, Greece, 2018. [Google Scholar]
  38. Chesbrough, H.; Vanhaverbeke, W.; West, J. Open Innovation: Researching a New Paradigm. Oxford University Press on Demand: Oxford, UK, 2006. [Google Scholar]
  39. Dahlander, L.; David, M.G. How open is innovation? Res. Policy 2010, 39, 699–709. [Google Scholar] [CrossRef]
  40. Ding, L.; Wu, J. Innovation Ecosystem of CNG Vehicles: A Case Study of Its Cultivation and Characteristics in Sichuan, China. Sustainability 2018, 10, 39. [Google Scholar] [CrossRef] [Green Version]
  41. Torre, A. On the Role Played by Temporary Geographical Proximity in Knowledge Transmission. Reg. Stud. 2008, 42, 869–889. [Google Scholar] [CrossRef] [Green Version]
  42. Asheim, B.T.; Isaksen, A. Location, agglomeration and innovation: Towards regional innovation systems in Norway? Eur. Plan. Stud. 1997, 5, 299–330. [Google Scholar] [CrossRef] [Green Version]
  43. Ponds, R.; Van Oort, F.; Frenken, K. Innovation, spillovers and university-industry collaboration: An extended knowledge production function approach. J. Econ. Geogr. 2009, 10, 231–255. [Google Scholar] [CrossRef]
  44. Bergek, A.; Hekkert, M.; Jacobsson, S.; Markard, J.; Sandén, B.; Truffer, B. Technological innovation systems in contexts: Conceptualizing contextual structures and interaction dynamics. Environ. Innov. Soc. Transit. 2015, 16, 51–64. [Google Scholar] [CrossRef] [Green Version]
  45. Vargo, S.; Wieland, H.; Akaka, M.A. Innovation through institutionalization: A service ecosystems perspective. Ind. Mark. Manag. 2015, 44, 63–72. [Google Scholar] [CrossRef]
  46. Freeman, C. Networks of innovators: A synthesis of research issues. Res. Policy 1991, 20, 499–514. [Google Scholar] [CrossRef]
  47. Pietrobelli, C.; Rabellotti, R. Global Value Chains Meet Innovation Systems: Are There Learning Opportunities for Developing Countries? World Dev. 2011, 39, 1261–1269. [Google Scholar] [CrossRef] [Green Version]
  48. Sleuwaegen, L.; Boiardi, P. Creativity and regional innovation: Evidence from EU regions. Res. Policy 2014, 43, 1508–1522. [Google Scholar] [CrossRef]
  49. Salomo, S.; Gemünden, H.G.; Leifer, R. Research on corporate radical innovation systems—A dynamic capabilities perspective: An introduction. J. Eng. Technol. Manag. 2007, 24, 1–10. [Google Scholar] [CrossRef]
  50. Rodríguez-Pose, A.; Crescenzi, R. Research and development, spillovers, innovation systems, and the genesis of regional growth in Europe. Reg. Stud. 2008, 42, 51–67. [Google Scholar] [CrossRef]
  51. Nambisan, S.; Siegel, D.; Kenney, M. On open innovation, platforms, and entrepreneurship. Strat. Entrep. J. 2018, 12, 354–368. [Google Scholar] [CrossRef]
  52. Spencer, J.W. Firms’ knowledge-sharing strategies in the global innovation system: Empirical evidence from the flat panel display industry. Strat. Manag. J. 2003, 24, 217–233. [Google Scholar] [CrossRef]
  53. Na Lim, J.; Schultmann, F.; Ofori, G. Tailoring Competitive Advantages Derived from Innovation to the Needs of Construction Firms. J. Constr. Eng. Manag. 2010, 136, 568–580. [Google Scholar] [CrossRef]
  54. Gupta, A.; Dey, A.; Singh, G. Connecting corporations and communities: Towards a theory of social inclusive open innovation. J. Open Innov. Technol. Mark. Complex. 2017, 3, 17. [Google Scholar] [CrossRef] [Green Version]
  55. Smith, H.L. Universities, Innovation, and Territorial Development: A Review of the Evidence. Environ. Plan. C Gov. Policy 2007, 25, 98–114. [Google Scholar] [CrossRef]
  56. Tödtling, F.; Lehner, P.; Kaufmann, A. Do different types of innovation rely on specific kinds of knowledge interactions? Technovation 2009, 29, 59–71. [Google Scholar] [CrossRef] [Green Version]
  57. Sotarauta, M. Regional development and regional networks: The role of regional development officers in Finland. Eur. Urban Reg. Stud. 2010, 17, 387–400. [Google Scholar] [CrossRef] [Green Version]
  58. Hung, S.-W.; Wang, A.-P. Entrepreneurs with glamour? DEA performance characterization of high-tech and older-established industries. Econ. Model. 2012, 29, 1146–1153. [Google Scholar] [CrossRef]
  59. Broekel, T.; Rogge, N.; Brenner, T. The innovation efficiency of German regions—A shared-input DEA approach. Rev. Reg. Res. 2018, 38, 77–109. [Google Scholar] [CrossRef] [Green Version]
  60. Kaihua, C.; Mingting, K. Staged efficiency and its determinants of regional innovation systems: A two-step analytical procedure. Ann. Reg. Sci. 2014, 52, 627–657. [Google Scholar] [CrossRef]
  61. Chun, D.; Chung, Y.; Bang, S. Impact of firm size and industry type on R&D efficiency throughout innovation and commercialisation stages: Evidence from Korean manufacturing firms. Technol. Anal. Strat. Manag. 2015, 27, 895–909. [Google Scholar] [CrossRef]
  62. Wang, Q.; Hang, Y.; Sun, L.; Zhao, Z. Two-stage innovation efficiency of new energy enterprises in China: A non-radial DEA approach. Technol. Forecast. Soc. Change 2016, 112, 254–261. [Google Scholar] [CrossRef]
  63. Xu, H.; Liu, F. Measuring the Efficiency of Education and Technology via DEA approach: Implications on National Development. Soc. Sci. 2017, 6, 136. [Google Scholar] [CrossRef] [Green Version]
  64. Shin, K.; Lee, D.; Shin, K.; Kim, E. Measuring the Efficiency of U.S. Pharmaceutical Companies Based on Open Innovation Types. J. Open Innov. Technol. Mark. Complex. 2018, 4, 34. [Google Scholar] [CrossRef] [Green Version]
  65. Wei, D. Evaluation of Regional Innovation Efficiency in China Based on Three-Stage DEA Model. In Proceedings of the Fourth International Conference on Economic and Business Management (FEBM 2019), Sanya, China, 19–21 October 2019; Atlantis Press: Dordrecht, Netherlands, 2019; pp. 45–49. [Google Scholar]
  66. Xu, K.; Bossink, B.; Chen, Q. Efficiency Evaluation of Regional Sustainable Innovation in China: A Slack-Based Measure (SBM) Model with Undesirable Outputs. Sustainability 2019, 12, 31. [Google Scholar] [CrossRef] [Green Version]
  67. Guede-Cid, R.; Rodas-Alfaya, L.; Leguey-Galán, S.; Cid-Cid, A. Innovation Efficiency in the Spanish Service Sectors, and Open Innovation. J. Open Innov. Technol. Mark. Complex. 2021, 7, 62. [Google Scholar] [CrossRef]
  68. Pilav-Velic, A.; Jahic, H. The adoption of inbound open innovation practices in developing countries: Empirical evidence from the manufacturing sector. Eur. J. Innov. Manag. 2021. [Google Scholar] [CrossRef]
  69. McPhillips, M. Trouble in Paradise? Barriers to Open Innovation in Regional Clusters in the Era of the 4th Industrial Revolution. J. Open Innov. Technol. Mark. Complex. 2020, 6, 84. [Google Scholar] [CrossRef]
  70. Bosco, M.G.; Brugnoli, A. Regional efficiency, innovation and productivity. In RSA Conference Proceedings; 2010. Available online: http://www.grupposervizioambiente.it/aisre/pendrive2011/pendrive/Paper/Bosco1.pdf (accessed on 26 December 2021).
  71. Färe, R.; Lovell, C.K. Measuring the technical efficiency of production. J. Econ. Theory 1978, 19, 150–162. [Google Scholar] [CrossRef]
  72. Wang, J.; Zhao, T. Regional energy-environmental performance and investment strategy for China’s non-ferrous metals industry: A non-radial DEA based analysis. J. Clean. Prod. 2017, 163, 187–201. [Google Scholar] [CrossRef]
  73. Kang, Y.-Q.; Xie, B.-C.; Wang, J.; Wang, Y.-N. Environmental assessment and investment strategy for China’s manufacturing industry: A non-radial DEA based analysis. J. Clean. Prod. 2018, 175, 501–511. [Google Scholar] [CrossRef]
  74. Didenko, A.; Loseva, O.; Abdikeev, N. Measuring Efficiency of Regional Innovation System with DEA and PCA. In Proceedings of the 2017 IEEE 11th International Conference on Application of Information and Communication Technologies (AICT), Moscow, Russia, 20–22 September 2017; pp. 1–4. Available online: https://ieeexplore.ieee.org/abstract/document/8687279?casa_token=N7pf2FRZKPIAAAAA:6CsRlGRnVGRY7DXqliQJMEwl6yIjRFxJPmeg0Pk4qmyV6hnqOIQaQwWiSa76pHX9caImOe6chLIEUg (accessed on 26 December 2021).
  75. Li, Y.; Wang, J.; Liu, Y.; Long, H. Problem regions and regional problems of socioeconomic development in China: A perspective from the coordinated development of industrialization, informatization, urbanization and agricultural modernization. J. Geogr. Sci. 2014, 24, 1115–1130. [Google Scholar] [CrossRef]
  76. Seiford, L.M.; Thrall, R.M. Recent developments in DEA: The mathematical programming approach to frontier analysis. J. Econ. 1990, 46, 7–38. [Google Scholar] [CrossRef]
  77. Panayides, P.M.; Maxoulis, C.N.; Wang, T.; Ng, K.Y.A. A Critical Analysis of DEA Applications to Seaport Economic Efficiency Measurement. Transp. Rev. 2009, 29, 183–206. [Google Scholar] [CrossRef]
  78. McFadden, D. Econometric analysis of qualitative response models. In Handbook of Econometrics; Elsevier: Amsterdam, The Netherlands, 1984; pp. 1395–1457. [Google Scholar] [CrossRef]
  79. Hendry, D.F. Dynamic Econometrics; Oxford University Press on Demand: Oxford, UK, 1995. [Google Scholar]
  80. Chen, H.; Lin, H.; Zou, W. Research on the Regional Differences and Influencing Factors of the Innovation Efficiency of China’s High-Tech Industries: Based on a Shared Inputs Two-Stage Network DEA. Sustainability 2020, 12, 3284. [Google Scholar] [CrossRef] [Green Version]
  81. Chu, J.; Wu, J.; Zhu, Q.; An, Q.; Xiong, B. Analysis of China’s Regional Eco-efficiency: A DEA Two-stage Network Approach with Equitable Efficiency Decomposition. Comput. Econ. 2019, 54, 1263–1285. [Google Scholar] [CrossRef]
  82. Chen, Y.; Liu, B.; Shen, Y.; Wang, X. The energy efficiency of China’s regional construction industry based on the three-stage DEA model and the DEA-DA model. KSCE J. Civ. Eng. 2016, 20, 34–47. [Google Scholar] [CrossRef]
  83. Spitsin, V.; Mikhalchuk, A.; Spitsina, L.; Shabaldina, N.; Novoseltseva, D.; Shinkeev, M. Product Innovation Efficiency of Russian Electronic Industry: DEA Approach and Cluster Analysis. Adv. Soc. Sci. Educ. Humanit. Res. 2016, 53, 607–610. [Google Scholar]
  84. Arabshahi, H.; Fazlollahtabar, H. A DEA-based framework for innovation risk management in production systems: Case study of innovative activities in industries. Int. J. Environ. Sci. Technol. 2017, 14, 2193–2204. [Google Scholar] [CrossRef]
  85. Firsova, A.A.; Chernyshova, G.Y. Modeling of Regional Innovation Spillover Effects Based on DEA Malmquist Index. In Proceedings of the Fourth Workshop on Computer Modelling in Decision Making (CMDM 2019), Saratov, Russia, 14–15 November 2019; Atlantis Press: Dordrecht, The Netherlands, 2019; pp. 103–107. [Google Scholar]
  86. Pan, T.-W.; Hung, S.-W.; Lu, W.-M. DEA performance measurement of the national innovation system in Asia and Europe. Asia-Pac. J. Oper. Res. 2010, 27, 369–392. [Google Scholar] [CrossRef]
  87. Huang, Y.-F.; Chen, C.-J. The impact of technological diversity and organizational slack on innovation. Technovation 2010, 30, 420–428. [Google Scholar] [CrossRef]
  88. Wang, R.; Xia, B.; Dong, S.; Li, Y.; Li, Z.; Ba, D.; Zhang, W. Research on the Spatial Differentiation and Driving Forces of Eco-Efficiency of Regional Tourism in China. Sustainability 2021, 13, 280. [Google Scholar] [CrossRef]
  89. Wang, C.-N.; Nguyen, H.-P.; Chang, C.-W. Environmental Efficiency Evaluation in the Top Asian Economies: An Application of DEA. Mathematics 2021, 9, 889. [Google Scholar] [CrossRef]
  90. Lee, S. Slack and innovation: Investigating the relationship in Korea. J. Bus. Res. 2015, 68, 1895–1905. [Google Scholar] [CrossRef]
  91. Daniel, F.; Lohrke, F.T.; Fornaciari, C.J.; Turner, R. Slack resources and firm performance: A meta-analysis. J. Bus. Res. 2004, 57, 565–574. [Google Scholar] [CrossRef]
  92. Mellahi, K.; Wilkinson, A. A Study of the Association between Level of Slack Reduction Following Downsizing and Innovation Output. J. Manag. Stud. 2010, 47, 483–508. [Google Scholar] [CrossRef] [Green Version]
  93. Agrawal, A.; Catalini, C.; Goldfarb, A.; Luo, H. Slack Time and Innovation. Organ. Sci. Inf. 2018, 29, 1056–1073. [Google Scholar] [CrossRef] [Green Version]
  94. Zhong, H. The Impact of Organizational Slack on Technological Innovation: Evidence from Henan Province in China. In 2010 International Conference on Management and Service Science; IEEE. 2010; pp. 1–4. Available online: https://ieeexplore.ieee.org/abstract/document/5577005/?casa_token=Y9vTjly1jr4AAAAA:OOg-4YEvbxH4MWeKQNrBsvwN5z8_17-BTQITztuDUr95YmNVErjGqooxPXq8chmOcSh2gFddqVqGzw (accessed on 26 December 2021).
  95. Ruiz-Moreno, A.; García-Morales, V.J.; Llorens-Montes, F.J. The moderating effect of organizational slack on the relation between perceptions of support for innovation and organizational climate. Pers. Rev. 2008, 37, 509–525. [Google Scholar] [CrossRef]
  96. Sun, A.; Su, Z. Research on the Relationship of Organizational Slack and Technology Innovation. Sci. Sci. Manag. S. T. 2008, 5, 1–8. [Google Scholar]
  97. Richtnér, A.; Åhlström, P. Influences on organisational slack in new product development projects. Int. J. Innov. Manag. 2006, 10, 375–406. [Google Scholar] [CrossRef] [Green Version]
  98. Nohria, N.; Gulati, R. What is the optimum amount of organizational slack? A study of the relationship between slack and innovation in multinational firms. Eur. Manag. J. 1997, 15, 603–611. [Google Scholar] [CrossRef]
  99. Pérez, J.A.H.; Geldes, C.; Kunc, M.H.; Flores, A. New approach to the innovation process in emerging economies: The manufacturing sector case in Chile and Peru. Technovation 2019, 79, 35–55. [Google Scholar] [CrossRef] [Green Version]
  100. Vargo, S.L.; Akaka, M.A.; Wieland, H. Rethinking the process of diffusion in innovation: A service-ecosystems and institutional perspective. J. Bus. Res. 2020, 116, 526–534. [Google Scholar] [CrossRef]
  101. Pieroni, M.P.P.; McAloone, T.C.; Pigosso, D.C.A. Business model innovation for circular economy and sustainability: A review of approaches. J. Clean. Prod. 2019, 215, 198–216. [Google Scholar] [CrossRef]
  102. Bican, P.M.; Guderian, C.C.; Ringbeck, A. Managing knowledge in open innovation processes: An intellectual property perspective. J. Knowl. Manag. 2017, 21, 1384–1405. [Google Scholar] [CrossRef]
  103. Kou, M.; Yang, Y.; Chen, K. The impact of external R&D financing on innovation process from a supply-demand perspective. Econ. Model. 2020, 92, 375–387. [Google Scholar] [CrossRef]
  104. Davids, M.; Frenken, K. Proximity, knowledge base and the innovation process: Towards an integrated framework. Reg. Stud. 2018, 52, 23–34. [Google Scholar] [CrossRef] [Green Version]
  105. Dziallas, M.; Blind, K. Innovation indicators throughout the innovation process: An extensive literature analysis. Technovation 2019, 80–81, 3–29. [Google Scholar] [CrossRef]
  106. Djellal, F.; Gallouj, F. Patterns of innovation organisation in service firms: Postal survey results and theoretical models. Sci. Public Policy 2001, 28, 57–67. [Google Scholar] [CrossRef]
  107. Love, J.H.; Roper, S. Organizing the Innovation Process: Complementarities in Innovation Networking. Ind. Innov. 2009, 16, 273–290. [Google Scholar] [CrossRef]
  108. Hirooka, M. Innovation Dynamism and Economic Growth: A Nonlinear Perspective; Edward Elgar Publishing: Cheltenham, UK, 2006. [Google Scholar]
  109. Chen, X.; Liu, Z.; Zhu, Q. Performance evaluation of China’s high-tech innovation process: Analysis based on the innovation value chain. Technovation 2018, 74–75, 42–53. [Google Scholar] [CrossRef]
  110. Min, S.; Kim, J.; Sawng, Y.-W. The effect of innovation network size and public R&D investment on regional innovation efficiency. Technol. Forecast. Soc. Change 2020, 155, 119998. [Google Scholar] [CrossRef]
  111. Tsertseil, J.S.; Kookueva, V.V.; Gryzunova, N.V.; Khashchuluun, C. Analysis and Prospects of Infrastructure Development of Innovation Regional Clusters in Russia through the Example of Specific Economic Zones of Industrial Production and Technology Innovation Types. J. Appl. Econ. Sci. 2017, 12, 1896–1905. [Google Scholar]
  112. Varlamova, J.; Kotenkova, S.; Larionova, N. Evaluation of regional infrastructure. J. Econ. Econ. Educ. Res. 2016, 17, 317. [Google Scholar]
  113. Nigmatullin, S.I. Analysis of Methods for Forecasting the Development of Innovative Processes in the Re-gions. In Cooperation and Sustainable Development; Springer: Berlin/Heidelberg, Germany, 2022; pp. 1631–1641. [Google Scholar]
  114. Vlasov, M. Relationship Between Traditional and Innovation Economies: Russian Case. In European Conference on Knowledge Management; Academic Conferences International Limited: Reading, UK, 2020; pp. 832–840. [Google Scholar]
  115. Veselovsky, M.Y.; Pogodina, T.V.; Ilyukhina, R.V.; Sigunova, T.A.; Kuzovleva, N.F. Financial and economic mechanisms of promoting innovative activity in the context of the digital economy formation. Entrep. Sustain. Issues 2018, 5, 672–681. [Google Scholar] [CrossRef] [Green Version]
  116. Sorokin, A.E.; Novikov, S.V. Formation of the national economy of Russia in the context of state support of innovation actions. Rev. ESPACIOS 2019, 40, 4. [Google Scholar]
  117. Kobicheva, A.; Baranova, T.; Tokareva, E. The Development of an Interaction Mechanism Between Universities and Other Innovation System Actors: Its Influence on University Innovation Activity Effectiveness. J. Open Innov. Technol. Mark. Complex. 2020, 6, 109. [Google Scholar] [CrossRef]
  118. Mashegov, P.N.; Maslova, O.L.; Poltorykhina, S.V.; Fedorova, T.V.; Rezvyakova, I.V. Analysis of Innovative Dynamics and Formation of Tools for Assessing the Efficiency of Long-Term Innovative Policy of Russian Regions. In Modern Global Economic System: Evolutional Development vs. Revolutionary Leap. ISC 2019; Springer: Cham, Switzerland, 2021; pp. 1503–1511. [Google Scholar] [CrossRef]
  119. Kozhevina, O.V.; Trifonov, P.V.; Ksenofontov, A.A.; Perednikh, L.V. The Strategic Management of Sustainable Industrial Development in Transition to Industry 4.0. In Imitation Market Modeling in Digital Economy: Game Theoretic Approaches; Springer: Cham, Switzerland, 2019; pp. 1295–1304. [Google Scholar]
  120. Gribov, P.G.; Lomakin, A.L.; Kurganskaya, M.Y.; Kumelashvili, M.Z. The influence of national economy specifics on the interaction between universities and corporations in the field of innovation. Int. J. Criminol. Sociol. 2020, 9, 553–562. [Google Scholar] [CrossRef]
  121. Zemtsov, S.; Kotsemir, M. An assessment of regional innovation system efficiency in Russia: The application of the DEA approach. Scientometrics 2019, 120, 375–404. [Google Scholar] [CrossRef]
  122. Suprun, E.; Sahin, O.; Stewart, R.A.; Panuwatwanich, K. Examining transition pathways to construction innovation in Russia: A system dynamics approach. Int. J. Constr. Manag. 2019, 1–23. [Google Scholar] [CrossRef]
  123. Zhang, Y.; Wang, S. How does policy innovation diffuse among Chinese local governments? A qualitative comparative analysis of River Chief Innovation. Public Adm. Dev. 2021, 41, 34–47. [Google Scholar] [CrossRef]
  124. Sholeh, C.; Sintaningrum, S.; Sugandi, Y.S. Formulation of Innovation Policy: Case of Bandung Smart City. J. Ilmu Sos. Ilmu Politik 2019, 22, 173–186. [Google Scholar] [CrossRef] [Green Version]
  125. Veselovsky, M.Y.; Izmailova, M.A.; Lobacheva, E.N.; Pilipenko, P.P.; Rybina, G.A. Strategic management of innovation development: Insights into a role of economic policy. Entrep. Sustain. Issues 2019, 7, 1296–1307. [Google Scholar] [CrossRef]
  126. Robaczewska, J.; Vanhaverbeke, W.; Lorenz, A. Applying open innovation strategies in the context of a regional innovation ecosystem: The case of Janssen Pharmaceuticals. Glob. Transit. 2019, 1, 120–131. [Google Scholar] [CrossRef]
  127. Huang, D.; Duan, H.; Zhang, G. Analysis on the Enterprises’ Innovation Quality Based on the Patent Value: A Comparison between Public and Private Enterprises in China. Sustainability 2020, 12, 3107. [Google Scholar] [CrossRef] [Green Version]
  128. Prihadyanti, D. Innovation quality: Basic concept and measurement model. Int. J. Bus. Innov. Res. 2019, 18, 489–502. [Google Scholar] [CrossRef]
  129. Omidi, V.; Shahabadi, A.; Mehregan, N. Innovation drivers in developing countries. J. Knowl. Econ. 2020, 11, 707–720. [Google Scholar] [CrossRef]
Figure 1. DEA modelling algorithm (compiled by the author based on [78,79,80,81,82]).
Joitmc 08 00041 g001
Figure 2. Map of the performance rating of RISs for 2016 (the first stage of the analysis).
Joitmc 08 00041 g002
Figure 3. Map of the performance rating of RISs for 2019 (the second stage of the analysis).
Joitmc 08 00041 g003
Figure 4. Size of incoming slacks according to the indicator of internal costs for R&D (vtz).
Joitmc 08 00041 g004
Figure 5. Size of incoming slacks by the indicator of the number of personnel engaged in R&D (res_hum).
Joitmc 08 00041 g005
Figure 6. Size of incoming slacks by the indicator organisations engaged in R&D (opsrd).
Joitmc 08 00041 g006
Table 1. Open innovation parameters and their relationship to RISs.
Open Innovation ParametersImpact on Interactions Among System ParticipantsSources
Geographical proximity Close geographical location boosts trust among the participants interacting in an RIS, which accelerates introduction of innovations[41,42,43]
Participants’ immediate interaction Increases the feedback parameter[44,45,46]
Involvement of participants from various sectors The opportunity to find previously non-existent solutions comes about because participants are brought in from completely different sectors of the economy[45,47]
Joint creation of value Reveals creativity and facilitates teamwork [48,49]
Experiment-focused activityMakes it possible to obtain the first results in a short period due to the greater focus on conducting the first experiments[50]
Mutual support, exchange of experienceThe concept of open innovation increases the positive impact of cooperation[51,52]
Low costs Low barriers to entry into innovative activities due to the lack of prepayment tools for starting the market participation[53,54]
Communication with several stakeholders in project implementation Additional research and business opportunities[55,56,57]
Table 2. Input–output variables used in DEA analysis.
AuthorYearInput VariablesOutput Variables
Shiu-Wan Hung and An-Pang Wang2012 [58]Employees
Manufacture expense
R&D expense
Revenue
Profit
Earnings per share
Stock
Broekel T., Rogge N., and Brenner T.2013 [59]R&D employmentInnovation efficiency score
Kaihua C. and Mingting K.2014 [60]Number of domestic patents granted
R&D employees
Sales revenue
Chun D., Chung Y., and Bang S.2015 [61]Internal R&D inv.
External R&D inv.
R&D employees
Process patent applications
Product patent applications
Sales
Operating income
Wang Q. et al.2016 [62]R&D costs
R&D employees
Fixed assets
Software assets
Revenues
Xu H. and Liu F.2017 [63]Total public expenditure on education
Total expenditure on R&D (USD)
Total R&D personnel
Higher education achievement
Patent applications
Patent grants
Shin K. et al.2018 [64]R&D expense and employeesRevenues
Wei D.2019 [65]R&D personnel full-time equivalent
Internal expenditure of R&D fund
Number of patent applications
Technical market contract turnover
Xu K., Bossink B., and Chen Q.2020 [66]R&D personnel full-time equivalent
R&D expenditure
new product development projects
Invention application
New product sales
Guede-Cid R. et al.2021 [67]Innovation expenditures (thousands of EUR)
Staff in R&D in full-time equivalent: total staff
Number of companies with technological innovation that performed R&D acquisition (external R&D)
Acquisition of machinery, equipment, and advanced hardware or software and buildings
Percentage of turnover in new and improved products
Intensity of innovation (expenditures on innovative activities/turnover)
Table 3. Model parameters (compiled by the authors).
Designation IndicatorUnit of MeasurementVariable Type
The first stage is the patent activity of the regions
vtz_Internal costs for R&DMillions of roubles (RUB) Input data
opsrd_Organisations that have carried out R&DUnits
res_humNumber of personnel engaged in R&DPersons
patent_Issuance of patents in RussiaPiecesOutput data
The second stage involves releasing innovative goods and services in the regions
cfti_Costs for technological innovationsMillions of roubles (RUB)Input data
patent_Issuance of patents in RussiaPieces
qing_Volume of innovative goods, works and servicesMillions of roubles (RUB)Output data
Table 4. Results of the regression analysis for model justification.
ParameterModel 1Model 2
lnvtz_ (Internal costs for R&D)0.103
(0.092)
[19.487]
lnopsrd_ (Organisations that have carried out R&D)0.845 ***
(0.097)
[5.943]
lnres_hum_ (Number of personnel engaged in R&D)0.236 *
(0.109)
[21.780]
lnpatent_(Issuance of patents in Russia) 0.440 ***
(0.050)
[2.009]
lncfti_ (Costs for technological innovations) 0.717 ***
(0.033)
[2.009]
Constant term−0.554 **1.137 ***
(0.206)(0.199)
R-squared0.7210.775
N (number of observations)484492
Aic (Akaike’s Information Criteria)1156.3871563.748
Bic (Bayesian information criteria)1173.1151576.343
Rmse (standard deviation of the residuals)0.7961.182
* p < 0.05, ** p < 0.01, and *** p < 0.001. Round brackets—standard errors; square brackets—VIF values.
Table 5. Top 10 regions with highest vtz for 2014–2016.
Regionvtz Value for 2014, % of TotalRankvtz Value for 2015, % of Total Rankvtz Value for 2016, % of Total Rank
Moscow35.24%135.32%135.03%1
Moscow Region12.27%212.18%212.14%2
St. Petersburg12.06%312.01%311.38%3
Nizhny Novgorod Region6.91%47.18%48.25%4
Sverdlovsk Region3.09%52.87%53.14%5
Novosibirsk Region 2.28%62.20%62.15%6
Krasnoyarsk Krai1.80%71.87%81.8%7
Rostov Region1.74%81.5%91.45%9
Samara Region1.72%91.9%7
Republic of Tatarstan 1.44%10 1.33%10
Perm Krai 1.42%101.49%8
Table 6. Top 10 regions with the highest oprsd indicator for 2014–2016.
Region opsrd Value for 2014, % of Total Rankopsrd Value for 2015, % of Total Rankopsrd Value for 2016, % of Total Rank
Moscow19.67%119.43%118.65%1
St. Petersburg8.32%27.16%27.49%2
Moscow Region6.6%36.01%36.20%3
Novosibirsk Region3.33%42.92%52.98%4
Republic of Tatarstan 3.16%52.90%62.80%6
Sverdlovsk Region3.02%63.02%42.90%5
Nizhny Novgorod Region2.58%72.42%82.41%7
Rostov Region2.41%82.40%92.13%8
Republic of Bashkortostan1.91%9 1.84%9
Krasnodar Krai1.83%10 2.54%72.60%6
Sverdlovsk Region
Samara Region 1.82%10
Krasnoyarsk Krai 1.81%10
Table 7. Top 10 regions with the highest res_hum indicator for 2014–2016.
Regionres_hum Value for 2014, % of TotalRankres_hum Value for 2015, % of TotalRankres_hum Value for 2016, % of TotalRank
Moscow32.81%132.52%132.18%1
Moscow Region12.03%211.66%212.18%2
St. Petersburg10.79%310.74%310.69%3
Nizhny Novgorod Region5.44%45.43%45.75%4
Novosibirsk Region2.96%52.94%53.03%6
Sverdlovsk Region2.88%62.9%63.08%5
Chelyabinsk Region2.12%72.05%72.05%7
Samara Region1.77%81.72%9
Rostov Region1.73%91.70%101.68%9
Voronezh Region1.49%10 1.43%10
Republic of Tatarstan 1.73%81.69%8
Perm Krai 1.43%10
Table 8. Top 10 regions with the highest patent indicator for 2014–2016.
Region Patent Value for 2014, % of Total RankPatent Value for 2015, % of Total RankPatent Value for 2016, % of Total Rank
The city of Moscow 33.27%127.50%137.10%1
The city of St. Petersburg6.85%27.64%26.80%2
Moscow Region6.62%35.67%35.12%3
Republic of Tatarstan 4.57%44.08%43.51%4
Samara Region2.38%52.52%62.15%7
Sverdlovsk Region2.37%62.51%72.29%6
Rostov Region2.13%72.35%82.30%5
Republic of Bashkortostan2.07%82.99%52.14%9
Voronezh Region 1.91%92.24%92.21%8
Novosibirsk Region 1.81%102.35%82.14%9
Krasnodar Krai1.81%102.04%101.94%10
Table 9. Top 10 regions with the highest indicator for patents for 2017–2019.
Region Patent Value for 2017, % of Total RankPatent Value for 2018, % of Total RankPatent Value for 2019, % of Total Rank
Moscow 26.58%124.80%125.11%1
St. Petersburg8.63%28.98%39.55%2
Moscow Region6.78%39.54%26.76%3
Republic of Tatarstan 3.48%43.60%43.84%4
Republic of Bashkortostan2.82%52.41%72.63%6
Rostov Region2.68%6 2.29%10
Sverdlovsk Region2.61%72.69%52.76%5
Krasnodar Krai2.50%81.96%92.33%9
Samara Region2.33%92.43%62.36%8
Novosibirsk Region2.13%102.30%82.37%7
Voronezh Region 1.84%10
Table 10. Top 10 regions with the highest cfti indicator for 2017–2019.
Regioncfti Value for 2017, % of TotalRankcfti Value for 2018, % of TotalRankcfti Value for 2019, % of TotalRank
Moscow 12.28%114.35%124.21%1
St. Petersburg8.61%25.42%55.84%4
Khanty-Mansi Autonomous Okrug–Yugra6.67%33.54%6
Nizhny Novgorod Region6%45.50%47.28%2
Moscow Region5.81%57.87%26.23%3
Republic of Tatarstan 4.96%67.30%35.02%5
Krasnodar Krai3%7
Sverdlovsk Region2.83%8
Karachay-Cherkess Republic 2.81%92.56%9
Republic of Tyva2.79%102.55%10
Krasnoyarsk Krai 3.54%63.28%6
Sakhalin Region 3.13%73.13%7
Omsk Region 2.89%8
Republic of Kalmykiya 2.55%10
Republic of Altai 2.55%10
Tula Region 2.67%8
Samara Region 2.43%9
Chechen Republic 2.09%10
Table 11. Top 10 regions with the highest qing indicator value for 2017–2019.
Regioncfti Value for 2017, % of totalRankcfti Value for 2018, % of TotalRankcfti Value for 2019, % of TotalRank
Republic of Tatarstan 10.23%112.74%111.77%1
Moscow Region9.03%27.77%36.06%4
The city of St. Petersburg7.12%38.19%29.53%3
The city of Moscow5.85%46.16%511.43%2
Perm Krai5.20%56.80%44.51%6
Nizhny Novgorod Region5.14%65.34%75.38%5
Samara Region4.92%74.46%83.33%9
Sverdlovsk Region4.55%83.34%93.40%8
Tumen Region4.39%95.35%63.47%7
Krasnodar Krai3.96%10
Republic of Bashkortostan 3.12%103.09%10
Publisher’s Note: MDPI stays neutral with regard to jurisdictional claims in published maps and institutional affiliations.

