A Bid/Mark-Up Decision Support Model in Contractor’s Tender Strategy Development Phase Based on Project Complexity Measurement in the Downstream Sector of Petroleum Industry


Abstract
1. Introduction
- Develop a model that can take into account all project-inherent complexity factors in a quantitative way, and
- Propose time/cost mark-ups based on the complexity analysis.
- What are the effective criteria to assess the complexity of projects in the context of the petroleum industry?
- How can the selected criteria be formulated to demonstrate the project complexity in an appropriate manner?
- What are the quantitative correlations between the project complexity and the decision to propose a bid or no-bid and bid mark-ups?
2. Literature Review
2.1. Project Selection and Contractor’s Tender Strategy
2.2. Previous Models and Methodologies
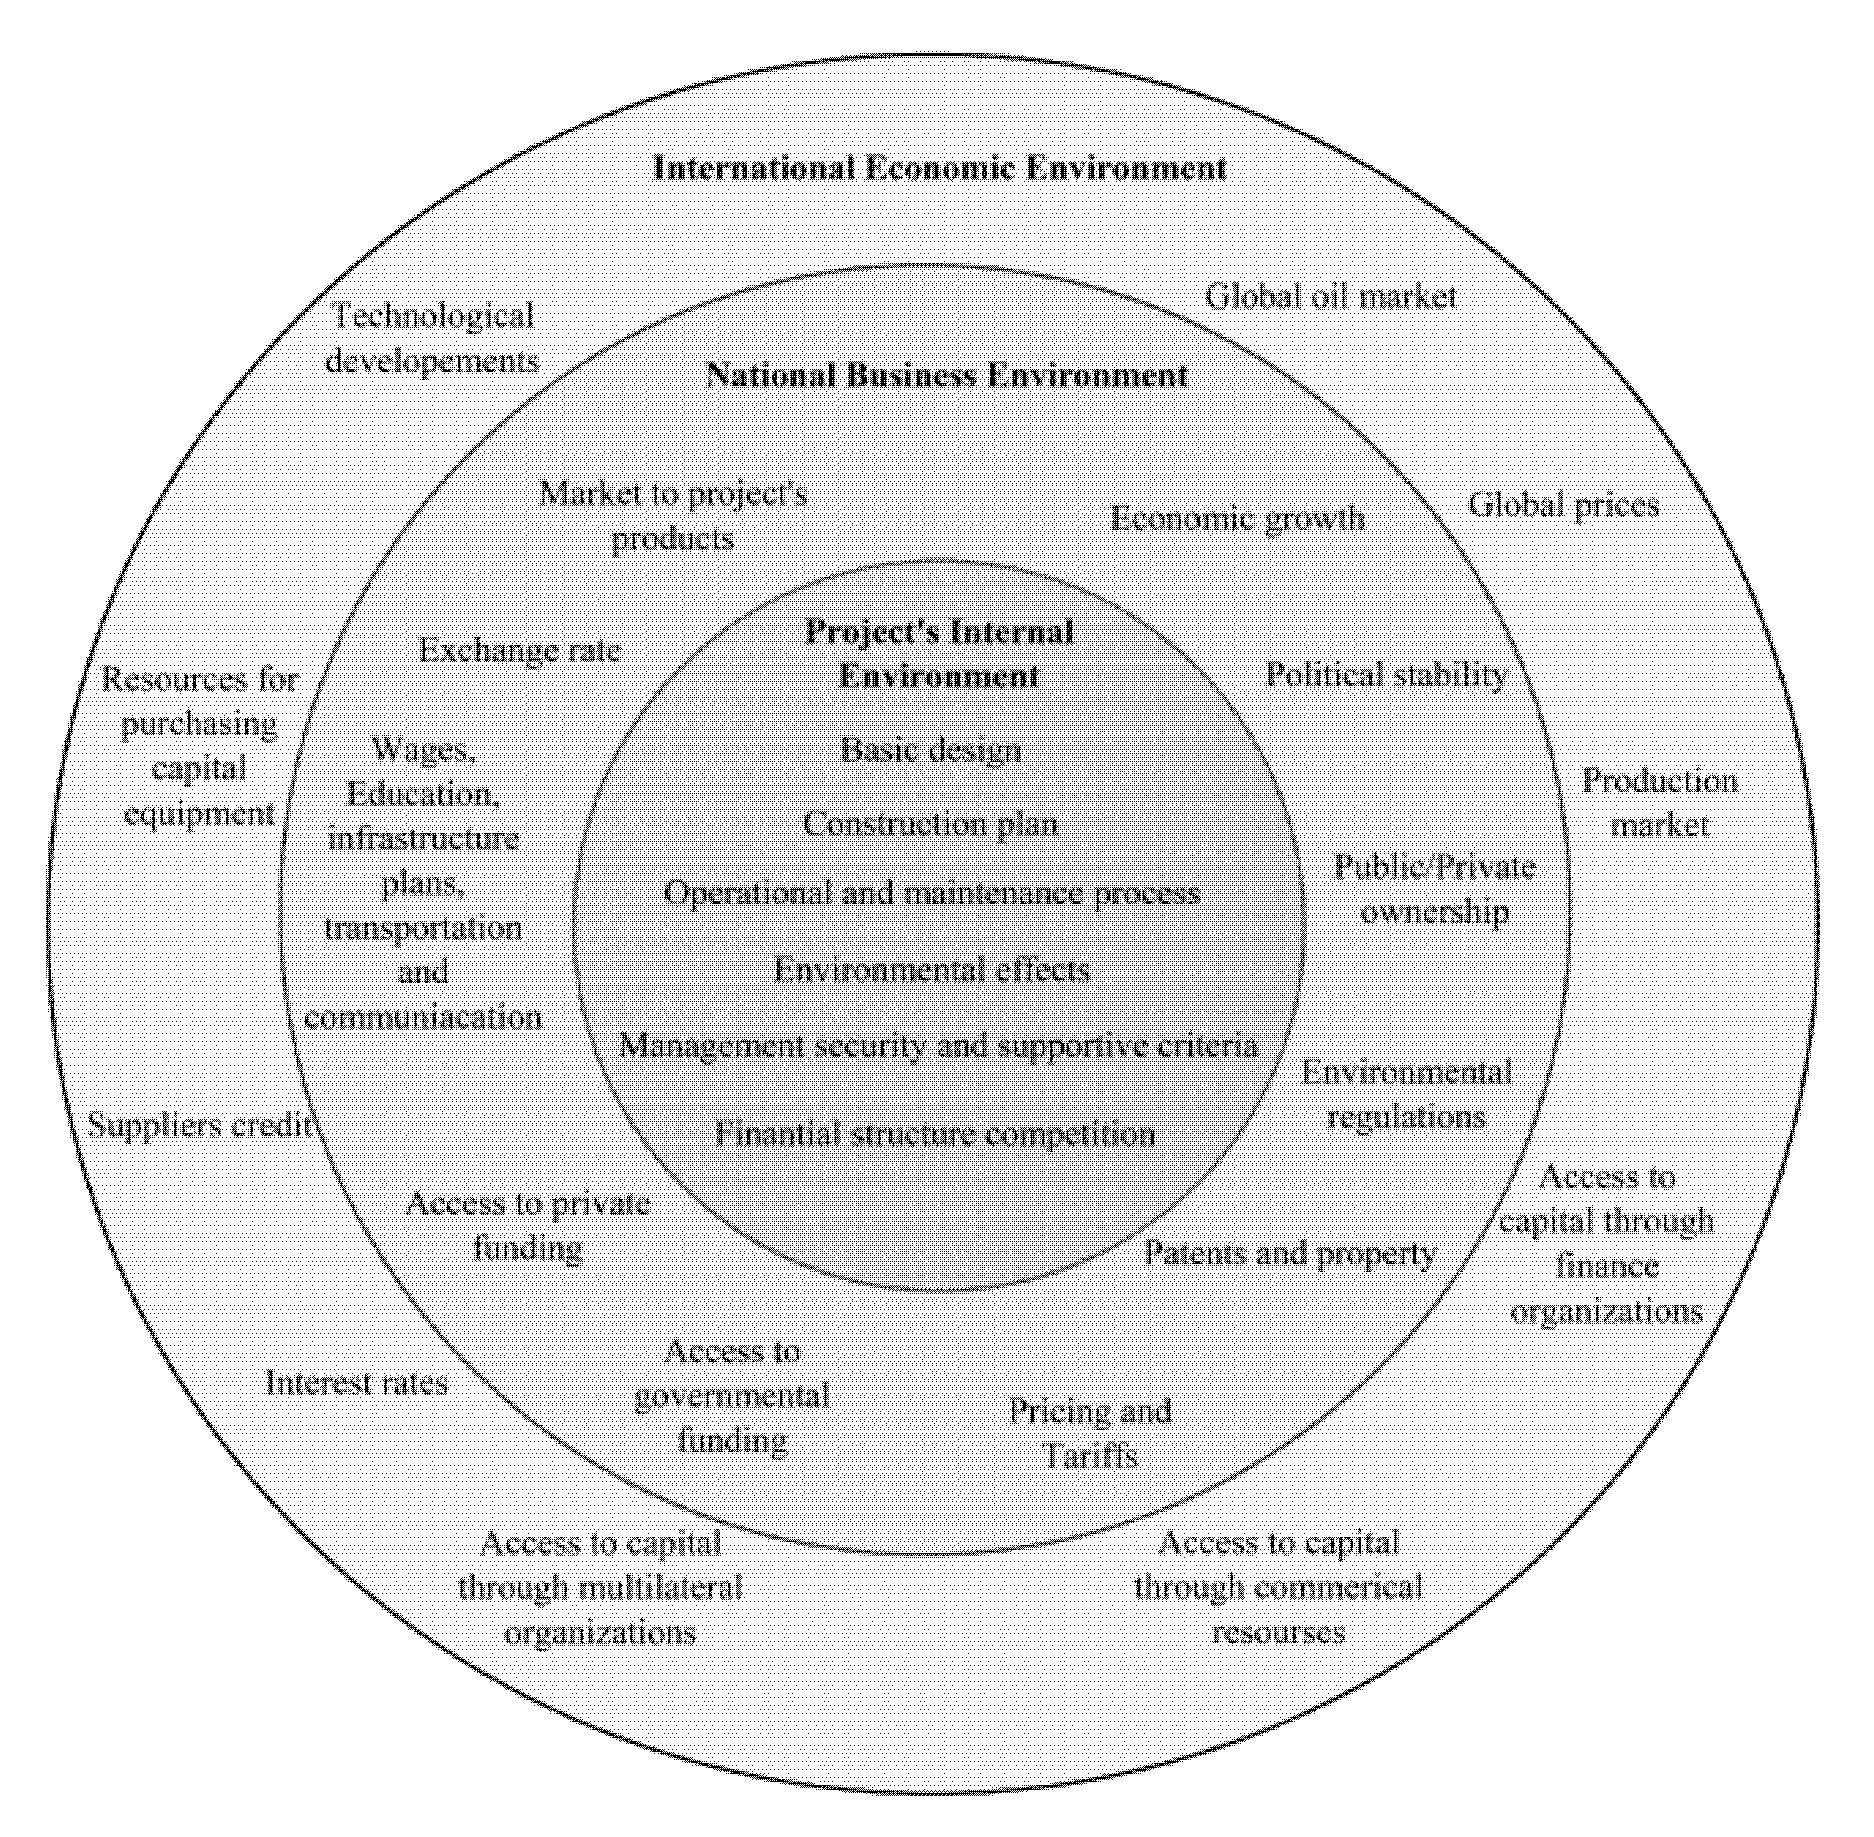
2.3. Project Complexity Analysis
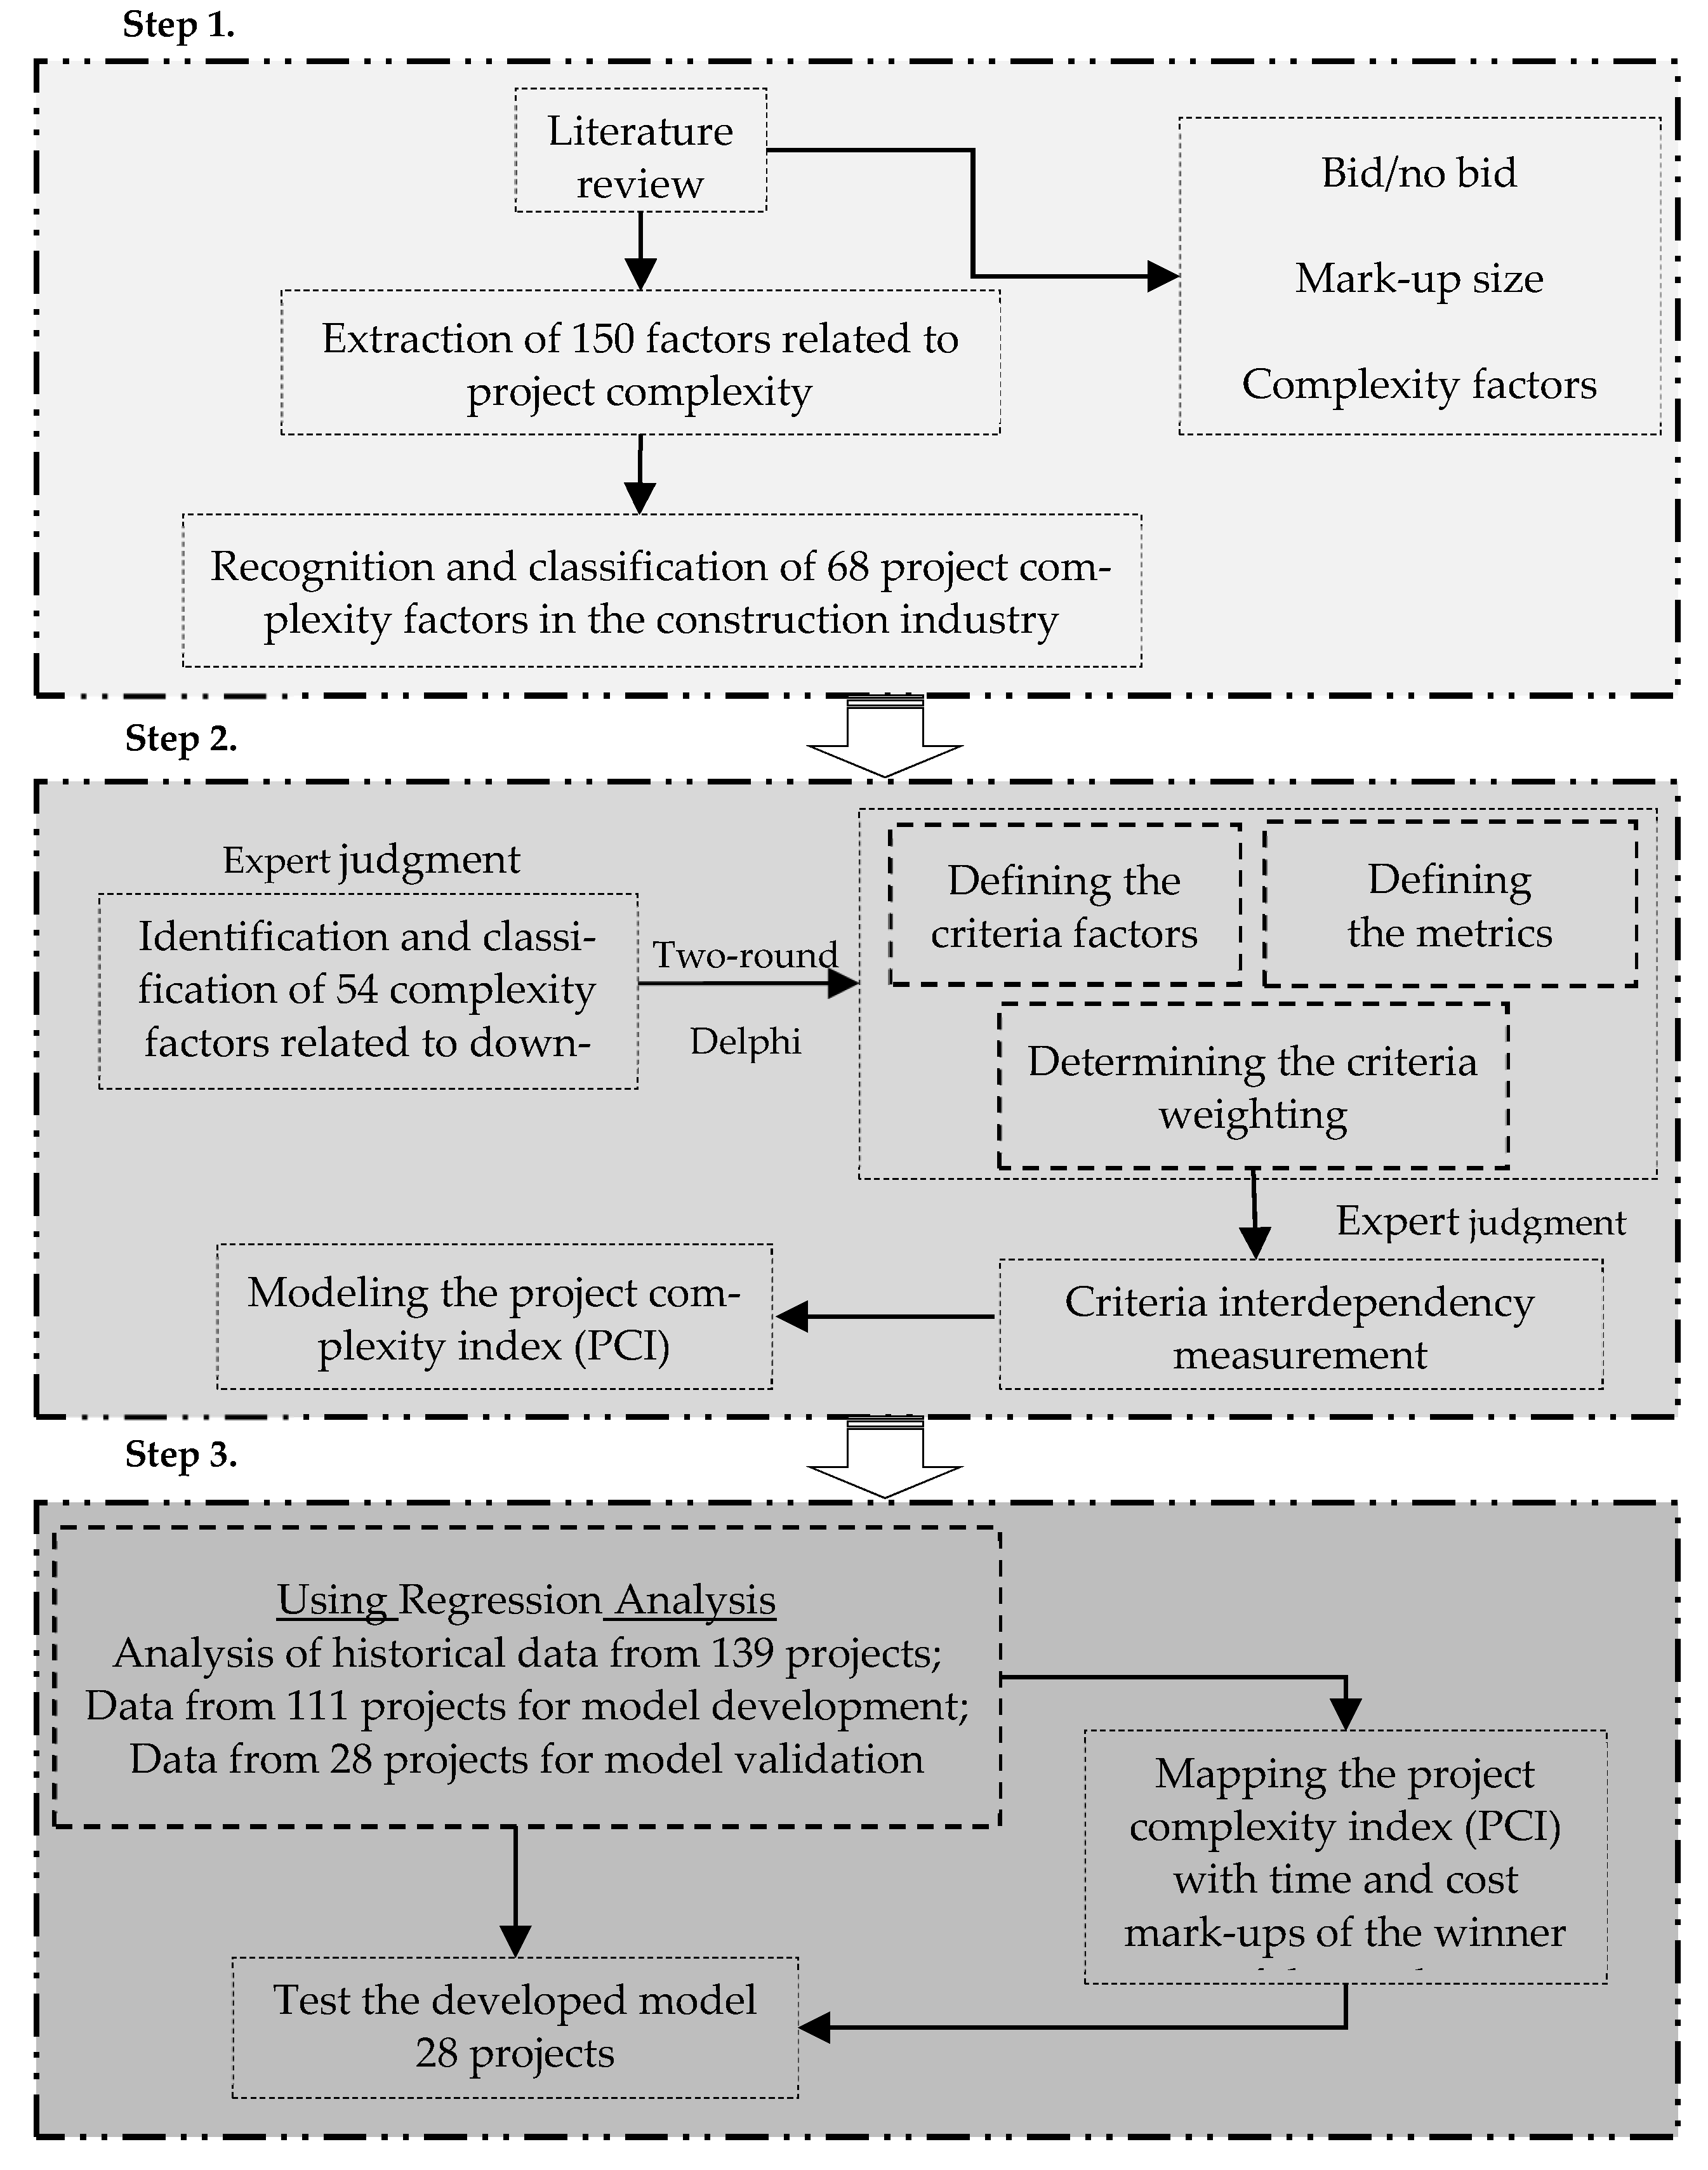
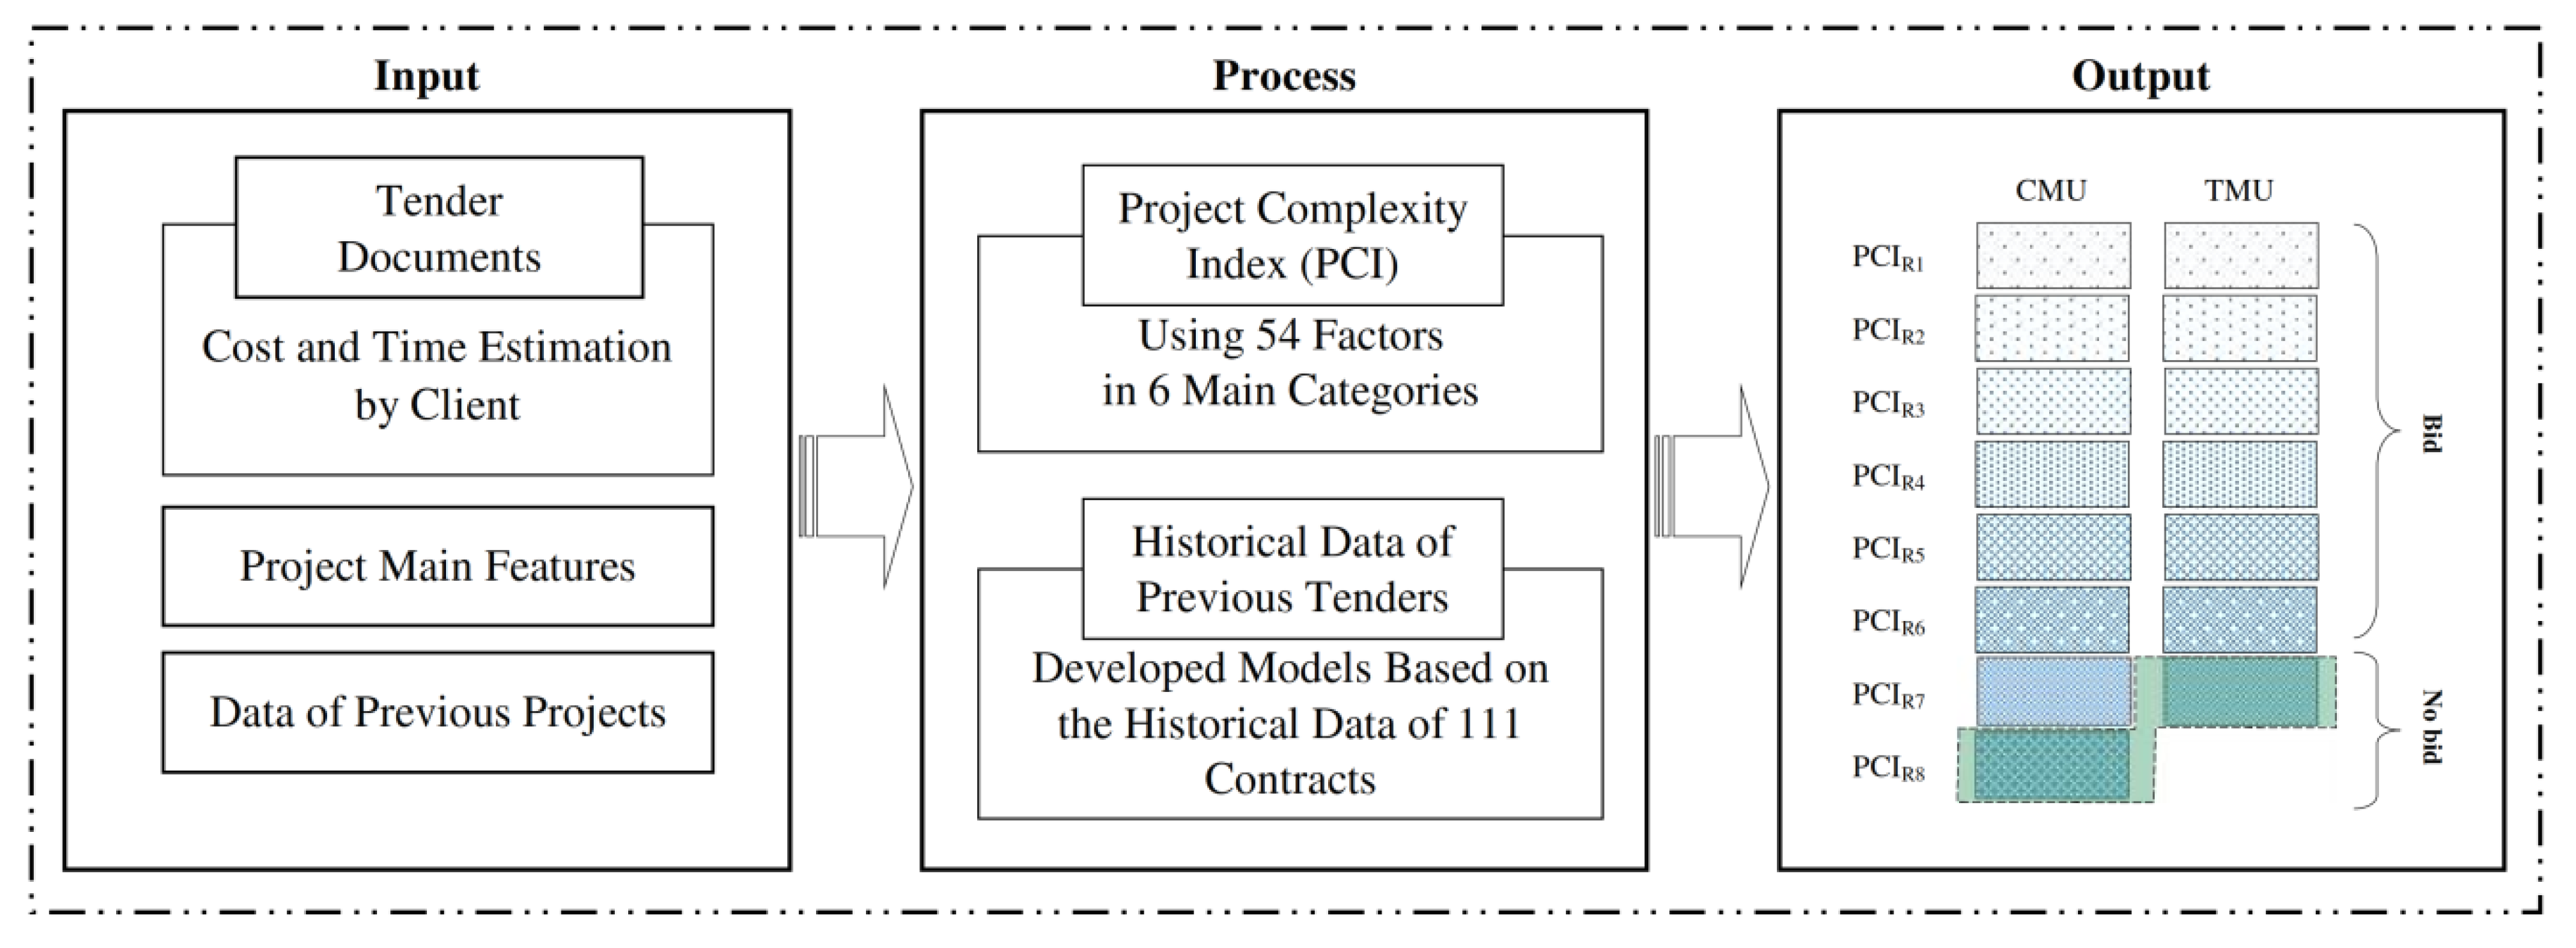
3. Research Methodology
- PCI is the overall complexity index of the t-th project (Pt);
- pwi is the percentage weight of the i-th category of k, i = {1, 2, …, a = 6};
- ki is the i-th main category of factors;
- wj is the weight of the j-th factor in each main category, j = {1, 2, …, b}; and
- b is the number of factors in each of the six main categories.
4. Data Analysis and Results
4.1. Project Complexity Index (PCI)
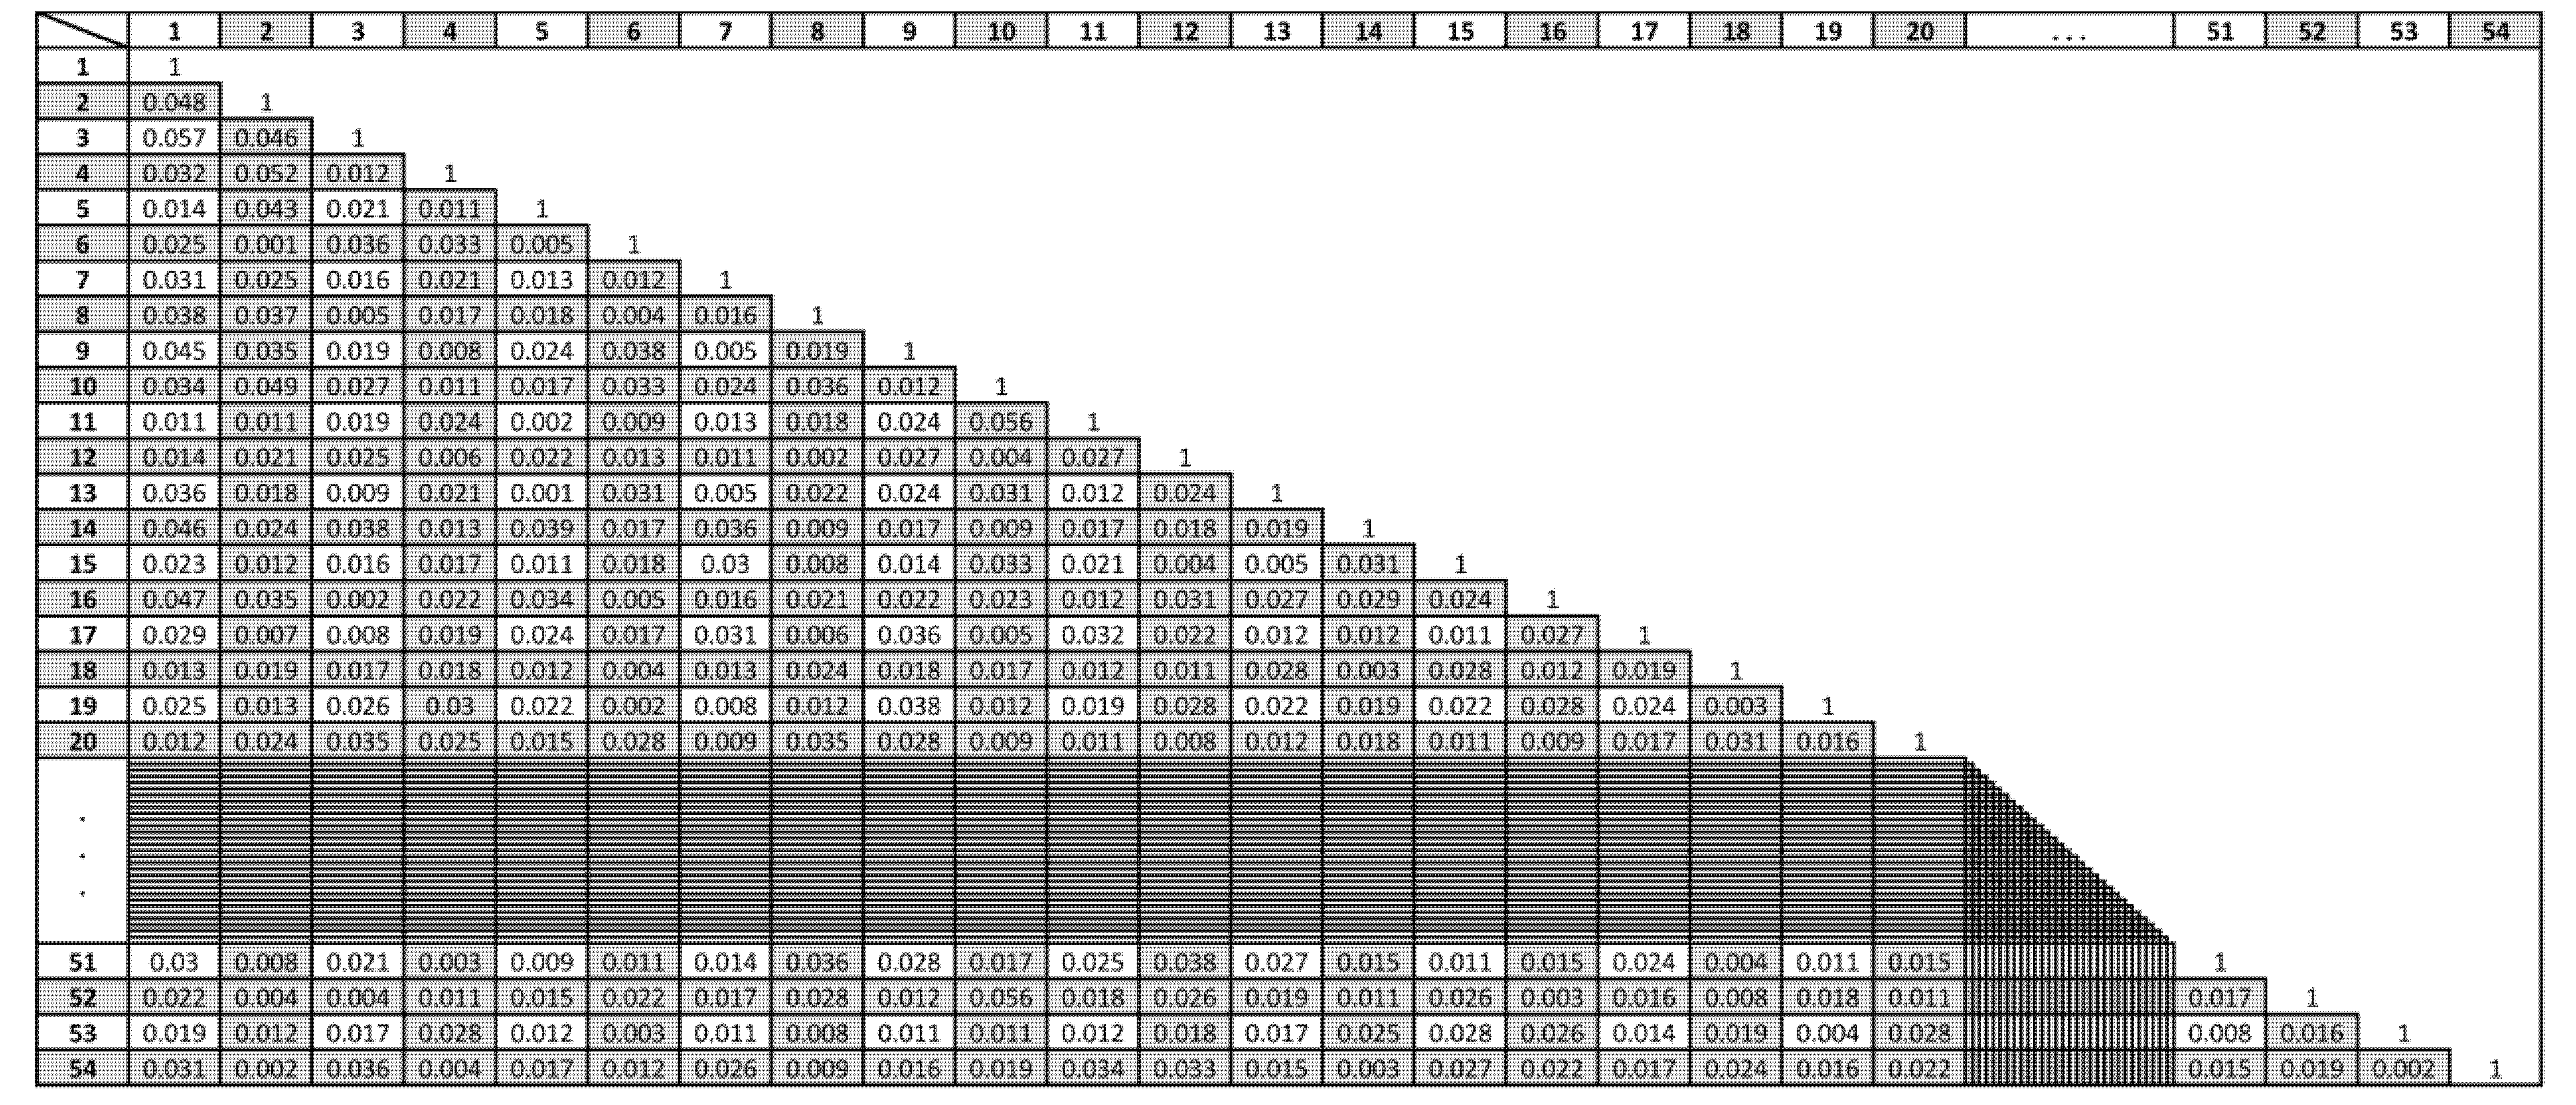
- To improve the precision of the complexity calculations based on a weighted method, the factors were classified into 6 main categories.
- Obviously, the main categories had no equal significance in project complexity calculations, and therefore, the percentage weight of each category was determined. Additionally, to have more precise results, the importance of each factor was characterized independently.
- To score each factor against project complexity, the document that should be considered main reference was specified. The usage of the same documents for factors’ complexity calculation is very crucial, because in this case, the comparison between different projects will be realistic.
- Having a reasonable quantitative range for each of the factors was another parameter that should be ascertained. For this purpose, a metric, graded from 1 to 10, was defined for each factor, based on which the factor will be quantified.
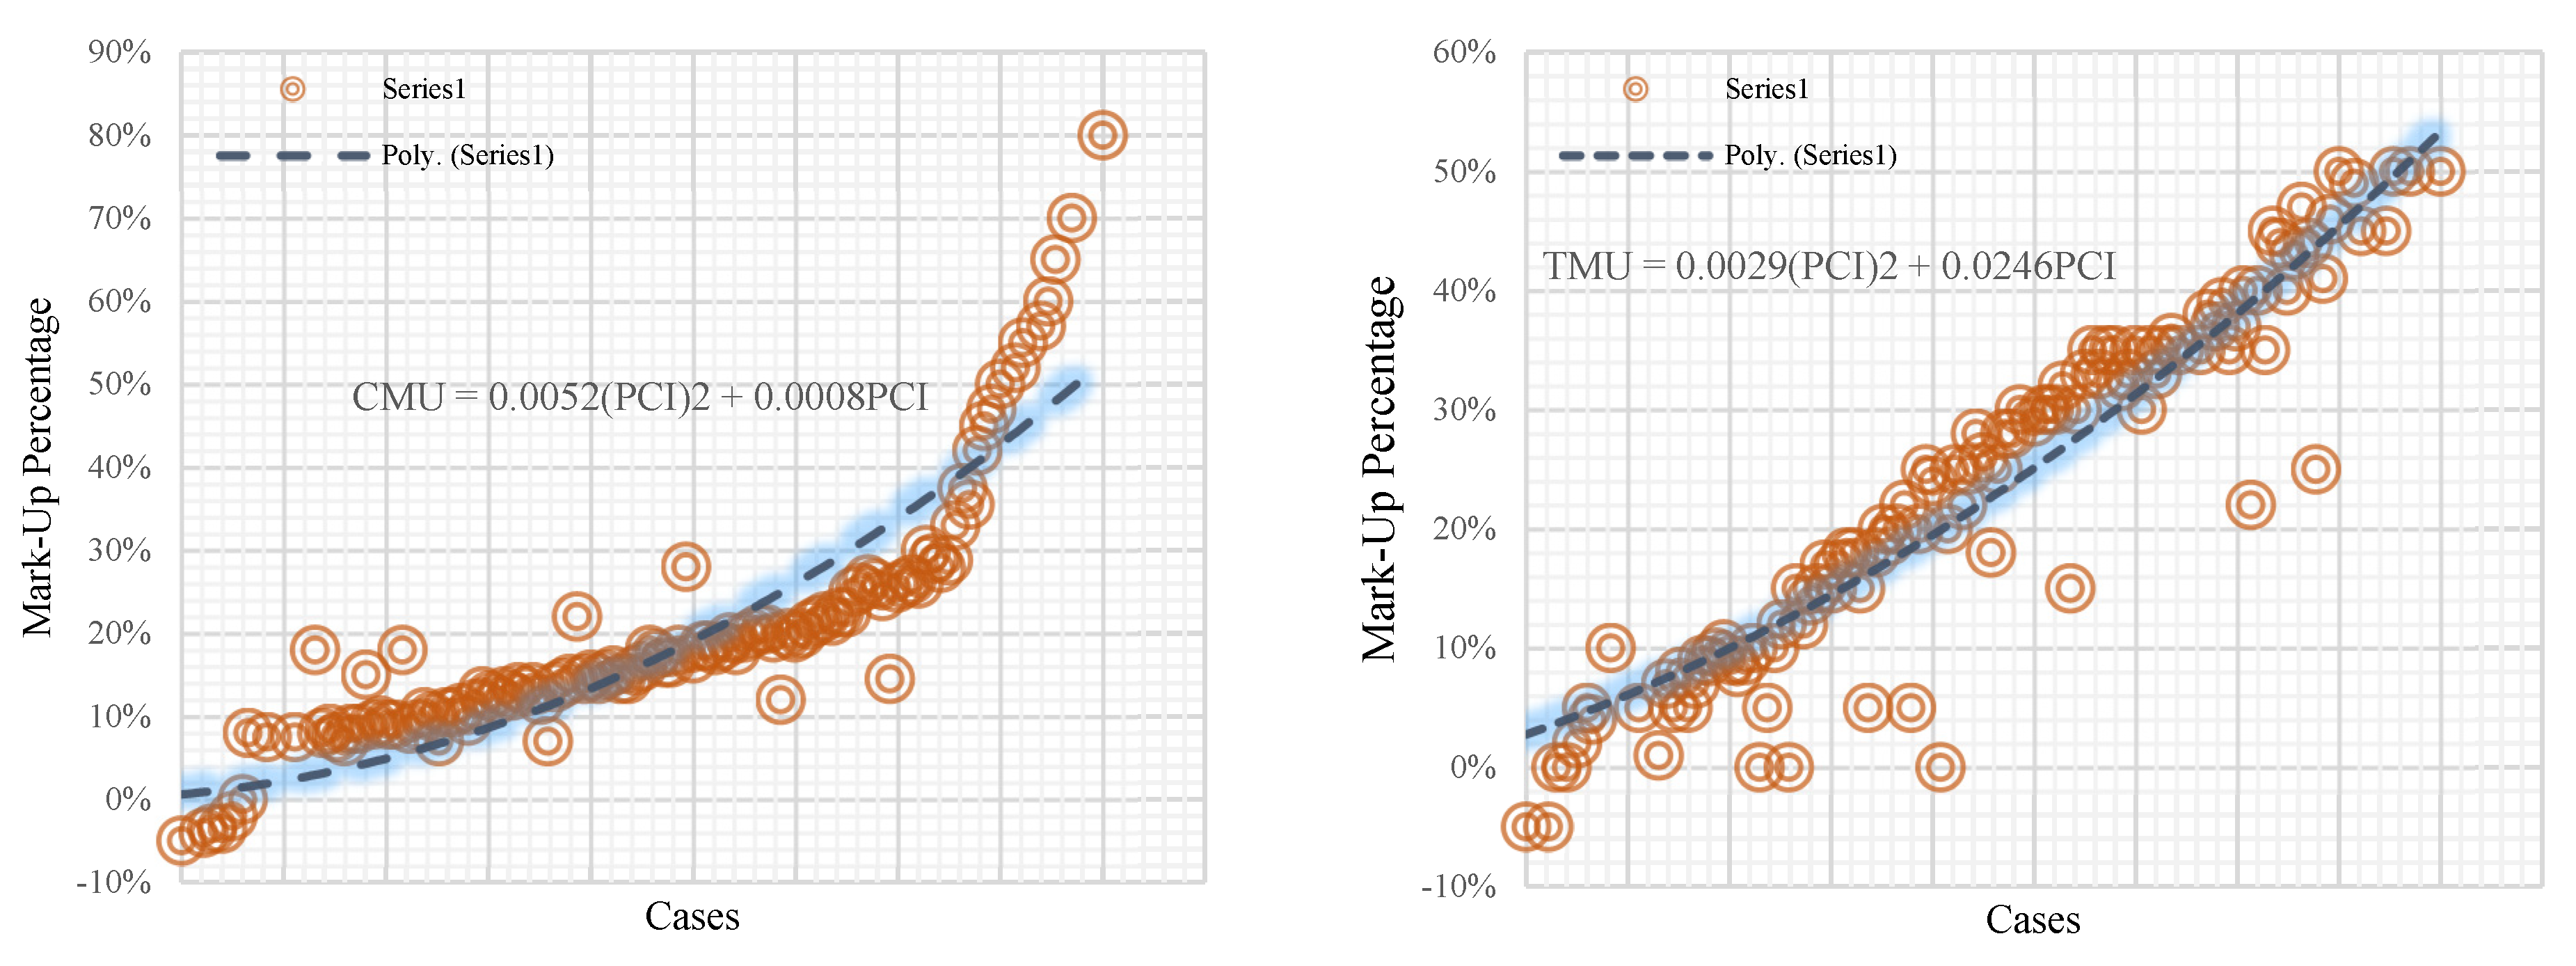
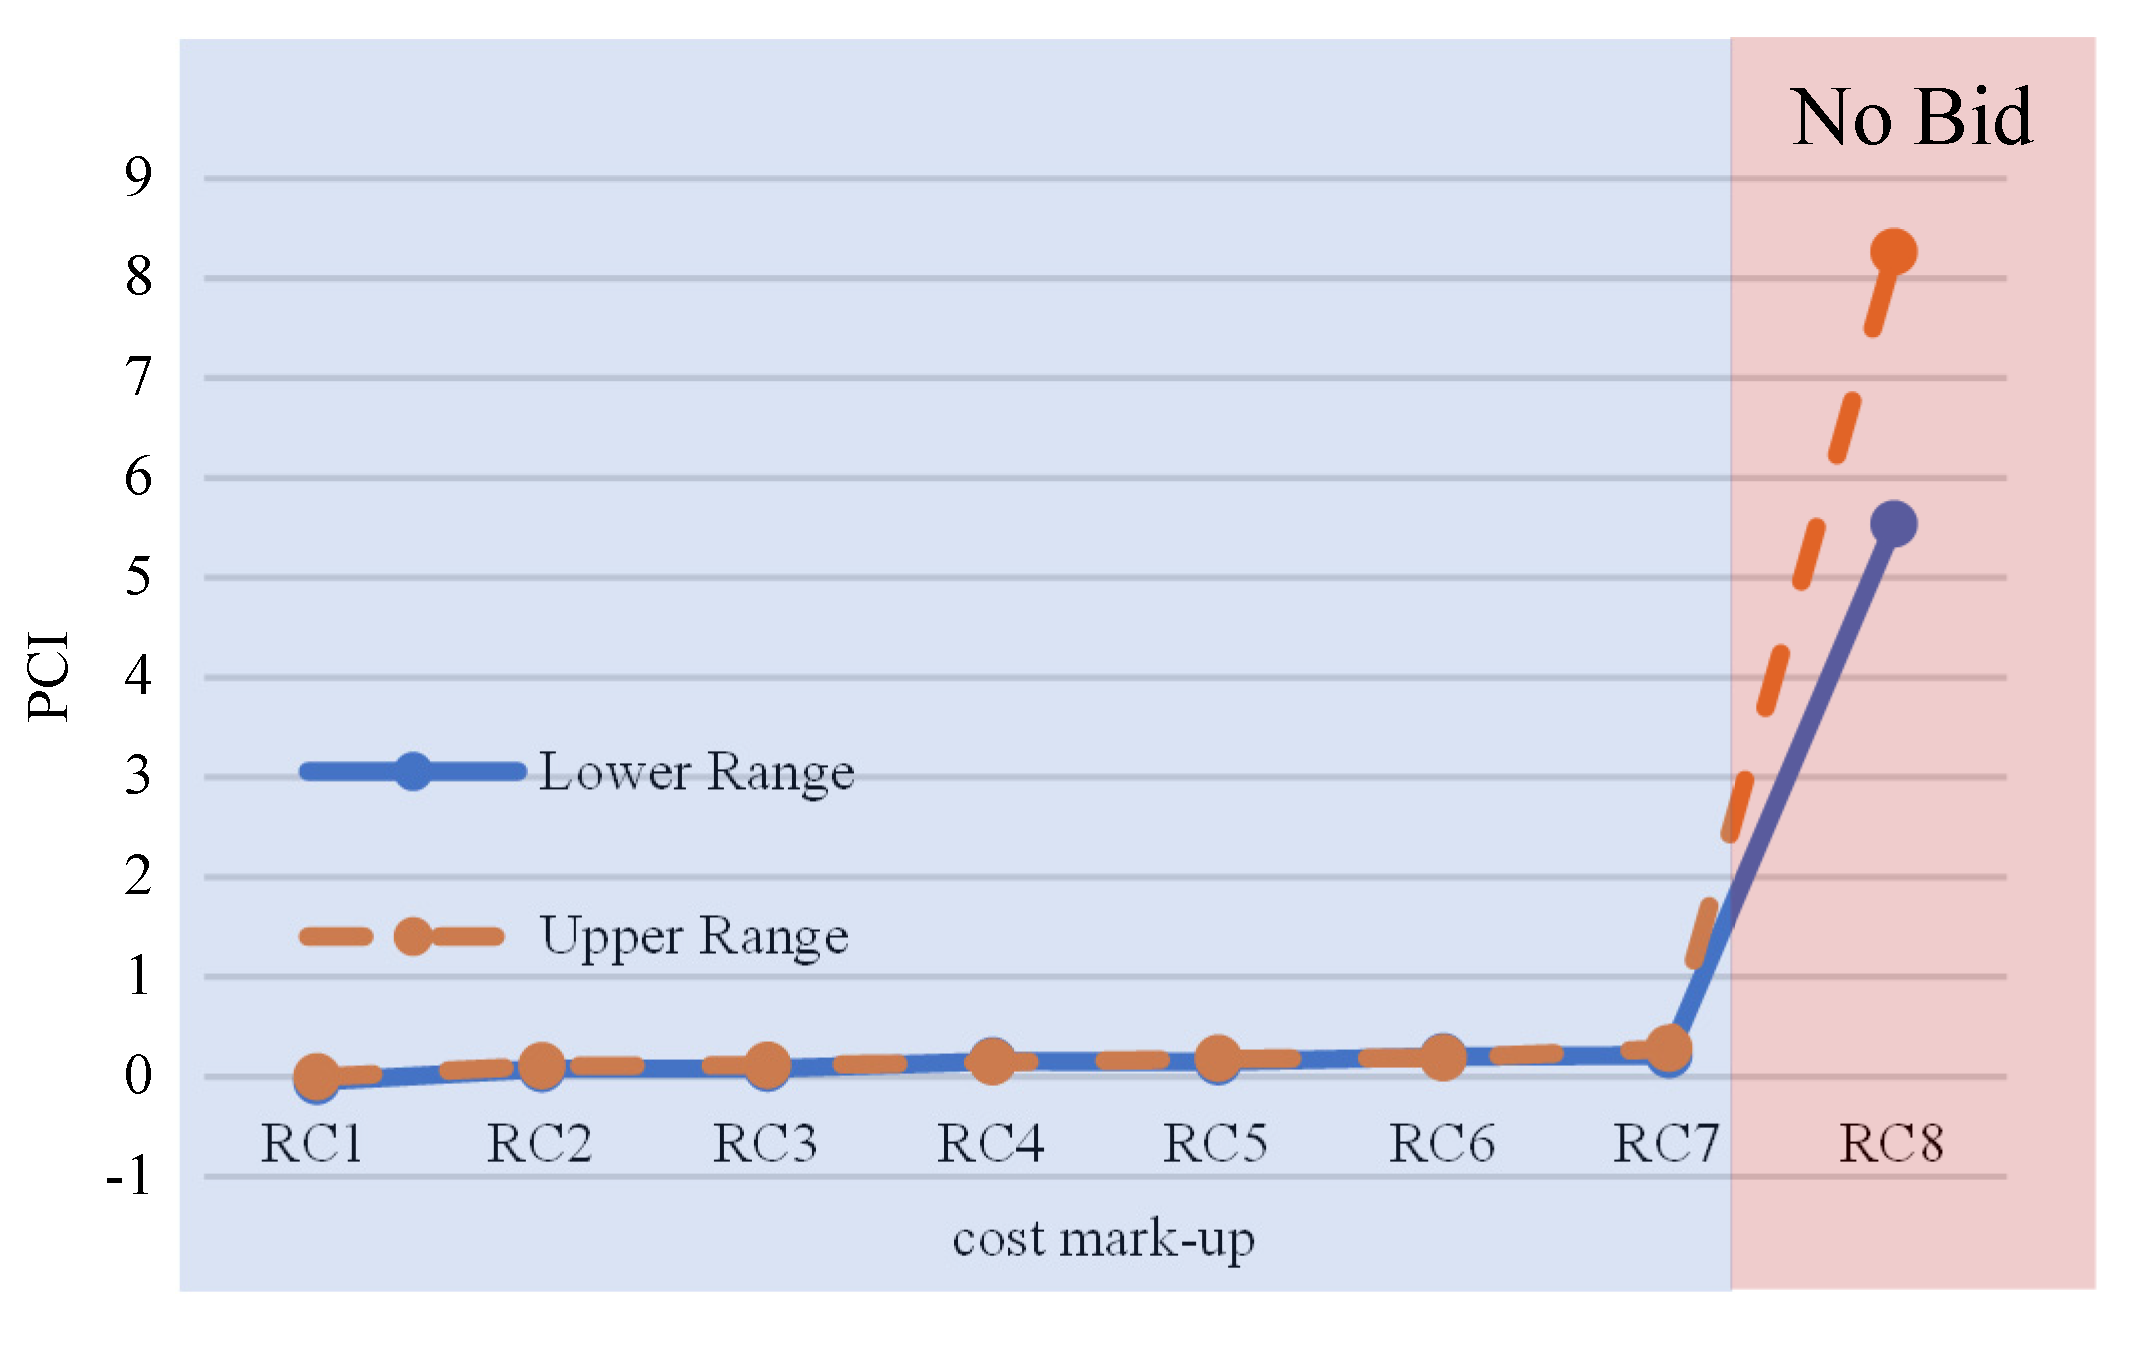
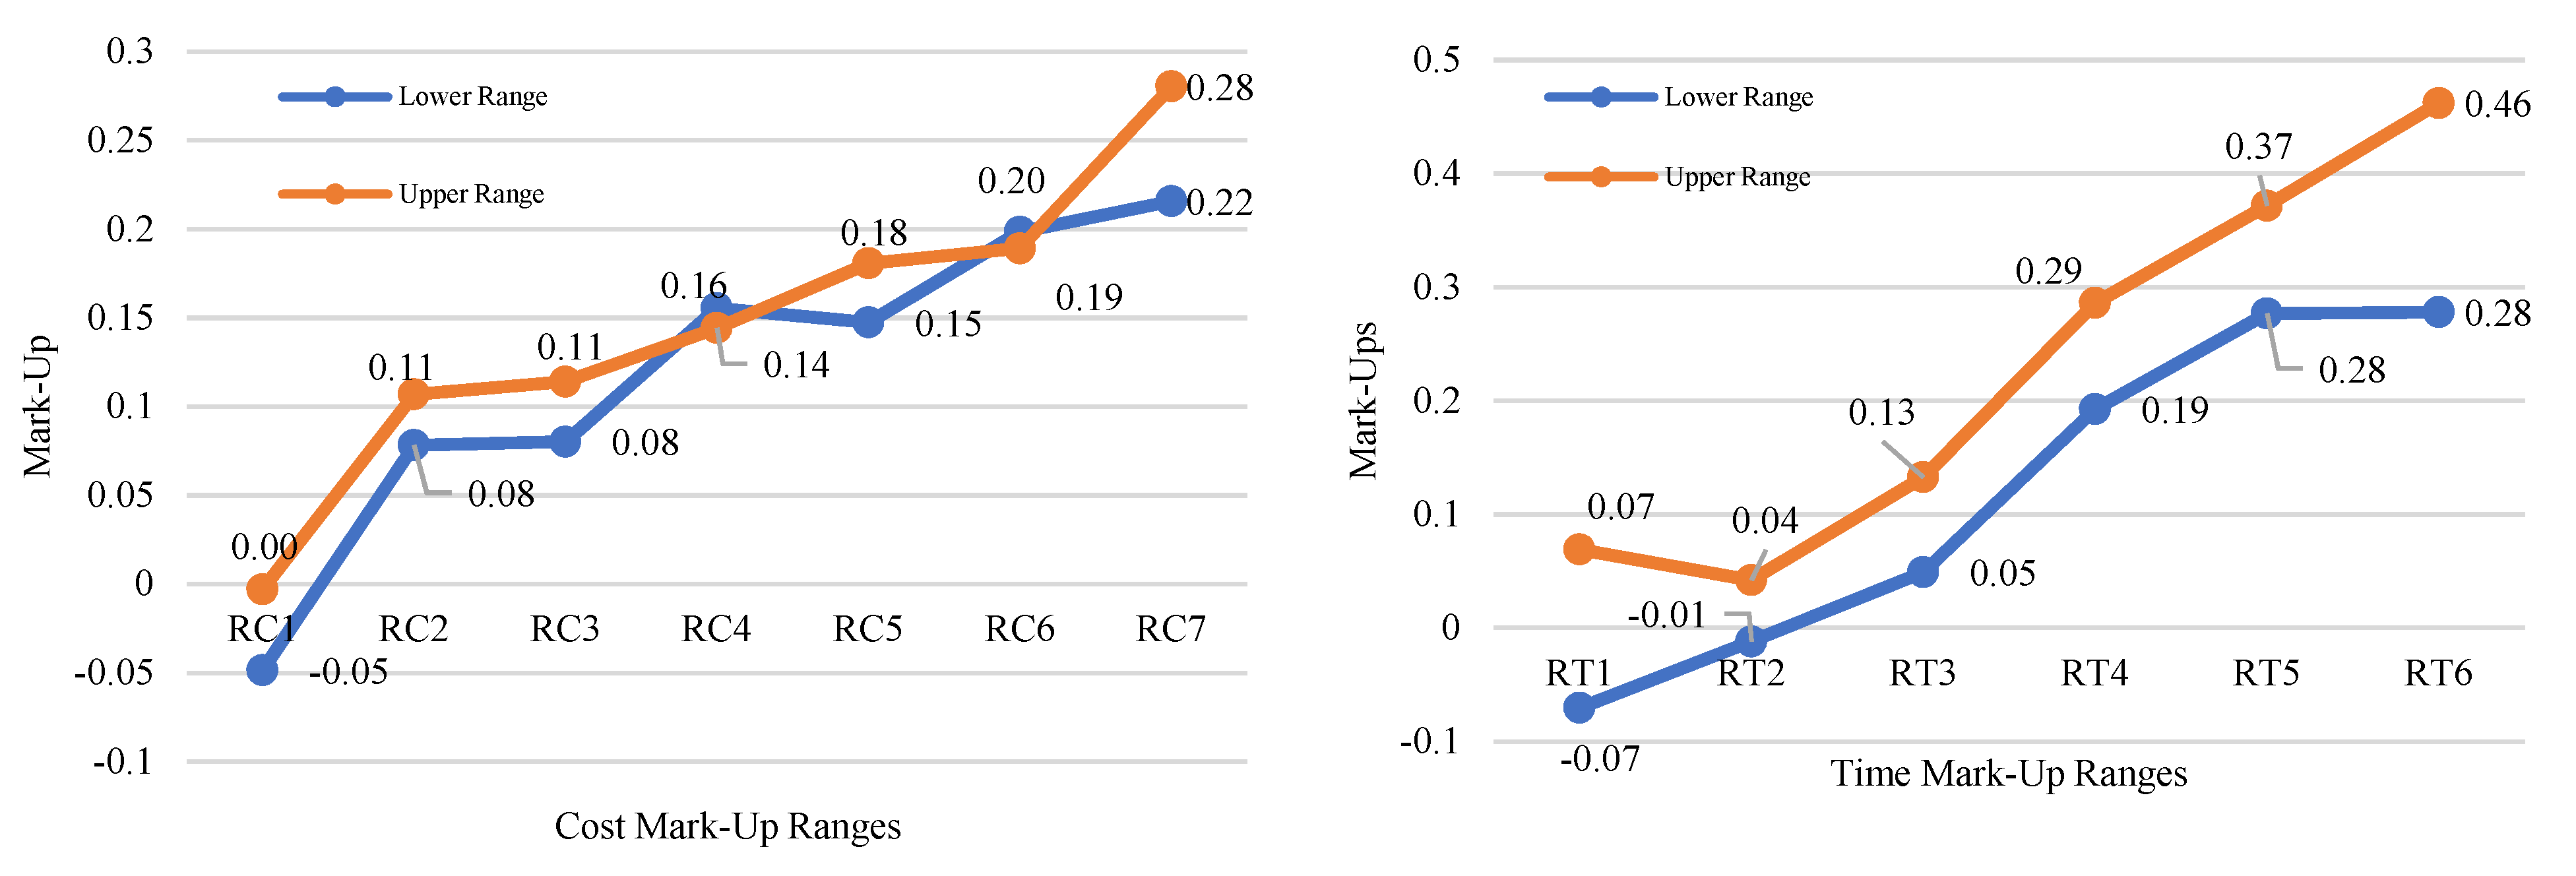
4.2. Mark-Ups of Contractor’s Proposal
- Substantially, there are no projects in this section of the industry with this level of complexity; or
- The contractors decide not to participate in the tender with high complexity (no-bid decision).
4.3. Model Validation and Research Limitations
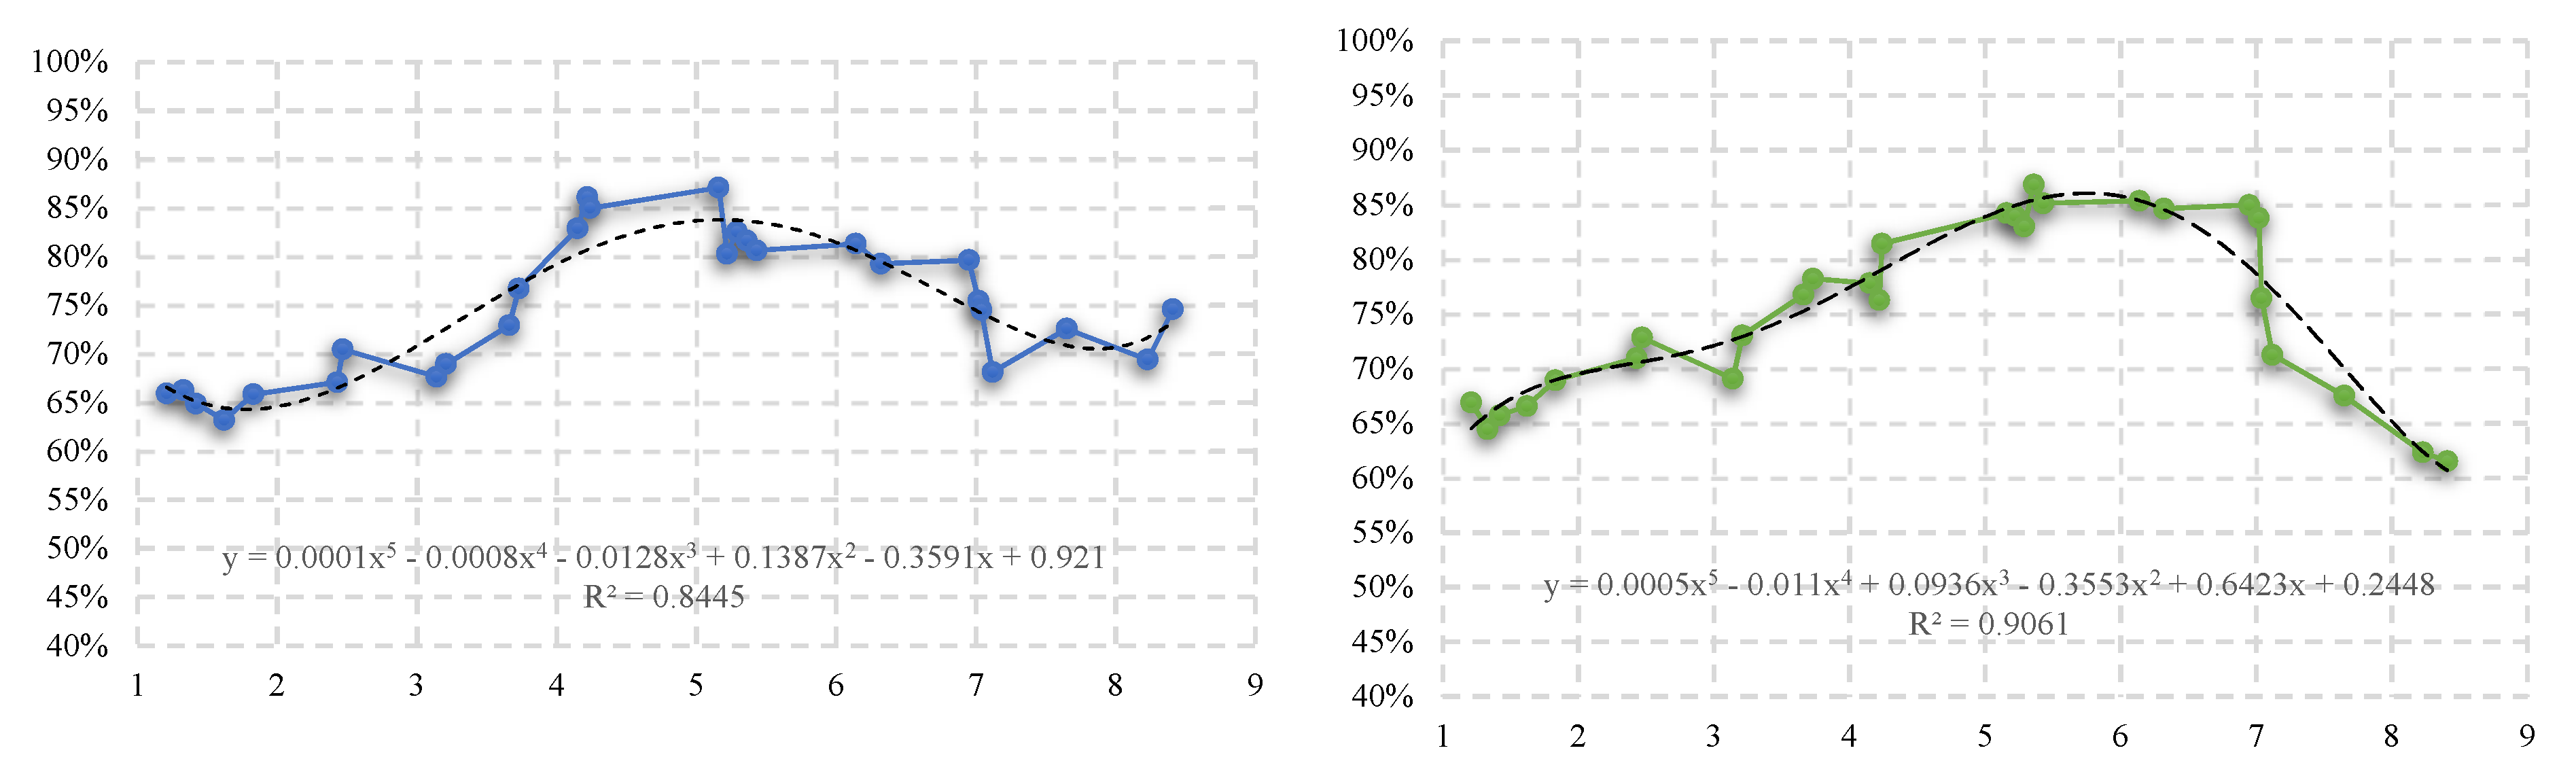
- Accuracy in both aspects of time and cost is close to 75%. Based on this fact, it can be inferred that the process of model development based on the discovery of the relation between project complexity and bid mark-ups makes sense overall. Otherwise, the calculated accuracy of the two separate datasets would have to be notably separated from each other.
- The model results are higher or lower than the actual data, and this can be seen in the positive and negative sign of the errors. The mean of the errors, regardless of their signs, is about 10% at both the time and cost mark-ups, meaning that the data collected for model development in both respects behaved similarly, and therefore, the results are reliable at around 90%.
- It can be inferred from the rate of accuracy against the PCI that this trend almost follows a normal distribution (Figure 7). This fact means that the reliability of the developed model is lower in low and high complexities and higher in complexities diffused around the mean. In fact, in the case of projects with high or low complexity, the contractors’ bids do not necessarily fully follow the logical pattern of the relationship between coefficients’ determination and subjective understanding of the complexity of the project.
- The model was established based on gathered data from: (a) projects in the downstream sector of the petroleum industry and (b) professionals in construction projects in Iran. Therefore, any effort to adapt the model to other sectors may need to re-review the complexity factors and modify the mark-up scales, and may necessitate considering specific parameters of the selected sector to develop a customized a model.
- Another limiting factor in the validation process is that decision making by the contractor in the tender process is a complicated multilateral problem that needs to reckon several attributes, which are held by those in the organization as vital internal or maybe even tacit knowledge. Therefore, it is not surprising that a wide range of quantitative, qualitative, and mixed approaches with different methodologies for modeling, inference, or reasoning can be observed in previous studies. Accordingly, comparing results with previous research is actually impossible, because any attempt in this regard will lead to a comparison of apples and oranges.
- Another limitation of the study is the number of projects (139) that were applied for both model training in the regression analysis and for testing of the developed model. Consequently, it is obvious that the resulting mathematical model was vigorously curbed by the volume of the database, which can be improved in the next investigations by expanding the input information for model training.
5. Discussion
5.1. A Bid/Mark-Up Decision Support Model and Firm Strategy under Complexity
5.2. A Bid/Mark-Up Decision Support Model and Open Innovation Dynamics
6. Implication and Future Research Topic
Author Contributions
Funding
Institutional Review Board Statement
Informed Consent Statement
Data Availability Statement
Conflicts of Interest
References
- Shash, A.A. Factors considered in tendering decisions by top UK contractors. Constr. Manag. Econ. 1993, 11, 111–118. [Google Scholar] [CrossRef]
- Soltaninejad, M.; Faraji, A.; Noorzai, E. Recognizing the effective factors in managing fire incidents to reduce the collateral damages and casualties. Facilities 2021. ahead-of-print. [Google Scholar] [CrossRef]
- Faraji, A.; Rashidi, M.; Tezangi, M.R.; Perera, S. Multihybrid Dispute Resolution Framework for Projects of Downstream Sector of Petroleum Industry. J. Leg. Aff. Disput. Resolut. Eng. Constr. 2021, 13, 4521026. [Google Scholar] [CrossRef]
- Golabchi, M.; Faraji, A. Project Strategic Management; Press University of Tehran: Tehran, Iran, 2010. [Google Scholar]
- Tavakoli, A.; Utomo, J. Bid markup assistant: An expert system. Cost Eng. 1989, 31, 28. [Google Scholar]
- Carr, R.I.; Sandahl, J.W. Bidding strategy using multiple regression. J. Constr. Div. 1978, 104, 15–26. [Google Scholar] [CrossRef]
- Ahmad, I.; Minkarah, I. An expert system for selecting bid markups. In Proceedings of the Computing in Civil Engineering: Microcomputers to Supercomputers; ASCE: Reston, VA, USA, 1988; pp. 229–238. [Google Scholar]
- Kalan, D.; Ozbek, M.E. Development of a Construction Project Bidding Decision-Making Tool. Pract. Period. Struct. Des. Constr. 2020, 25, 04019032. [Google Scholar] [CrossRef]
- Kumar, J.K.; Raj, V. A Study on Key Factors Influencing Bid Decision Model for Construction Projects. In IOP Conference Series: Materials Science and Engineering; IOP Publishing: Bristol, UK, 2019; Volume 574, p. 12004. [Google Scholar]
- Chileshe, N.; Kavishe, N.; Edwards, D.J. Critical factors influencing the bid or no-bid decision of the indigenous small building contractors in Tanzania. Constr. Innov. 2020, 21, 182–202. [Google Scholar] [CrossRef]
- Egemen, M.; Mohamed, A. SCBMD: A knowledge-based system software for strategically correct bid/no bid and mark-up size decisions. Autom. Constr. 2008, 17, 864–872. [Google Scholar] [CrossRef]
- Drew, D.; Skitmore, M.; Lo, H.P. The effect of client and type and size of construction work on a contractor’s bidding strategy. Build. Environ. 2001, 36, 393–406. [Google Scholar] [CrossRef]
- El-Mashaleh, M.S.; Al-Jundi, A.; Mattar, S.; Abu Ali, R.; Al-Hammad, J. Understanding key bidding factors considered by top Jordanian contractors. Jordan J. Civ. Eng. 2014, 159, 1–10. [Google Scholar]
- Faraji, A.; Rashidi, M.; Sorooshnia, E. An Integrated Organizational System for Project Source Selection in the Major Iranian Construction Companies. Buildings 2020, 10, 251. [Google Scholar] [CrossRef]
- Faraji, A. Smart Contract Based Conceptual Model for Optimizing Risk Distribution in Construction Industry. In Proceedings of the 3rd International Conference on Applied Researches in Structual Engineering and Construction Management, Chicago, IL, USA, 20–25 May 2019. [Google Scholar]
- Alsaedi, M.; Assaf, S.; Hassanain, M.A.; Abdallah, A. Factors affecting contractors’ bidding decisions for construction projects in Saudi Arabia. Buildings 2019, 9, 33. [Google Scholar] [CrossRef]
- Faraji, A.; Rashidi, M.; Khadir, P.; Perera, S. A Risk Analysis-Best Worst Method Based Model for Selection of the Most Appropriate Contract Strategy for Onshore Drilling Projects in the Iranian Petroleum Industry. Buildings 2021, 11, 97. [Google Scholar] [CrossRef]
- Ravanshadnia, M.; Rajaie, H.; Abbasian, H.R. A comprehensive bid/no-bid decision making framework for construction companies. Iran. J. Sci. Technol. Trans. B Eng. 2011, 35, 95–103. [Google Scholar]
- Chua, D.K.H.; Li, D.Z.; Chan, W.T. Case-based reasoning approach in bid decision making. J. Constr. Eng. Manag. 2001, 127, 35–45. [Google Scholar] [CrossRef]
- Vale, J.; Barbosa, N.; Bertuzi, R.; Bandeira, A.M.; Vale, V.T. Intellectual Capital Change Management in the Construction Industry—The Case of an Inter-Organisational Collaboration. J. Open Innov. Technol. Mark. Complex. 2021, 7, 199. [Google Scholar] [CrossRef]
- Teodorescu, M.; Korchagina, E. Applying Blockchain in the Modern Supply Chain Management: Its Implication on Open Innovation. J. Open Innov. Technol. Mark. Complex. 2021, 7, 80. [Google Scholar] [CrossRef]
- Fellows, R.F.; Langford, D.A. Decision theory and tendering. Build. Technol. Manag. 1980, 18, 36–39. [Google Scholar]
- Faraji, A.; Rashidi, M.; Perera, S. Text Mining Risk Assessment–Based Model to Conduct Uncertainty Analysis of the General Conditions of Contract in Housing Construction Projects: Case Study of the NSW GC21. J. Archit. Eng. 2021, 27, 4021025. [Google Scholar] [CrossRef]
- Fine, B. Tendering strategy. Building 1975, 115–121. [Google Scholar]
- Lin, C.-T.; Chen, Y.-T. Bid/no-bid decision-making—A fuzzy linguistic approach. Int. J. Proj. Manag. 2004, 22, 585–593. [Google Scholar] [CrossRef]
- Lee, S.; Chang, L.-M. Bid-markup determination for microtunneling projects. Tunn. Undergr. Sp. Technol. 2004, 19, 151–163. [Google Scholar] [CrossRef]
- Drew, D.S.; Skitmore, R.M. Prequalification and C-competitiveness. Omega 1993, 21, 363–375. [Google Scholar] [CrossRef][Green Version]
- Flanagan, R.; Norman, G. Risk analysis-an extension of price prediction techniques for building Work. Constr. Pap. 1982, 1, 27–34. [Google Scholar]
- Laryea, S.; Hughes, W. How contractors price risk in bids: Theory and practice. Constr. Manag. Econ. 2008, 26, 911–924. [Google Scholar] [CrossRef]
- Cheaitou, A.; Larbi, R.; Al Housani, B. Decision making framework for tender evaluation and contractor selection in public organizations with risk considerations. Socioecon. Plann. Sci. 2019, 68, 100620. [Google Scholar] [CrossRef]
- Fayek, A.; Young, D.M.; Duffield, C.F. A survey of tendering practices in the Australian construction industry. Eng. Manag. J. 1998, 10, 29–34. [Google Scholar] [CrossRef]
- Cagno, E.; Caron, F.; Mancini, M. A Bayesian Approach for the Bidding Phase to Estimate the Cause Probability of an Uncertain Event. Proj. Manag. 2002, 8, 83. [Google Scholar]
- Dikmen, I.; Birgonul, M.T.; Gur, A.K. A case-based decision support tool for bid mark-up estimation of international construction projects. Autom. Constr. 2007, 17, 30–44. [Google Scholar] [CrossRef]
- Bageis, A.S.; Fortune, C. Factors affecting the bid/no bid decision in the Saudi Arabian construction contractors. Constr. Manag. Econ. 2009, 27, 53–71. [Google Scholar] [CrossRef]
- Marzouk, M.; Mohamed, E. Modeling bid/no bid decisions using fuzzy fault tree. Constr. Innov. 2017, 18, 90–108. [Google Scholar] [CrossRef]
- Perera, B.; Wijewickrama, M.; Ranaweera, W.; Gamage, I.S.W. Significant factors influencing the bid mark-up decision of infrastructure projects in Sri Lanka. Int. J. Constr. Manag. 2019, 21, 1–15. [Google Scholar] [CrossRef]
- Oyeyipo, O.; Odusami, K.T.; Ojelabi, R.A.; Afolabi, A.O. Factors affecting contractors’ bidding decisions for construction projects in Nigeria. J. Constr. Dev. Ctries. 2016, 21, 21–35. [Google Scholar] [CrossRef]
- Kumar, J.K.; Raj, S.V. Bid decision model for construction projects—A review. Mater. Today Proc. 2020, 22, 688–690. [Google Scholar] [CrossRef]
- Pereira, L.; Fernandes, A.; Sempiterno, M.; Dias, Á.; Lopes da Costa, R.; António, N. Knowledge Management Maturity Contributes to Project-Based Companies in an Open Innovation Era. J. Open Innov. Technol. Mark. Complex. 2021, 7, 126. [Google Scholar] [CrossRef]
- Tereshko, E.; Romanovich, M.; Rudskaya, I. Readiness of Regions for Digitalization of the Construction Complex. J. Open Innov. Technol. Mark. Complex. 2021, 7, 2. [Google Scholar] [CrossRef]
- Kleber, D.M.; Juusola, K. Open Innovation—An Explorative Study on Value Co-Creation Tools for Nation Branding and Building a Competitive Identity. J. Open Innov. Technol. Mark. Complex. 2021, 7, 206. [Google Scholar] [CrossRef]
- Mills, A. A systematic approach to risk management for construction. Struct. Surv. 2001, 9, 245–252. [Google Scholar] [CrossRef]
- Mulholland, B.; Christian, J. Risk assessment in construction schedules. J. Constr. Eng. Manag. 1999, 125, 8–15. [Google Scholar] [CrossRef]
- Baccarini, D. The concept of project complexity—A review. Int. J. Proj. Manag. 1996, 14, 201–204. [Google Scholar] [CrossRef]
- Romero, M.C.; Lara, P.; Villalobos, J. Evolution of the Business Model: Arriving at Open Business Model Dynamics. J. Open Innov. Technol. Mark. Complex. 2021, 7, 86. [Google Scholar] [CrossRef]
- Hadi, N.; Udin, U. Testing the Effectiveness of CSR Dimensions for Small Business Entrepreneurs. J. Open Innov. Technol. Mark. Complex. 2021, 7, 6. [Google Scholar] [CrossRef]
- Butt, A.S.; Arshi, T.A.; Rao, V.; Tewari, V. Implications of Belt and Road Initiative for Supply Chain Management: A Holistic View. J. Open Innov. Technol. Mark. Complex. 2020, 6, 136. [Google Scholar] [CrossRef]
- Santana, G. Classification of construction projects by scales of complexity. Int. J. Proj. Manag. 1990, 8, 102–104. [Google Scholar] [CrossRef]
- Turner, J.R.; Cochrane, R.A. Goals-and-methods matrix: Coping with projects with ill defined goals and/or methods of achieving them. Int. J. Proj. Manag. 1993, 11, 93–102. [Google Scholar] [CrossRef]
- Williams, T.M. The need for new paradigms for complex projects. Int. J. Proj. Manag. 1999, 17, 269–273. [Google Scholar] [CrossRef]
- Girmscheid, G.; Brockmann, C. The inherent complexity of large scale engineering projects. Proj. Perspect. 2008, 29, 22–26. [Google Scholar]
- Vidal, L.; Marle, F. Understanding project complexity: Implications on project management. Kybernetes 2008, 37, 1094–1110. [Google Scholar] [CrossRef]
- Geraldi, J.; Maylor, H.; Williams, T. Now, let’s make it really complex (complicated). Int. J. Oper. Prod. Manag. 2011, 31, 966–990. [Google Scholar] [CrossRef]
- Ramasesh, R.V.; Browning, T.R. A conceptual framework for tackling knowable unknown unknowns in project management. J. Oper. Manag. 2014, 32, 190–204. [Google Scholar] [CrossRef]
- He, Q.; Luo, L.; Hu, Y.; Chan, A.P.C. Measuring the complexity of mega construction projects in China—A fuzzy analytic network process analysis. Int. J. Proj. Manag. 2015, 33, 549–563. [Google Scholar] [CrossRef]
- Carral, L.; Tarrío-Saavedra, J.; Iglesias, G.; San-Cristobal, J.R. Evaluation of the structural complexity of organisations and products in naval-shipbuilding projects. Ships Offshore Struct. 2020, 16, 670–685. [Google Scholar] [CrossRef]
- GAPPS. Crawford-Ishikura Factor Table for Evaluating Roles. 2007. Available online: https://www.projectmanagement.com/content/attachments/Primus1_201011023434.pdf (accessed on 1 October 2007).
- IPMA & AIPM. Complexity Matrix, 2015.
- Poveda-Bautista, R.; Diego-Mas, J.-A.; Leon-Medina, D. Measuring the project management complexity: The case of information technology projects. Complexity 2018, 2018, 6058480. [Google Scholar] [CrossRef]
- Dao, B.; Kermanshachi, S.; Shane, J.; Anderson, S. Project complexity assessment and management tool. Procedia Eng. 2016, 145, 491–496. [Google Scholar] [CrossRef][Green Version]
- Luo, L.; He, Q.; Xie, J.; Yang, D.; Wu, G. Investigating the relationship between project complexity and success in complex construction projects. J. Manag. Eng. 2017, 33, 4016036. [Google Scholar] [CrossRef]
- Bakhshi, J. Exploring Project Complexities and Their Problems: A Critical Review of the Literature. Doctoral Dissertation, University of Adelaide, Adelaide, Australia, 2016. [Google Scholar]
- Kermanshachi, S.; Dao, B.; Shane, J.; Anderson, S. Project complexity indicators and management strategies—A Delphi study. Procedia Eng. 2016, 145, 587–594. [Google Scholar] [CrossRef]
- Abdou, S.M.; Yong, K.; Othman, M. Categorization of project complexity factors in Malaysian construction industry. Int. J. Prop. Sci. (E-ISSN 2229-8568) 2017, 7, 1–15. [Google Scholar] [CrossRef]
- Cooke-Davies, T. Navigating Complexity. Proj. Manag. Institute, PMI. org/Pulse. 2013. Available online: https//www.pmi.org/learning/thought-leadership/pulse/navigating-complexity (accessed on 1 December 2021).
- Gidado, K.I. Project complexity: The focal point of construction production planning. Constr. Manag. Econ. 1996, 14, 213–225. [Google Scholar] [CrossRef]
- Zolin, R.; Turner, R.; Remington, K. A model of project complexity: Distinguishing dimensions of complexity from severity. In Proceedings of the International Research Network of Project Management Conference (IRNOP), Berlin, Germany, 11–13 October 2009; pp. 1–30. [Google Scholar]
- Maylor, H.; Vidgen, R.; Carver, S. Managerial complexity in project-based operations: A grounded model and its implications for practice. Proj. Manag. J. 2008, 39, S15–S26. [Google Scholar] [CrossRef]
- Gransberg, D.D.; Shane, J.S.; Strong, K.; del Puerto, C.L. Project complexity mapping in five dimensions for complex transportation projects. J. Manag. Eng. 2013, 29, 316–326. [Google Scholar] [CrossRef]
- Qureshi, S.M.; Kang, C. Analysing the organizational factors of project complexity using structural equation modelling. Int. J. Proj. Manag. 2015, 33, 165–176. [Google Scholar] [CrossRef]
- Xia, B.; Chan, A.P.C. Measuring complexity for building projects: A Delphi study. Eng. Constr. Archit. Manag. 2012, 19, 7–24. [Google Scholar] [CrossRef]
- He, Q.; Luo, L.; Wang, J.; Li, Y.; Zhao, L. Using analytic network process to analyze influencing factors of project complexity. In Proceedings of the 2012 International Conference on Management Science & Engineering 19th Annual Conference Proceedings, Dallas, TX, USA, 20–22 September 2012; pp. 1781–1786. [Google Scholar]
- Azim, S.W. Understanding and Managing Project Complexity; University of Manchester: Manchester, UK, 2010. [Google Scholar]
- Bosch-Rekveldt, M.; Jongkind, Y.; Mooi, H.; Bakker, H.; Verbraeck, A. Grasping project complexity in large engineering projects: The TOE (Technical, Organizational and Environmental) framework. Int. J. Proj. Manag. 2011, 29, 728–739. [Google Scholar] [CrossRef]
- Lee, G.; Xia, W. An Empirical Study on the Relationships between the Flexibility, Complexity and Performance of Information Systems Development Projects; University of Minnesota: Minneapolis, MN, USA, 2003. [Google Scholar]
- Müller, R.; Turner, R. The influence of project managers on project success criteria and project success by type of project. Eur. Manag. J. 2007, 25, 298–309. [Google Scholar] [CrossRef]
- Vidal, L.-A.; Marle, F.; Bocquet, J.-C. Measuring project complexity using the Analytic Hierarchy Process. Int. J. Proj. Manag. 2011, 29, 718–727. [Google Scholar] [CrossRef]
- Davis, K. Different stakeholder groups and their perceptions of project success. Int. J. Proj. Manag. 2014, 32, 189–201. [Google Scholar] [CrossRef]
- Gardoni, P.; Reinschmidt, K.F.; Kumar, R. A probabilistic framework for Bayesian adaptive forecasting of project progress. Comput. Civ. Infrastruct. Eng. 2007, 22, 182–196. [Google Scholar] [CrossRef]
- Geraldi, J.G. What complexity assessments can tell us about projects: Dialogue between conception and perception. Technol. Anal. Strateg. Manag. 2009, 21, 665–678. [Google Scholar] [CrossRef]
- Lu, Y.; Luo, L.; Wang, H.; Le, Y.; Shi, Q. Measurement model of project complexity for large-scale projects from task and organization perspective. Int. J. Proj. Manag. 2015, 33, 610–622. [Google Scholar] [CrossRef]
- Maylor, H.; Turner, N. Understand, reduce, respond: Project complexity management theory and practice. Int. J. Oper. Prod. Manag. 2017, 37, 1076–1093. [Google Scholar] [CrossRef]
- Mikkelsen, M.F. Perceived project complexity: A survey among practitioners of project management. Int. J. Manag. Proj. Bus. 2020, 14, 680–698. [Google Scholar] [CrossRef]
- Kermanshachi, S.; Dao, B.; Rouhanizadeh, B.; Shane, J.; Anderson, S. Development of the project complexity assessment and management framework for heavy industrial projects. Int. J. Constr. Educ. Res. 2020, 16, 24–42. [Google Scholar] [CrossRef]
- Aznar, B.; Pellicer, E.; Davis, S.; Ballesteros-Perez, P. Factors affecting contractor’s bidding success for international infrastructure projects in Australia. J. Civ. Eng. Manag. 2017, 23, 880–889. [Google Scholar] [CrossRef]
- Leśniak, A. Statistical Methods in Bidding Decision Support for Construction Companies. Appl. Sci. 2021, 11, 5973. [Google Scholar] [CrossRef]
- Sonmez, R.; Sözgen, B. A support vector machine method for bid/no bid decision making. J. Civ. Eng. Manag. 2017, 23, 641–649. [Google Scholar] [CrossRef]
- Dello, A.; Yoshida, C. Online tendering and evaluation for public procurement in Tanzania. In Proceedings of the 2017 18th IEEE/ACIS International Conference on Software Engineering, Artificial Intelligence, Networking and Parallel/Distributed Computing (SNPD), Kanazawa, Japan, 26–28 June 2017; pp. 137–141. [Google Scholar]
- Arkes, J. Regression Analysis: A Practical Introduction; Routledge: London, UK, 2019; ISBN 135101109X. [Google Scholar]
- Westfall, P.H.; Arias, A.L. Understanding Regression Analysis: A Conditional Distribution Approach; CRC Press: Boca Raton, FL, USA, 2020; ISBN 1000069419. [Google Scholar]
- Frost, J. Regression Analysis: An Intuitive Guide for Using and Interpreting Linear Models; Jim Publishing: Costa Mesa, CA, USA, 2019; ISBN 1735431184. [Google Scholar]
- Ko, S.; Kim, W.; Lee, K. Exploring the Factors Affecting Technology Transfer in Government-Funded Research Institutes: The Korean Case. J. Open Innov. Technol. Mark. Complex. 2021, 7, 228. [Google Scholar] [CrossRef]
- Argumedo-García, M.; Salas-Navarro, K.; Acevedo-Chedid, J.; Ospina-Mateus, H. Bibliometric Analysis of the Potential of Technologies in the Humanitarian Supply Chain. J. Open Innov. Technol. Mark. Complex. 2021, 7, 232. [Google Scholar] [CrossRef]
- Tripathi, V.; Chattopadhyaya, S.; Mukhopadhyay, A.K.; Sharma, S.; Singh, J.; Pimenov, D.Y.; Giasin, K. An Innovative Agile Model of Smart Lean–Green Approach for Sustainability Enhancement in Industry 4.0. J. Open Innov. Technol. Mark. Complex. 2021, 7, 215. [Google Scholar] [CrossRef]
- Kamp, L.M.; Meslin, T.A.J.; Khodaei, H.; Ortt, J.R. The Dynamic Business Model Framework—Illustrated with Renewable Energy Company Cases from Indonesia. J. Open Innov. Technol. Mark. Complex. 2021, 7, 231. [Google Scholar] [CrossRef]
- Ali, M.A.; Hussin, N.; Haddad, H.; Al-Araj, R.; Abed, I.A. A Multidimensional View of Intellectual Capital: The Impact on Innovation Performance. J. Open Innov. Technol. Mark. Complex. 2021, 7, 216. [Google Scholar] [CrossRef]
- Matisone, A.; Lace, N. Effective Venture Capital Market Development Concept. J. Open Innov. Technol. Mark. Complex. 2021, 7, 218. [Google Scholar] [CrossRef]
- Drozd, R.; Wolniak, R. Systematic Assessment of Product Quality. J. Open Innov. Technol. Mark. Complex. 2021, 7, 235. [Google Scholar] [CrossRef]
- Lim, C.S.; Mohamed, M.Z. Criteria of project success: An exploratory re-examination. Int. J. Proj. Manag. 1999, 17, 243–248. [Google Scholar] [CrossRef]
- Abdissa, G.; Ayalew, A.; Illés, C.B.; Dunay, A. Effects of Corporate Entrepreneurship Dimensions on Organizational Performance: Case of Small and Medium Enterprises in Holeta Town, Ethiopia. J. Open Innov. Technol. Mark. Complex. 2021, 7, 234. [Google Scholar] [CrossRef]
- Millers, M.; Gaile-Sarkane, E. Management Practice in Small and Medium-Sized Enterprises: Problems and Solutions from the Perspective of Open Innovation. J. Open Innov. Technol. Mark. Complex. 2021, 7, 214. [Google Scholar] [CrossRef]
- Marchena Sekli, G.F.; De La Vega, I. Adoption of Big Data Analytics and Its Impact on Organizational Performance in Higher Education Mediated by Knowledge Management. J. Open Innov. Technol. Mark. Complex. 2021, 7, 221. [Google Scholar] [CrossRef]
- Sanchez, R.; Shibata, T. Modularity Design Rules for Architecture Development: Theory, Implementation, and Evidence from the Development of the Renault-Nissan Alliance “Common Module Family” Architecture. J. Open Innov. Technol. Mark. Complex. 2021, 7, 242. [Google Scholar] [CrossRef]
- Kitsios, F.; Giatsidis, I.; Kamariotou, M. Digital Transformation and Strategy in the Banking Sector: Evaluating the Acceptance Rate of E-Services. J. Open Innov. Technol. Mark. Complex. 2021, 7, 204. [Google Scholar] [CrossRef]
- Jin, S.; Kim, D. The Effects of Patents on the Relationship between R&D Activities and Business Management Performance: Focus on South Korean Venture Companies. J. Open Innov. Technol. Mark. Complex. 2021, 7, 210. [Google Scholar] [CrossRef]
- Yuana, R.; Prasetio, E.A.; Syarief, R.; Arkeman, Y.; Suroso, A.I. System Dynamic and Simulation of Business Model Innovation in Digital Companies: An Open Innovation Approach. J. Open Innov. Technol. Mark. Complex. 2021, 7, 219. [Google Scholar] [CrossRef]


| Ref. | Country/ Context | Methodology | Tools/ Techniques | Some of the Factors Affect Bid/No Bid Decision | Bid No Bid | Mark-Up Size | Decision Model |
|---|---|---|---|---|---|---|---|
| [7] | USA/general contractors | In this study, through a questionnaire, 400 public sector contractors were asked to rate the factors influencing the bid/no-bid and mark-up decisions, and based on this, the author prioritized and presented the influential factors. | Reasoning model | Type of job, need for work, owner, historic profit, degree of hazard, location, degree of difficulty, uncertainty in estimate, current workload | ✓ | ✓ | - |
| [1] | United kingdom/construction | The author examined data from 85 projects through a questionnaire and asked the contractor to prioritize the factors affecting the bid/no-bid and the mark-up extracted from the literature. | Reasoning model | Degree of difficulty, risk involved owing to the nature of the work, current workload | ✓ | ✓ | - |
| [31] | Australia/civil engineering construction | In this study, in addition to presenting the factors influencing bid/no-bid and mark-up decisions through a survey questionnaire, Australian civil engineering contractors’ tendering practices were described using interviews. | Reasoning model | Project type, availability of resources and people, experience, need for work, location of project, desire for project, amount of contingency in estimate, experience in similar project, likelihood of winning the project | ✓ | ✓ | - |
| [32] | Process plants’ design and construction | In this study, in addition to presenting the factors influencing bid/no-bid and mark-up decisions through a survey questionnaire, a model using a multicriteria assessment of the probability of winning was presented. | (MADM) AHP | Delivery time, technical assistance, technology transfer, safety, price, dependability, process, technology, terms of payment, financial package, liquidated damages clause, conformity to tender documents, contractor cooperation, utilization of local vendors | ✓ | ✓ | ✓ |
| [34] | Saudi Arabia/construction | The author examined data from 91 contractors through a questionnaire and asked them to prioritize the factors affecting the bid/no-bid decision using the relative importance index. In order to be able to select the most important factors, the principal component analysis (PCA) was conducted. | Principal component analysis (PCA) | Client financial capacity, prompt payment habit of the client, project payment system, clarity of the work and specifications, project cash flow, ability of project execution | ✓ | ✓ | - |
| [37] | Nigeria/construction | Through 50 questionnaires, factors affecting the bid/no-bid decisions were ranked and presented. | Reasoning model | Financial capability of clients, availability of capital, availability of materials, fulfilling the “to tender” condition, chances of obtaining the job | ✓ | - | - |
| [16] | Saudi Arabia/construction | A total of 67 questionnaires were distributed, and through this, the factors affecting the bid/no-bid decision were presented. These factors by the median and relative importance index (RII) were weighted. | Reasoning model | Size of the job, type of job, company’s strength in the industry, designer, design quality, rate of return, project cash flow | ✓ | - | - |
| [38] | India/construction | The factors influencing the bid decisions were collected through a structured questionnaire survey, and factors were ranked based on the survey results, and in the end, the bid decision framework using the data envelopment analysis was developed. | Data envelopment analysis | Amount of possible upcoming profitable projects in the future, current financial condition of the company, having qualified material suppliers, project type, experience and familiarity with the specific work | ✓ | - | ✓ |
| [35] | Egypt/construction | The factors influencing the bid decisions were collected through a questionnaire and used to build a fuzzy fault tree model to simulate the bidding decision. | Fuzzy fault tree | Project characteristic, business benefits, client characteristic, contract characteristic, project finance, contractor characteristic, firm’s previous experience, bidding characteristic, economic characteristic, competition characteristic | ✓ | - | ✓ |
| [36] | Sri Lanka/infrastructure | Factors influencing the bid/no-bid and mark-up decision were identified from the literature; they were customized using semistructured interviews and content analysis. These factors were weight-ranked through a questionnaire and the relative importance index. Finally, the results were tested through a case study, and recommendations were presented. | Reasoning model | Estimated direct costs, competitiveness of other bids, type of work, project duration, ability to predict a pre-tender estimate | ✓ | ✓ | - |
| [8] | construction | The methodology of this research has two phases. In the first phase, factors were extracted using literature review. In the second phase, using the AHP method, construction project bidding decision-making tools were developed. | (MADM) AHP | Current workload; experience with similar projects; availability of equipment, materials, and human resources; financial ability; need for work; technical know-how; compliance with the business plan; project size; project duration; project location; project type; contract condition and type; owner identity; competition | ✓ | - | ✓ |
| [10] | Tanzania/small building | Data collected through a survey were analyzed using SPSS. The 30 factors influencing the bid or no-bid decision, in 5 groups, were ranked separately and in groups. | Reasoning model | Project characteristic related, contractor related, market criteria related, contract criteria related, client criteria related | ✓ | - | - |
| The current study | Iran/petroleum | Recognition, categorization, and weighting of the effective factors on a bid/no bid decision approach of complexity analysis of a project. Determining the most appropriate mark-up sizes in the two aspects of time and cost. | Complexity analysis | Duration of project, number of activities, capital expenditure | ✓ | ✓ | ✓ |
| No. | Category | Factors | References |
|---|---|---|---|
| 1 | Size | Duration of the project | [44,48,50,54,61,62,63,64,65,66,67,68,69,70,71] |
| 2 | Number of deliverables/disciplines | ||
| 3 | Number of activities | ||
| 4 | Largeness of capital investment | ||
| 5 | Number of project management methods and tools applied | ||
| 6 | Number of different occupational specializations | ||
| 7 | Number of stakeholders | ||
| 8 | Largeness of scope (number of components, etc.) | ||
| 9 | Number of structures/groups/teams to be coordinated | ||
| 10 | Number of objectives or goals | ||
| 11 | Number of investors | ||
| 12 | Staff quantity | ||
| 13 | Number of hierarchical levels | ||
| 14 | Number of information systems | ||
| 15 | Number of joint-venture partners | ||
| 16 | Number of funding phases | ||
| 17 | Total number of permits | ||
| 18 | Size of project team | ||
| 19 | Context | Degree of project flexibility (in scope, process, organization) | [52,56,60,61,62,70,71,72,73,74] |
| 20 | Repetition of similar type of projects | ||
| 21 | Internal politics issue (ambiguity, hidden information) | ||
| 22 | Cultural configuration | ||
| 23 | Contract specifications | ||
| 24 | New laws and regulations | ||
| 25 | Local laws and regulations | ||
| 26 | Number of organizational risks | ||
| 27 | Geological condition/difficulty of location | ||
| 28 | External politics issue | ||
| 29 | Impact on the environment | ||
| 30 | Form of contract | ||
| 31 | Organizational degree of innovation | ||
| 32 | Lack of experience with partners | ||
| 33 | Government environmental regulations | ||
| 34 | Diversity | Variety of financial resources | [48,50,52,62,64,66,67,68,70,73,75,76,77,78,79] |
| 35 | Diversity of tasks | ||
| 36 | Diversity of staff (experience, social span) | ||
| 37 | Variety of stakeholders | ||
| 38 | Cultural variety | ||
| 39 | Number of different languages | ||
| 40 | Variety of technologies used during the project | ||
| 41 | Multiple participating countries/location | ||
| 42 | Geographic location of the stakeholders | ||
| 43 | Weather conditions | ||
| 44 | Number of external stakeholders | ||
| 45 | Connectivity | Number of interfaces in the project organization | [52,62,63,77] |
| 46 | Percentage of design completed at the start of construction | ||
| 47 | Communication between different parts of the organization | ||
| 48 | Autonomy | Availability of people, material, and any resources due to sharing | [44,50,52,62,63,64,70,73,74,77] |
| 49 | Team/partner cooperation and communication | ||
| 50 | Dynamic and evolving team structure | ||
| 51 | Interdependencies between sites, departments, and companies | ||
| 52 | Interdependencies of objectives/interests | ||
| 48 | Interdependencies between actors | ||
| 53 | Percentage of PM staff who work on the project vs. planned staff | ||
| 54 | Resource and raw material interdependence | ||
| 55 | Dependencies between schedules | ||
| 56 | Number of governmental people who are involved in projects | ||
| 53 | Process interdependence | ||
| 54 | Dependencies between schedules | ||
| 55 | Interdependence between components of the product | ||
| 56 | Level of interrelation of between phases | ||
| 57 | Belonging | Cost restraint (cost and financing) | [52,56,62,65,67,74] |
| 58 | Requirement specifications | ||
| 59 | Technical capability of team | ||
| 60 | Technological newness of the project | ||
| 61 | Use of a technology that has not yet been fully developed | ||
| 62 | Equipment specifications | ||
| 63 | Specifications of systems | ||
| 64 | Emergence | Dynamics of the task activities | [49,50,62,67,70,72,74,76,80] |
| 65 | Uncertainties of scope | ||
| 66 | Uncertainty and clarity of objectives or goals | ||
| 67 | Uncertainty in technical methods | ||
| 68 | Information uncertainty |
| Ref. | Paper Type | Industry | Project Complexity Definition | Categories and Factors of Complexity/Characteristic | Cited by (Google Scholar on 20 February 2021) |
|---|---|---|---|---|---|
| [49] | Conceptual | General | Degree of whether the goals and methods of achieving them are well defined | Uncertainty of objectives/uncertainty of methods | 785 |
| [44] | Review | Construction | Project complexity consisting of many varied interrelated parts can be operationalized in terms of “differentiation and interdependency or connectivity” | Organizational/technological | 1518 |
| [50] | Review | General | - | Structural (number of elements, interdependence of elements), uncertainty in goals, uncertainty in methods | 993 |
| [53] | Systematic review | General | Provide definitions of previous research | Structural, uncertainty, dynamics, pace, sociopolitical | 480 |
| [71] | Empirical study | Construction | The complexity of building projects defined as a characteristic that are complicated, multifaceted, and composed of many interconnected parts | Building structure and function, construction method, urgency of project schedule, project size, geological condition, neighboring environment | 161 |
| [65] | Report | General | Complexity has different meanings for different people and in different organizations | Multiple stakeholders; ambiguity of project features, resources, phases, etc.; significant politics; authority influences; unknown project features, resources, phases, etc.; dynamic (changing) project governance; significant external influences; use of a technology that is new to the organization; use of a technology that has not yet been fully developed; significant internal interpersonal or social influences; highly regulated environment; project duration exceeds the cycle of relevant technologies | 5 |
| [81] | Case study | Construction | Consisting of many varied interrelated parts and has dynamic and emerging features | Task complexity, organizational complexity | 129 |
| [55] | Case study | Construction | - | A total of 28 factors divided into 6 categories include: technological, organizational, goal, environmental, cultural, informational | 177 |
| [70] | Empirical study | Construction, IT, textile, automobile, R&D | - | This study focused on organizational complexity: project size, project variety, interdependencies within the project, elements of context | 183 |
| [62] | Systematic review | General | Define project complexity as an intricate arrangement of the varied interrelated parts in which the elements can change and evolve constantly with effect on the project objectives | From the PMI view, this study divided the complexity factors into 9 categories, which include: content, context, organizational, interdependencies, technology, information, product or service, client, external environment | 172 |
| [63] | Empirical study | Construction | Project complexity is the degree of interrelatedness between project attributes and interfaces and their consequential impact on predictability and functionality | This study classified 10 complexity indicators into 9 groups, including: interfaces, scope definition, project resources, design and technology, scope definition, location, governance, project resources, stakeholder management | 48 |
| [64] | Empirical study | Construction | - | This study classified 28 complexity factors into 3 categories: technological, organizational, environmental | 4 |
| [82] | Empirical study | General | According to a previous study conducted in 2011 | Structural, sociopolitical, emergent | 60 |
| [56] | Review of the state of the art/case study | engineering | - | This research focuses on the organizational and technological complexity of a shipbuilding project and evaluates the project complexity according to the project definition, design, and production phases | - |
| [83] | Empirical study | General | Project complexity is the interrelatedness of elements causing an emergent nature of the project and challenging the project management | Element, political, diversity, difficulty, goals, ambiguity, control, method, rigid, trust, experience | - |
| [84] | Empirical study | Construction | - | This study classified 27 complexity indicators into 11 groups, including: stakeholder, management, governance, fiscal planning, quality, legal, interfaces, execution target, design and technology, location, scope definition, project resources | - |
| Area of Expertise | Number of Experts | Age | Average Years of Work Experience | Area of Profession | Education | ||||||
|---|---|---|---|---|---|---|---|---|---|---|---|
| 35–40 | 40–45 | >45 | Client | Contractor | Consultant | Ph.D. | M.S. | B.S. | |||
| Academic | 2 | 2 (33.5%) | 11.8 | - | - | - | 2 | - | - | ||
| Professional | 4 | 1 (16.5%) | 3 (50%) | 18.2 | 1 | 1 | 2 | 1 | 2 | 1 | |
| Contractors | Types of Projects | Total | |||||
|---|---|---|---|---|---|---|---|
| Oil Refinery | Gas Processing | Petrochemical Plant | Pipeline | Oil/Gas Storage Tanks | Fuel Facilities | ||
| C1 | 2 | 2 | 2 | 3 | 8 | 4 | 21 |
| C2 | 0 | 2 | 1 | 3 | 4 | 7 | 17 |
| C3 | 1 | 0 | 2 | 1 | 2 | 4 | 10 |
| C4 | 2 | 2 | 1 | 3 | 7 | 6 | 21 |
| C5 | 2 | 2 | 2 | 3 | 5 | 7 | 21 |
| C6 | 1 | 2 | 0 | 2 | 7 | 5 | 17 |
| C7 | 1 | 0 | 2 | 1 | 5 | 4 | 13 |
| C8 | 2 | 2 | 2 | 3 | 4 | 6 | 19 |
| Total | 11 | 12 | 12 | 19 | 42 | 43 | 139 |
| Main Category | Percentage Weight (pwi) | Factors | Weight (wj) | Reference | Metrics Spectrum (Low Complexity: 1; High Complexity: 10) | Description | |
|---|---|---|---|---|---|---|---|
| 1 | Project content (CN) | 0.29 | The duration of the project | 0.800 | Project time estimation | Equal to or less than 6 months: 1 More than 36 months: 10 | - |
| The number of activities | 0.787 | Project schedule | Equal to or less than 3000 activities: 1 More than 10,000 activities: 10 | - | |||
| The capital expenditure (CAPEX) | 0.812 | Project cost estimation | Equal to or less than USD 500 million: 1 More than USD 4 billion: 10 | - | |||
| The number of overall human resources required in the implementation phase | 0.800 | Project plan | Equal to or less than 500 persons: 1 More than 5000 persons: 10 | - | |||
| The number of critical objectives of the project | 0.837 | Project plan | Equal to or less than 3 main objectives: 1 More than 10 main objectives: 10 | - | |||
| The probability of scope creep | 0.950 | Project risk plan | Low probability: 1 High probability: 10 | Based on previous experience | |||
| The number of required occupational specialized areas | 0.850 | Project basic design | Equal to or less than 5 areas: 1 More than 12 areas: 10 | - | |||
| The probability of change of project objectives | 0.962 | Project risk plan | Low probability: 1 High probability: 10 | Based on previous experience | |||
| The implementation intricacy | 0.837 | Project design | Low intricacy: 1 High intricacy: 10 | Based on previous experience | |||
| The importance of project completion date | 0.737 | Contract | Low importance: 1 High importance: 10 | Changeability of timing | |||
| The level of design errors | 0.787 | Project basic design | Low number of errors: 1 High number of errors: 10 | Basic design done by client organization | |||
| 2 | Project context (CX) | 0.14 | The number of investors | 0.837 | Project plan | Equal to or less than 1 investor: 1 More than 8 investors: 10 | - |
| The number of key stakeholders | 0.987 | Project plan | Equal to or less than 3 key stakeholders: 1 More than 8 key stakeholders: 10 | - | |||
| The precision of primary studies | 0.850 | Project basic design | High precision: 1 Low precision: 10 | Primary studies done by the client organization | |||
| The impact of the internal policies of the client on the project implementation process | 0.750 | Investigating the client organization | Low level of interference: 1 High level of interference: 10 | - | |||
| The project contract pricing method | 0.762 | Project document | Cost reimbursable = 1 Time and material = 5 Fixed price = 10 | - | |||
| The accessibility of key stakeholders | 0.825 | Project plan | High level of accessibility: 1 Low level of accessibility: 10 | Availability of stakeholders for the meeting | |||
| The project financing method | 0.700 | Project document | Corporate finance = 1 Finance = 5 Project finance = 10 | - | |||
| 3 | Technological (Tech) | 0.18 | The accessibility of technical human resources locally | 0.775 | Investigating the local suppliers | Low accessibility: 1 High accessibility: 10 | What percentage of the total need will be met by local resources |
| The technological newness level of the project | 0.975 | Project plan | Low level of newness: 1 High level of newness: 10 | Based on previous experience in using technology | |||
| The technological level of the required equipment | 0.925 | Project basic design | Low level of technology: 1 High level of technology: 10 | - | |||
| The availability of the project technologies locally | 0.812 | Investigating the local weather records | High level of availability: 1 Low level of availability: 10 | - | |||
| 4 | Contractor organization (CoO) | 0.09 | The previous experience with the client | 0.912 | Internal documents | Equal to or more than 5 projects: 1 Less than 2 projects: 10 | Number of previous projects |
| The number of joint-venture/consortium partners required | 0.862 | Project plan | Equal to or less than 1 partner: 1 More than 8 partners: 10 | - | |||
| The familiarity with the general conditions of the contract | 0.662 | Internal knowledge | High level of familiarity: 1 Low level of familiarity: 10 | Published by the management and planning organization | |||
| The previous experience in project type (contractor) | 0.887 | Internal documents | Equal to or more than 8 projects: 1 Less than 3 projects: 10 | - | |||
| 5 | Client organization (ClO) | 0.22 | The technical level of the client staff | 0.65 | Investigating the client organization | High level of technical staff: 1 Low level of technical staff: 10 | - |
| The Contractor selection method | 0.700 | Project document | Negotiation = 1 Limited bid = 5 Public bid = 10 | Methods of selecting a contractor in government projects | |||
| The credibility and rank of the project designer consultant | 0.867 | The corporations’ ranking bodies | Degree 1 = 1 Degree 2 = 5 Degree 3 = 10 | Based on the list of qualified consultants (national program and budget organization) | |||
| The level of confidence in the financial strength of the client | 0.885 | Investigating the client organization | High financial strength: 1 Low financial strength: 10 | - | |||
| The typology of the project system in the client organization | 0.687 | Investigating the client organization | Project: 1 Balanced matrix = 5 Functional = 10 | - | |||
| The previous experience of the consultant with the client | 0.862 | Investigating the client organization | Equal to or more than 5 projects: 1 Less than 2 projects: 10 | Number of previous projects | |||
| The financial instability of the investors | 0.637 | Investigating the investors organization | High instability: 1 Low instability: 10 | - | |||
| The bureaucratic level of the client organization | 0.737 | Investigating the client organization | Simple organizational pyramid: 1 Complex organizational pyramid: 10 | - | |||
| The presence of the construction manager or program manager | 0.675 | Project document | No CMA or PM: 1 CMA or PM: 10 | - | |||
| 6 | External environment (ExE) | 0.08 | The geophysical conditions | 0.600 | Project design | Conventional: 1 Unconventional: 0 | - |
| The number of required approvals from government entities | 0.575 | Project plan | Equal to or less than 15 approvals: 1 More than 45 partners: 10 | - | |||
| The impact of national politics on the project | 0.762 | Investigating the national records | Low level of impact: 1 High level of impact: 10 | Changes in the rules | |||
| The accessibility of the material sources | 0.750 | Investigating the local suppliers | Low accessibility: 10 High accessibility: 1 | - | |||
| The amount of long lead item (LLI) | 0.787 | Project document | Low numbers of LLI: 1 High numbers of LLI: 10 | - | |||
| The environmental impact assessment | 0.537 | Project plan | Low level of impact: 1 High level of impact: 10 | Positive or negative, direct or indirect, etc. | |||
| The social and cultural environment of the project | 0.800 | Investigating the local of the project site | Low level of diversity: 1 High level of diversity: 10 | Variety of different languages | |||
| The accessibility of the craftsmen or labors locally | 0.750 | Investigating the local suppliers | Low accessibility: 1 High accessibility: 10 | - | |||
| The weather severity | 0.487 | Investigating the local weather records | Low level of severity: 1 High level of severity: 10 | - | |||
| The geological conditions and accessibility of the site | 0.600 | Project plan | Conventional and accessible: 1 Unconventional and out of access: 10 | - | |||
| The level of government binding standards | 0.500 | Internal knowledge | Low number standards: 1 High number standards: 10 | - | |||
| Competition for the project (market attractiveness) | 0.787 | Market research | Equal to or more than 15 competitors: 1 less than 4 partners: 10 | - | |||
| The records of local protests in the region | 0.612 | Investigating the local protest records | Low level of previous records: 1 High level of previous records: 10 | Protests that disrupt the project process | |||
| The local content regulations | 0.512 | Investigating the local regulations | Low regulations: 1 High regulations: 10 | - | |||
| Project location | 0.612 | Project plan | Operational areas = 1 Rural areas = 3 Urban areas = 7 Urban area with restrictions = 10 | - | |||
| The degree of project dependency on foreign purchases | 0.812 | Project plan and BoM | Equal to or less than USD 100 million: 1 More than USD 1.2 billion: 10 | Purchase of equipment or services abroad | |||
| The level of supervision of the local entities | 0.525 | Investigating the local entities | Low supervision: 1 High supervision: 10 | General supervision or detail control | |||
| The geographical distribution of the project’s site | 0.662 | Project basic design | Equal to or less than 1 legal area (province): 1 More than 5 legal areas (province): 10 | - | |||
| The probability of alteration in project rules and regulations | 0.762 | Investigating the local entities | Low probability: 1 High probability: 10 | - | |||
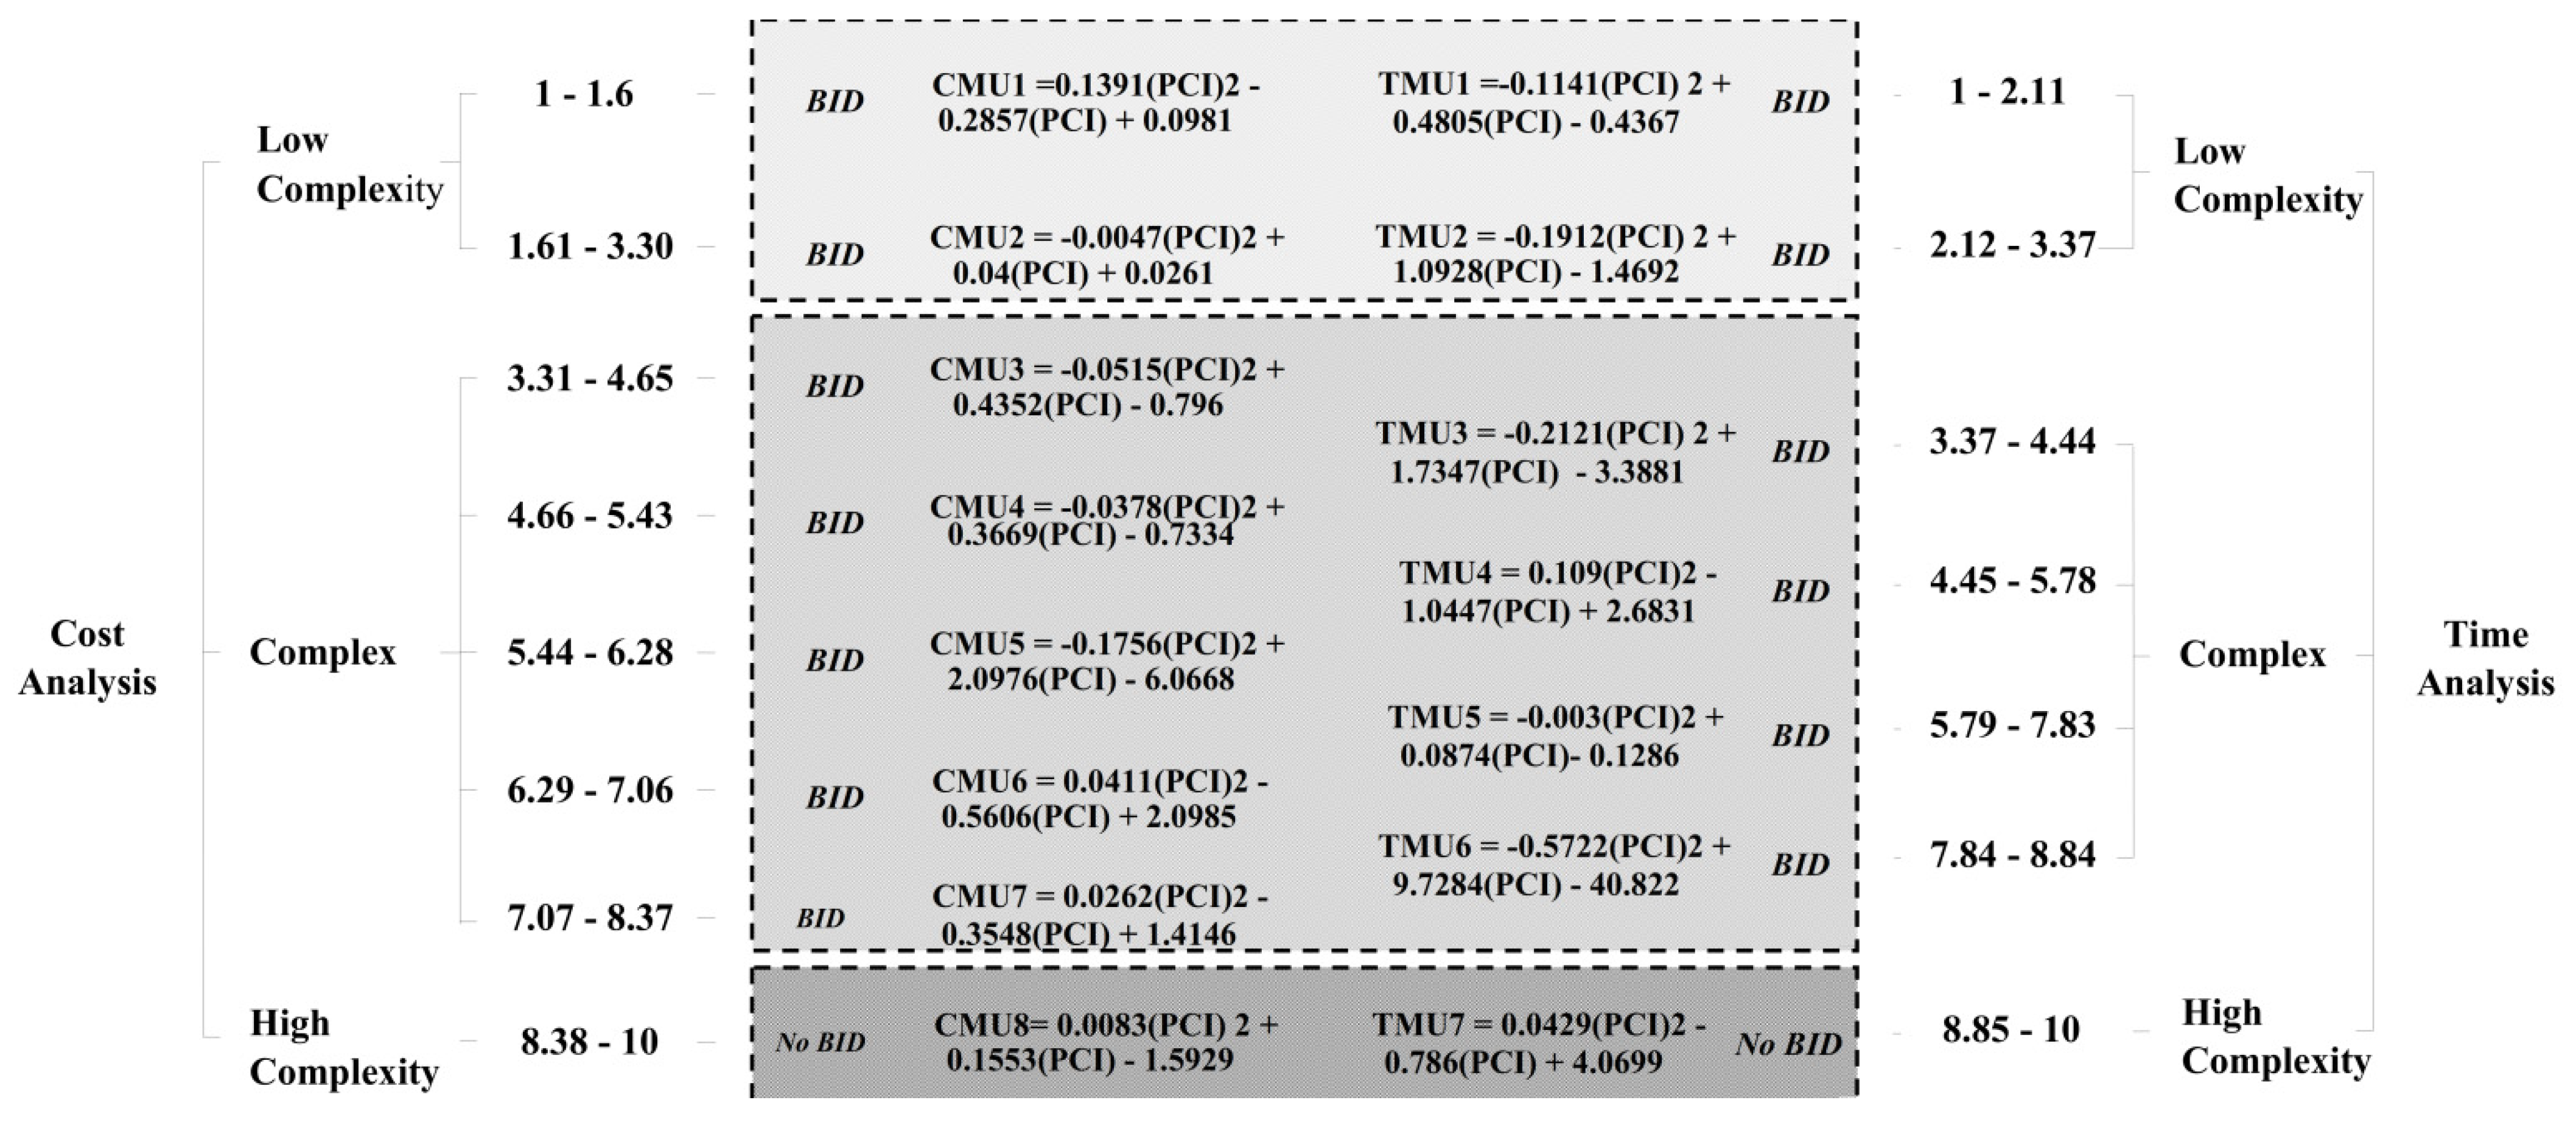
| Ranges | PCI | First Decision | Time Mark-Up (CMU) Model | Accuracy | CMU | ||
|---|---|---|---|---|---|---|---|
| Lower Limit | Upper Limit | Lower Limit | Upper Limit | ||||
| RC1 | 1 | 1.6 | Bid | CMU1 = 0.1391(PCI)2 − 0.2857(PCI) + 0.0981 | 86.3% | −0.0485 | −0.0029 |
| RC2 | 1.61 | 3.30 | Bid | CMU2 = −0.0047(PCI)2 + 0.04(PCI) + 0.0261 | 87.2% | 0.0783 | 0.1069 |
| RC3 | 3.31 | 4.65 | Bid | CMU3 = −0.0515(PCI)2 + 0.4352(PCI) − 0.796 | 87.7% | 0.0802 | 0.1141 |
| RC4 | 4.66 | 5.43 | Bid | CMU4 = −0.0378(PCI)2 + 0.3669(PCI) − 0.7334 | 86.6% | 0.1555 | 0.1443 |
| RC5 | 5.44 | 6.28 | Bid | CMU5 = −0.1756(PCI)2 + 2.0976(PCI) − 6.0668 | 91.7% | 0.1475 | 0.1807 |
| RC6 | 6.29 | 7.06 | Bid | CMU6 = 0.0411(PCI)2 − 0.5606(PCI) + 2.0985 | 87.8% | 0.1984 | 0.1892 |
| RC7 | 7.07 | 8.37 | Bid | CMU7 = 0.0262(PCI)2 − 0.3548(PCI) + 1.4146 | 85.4% | 0.2157 | 0.2804 |
| RC8 | 8.38 | 10 | No Bid | CMU8 = 0.0083(PCI)2 + 0.1553(PCI) − 1.5929 | 85.5% | 5.5371 | 8.2601 |
| Ranges | PCI | First Decision | Time Mark-Up (TMU) Model | Accuracy | TMU | ||
|---|---|---|---|---|---|---|---|
| Lower Limit | Upper Limit | Lower Limit | Upper Limit | ||||
| RT1 | 1 | 2.11 | Bid | TMU1 = −0.1141(PCI)2 + 0.4805(PCI) − 0.4367 | 82.1% | −0.0703 | 0.0691 |
| RT2 | 2.12 | 3.37 | Bid | TMU2 = −0.1912(PCI)2 + 1.0928(PCI) − 1.4692 | 85.6% | −0.0117 | 0.0420 |
| RT3 | 3.37 | 4.44 | Bid | TMU3 = −0.2121(PCI)2 + 1.7347(PCI) − 3.3881 | 86.4% | 0.0490 | 0.1327 |
| RT4 | 4.45 | 5.78 | Bid | TMU4 = 0.109(PCI)2 − 1.0447(PCI) + 2.6831 | 83.3% | 0.1926 | 0.2862 |
| RT5 | 5.79 | 7.83 | Bid | TMU5 = −0.003(PCI)2 + 0.0874(PCI) − 0.1286 | 85.3% | 0.2768 | 0.3718 |
| RT6 | 7.84 | 8.84 | Bid | TMU6 = −0.5722(PCI)2 + 9.7284(PCI) − 40.822 | 83.5% | 0.2780 | 0.4621 |
| RT7 | 8.85 | 10 | No Bid | TMU7 = 0.0429(PCI)2 − 0.786(PCI) + 4.0699 | 80.4% | 0.4738 | 0.4999 |
| Test Data | PCI | Actual | Model | Accuracy | Error | ||||
|---|---|---|---|---|---|---|---|---|---|
| TMU | CMU | TMU | CMU | T | C | T | C | ||
| Project 01 | 2.43 | 4.31% | 6.78% | 5.73% | 9.56% | 67.076% | 70.957% | 32.924% | 29.043% |
| Project 02 | 7.12 | 50.14% | 30.39% | 34.16% | 21.66% | 68.129% | 71.273% | −31.871% | −28.727% |
| Project 03 | 1.21 | −3.39% | −2.94% | −2.24% | −4.39% | 65.929% | 66.909% | 34.071% | −33.091% |
| Project 04 | 3.14 | 5.82% | 15.25% | 7.70% | 10.54% | 67.628% | 69.088% | 32.372% | −30.912% |
| Project 05 | 1.62 | 3.09% | 5.23% | 4.23% | 7.86% | 63.203% | 66.564% | 36.797% | 33.436% |
| Project 06 | 4.22 | 18.02% | 16.18% | 15.52% | 12.34% | 86.109% | 76.273% | −13.891% | −23.727% |
| Project 07 | 1.33 | −0.08% | −2.31% | 0.05% | −3.58% | 66.250% | 64.471% | 33.750% | −35.529% |
| Project 08 | 3.73 | 10.08% | 14.16% | 13.14% | 11.08% | 76.706% | 78.234% | 23.294% | −21.766% |
| Project 09 | 7.02 | 25.43% | 22.50% | 33.71% | 18.85% | 75.435% | 83.782% | 24.565% | −16.218% |
| Project 10 | 2.47 | 9.02% | 7.01% | 6.35% | 9.62% | 70.452% | 72.846% | −29.548% | 27.154% |
| Project 11 | 5.16 | 16.95% | 18.21% | 19.46% | 15.34% | 87.083% | 84.217% | 12.917% | −15.783% |
| Project 12 | 5.22 | 16.04% | 13.76% | 19.98% | 15.18% | 80.264% | 84.000% | 19.736% | 16.000% |
| Project 13 | 3.21 | 5.23% | 14.52% | 6.85% | 10.61% | 68.948% | 73.051% | 31.052% | −26.949% |
| Project 14 | 5.29 | 17.08% | 18.03% | 20.69% | 14.97% | 82.552% | 83.028% | 17.448% | −16.972% |
| Project 15 | 7.04 | 45.36% | 24.71% | 33.80% | 18.89% | 74.515% | 76.446% | −25.485% | −23.554% |
| Project 16 | 6.14 | 23.98% | 22.54% | 29.49% | 19.24% | 81.304% | 85.363% | 18.696% | −14.637% |
| Project 17 | 4.15 | 13.05% | 9.58% | 15.80% | 12.31% | 82.897% | 77.810% | 17.103% | 22.190% |
| Project 18 | 6.32 | 24.09% | 23.29% | 30.39% | 19.71% | 79.259% | 84.645% | 20.741% | −15.355% |
| Project 19 | 5.43 | 18.08% | 12.29% | 22.42% | 14.43% | 80.631% | 85.142% | 19.369% | 14.858% |
| Project 20 | 8.23 | 70.03% | 43.18% | 48.60% | 26.92% | 69.398% | 62.343% | −30.602% | −37.657% |
| Project 21 | 5.36 | 17.55% | 16.95% | 21.50% | 14.72% | 81.616% | 86.849% | 18.384% | −13.151% |
| Project 22 | 6.95 | 26.59% | 22.07% | 33.39% | 18.76% | 79.629% | 84.984% | 20.371% | −15.016% |
| Project 23 | 8.41 | 70.17% | 46.88% | 52.32% | 28.38% | 74.561% | 61.537% | −25.439% | −38.463% |
| Project 24 | 1.42 | 1.15% | −1.78% | 1.55% | −2.71% | 64.869% | 65.732% | 35.131% | −34.268% |
| Project 25 | 1.83 | 4.51% | 5.76% | 6.05% | 8.36% | 65.831% | 68.932% | 34.169% | 31.068% |
| Project 26 | 3.66 | 9.42% | 8.21% | 11.97% | 10.70% | 72.929% | 76.757% | 27.071% | 23.243% |
| Project 27 | 7.65 | 50.21% | 34.61% | 36.44% | 23.37% | 72.575% | 67.523% | −27.425% | −32.477% |
| Project 28 | 4.24 | 18.12% | 10.05% | 15.40% | 12.34% | 84.977% | 81.445% | −15.023% | 18.555% |
| Average | 74.670% | 75.364% | 11.096% | −9.239% | |||||
Publisher’s Note: MDPI stays neutral with regard to jurisdictional claims in published maps and institutional affiliations. |
© 2022 by the authors. Licensee MDPI, Basel, Switzerland. This article is an open access article distributed under the terms and conditions of the Creative Commons Attribution (CC BY) license (https://creativecommons.org/licenses/by/4.0/).
Share and Cite
Faraji, A.; Rashidi, M.; Eftekhari, N.A.; Perera, S.; Mani, S. A Bid/Mark-Up Decision Support Model in Contractor’s Tender Strategy Development Phase Based on Project Complexity Measurement in the Downstream Sector of Petroleum Industry. J. Open Innov. Technol. Mark. Complex. 2022, 8, 33. https://doi.org/10.3390/joitmc8010033
Faraji A, Rashidi M, Eftekhari NA, Perera S, Mani S. A Bid/Mark-Up Decision Support Model in Contractor’s Tender Strategy Development Phase Based on Project Complexity Measurement in the Downstream Sector of Petroleum Industry. Journal of Open Innovation: Technology, Market, and Complexity. 2022; 8(1):33. https://doi.org/10.3390/joitmc8010033
Chicago/Turabian StyleFaraji, Amir, Maria Rashidi, Navid Ahmadi Eftekhari, Srinath Perera, and Saba Mani. 2022. "A Bid/Mark-Up Decision Support Model in Contractor’s Tender Strategy Development Phase Based on Project Complexity Measurement in the Downstream Sector of Petroleum Industry" Journal of Open Innovation: Technology, Market, and Complexity 8, no. 1: 33. https://doi.org/10.3390/joitmc8010033
APA StyleFaraji, A., Rashidi, M., Eftekhari, N. A., Perera, S., & Mani, S. (2022). A Bid/Mark-Up Decision Support Model in Contractor’s Tender Strategy Development Phase Based on Project Complexity Measurement in the Downstream Sector of Petroleum Industry. Journal of Open Innovation: Technology, Market, and Complexity, 8(1), 33. https://doi.org/10.3390/joitmc8010033