Article

Empirical Analysis of the Global Supply and Demand of Entrepreneurial Finance: A Random Utility Theory Perspective

College of Business, Al Ain University, Abu Dhabi P.O. Box 112612, United Arab Emirates
J. Open Innov. Technol. Mark. Complex. 2022, 8(1), 26; https://doi.org/10.3390/joitmc8010026
Submission received: 22 December 2021 / Revised: 16 January 2022 / Accepted: 17 January 2022 / Published: 19 January 2022

Abstract

:
Considering the globalized nature of international financial markets and the important role of innovative entrepreneurial endeavors for employment and economic development, this paper analyzes the global supply and demand of entrepreneurial finance, in the form of individuals’ savings and borrowings for entrepreneurial ventures in the global economy. To this end, a theoretical treatment of the potential global entrepreneurial finance market (GEFM) dynamics, in response to governments and private sector financial transfers, is first provided. This is followed by the econometric modeling of such dynamics based on intertemporal random utility maximization, using pooled data from the 2014 and 2017 global financial inclusion surveys. The findings reveal, contrary to theoretical predictions, that private sector financial injections (i.e., electronic wage payments), exert an adverse effect on the GEFM; meanwhile, in accordance with theoretical predictions, public sector financial injections (i.e., electronic welfare payments), do positively influence the growth of the GEFM. In addition, compared to their male counterparts, females are found to be 7% more likely to own a formal account, and are 23.4% more likely to save for farming or business entrepreneurship, while also being 18.8% more likely to borrow for entrepreneurial ventures, therefore suggesting a relatively greater growth potential from female entrepreneurship in the global economy.

1. Introduction

Technological development and the resulting rise of social media has been reshaping the entrepreneurial finance market landscape with new players, financial intermediaries, and a variety of emerging market segments [1,2]. Thus far however, the entrepreneurial finance literature has adopted a mostly business perspective, focusing microscopically on the individual sources of financing from which entrepreneurs can draw their needed funds for start-ups and growth [3,4,5].
Although, at the microlevel, each entrepreneurial finance market segment does present its own particularity [6], a macroscopic view of the overall dynamics between supply and demand in all these market segments reveal fundamentally and qualitatively similar characteristics. Irrespective of funding cycle conceptualization, entrepreneurs looking to raise seed finances for their ventures always have to turn to sources with excess funds [7]. From the perspective of the global economy, all the various sources of funds together make up the global supply of entrepreneurial finance, while all those seeking such funds for their entrepreneurial ventures make up the global demand for entrepreneurial finance.
While the business perspective has allowed researchers to address key micro-economic questions, it has left important unanswered macro-economic ones of great relevance to entrepreneurial finance market stakeholders. Among those key questions are entrepreneurial finance markets’ responses to public sector welfare programs, and private sector electronic wage transfer policies, which remain largely unaddressed in the literature. Therefore, the present study contributes to the existing body of knowledge by adopting a rather aggregated perspective to address the topic of entrepreneurial finance market dynamics, at the global scale. Indeed, considering the importance of innovative entrepreneurial firms for both economic development and employment in any economic system [8], this paper analyzes the global supply and demand of entrepreneurial finance, focusing on the impacts of financial injections from public and private sector enterprises on its equilibrium properties.
To achieve the above research objective, the paper assumes that the global economy “endogenizes” all value, creating economic processes through the flow of resources. One of the earlier accounts of this flow is captured by the “saving-investment spending identity”, which stipulates the equality between savings and investment spending in an autarkic state of a national economy [9,10]. Given the increased digitalization of payments and cross-country flow of financial resources from international trade and globalization [11,12], this identity might no longer reasonably hold at the national level [13] but could still be of value at the global economy level. That is, “in the global economy, the saving-investment spending identity holds reasonably”, such that global savings always equals global investment capacity.
Under such a view of globalized finance, we can define a global loanable funds market, which describes the economic behaviors of all potential savers and all potential borrowers (investors) in the global economy. Focusing specifically on small business development (entrepreneurship), we can define “the global loanable funds market for small business development”, which from here on, we refer to as the “Global Entrepreneurial Finance Market (GEFM)”.
The GEFM is assumed here to portray the economic behavior (dynamic interactions) of all potential savers and borrowers for entrepreneurial ventures in the global economy. In this sense, “the global demand for entrepreneurial funds (GEFD)” is driven by all those borrowing for entrepreneurial ventures, while “the global supply of entrepreneurial funds (GEFS)” is driven by all those saving for entrepreneurial ventures. The equilibrium of the GEFS and GEFD defines the cost of entrepreneurial funds in the GEFM.
Financial intermediaries, such as banks and other financial institutions, play an arbitrage role in this global dynamic. This role can be either exogenous, or endogenous to the GEFM, depending on the relative market power of the three economic actors (savers/suppliers, borrowers/demanders, and financial intermediaries). If financial intermediaries have relatively more power, then their arbitrage role will be exogenous to the GEFM. This means that those saving and those borrowing for entrepreneurial ventures will be taking their funds’ rate as exogenously set and adjust their optimization behaviors accordingly. This would be the case for a perfectly competitive GEFM, where there are so many potential savers for entrepreneurial ventures, and so many potential borrowers for entrepreneurial ventures. On the other hand, if the GEFM is imperfectly competitive, then financial intermediaries will have relatively less market power, in which case their arbitrage role will be endogenous. This implies that globally, those saving and those borrowing for entrepreneurial ventures will be influencing the entrepreneurial funds rate (cost) endogenously through their optimization behaviors.
In addition to financial intermediaries, existing public (government) and private enterprises are two key stakeholders of the global economy, with potential influences on the GEFM. They may stimulate the supply and/or demand for entrepreneurial funds in the global economy through their own financial management practices. For example, by increasing (decreasing) their flow of financial transfers to citizens in the global economy, public and private sector enterprises might shift (increase or decrease) the income available to citizens, and thereby affect their saving and borrowing behaviors for entrepreneurial ventures.
Globally, entrepreneurial intentions, in terms of willingness to save and willingness to borrow for entrepreneurial ventures, may also be affected by national economic conditions, in terms of employment opportunities [14], entrepreneurial ability/efficiency (as potentially mediated by formal education) [15], prevailing wealth level [16], and individual age [17]. Therefore, in what follows, the above relational propositions are empirically tested by analyzing the economic behaviors of suppliers (savers) and demanders (borrowers) of entrepreneurial funds in the global economy. More specifically, we investigate the relative influence of financial transfers from public and private sector enterprises on the behavioral dynamics of global entrepreneurial funds suppliers and demanders.
The following structure is therefore adopted for the rest of this paper: Section 2 develops a succinct review of the stream of entrepreneurial finance literature built around the various fundraising instruments; Section 3 presents the materials and methods, by first providing a theoretical analysis of the dynamics within the global entrepreneurial finance market (GEFM), followed by the presentation of a Random utility based econometric formulation of economic agents’ behavioral optimization within the GEFM, and then by a description of the data and variables used in the analysis; Section 4 presents the results, which are then discussed in Section 5, along with the limitations and directions for further research.

2. Literature Review

Following the various fundraising instruments available in the global entrepreneurial finance market, scholars have developed largely separate streams of literature in business angel financing [18,19,20], venture capital financing [21,22], bank financing [23,24], private equity financing [25,26], lease financing [27,28], supplier financing [29,30] and more recently, crowdfunding [31,32] and initial coin offerings [33,34,35].
For example, Ref. [18] identify the main contents and outcomes of business angels through backward and forward citations analysis, thereby depicting the current knowledge base underpinning business angels, and its impact on other research fields. Also addressing the changing nature of angel investing, Ref. [19] report an increasing tendency of angel investors to subscribe to organized and managed angel groups, alongside other angels, rather than investing individually. Building on this networked view of angel investment to analyze the likelihood that a company receives investments from a business angel group based on its position in the network of relationships arising from past investments, Ref. [20] reveal the importance of experience and geographical proximity in influencing this relationship between angel investors and fund-seeking companies.
Furthermore, analyzing 372 investment rounds related to 256 Italian-based new ventures, with the aim of assessing how angel groups and venture capital (VC) funds affect digital new ventures’ growth during startup and scale up, Ref. [21] reports a positive growth effect of VC funds, with an inverted U-shaped relationship between funding receipt and growth, reaching in-sample optimality at $300,000. However, their findings revealed no growth effects at neither startup nor scale up phases from angel groups’ financing. Moreover, looking into VC’s role in financing Innovation, Ref. [22] argues despite the optimism reported by many practitioners and academics, that VC financing also has noteworthy limitations in its ability to substantially ignite technological change. According to the authors, this is because of three emerging features that adversely impact the rate and direction of VC-driven innovation in the broader economy. These are: (i) the recent years’ relaxation of the prior intense corporate governance emphasis of VC firms, (ii) the somewhat limited number of VC investors holding and shaping the direction of radical technological change, and finally (iii) the narrow spectrum of technology innovations fitting the requirements of institutional VC investors.
Focusing instead on bank financing using a sample of 1973 Australian SMEs, Ref. [23] highlights a limited overlap between the factors driving Australian SMEs’ bank finance seeking and those influencing banks’ credit rationing decisions. Their findings revealed that agricultural SMEs with growth intensions and clear business plans are more likely to seek bank financing compared to their counterparts that are export oriented, with incremental product innovation strategy and of male CEOs. In addition, embracing a credit ratings’ perspective to investigate the relationship between bank financing and corporate S&P credit ratings, Ref. [24] report a significant penalty from a higher mix of bank debt for firms with top quality credit, and therefore recommend that managers of such firm types have more recourse to public debt instead.
Furthermore, in an attempt to formulate an agenda for future research, Ref. [25] surveyed the growing literature on VC and private equity (PE) financings and reported, among other hot topics and fertile avenues for prospective investigations, (i) the causal link between VC and PE financing and firms performances (e.g., growth or innovation), (ii) internationalization, and (iii) the process through which investors and entrepreneurs select and match with each other.
On the subject of lease financing, relying on the Nigerian leasing industry (characterized by recent years’ increased assets demand, with rising domestic purchase costs, coupled with a shortage of foreign exchange), Ref. [28] reports funding to be a major challenge with banks as market participants, providing much of the finance to other non-bank lessors, which account for about 80% of lease transactions to mostly micro-, small-, and medium-size enterprises. Regarding supplier financing from the perspective of differential access to financial markets and internal financing, Ref. [29] using a sample of Spanish SMEs between 1998 and 2014, show its positive relationship with firm value. Indeed, supporting the financing motive for trade credit use, their findings revealed that firms with lower financial cost and better availability of financial resources place less emphasis on supplier financing. Corroborating further, this latter report is the theoretical treatment provided by [30], which analyzed the supplier’s optimal decision, given the retailer’s initial capital level and payment immediacy, comparing combined credit financing (CCF) and trade credit financing (TCF). Their findings revealed that, for low retailer’s initial capital level, or significant retailer’s capital constraint, the supplier is better off choosing TCF; otherwise CCF is more optimal. In either case, cooperation is reported to be more profitable for the supplier.
With regards to crowdfunding intentions within the context of developing economies, Ref. [31] provides ex ante evidence from Bangladesh, using a structured questionnaire data from 252 respondents and ordered probit regression. Their findings revealed respondent age and location (domestic vs. abroad) positively influenced the intention to contribute, while education level exerted an adverse influence. In addition, linking the campaign idea with positive media coverage of crowdfunding was reported to significantly raise contribution intentions. Moreover, analyzing crowdfunding through the lenses of civism, using a fuzzy set qualitative comparative analysis, based on a sample of 40 successful civic crowdfunding rounds by a local government in Italy, Ref. [32] report the nature of the projects to be financed, and the presence of rewards to be the most critical driving factors of civic crowdfunding campaigns.
Furthermore, approaching crowdfunding and initial coin offerings (ICOs) as democratized entrepreneurial finance processes, Ref. [33] argue the commonality of many of their features, and suggest the optimality of their future combinations in circumventing individual inefficiencies and shortcomings. Similarly, relying on a sample of more than 1500 ICOs that collectively raised $12.9 billion, Ref. [34] report successful real outcomes to be associated with disclosure, credible commitment to the project, and quality signals. In addition, ICO token exchange listings further increased future employment, and are thus seen to have real consequences for companies. Finally, providing a comprehensive review of the global development of ICOs and their regulation, Ref. [35] shows that despite its relatively short history, the ICO market has observed sizeable changes. The dimensions of these changes include the large number and geographic spread of ICOs, the amounts of raised funds, and their regulatory frameworks. As a result, the authors recommended that prospective studies of ICO funding differentiate the supply and demand sides, while taking geography, regulation, and a global perspective into account.
It is therefore against the background provided by the above reviewed literature that the present research analyzes the global supply and demand of entrepreneurial finance, focusing on the influences from public and private sectors’ financial injections on its equilibrium properties. Hence, the next section now describes the materials and methods used.

3. Materials and Methods

3.1. Theoretical Analysis of the Global Entrepreneurial Finance Market Dynamics

Consistent with the model presented in [12], the presence of two periods of lived economic agents is assumed in the global economy ( t and t + 1 ), with corresponding disposable incomes ( Y t d and Y t + 1 d ), and consumptions ( C t and C t + 1 ). Each economic agent is further given the freedom to borrow or save in the global entrepreneurial finance market, at a funds rate ( r = CEF), hence the following definition of the savings function is derived:
S t = Y t d C t
As graphically depicted in Figure 1 below, S t can be either positive, negative, or null, depending on the tangency point between the intertemporal budget constraints (IBC) and the highest achievable indifference curve, with:
S t > 0 When an individual has net savings in the GEFM;
S t < 0 When an individual has net borrowings in the GEFM (dis-savings);
S t = 0 When an individual is neither a net saver nor borrower in the GEFM.
In this framework, the global entrepreneurial funds supply as depicted in Figure 2 below, is the sum of all the savings that individual economic agents undertake for entrepreneurial ventures in the global economy (GEFS). Similarly, the global entrepreneurial funds demand is the sum of all the borrowings that individuals undertake for entrepreneurial ventures in the global economy (GEFD). The global entrepreneurial finance market (GEFM) represents, therefore, the behavioral dynamics of all potential savers and borrowers with entrepreneurial intent in the global economy.

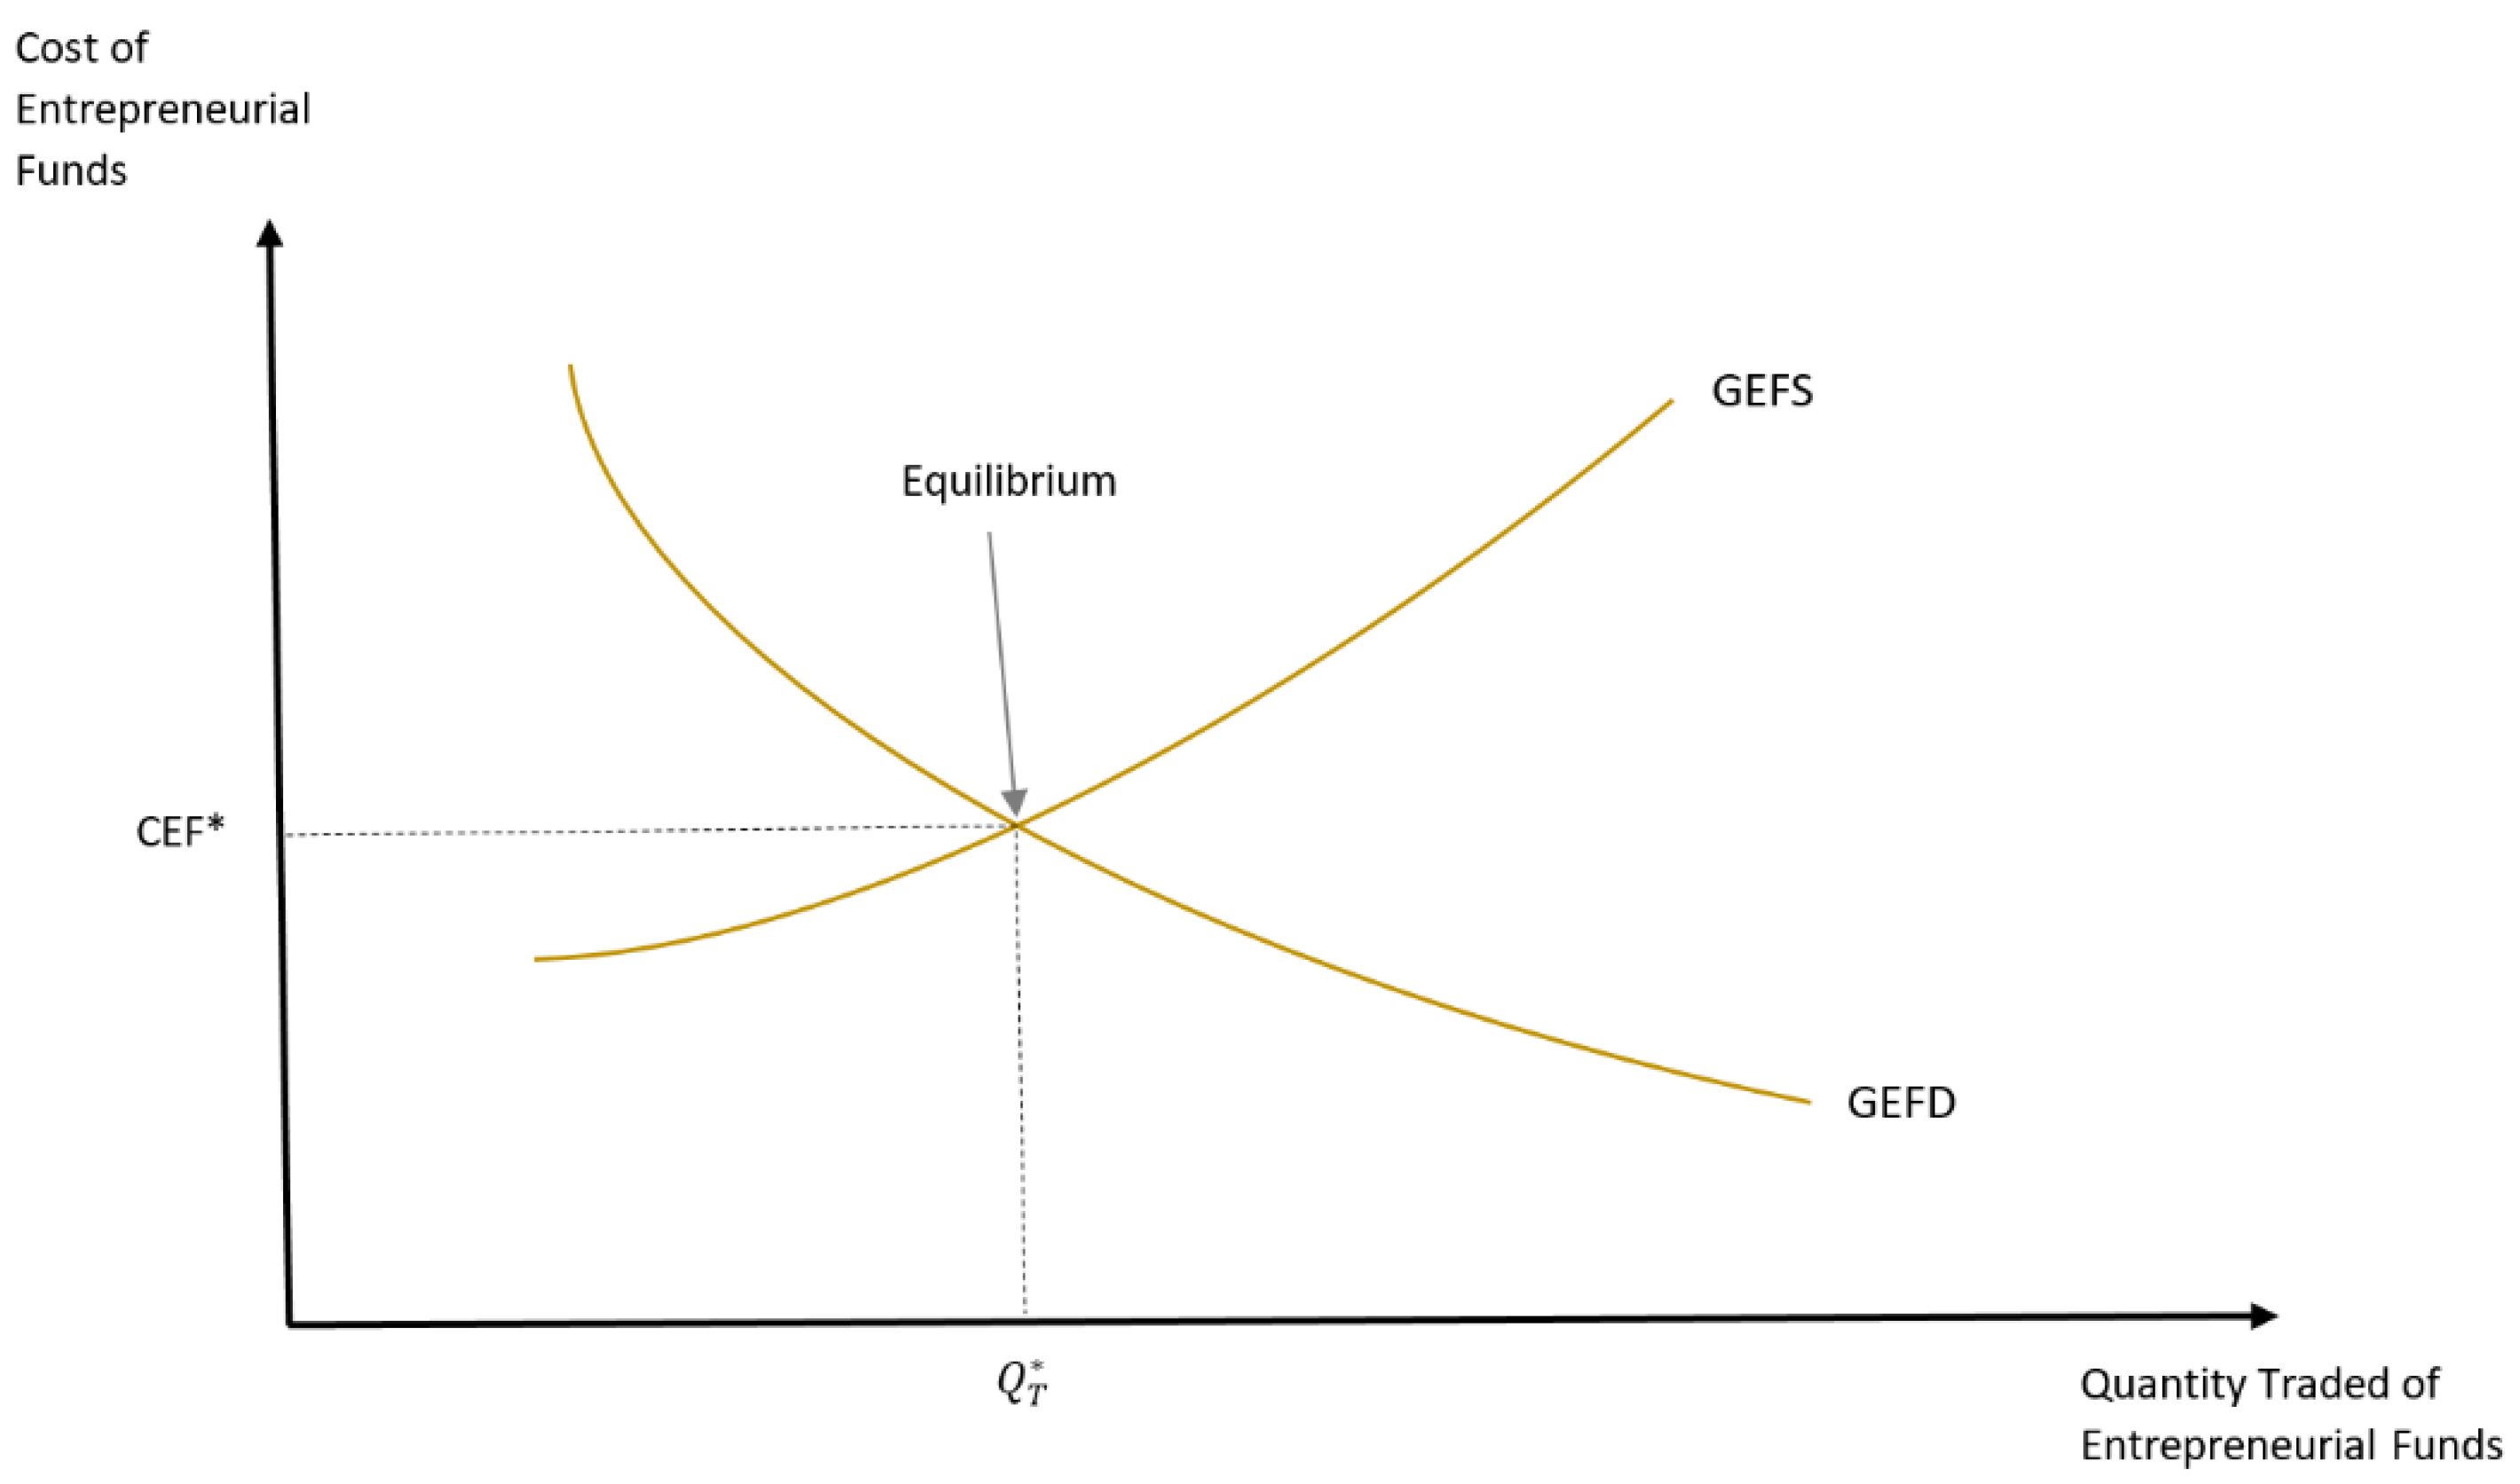
3.1.1. The Global Entrepreneurial Finance Market (GEFM)

The GEFM, as graphically depicted in Figure 2, shows a hypothetical demand curve that highlights the willingness to borrow money to fund entrepreneurial ventures (or the global entrepreneurial funds demand-GEFD) but also shows a hypothetical supply curve, which highlights the willingness to save money for entrepreneurial ventures (or the global entrepreneurial funds supply—GEFS). With similar features as other markets, the GEFD is a decreasing function of the cost of entrepreneurial funds (or CEF), while the GEFS is an increasing function of this latter. In other words, as the cost of entrepreneurial funds increases (decreases), the willingness to borrow for entrepreneurial ventures decreases (increases), while the willingness to save for entrepreneurial ventures increases (decreases).

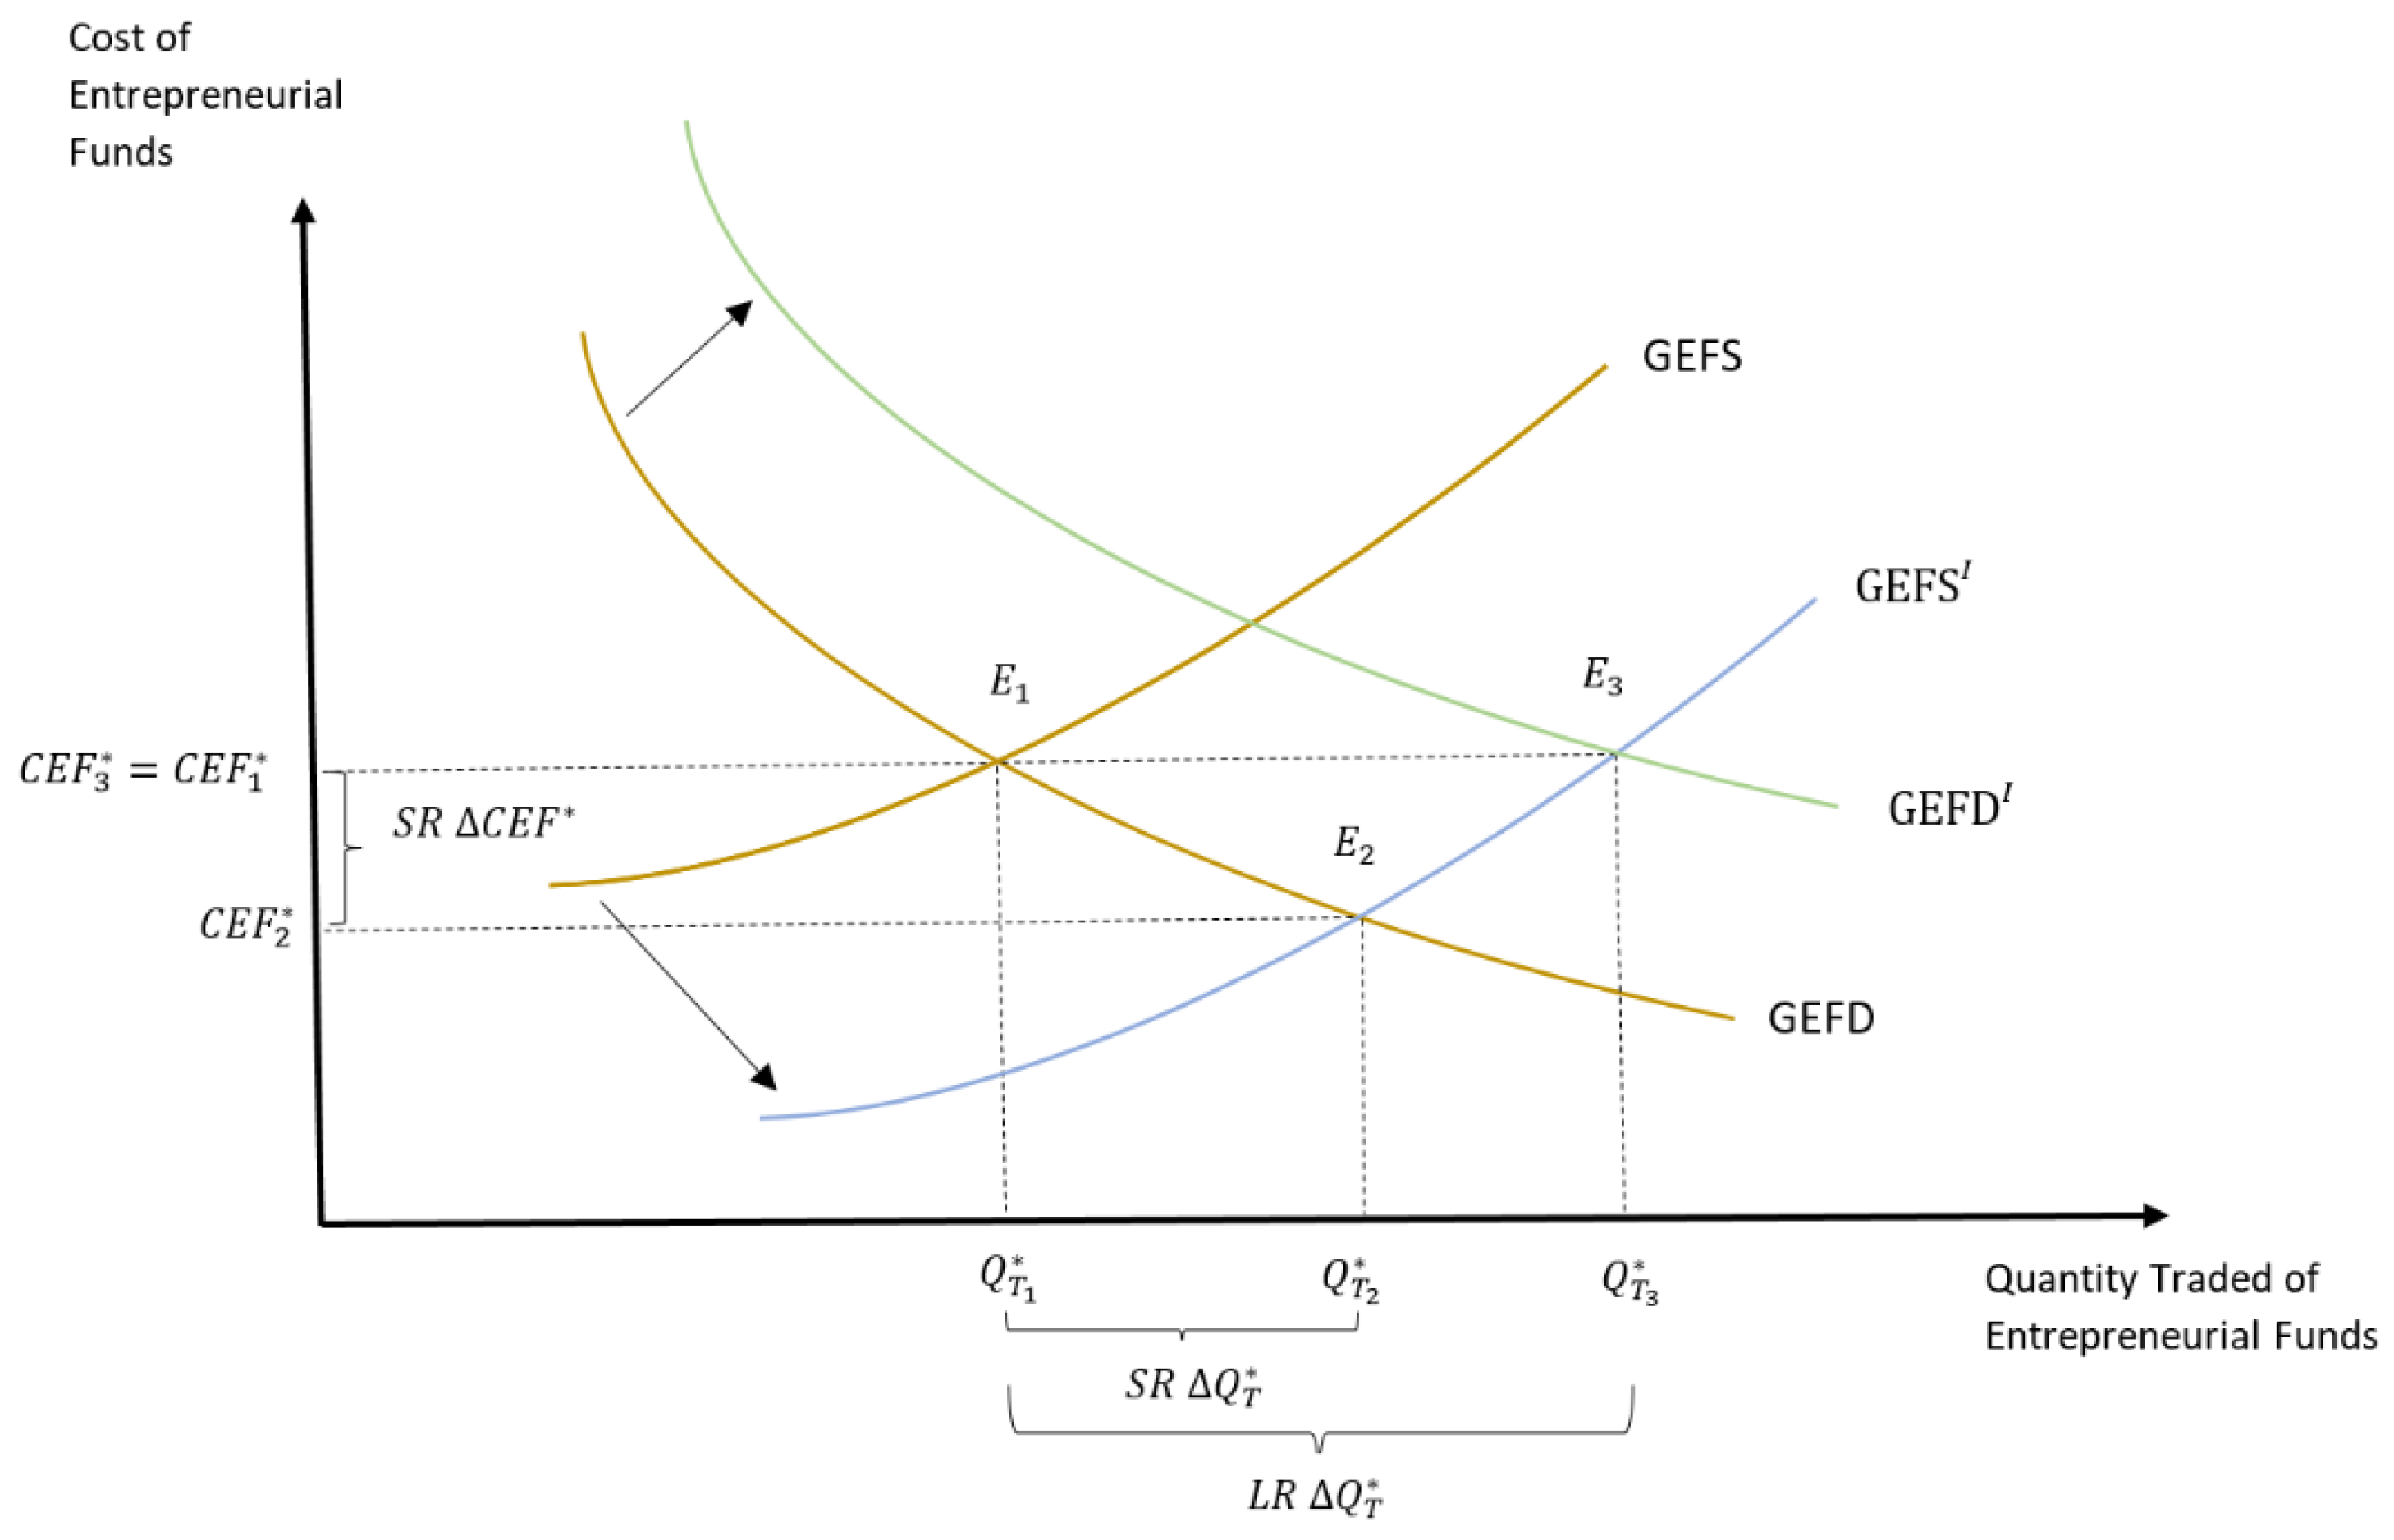
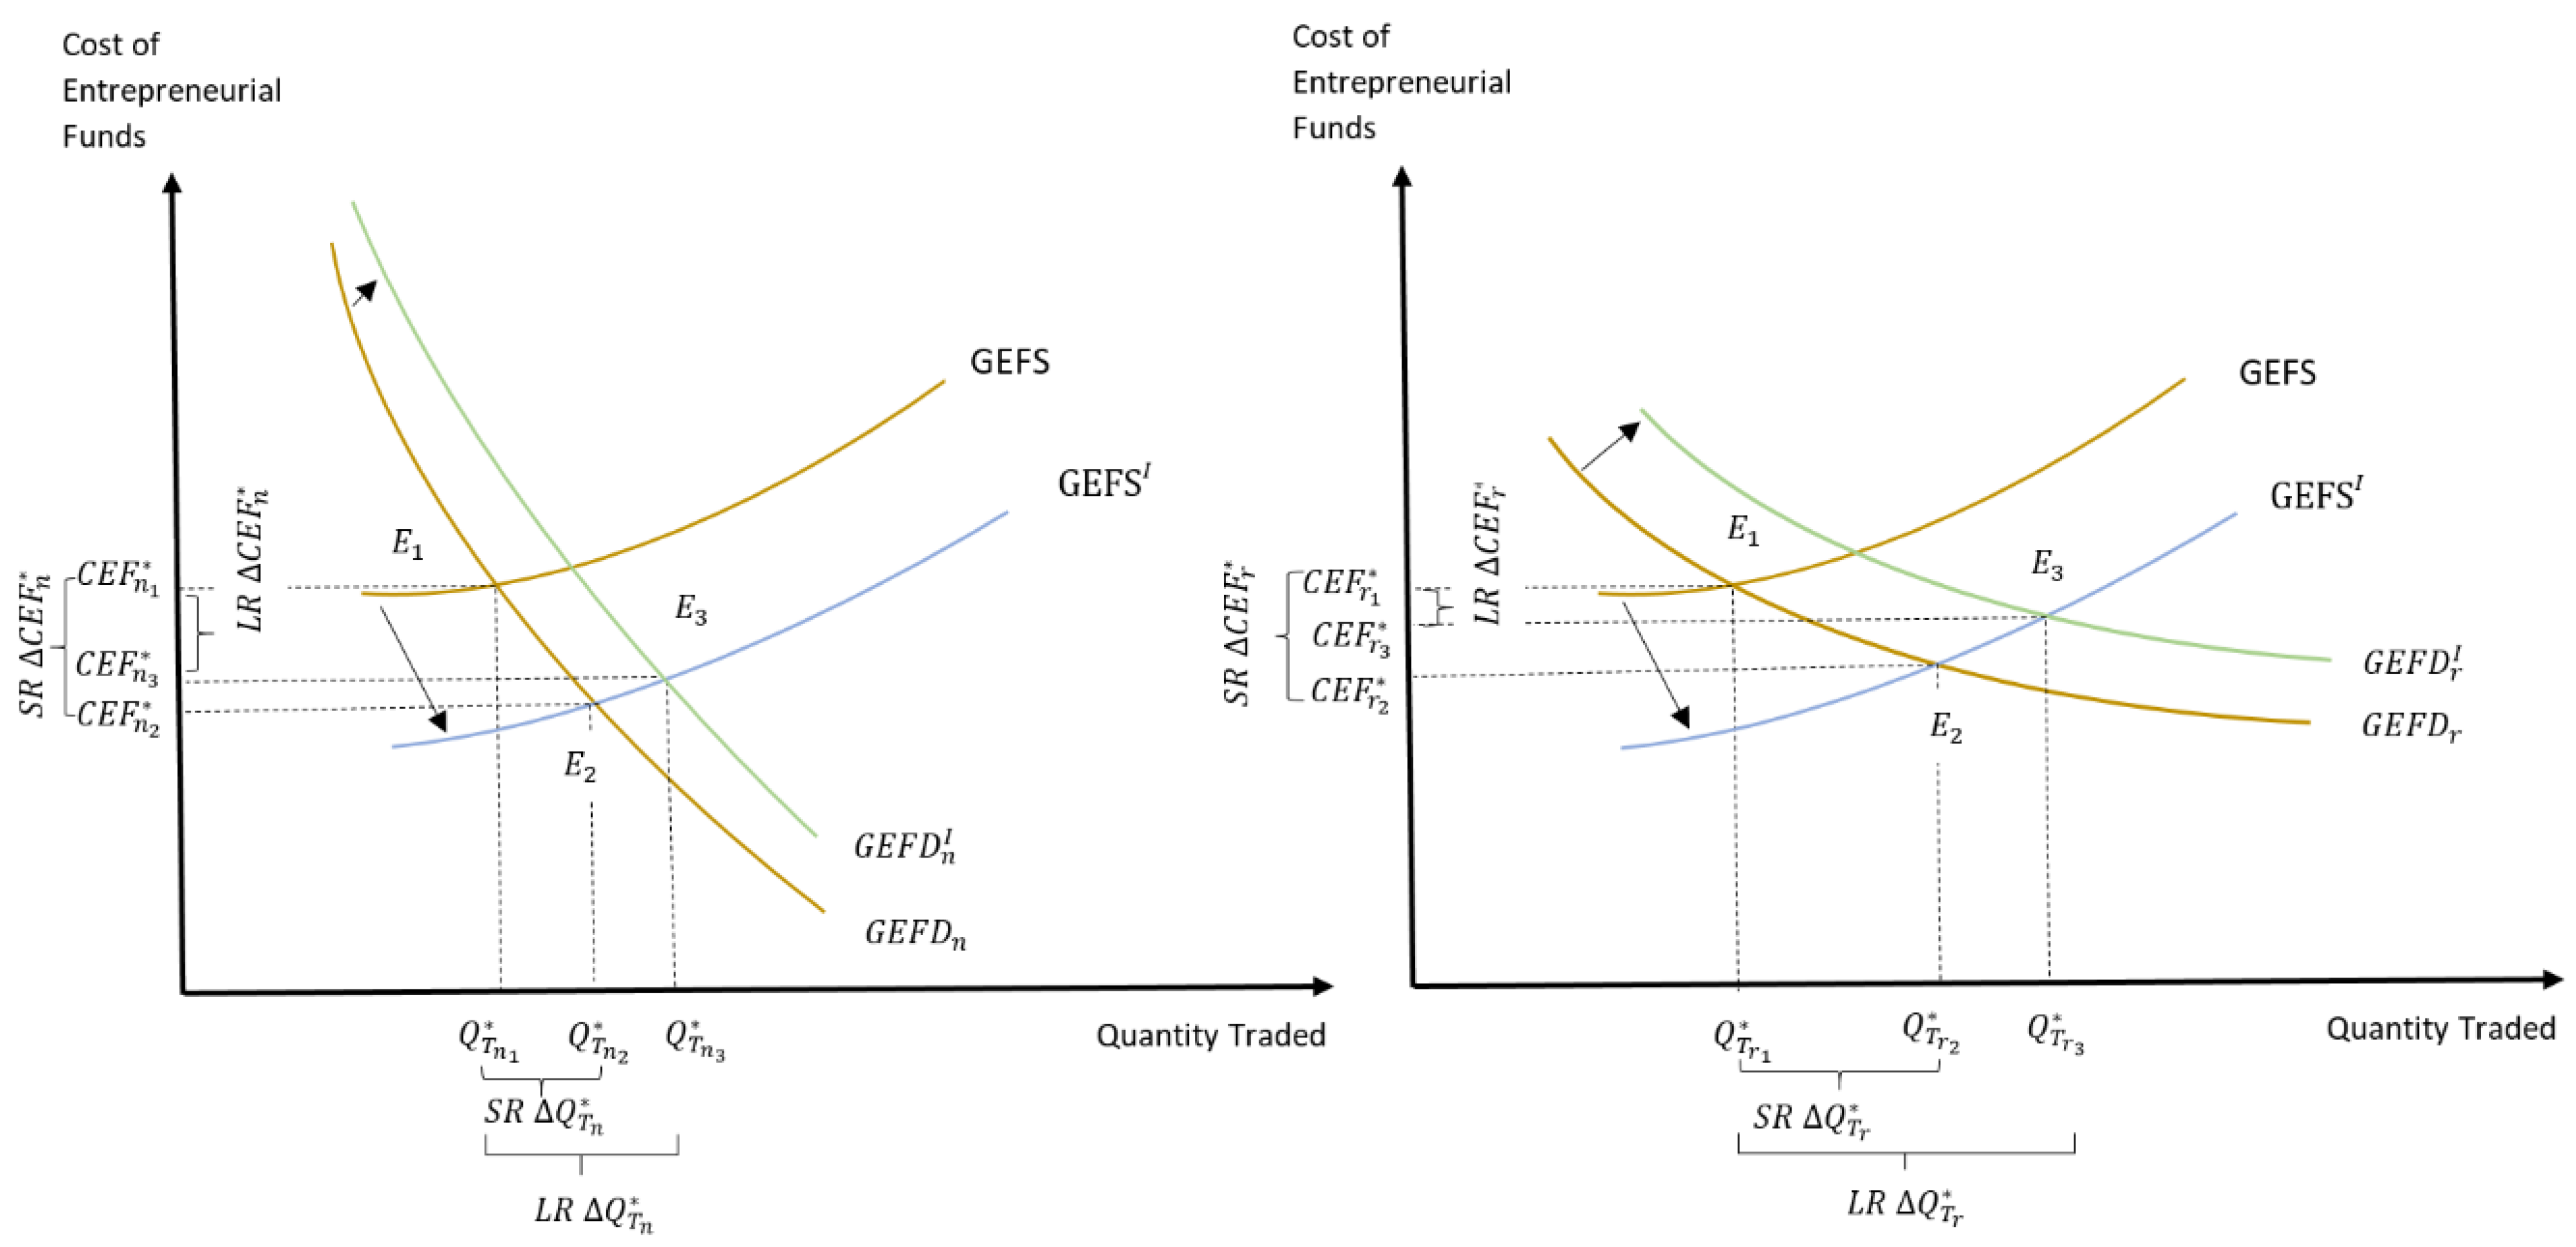
3.1.2. Public Sector and Private Sector Financial Injections and the GEFM

All things equal, at a constant cost of borrowing, that is, if the arbitrage role of financial intermediaries is exogenous as depicted in Figure 3, increased financial injections from public (government) and private sector enterprises, shifts the GEFS curve upward to GEFS I due to increased propensity to save at all income levels. In the short run, this puts a downward pressure on the cost of entrepreneurial funds, which decreases from C E F 1 * to C E F 2 * , due to excess funds supply. As financial intermediaries mediate increased borrowing for entrepreneurial ventures, to maintain the constancy/stability of the CEF, the GEFD shifts progressively up until equilibrium cost is reestablished at C E F 3 * . The net-effects of public and private sector financial injections under exogenous intermediations are increased quantity traded of entrepreneurial funds in the global economy, in both the short-( S R   Δ Q T * ) and long-( L R   Δ Q T * ) run, at a stable/constant real interest rate ( C E F 3 * = C E F 1 * ) .
Under the endogenous financial intermediation scenario, however, the CEF is greatly determined within the GEFM. As such, financial injections from public and private sector enterprises increase the GEFS by shifting it to the right to GEFS I , thereby reducing the equilibrium CEF in the short term, while increasing the quantity traded of entrepreneurial funds. How much the now cheaper CEF is able to attract entrepreneurial funds borrowing depends on the sensitivity (elasticity) of the GEFD. If borrowers are less responsive as in the left panel of Figure 4, then both the short run (SR) and long run (LR) net-effects on the GEFM of public and private sectors financial injections will be a greater reduction of the equilibrium CEF ( Δ C E F n * > Δ C E F r * ) and a lesser increase in the equilibrium quantity of traded entrepreneurial funds ( Δ Q T n * < Δ Q T r * ) in the global economy. However, if borrowers are more responsive as in the right panel of Figure 4, then both the short run (SR) and long run (LR) net-effects on the GEFM of public and private sector financial injections will have a relatively lesser reduction in the equilibrium CEF ( Δ C E F r * < Δ C E F n * ), with a relatively higher increase in the equilibrium quantity of traded entrepreneurial funds ( Δ Q T r * > Δ Q T n * ).
In the above theoretical discussions, the exogenous scenario is a mere special case of the endogenous financial intermediation, which relies on the assumption of a perfectly competitive GEFM. Relaxing this hypothesis (due to potential market frictions) “endogenizes” the financial intermediation process, allowing us to describe the dynamics of an imperfectly competitive GEFM. In all instances of financial intermediations, whether exogenous or endogenous, the initial market equilibrium prior to financial injections is at E 1 , following the financial injections and the resulting increase in GEFS, the short run equilibrium moves to E 2 . Following the responsiveness of global demand for the now cheaper entrepreneurial funds and the resulting upward shift of the GEFD, the long-run market equilibrium ends up at E 3 . Building on [36], who established wellbeing as a core aspect of entrepreneurial fund supply and demand interaction, and on [37], who linked financial inclusion with wellbeing, the above theoretical developments are empirically tested using a Random Utility theoretic formulation of economic agents’ behavioral optimization in the global entrepreneurial finance market.

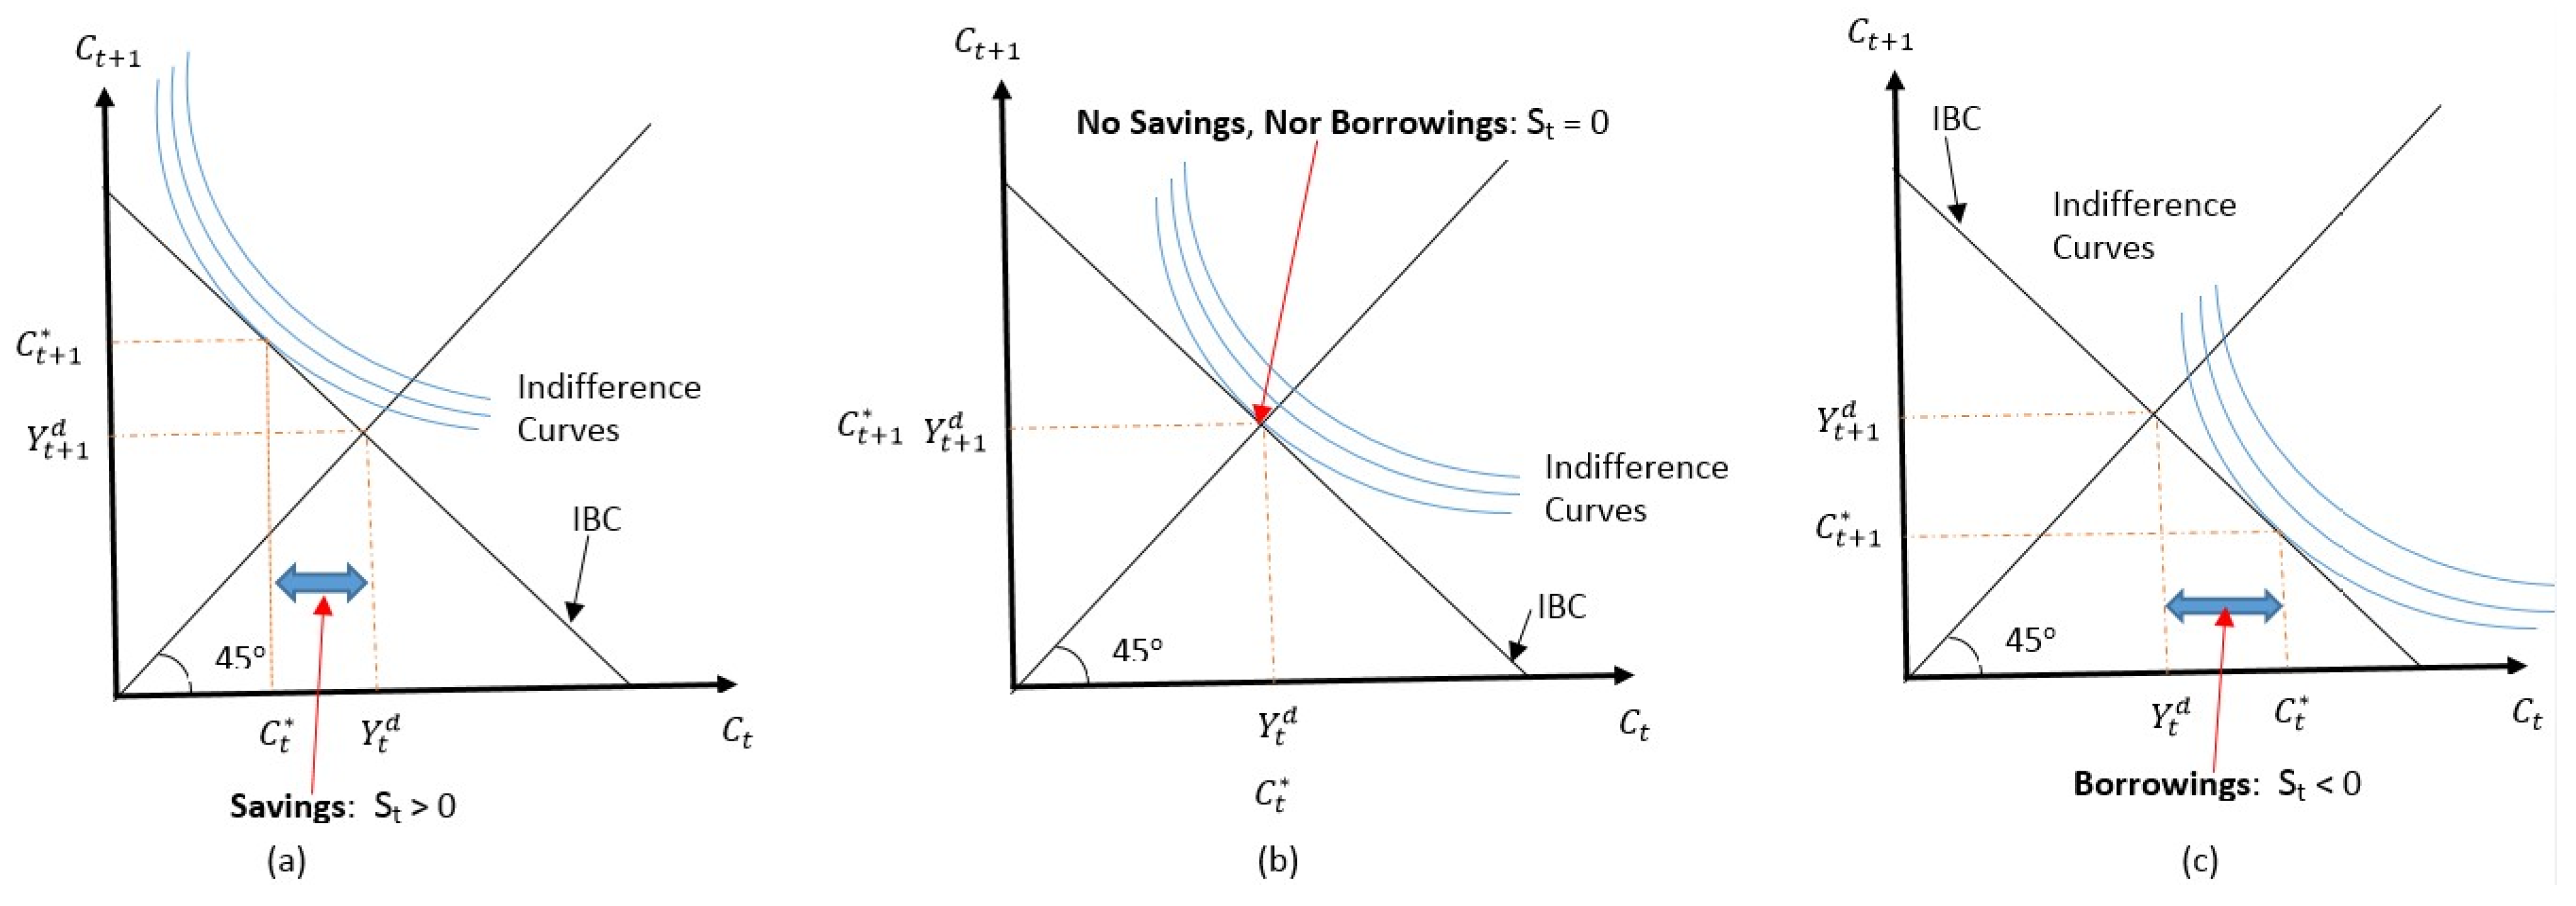
3.2. Random Utility Based Model of Individuals’ Behavioral Optimizations in the GEFM

Econometrically, financial intermediation is “endogenized” within the context of Random Utility Maximization by assuming that each economic agent in the process of choosing to save or borrow for an entrepreneurial venture, jointly decides whether to hold a formal account with a financial intermediary. Assuming the choice of account ownership to be under the control of the economic agent allows us to characterize econometrically the GEFM using a system of three potentially nonlinear equations. The first equation describes the choice process of the representative economic agent to hold an account with a financial intermediary in the global economy. The second equation characterizes the choice process of the representative agent to save for an entrepreneurial venture, while the third and final equation characterizes her choice process to borrow for an entrepreneurial venture.
Jointly estimating these three equations allows for their error terms to correlate in an endogeneity switching regression framework [38], thereby statistically controlling for the formerly described endogeneity of financial intermediation. As previously implemented in [39], this framework is appropriate for discrete choice modelling in the presence of an endogenous binary regressor, as is the case here. The special case of exogenous financial intermediation is obtained by assuming account access to be outside of the economic agent’s control, and therefore treated as an exogenous explanatory factor in the two processes of saving and borrowing for entrepreneurial ventures. Therefore, using Random Utility maximization, we explicitly define the following additive utility representations:
{ U A * = V A + ε A U A ¯ * = V A ¯ + ε A ¯ { U S * = V S + ε S U S ¯ * = V S ¯ + ε S ¯ { U B * = V B + ε B U B ¯ * = V B ¯ + ε B ¯
where:
A: characterizes an individual’s choice to “own an account with a financial intermediary”, while A ¯ is its corresponding complementary event;
S: characterizes the binary choice to “save for an entrepreneurial venture”, while S ¯ is its corresponding complement;
B: characterizes the binary choice to “borrow for an entrepreneurial venture”, while B ¯ is its corresponding complement.
In the above formulation V A , V A ¯ , V S , V S ¯ , V B , and V B ¯ capture the deterministic components of the utility functions, while ε A ,   ε A ¯ , ε S , ε S ¯ , ε B , and ε B ¯ represent the random parts of utility. Since utility is a latent in nature, only the indicators of each economic agent’s choice of account ownership, entrepreneurial saving, and entrepreneurial borrowing are observable as:
  D 1 = { A           if                   U A * U A ¯ * > 0 A ¯                                         otherwise   D 2 = { S               if             U S * U S ¯   * > 0 S ¯                                         Otherwise D 3 = { B               if       U B * U B ¯ * > 0 B ¯                                   Otherwise
Furthermore, as individual binary processes, each decision context can be characterized with success (1) or failure (0), resulting in Equation (2) being equivalently stated as:
  D 1 = { 1           if                   U A * U A ¯ * > 0 0                                         otherwise   D 2 = { 1               if             U S * U S ¯   * > 0 0                                         Otherwise D 3 = { 1                 if           U B * U B ¯ * > 0 0                                         Otherwise
In this formulation, the marginal probabilities of an individual’s decision to own a formal account, save, or borrow for entrepreneurial purposes are:
P [ D 1 = 1 ] = P [ U A * U A ¯ * > 0 ] P [ D 2 = 1 ] = P [   U S * U S ¯   * > 0 ] P [ D 3 = 1 ] = P [ U B * U B ¯ * > 0 ]
Focusing initially on the equation describing the decision to own a formal account, we get:
P [ U A * U A ¯ * > 0 ] = P [ ( V A + ε A ) ( V A ¯ + ε A ¯ ) > 0 ] = P [ ( ε A ε A ¯ ) > ( V A ¯ V A ) ] = P [ ( ε A ¯ ε A ) < ( V A ¯ V A ) ]
In a similar fashion, the marginal probabilities of the decisions to save or borrow for entrepreneurial purposes are obtained as:
P [ U S * U S ¯   * > 0 ] = P [ ( ε S ¯ ε S ) < ( V S ¯ V S ) ]
P [ U B * U B ¯ * > 0 ] = P [ ( ε B ¯ ε B ) < ( V B ¯ V B ) ]
For notational simplicity we express:
V A ¯ V A =   V ˜ A   and   ε A ¯ ε A =   ε ˜ A V S ¯ V S =   V ˜ S   and   ε S ¯ ε S =   ε ˜ S V B ¯ V B =   V ˜ B   and   ε B ¯ ε B =   ε ˜ B
Such that the marginal probabilities in Equations (5)–(7) become:
P [ D 1 = 1 ] = P [ ε ˜ A < V ˜ A ] = V ˜ A f ( ε ˜ A )   d ε ˜ A
P [ D 2 = 1 ] = P [ ε ˜ S < V ˜ S ] = V ˜ S f ( ε ˜ S ) d ε ˜ S
P [ D 3 = 1 ] = P [ ε ˜ B < V ˜ B ] = V ˜ B f ( ε ˜ B ) d ε ˜ B
Hence, to test the endogenous financial intermediation hypothesis, the implicit independence hypothesis in the above expressions are relaxed, resulting in the following joint probability density of formal account ownership, entrepreneurial saving, and entrepreneurial borrowing:
P [ D 1 = 1 ,   D 2 = 1 ,   D 3 = 1 ] = V ˜ A V ˜ S V ˜ B   f ( ε ˜ A , ε ˜ S , ε ˜ B )   d ε ˜ B   d ε ˜ S d ε ˜ A  
where f ( ε ˜ A , ε ˜ S , ε ˜ B ) represents the joint multivariate (trivariate) probability density. The trivariate logistic model (TLM) is obtained when this density is assumed to follow the multivariate extreme value distribution, with f ( ε ˜ A , ε ˜ S , ε ˜ B ) =   Λ ( ε ˜ A , ε ˜ S , ε ˜ B ) . Conversely, the trivariate probit model (TPM) is obtained, and this density is assumed to follow a multivariate normal distribution, with f ( ε ˜ A , ε ˜ S , ε ˜ B ) =   Φ ( ε ˜ A , ε ˜ S , ε ˜ B ) . For both specifications of the model, the corresponding variance–covariance matrix of the joint density function in Equation (12) is:
= [ θ A A θ A S θ A B θ S S θ S B θ B B ]
where θ A A ,   θ S S , and θ B B represent the variances of the account ownership process, the process of saving for entrepreneurial purposes, and the process of borrowing for entrepreneurial purposes respectively;   θ A S ,   θ A B , θ S B represent the respective covariance between account ownership and saving for entrepreneurial purposes, between account ownership and borrowing for entrepreneurial purposes, and between saving and borrowing for entrepreneurial purposes. We follow the usual identification restrictions of setting the variance parameters in the diagonal to unitary and estimate the covariance parameters θ A S ,   θ A B , θ S B along with the unknown β i j parameters as shown in Equations (14)–(16) below. In the above Random Utility Model, the deterministic parts of utility are formally expressed:
V ~ A = β 10 + β 11 GovTransf 12 m   + β 12 WagPaiRec 12 m   + β 13 EmerFundAces   + β 14 DebCard   + β 15 CredCard   + β 16 InterntBasdPaymt     + β 17 UtBillsPaid 12 m + β 18 female   + β 19 age   + β 110 educ     + β 111 icome q + β 112   y e a r   + β 113   c o u n t r y  
V ~ S = β 20 + β 21 GovTransf 12 m   + β 22 WagPaiRec 12 m   + β 23 EmerFundAces   + β 24 DebCard + β 25 CredCard + β 26 InterntBasdPaymt   + β 27 UtBillsPaid 12 m + β 28 female + β 29 age + β 210 educ   + β 211 icome q + β 212   y e a r + β 213   c o u n t r y
V ~ B = β 30 + β 31 GovTransf 12 m   + β 32 WagPaiRec 12 m   + β 33 EmerFundAces   + β 34 DebCard   + β 35 CredCard   + β 36 InterntBasdPaymt     + β 37 UtBillsPaid 12 m + β 38 female   + β 39 age   + β 310 educ     + β 311 icome q + β 312   y e a r   + β 313   c o u n t r y     + β 314 LoanFinInstHomAptLand
With the coefficients β i j representing the conditional effects of the explanatory factors on the joint likelihood of formal account ownership, saving, and borrowing for entrepreneurial purposes, in the global economy. Of primary interest, the impacts of public sector financial injections on the global processes of formal account ownership, saving and borrowing for entrepreneurial ventures are captured by β 11 ,   β 21 , and β 31 , respectively. Similarly, the impacts of private sector financial injections on these three global processes are captured by β 12 ,   β 22 , and β 32 , respectively.
Furthermore, the potential heterogeneity due to cross-country differences in financial sector infrastructural readiness are captured by the country fixed effects β 113 , β 213 , and β 313 , respectively. Econometrically, this practice allows all explicitly included explanatory factors to reflect their true (unbiased) influences on the three interdependent processes of formal account ownership, saving, and borrowing for entrepreneurial ventures in this analysis.
Estimation of the model is achieved using the R statistical package, version 3.6.3 by the R core team [40]. More specifically, the trivariate probit estimator presented in [41] and provided through the R library “GJRM” for the joint conditional distribution, and the “mfx” library [42] used for the marginal effects.
Finally, the explanatory factor “ LoanFinInstHomAptLand ” is introduced as an exclusion restriction in Equation (16), which characterizes the process of entrepreneurial borrowing to improve the mixing properties of the trust-region iteration algorithm. In addition to its technical value, doing so is equivalent to assuming that the willingness and ability of an economic agent to borrow for entrepreneurial purposes in the global economy, depends on whether that individual has an ongoing mortgage loan with a financial institution.

3.3. The Description of the Data and Variables

The data is pooled from the 2014 and 2017 cross-sections of the Global Financial Inclusion survey, conducted by the World Bank on a triennial basis. Each cross-section of the survey is carried out in over 140 languages, covering about 1000 participants in each of nearly 160 economies, using random sampling for national representativeness. The survey is conducted face to face in nations with below 80% telephone penetration and targets the civilian population 15 years and above.
Stage one of any face-to-face survey consists of randomly selecting stratified primary sampling units, which are clustered for multi-stage sampling. Participants are then selected according to proportional probability rules, or simple random sampling. In cases of telephone interviewing, random digit dialing is applied using a list of phone numbers, representative of the national population. Finally, data weighting is applied to ensure national representativeness of each sample in each wave.
The raw sample of the 2014 wave had 146,688 respondents, while the 2017 wave had 154,923 participants worldwide. Following the selection of the key variables for the analysis (see Table A1 for description), the data was treated, and the two waves pooled into a cross-sectional Panel of 224,677 participants from 153 nations, as graphically depicted in Figure A1. The final sample for all analyses includes 84,144 participants from the 2014 wave, and 140,533 participants from the 2017 wave (see Table A2 for summary statistics).

4. Results

The results are presented in five parts. First, the descriptive statistics of the variables in the study sample are provided; second, the spatial trends in the global entrepreneurial finance market between 2014 and 2017 are highlighted; third, the outcomes of the empirical model validation tests are described; fourth, the econometric findings on the conditional probability scale are discussed; and last, the estimated marginal effects of the included predictors of the GEFM’s dynamics are presented.

4.1. Descriptive Statistics of the Pooled Sample

The descriptive results are summarized in Table A2 with an average respondent age of 41.83 years and a standard deviation of 17.45 years. It can be noted from the table that, globally, 63.24% of the respondents report owning a formal account, with only 14.90% reporting to have saved for entrepreneurial purposes, while half of that amount, or 7%, report to have borrowed for entrepreneurial venture financing between 2014 and 2017.
Table A2 also shows that, globally, 14.86% of the respondents report to have received government financial (welfare) support, while 38.29% report to have received salary and wage money from employment. A greater majority (55.58%) report having access to emergency funds. In addition, 48.3% report to having an ATM debit card giving them access to instant withdrawals from their account. However, only 22.5% report to having a credit card that allows them to consume with deferred payment options. Similarly, only 26.56% report to have engaged in digital transactions (consumption purchases) over the past 12 months prior to the data collection.
Regarding respondents’ socioeconomic characteristics, Table A2 shows that 47.69% of respondents identify as female, while the remaining 52.31% are male. With respect to education level, the greatest majority (50.78%) report to have completed a secondary education, followed by 30.45% reporting at most a primary education, and finally 18.77% reporting at least a tertiary education. With regards to income, Table A2 indicates a rising proportion of individuals at higher income levels globally. Indeed, the greatest majority (27.39%) of individuals are in the richest 20% income quintile, followed by 21.98% in the fourth income quintile, then by 19.13% in the middle-income quintile, then by 16.82% in the second income quintile, and finally 14.68% in the last income quintile.

4.2. Spatial Trends in the Global Entrepreneurial Finance Market (GEFM)

The spatial trends in global entrepreneurial finance supply and demand are depicted in Figure A3 and Figure A4 respectively, while Figure A2 maps the global trends in formal account ownership between 2014 and 2017. A more precise account of the actual values can be gouged from the dynamic version of each map; however, for general tendencies, focusing first on formal account ownership in Figure A2, it can be noted that between 2014 and 2017, countries with the greatest weighted proportion of individuals reporting to owning a formal account with a financial institution include Canada, followed by Australia, Western Europe, Mongolia, China, Iran, USA, Thailand, Russia, South American nations, Eastern Europe, UAE, India, Saudi Arabia, Other South East Asian nations, the rest of Middle East, and Africa.
With respect to entrepreneurial finance supply, as captured by the weighted proportion of individuals reporting to have saved for entrepreneurial purposes, Figure A3 in the Appendix B shows the highest report coming from Korea, African nations, China, and other Southeast Asian nations (excluding Australia). This first group is then followed by Bolivia, Gulf nations, Iran, Pakistan, USA, Canada, Australia, Northern European countries, Mongolia, Russia, and Eastern European nations, Turkey, Kazakhstan, Afghanistan, India, and Yemen.
Similarly, Figure A4 in the Appendix B presents the demand for entrepreneurial finance in the form of weighted proportion of individuals reporting to have borrowed for entrepreneurial (farming or business) purposes in the global economy between 2014 and 2017. As the global map shows, entrepreneurial finance demand is the highest in African nations, such as Kenya, Uganda, Niger, Guinea, Tanzania, Zimbabwe, and Malawi. Following these countries are the group including Iran, Myanmar, and the rest of Southeast Asian nations, then by most of west and central African nations, followed by Brazil, Colombia, Mexico, Peru, Mongolia, China, India, Pakistan, Afghanistan, and the Gulf nations, including Iraq and Turkey. This latter group is then followed by the last group that include Russia, and the whole of Europe, Brazil, Argentina, Chile, Australia, Canada, and USA.
Together the above trends seem to suggest a relatively greater demand and supply of entrepreneurial finance in the least developed part of the global economy, where individuals also appear to report the least overall access to a formal account. This further suggests the potential influence of formal financial inclusion on both the supply and demand of entrepreneurial finance in the global economy, and especially in its least developed parts.

4.3. Tests for Empirical Model Validation

Empirical validation of the econometric model described in Section 3 is achieved by first assessing the association between the GEFM outcome indicators (i.e., formal account ownership, saving, and borrowing for entrepreneurial purposes) with each of the nominal predictors, including public and private sectors financial transfer indicators using chi-squared testing as summarized in Table A3. Then, the associations between these three GEFM outcome indicators and the quantitative factor “age” is assessed, using Welch’s t-test as presented in Table A5, conditional on a prior Levine’s test of homogeneity as shown in Table A4.

4.3.1. Test of Nominal Predictors Association with GEFM Outcome Indicators

As summarized in Table A3, for all three outcome indicators of the GEFM, the estimated chi-squared test statistics along with their corresponding p-values suggest the statistical significance of the specified empirical model described in Equations (14)–(16). Indeed, the individual tests have p-values below the 5% significance level, which suggest the strong dependence of all included nominal predictors with the three outcome indicators of the GEFM (i.e., formal account ownership, entrepreneurial saving, and entrepreneurial borrowing).

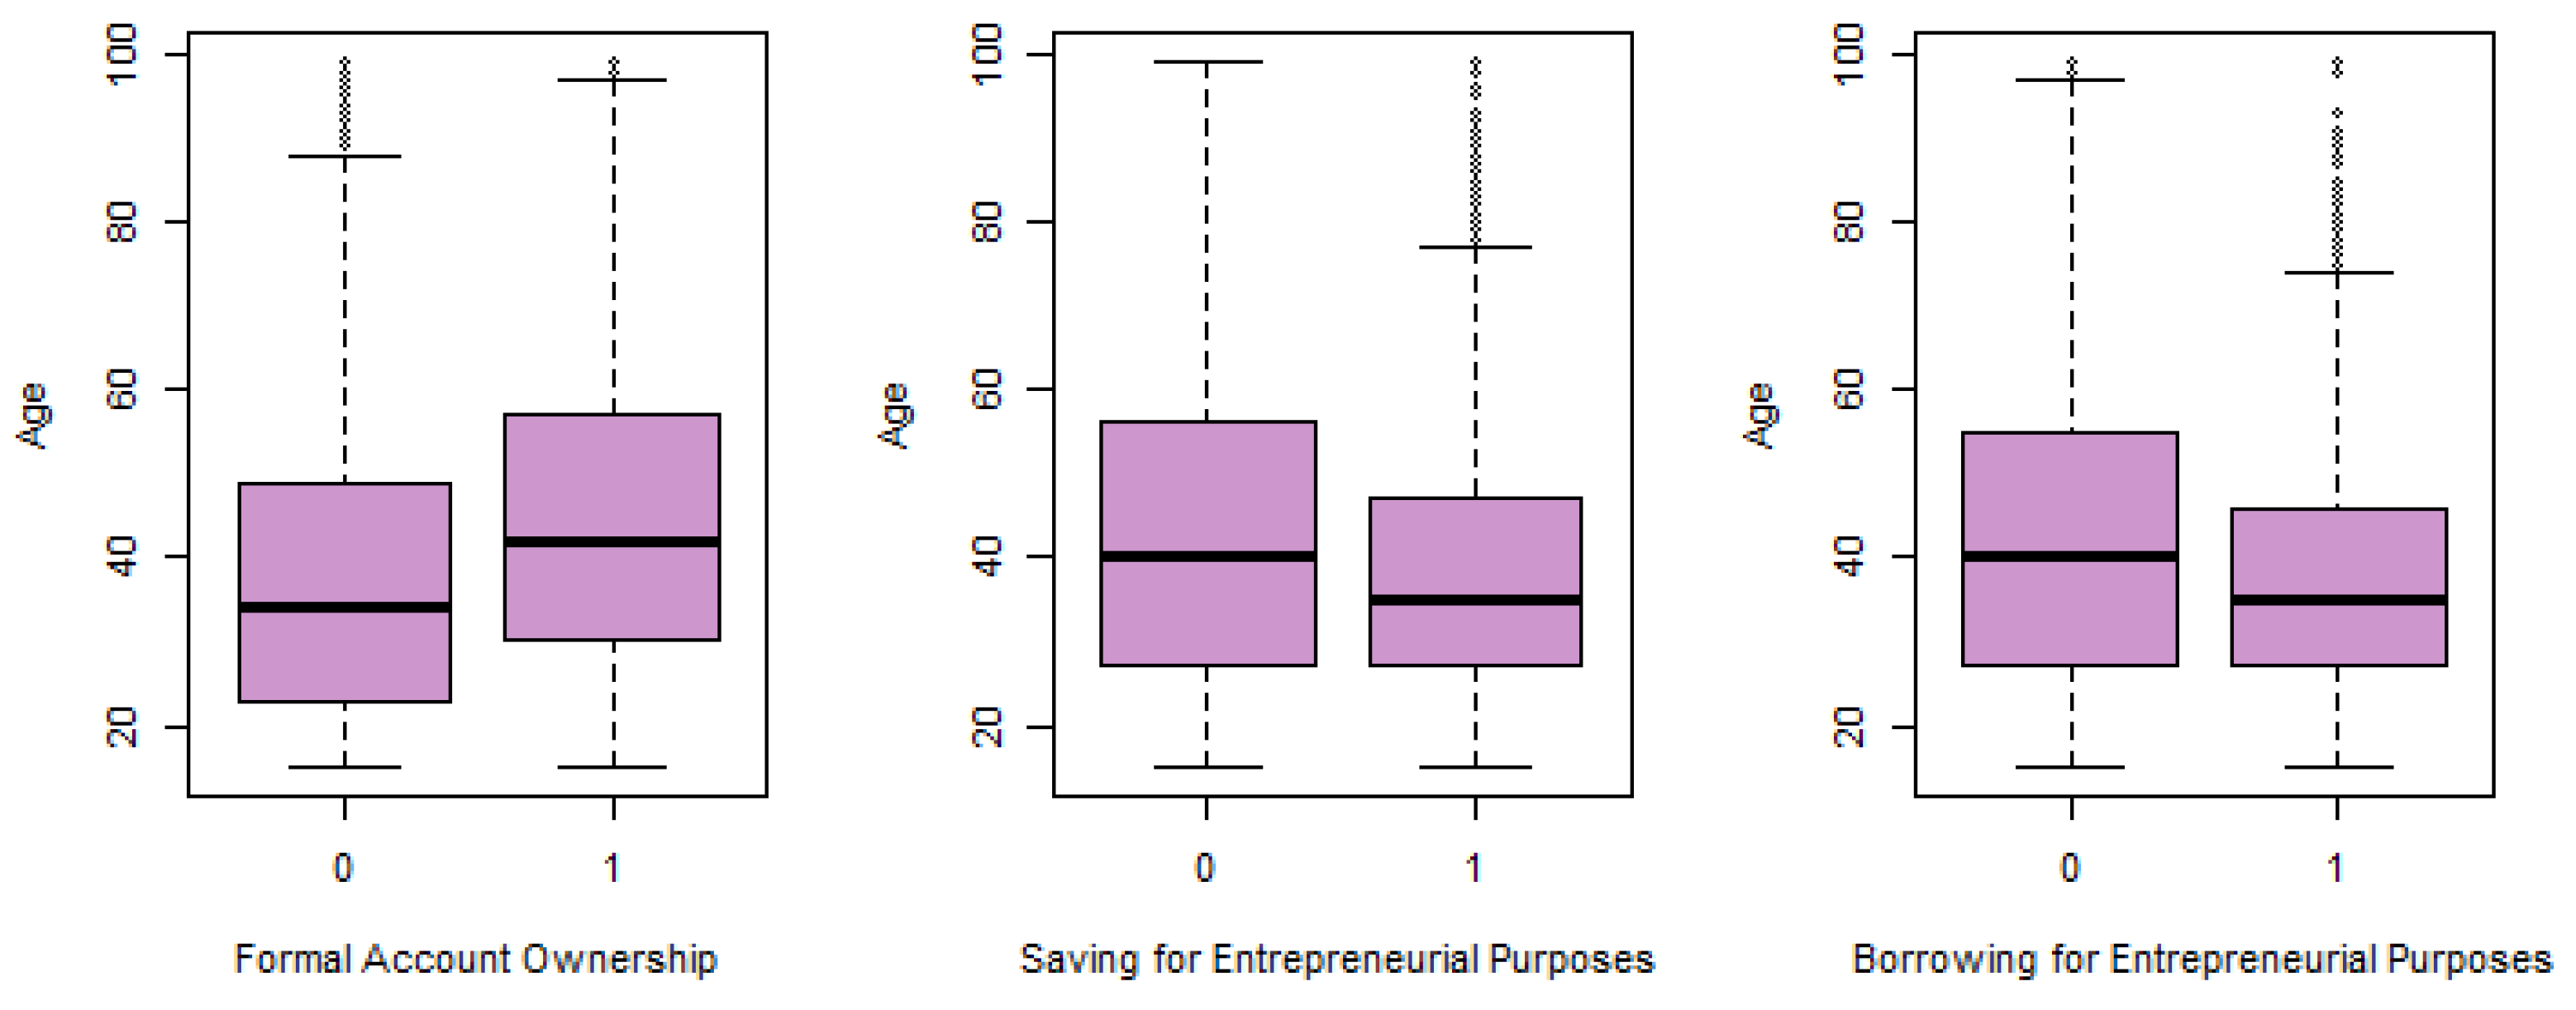
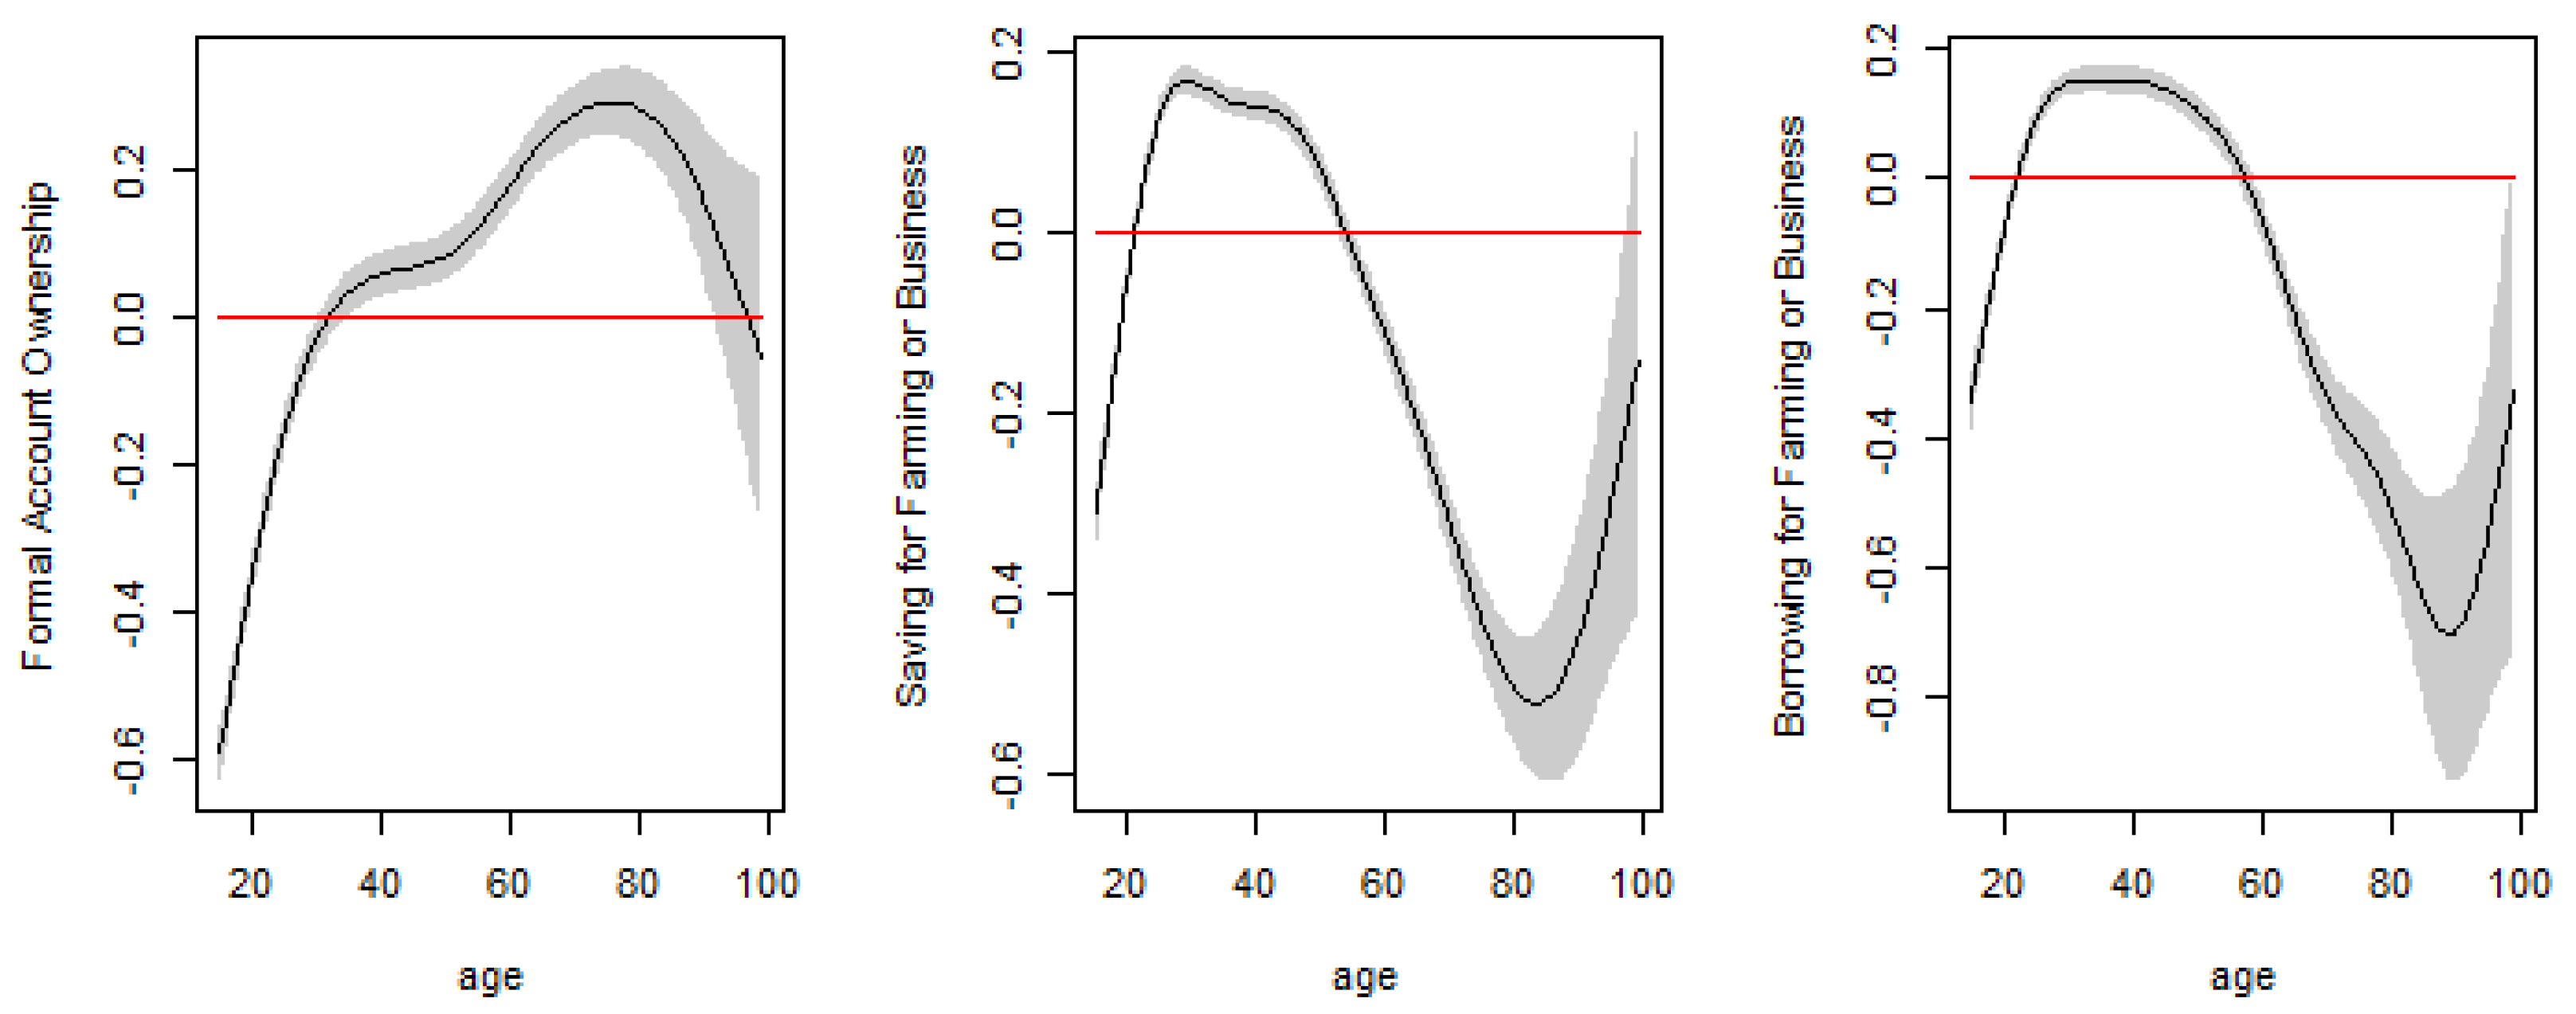
4.3.2. Test of “Age” Association with the Three GEFM Outcome Indicators

To characterize the relationship between the quantitative predictor “age” and the three outcome indicators of the GEFM, Levine’s test of variance homogeneity is first implemented as shown in Table A4. The Welch t-test is then implemented to assess the differences in means across age groups (see Table A5).
Starting with formal account ownership, as shown in the top panel of Table A4, Levine’s test with p-value < 1.69 × 10⁻¹² suggests the variance of age among the group of individuals with a formal account, differing significantly from that of those without formal accounts in the global economy. Similarly, as shown in the middle panel of Table A4, the p-value < 2.2 × 10⁻¹⁶ suggests unequal age variance between the group of individuals with entrepreneurial savings and the group of those without such savings in the global economy. Moreover, as shown in the lower panel of Table A4, the p-value < 2.2 × 10⁻¹⁶ further suggests unequal age variance between the group of respondents with entrepreneurial borrowings and the group of those without such borrowings in the global economy.
The implications of the above-described findings are that each Welch’s t-test can be implemented under the reasonable assumption of unequal age groups’ variances. Table A5 presents these results and suggests a higher mean age of responding formal account owners (44.38 years) than that of non-owners (37.42 years) in the global economy, based on the 95% confidence interval (C.I.) (−6.189; −5.888), which is void of zero.
Similar findings are also observed for the remaining two GEFM outcome indicators in their relationship with age, as shown in the middle and lower panels of Table A5. Indeed, in the middle panel, it can be noted based on the 95% C.I. (4.701; 5.043), that respondents with entrepreneurial savings in the global economy have significantly lower mean age (37.68 years) than their counterparts without entrepreneurial savings (42.55 years).
It can also be noted in the lower panel that respondents’ entrepreneurial borrowings in the global economy have a significantly lower age (37.48 years) than their counterparts without entrepreneurial borrowings (42.15 years), given the 95% C.I. of (4.446; 4.891). These numerical findings are consistent with the boxplot results in Figure 5 below, which summarize the distribution of age across the various groups. Overall, these latter findings suggest that globally, while older respondents exhibit relatively more account ownership, relatively younger respondents appear to both save and borrow more for entrepreneurial purposes in the global economy.

4.4. Conditional Probability Models’ Findings and Sensitivity Analysis

The trust region iteration algorithm provided through the R library “GJRM” [41] is used to identify the parameters of the joint conditional distribution of formal account ownership, saving, and borrowing for entrepreneurial ventures, within the global economy. For empirical model robustness checks, the results of the fully parametric and semi-parametric specifications are compared. The results are summarized in Table A6.
Contrasting the performances of the parametric and semi-parametric estimators, using the model performance indicators at the bottom of Table A6, it can be noted based on the largest absolute gradients and eigenvalue range that both show successful convergence. In addition, the statistically significant correlation coefficients θ ^ A S ,   θ ^ A B , and θ ^ S B (based on their corresponding 95% C.I. which are all void of zero), for both the parametric and semi-parametric estimators, confirm the joint inter-relationship between formal account ownership, entrepreneurial saving, and entrepreneurial borrowing in the global economy. This latter finding supports the assumed endogeneity of formal account ownership, and as such, the “joint trivariate probit” representation of the global entrepreneurial finance market (with its defined three subprocesses), is more appropriate than the individual “independent binary probit” representations, which fail to account for such inter-dependence in the global economic system. This finding further shows empirical support for the endogenous financial intermediation hypothesis over its exogenous counterpart as presented in the theoretical discussion in Section 2.
Turning now to the AIC and BIC performance indicators, Table A6 shows that the semi-parametric estimator, with its relatively smaller values of (AIC = 363,063.5 and BIC = 368,522.4) than its fully parametric counterpart with (AIC = 363,667.3 and BIC = 368,942), has better in-sample performance. In addition to relaxing the independence assumption of the individual binary models, the semi-parametric model also relaxes the linearity assumption of the fully parametric trivariate probit specification and is thus preferred as a more general representation of the GEFM.
Figure 6 shows the plots of the smooth functions representing the effects of “age” on the likelihood of formal account ownership, entrepreneurial saving, and entrepreneurial borrowing in the global economy. Table A6 shows the corresponding estimated density functions (edfs) to be 7.03, 8.12, and 8.69 for the three subprocesses of formal account ownership, entrepreneurial saving, and entrepreneurial borrowing respectively. Since their p-values are all below the 0.1% significance level, significant nonlinear effects exist between age and formal account ownership, entrepreneurial saving, and entrepreneurial borrowing in the global economy. The plots in Figure 6 further validates this conclusion, by depicting a non-linear, somewhat quadratic age effect on formal account ownership, while its effects on entrepreneurial saving and entrepreneurial borrowing appear both cubic.
Indeed, in its global domain defined between 20 to 100 years, the left panel in Figure 6 suggests that age has a negative but increasing marginal effect on the conditional likelihood of formal account ownership for ages between 20 and 30. For age between 30 and 75, the marginal effect of age on this conditional likelihood is positive and increasing overall, although a relatively sharper increase is observed after age 45. Beyond age 75, however, despite being positive, a decreasing marginal effect of age is observed in the global economy. On the other hand, as shown by the middle panel in Figure 6, the marginal impact of age on the conditional likelihood of entrepreneurial saving is negative but increasing for ages below 25. This effect appears positive and quadratic between 25 and 55 years, reaching a maximum at around 35 years. It is then negative and decreasing between ages 55 to 80, but starts increasing thereafter, although remains negative. A similar cubic pattern is observed from the right panel of Figure 6, where the marginal impact of age on the conditional likelihood of entrepreneurial saving is quadratic for ages between 20 and 60. This effect of age appears negative and decreases for ages between 60 and 90, but starts increasing thereafter.
Furthermore, it can be noted from both the parametric and semi-parametric results in Table A6, that the effects estimated for the factors (GovTransf12M, and WagPaiRec12M) of main interest in this study, have fairly stable signs, magnitudes, and significances across all three global entrepreneurial finance market outcome indicators (Account_fin; SavFarmBusPurp12M; BorwFarmBusPurp12M), suggesting the robustness of our findings.
Focusing, for example, on the effects of public and private sector financial injections, Table A6 shows that, globally, individuals with electronic welfare report over the previous 12 months that they are 69.2% more likely to formally own an account with a financial institution, 10.1% more likely to save for entrepreneurial purposes, and 14.3% more likely to borrow for entrepreneurial reasons. Similarly, individuals with electronic wage receipts from employers in the private sector of the global economy are 39.4% more likely to formally own an account with a financial institution but 7.1% less likely to save for entrepreneurial purposes and are 12.2% less likely to borrow for entrepreneurial reasons. Together, the above findings show that contrary to our theoretical predictions in Section 2, private sector financial injections appear to exert an adverse effect on the global entrepreneurial finance market (GEFM), while public sector financial injections in agreement with theoretical predictions in Section 2 significantly contribute to the growth of the GEFM.
Turning our attention to the remaining control factors, it can be noted also from Table A6 that globally, individuals with emergency fund access are 22.2% more likely to own a formal account, 36.6% more likely to save for entrepreneurial purposes, and 13.1% more likely to borrow for entrepreneurial reasons. Similarly, individuals owning a debit card are 2.60 times more likely to formally own an account with a financial institution and have a 18.7% greater likelihood of saving for entrepreneurial purposes, and an 11.5% greater likelihood of borrowing for entrepreneurial reasons. Similarly, those individuals with credit card ownership appear 70.1% more likely to formally own an account with a financial institution and are 15.5% more likely to save for entrepreneurial purposes, and 20.5% more likely to borrow for entrepreneurial reasons. Those reporting to have had digital purchases over the 12 months prior to the data collection are 31.5% more likely to show formal account ownership with a financial institution and are 35.5% and 21.4% more likely to save and borrow, respectively, for entrepreneurial reasons. The above findings suggest that an overall access enabled environment to financial products and services contributes significantly to the growth of the GEFM.
The socioeconomic and demographic influences on the GEFM outcomes are also shown in Table A4. It can be noted that globally, compared to their male counterparts, females are 7% more likely to formally own an account with a financial institution and 23.4% more likely to save for entrepreneurial purposes, while being 18.8% more likely to borrow for entrepreneurial reasons, hence suggesting their greater potential to stimulate global economic growth through their entrepreneurial activities.
On the impact of education, a positive and significant influence is noted on formal account ownership and a significant negative influence on entrepreneurial borrowing but no significant influence on entrepreneurial saving globally. Indeed, compared to individuals with primary education, those with secondary and at least tertiary educations are, respectively, 24.9% and 47.8% more likely to own an account with a financial institution but, respectively, 7.7% and 15.9% less likely to borrow for entrepreneurial purposes. Therefore, increased levels of education appear to raise the likelihood of formal financial inclusion in the global economy, but has no significant impact on the global entrepreneurial finance supply, while adversely affecting the global entrepreneurial finance demand.
The estimated effects of income suggest increasing, nonlinear, positive marginal impacts on formal account ownership and saving for entrepreneurial purposes in the global economy. However, it appears to have no significant impact on individuals’ entrepreneurial borrowing decisions. In fact, compared to respondents in the lowest income quintile, individuals in the second, middle, fourth, and richest income quintiles are respectively 5.2%, 12.6%, 16.3%, and 25.8% more likely to own an account with a financial institution. Similarly, but at the exception of those in the second income quintile, individuals in the middle, fourth, and richest income quintiles are, respectively, 4.1%, 10.4%, and 17.6% more likely to save for entrepreneurial purposes. Together, these findings suggest that increased individual income levels have no significant impact on the global entrepreneurial finance demand but significantly increases the global entrepreneurial finance supply, along with the likelihood of formal financial inclusion in the global economy.
Finally, the estimated year fixed effects in Table A4 show a consistent reduction in the conditional likelihood of formal account ownership, saving and borrowing for entrepreneurial purposes, in the global economy, overtime. Indeed, between 2014 and 2017 the conditional likelihood of formal account ownership decreased by 4.9%, that of entrepreneurial saving decreased by 12%, while that of entrepreneurial borrowing decreased by 11.2%. These latter findings suggest a potential global recession in formal economic activities between 2014 and 2017, including a significant reduction in both supply and demand of entrepreneurial finance in the global economy.

4.5. Marginal Effects Results of the GEFM Dynamics

The marginal effects of the included GEFM predictors in the study are summarized in Table A7. In line with the empirical model validation results in Section 4.3, the identified predictors of the utility (where “utility” is a measure of the satisfaction that economic agents derive from the choices they make; therefore, “total utility” is the total satisfaction each individual derives from formal account ownership, entrepreneurial saving, and entrepreneurial borrowing, globally. “Marginal Utility” is thus the difference in total satisfaction each individual derives by moving to a state of formal account ownership, entrepreneurial saving, and entrepreneurial borrowing in the global economy) function in Equations (14)–(16) show consistent marginal effects on the utilities of formal account ownership, saving, and borrowing for entrepreneurial purposes.

4.5.1. Public Sector and Private Sector Financial Injections and the GEFM

Results of the two predictors of primary interest in Table A7, show that government transfers to individuals raise their marginal utilities from formal account ownership, entrepreneurial saving, and entrepreneurial borrowing by 7.7%, 2%, and 1.4%, respectively. Conversely, private sector financial injections in the form of electronic wage deposits raise the marginal utilities from formal account ownership by 6.5%, through reducing the marginal utilities of both saving and borrowing for entrepreneurial purposes by 1.6% and 1.3%, respectively.

4.5.2. The Impact of the Control Factors on the GEFM

The marginal effects of the control factors are also shown in Table A7. For example, individuals with reported access to emergency funds show 3.8% higher marginal utility (MU) from formal account ownership, and, respectively, 7% and 1.1% higher MU from saving and borrowing for entrepreneurial purposes than those not reporting such access to emergency funds. Similarly, respondents with access to a debit card show, respectively, 45.1%, 3.8%, and 0.8% higher MU from formal account ownership, saving, and borrowing for entrepreneurial purposes; meanwhile, those with access to a credit card show 8.6%, 3.3%, and 2% higher MU respectively in the global economy.
With respect to gender, Table A7 shows that females have 0.8%, 4.6%, and 1.6% higher MU from formal account ownership, saving, and borrowing for entrepreneurial purposes than their male counterparts. The marginal effects of education show that, compared to individuals with primary education, those with secondary and at least tertiary education have, respectively, 4.5% and 6.8% higher MUs from formal account ownership. In the case of saving for entrepreneurial purposes, though the relative effect of secondary education is not significant, individuals with tertiary education or more show 0.6% higher MU from entrepreneurial finance supply compared to individuals with primary education. With regards to borrowing for entrepreneurial purposes however, Table A7 shows that individuals with secondary education and those with at least a tertiary education have, respectively, 0.6% and 1.2% lower MU from entrepreneurial finance demand than their counterparts with primary education in the global economy.
The marginal effect of income shows a significant positive and increasing impact on the utilities of formal account ownership and saving for entrepreneurial purposes, while having no significant impact on the utilities from entrepreneurial fund borrowing. The marginal utility of time as captured by the year fixed effect shows, respectively, 0.9%, 2.3%, and 0.9% lower MU from formal account ownership, saving, and borrowing for entrepreneurial purposes globally, in 2017 compared to 2014.
Age does appear to have a significant nonlinear effect with its direct marginal utility contribution consistently positive at 0.5%, 0.7% and 0.4% respectively for formal account ownership, saving, and borrowing for entrepreneurial purposes in the global economy. Its quadratic effects, on the other hand, although relatively smaller than the direct effects, are consistently negative and significant for all three GEFM indicators. The effect of the exclusion restriction, which at the methodological level aimed to improve the mixing properties of the trust region iteration algorithm, shows a 9.7% higher MU from entrepreneurial finance demand, for individuals with home, apartment, or land loan in the global economy.

5. Discussion

While the ongoing entrepreneurial finance literature has thus far mostly adopted a business perspective, allowing researchers to address important micro-economic questions, it has left key unanswered macro-economic ones of potential relevance to entrepreneurial finance market stakeholders. Among other things, the existing literature addresses governments’ direct involvement with the supply of entrepreneurial funds in the form of policy schemes, including subsidized loans and loan guaranties [4]. However, the indirect effect of government financial stimulations through its welfare programs on individual entrepreneurial intentions in society remains largely unknown, similarly for the indirect effects of financial wage transfers from private sector enterprises. This paper therefore further extended the existing body of knowledge by adopting a rather aggregated perspective to analyze important dynamics in a globalized entrepreneurial finance market context. In doing so, the emphasis was put on the potential influences that financial injections from governments and private sector enterprises exert on the equilibrium properties of the global entrepreneurial finance market.
Among the key findings, it transpired that, contrary to theoretical predictions, private sector financial injections (in the form of individuals’ salary or wage receipts from employment) exert an adverse effect on both the global entrepreneurial finance supply (as the global collection of savings for farming or business entrepreneurship purposes) and global entrepreneurial finance demand (as the global collection of borrowings for farming or business entrepreneurship purposes). On the other hand, public sector financial injections, (e.g., unemployment benefits, educational, medical, or any other social payments), in agreement with theory predictions, significantly contribute to the growth of the global entrepreneurial finance market.
The counter cyclical effect of private sector financial injections on the GEFM may be potentially explained by the fact that entrepreneurial intention, especially in its relation to agriculture or small business ventures, is typically higher in society when the existing labor market (inclusive of established public and private enterprises) is unable to absorb the available labor force [14,17,43]. The opposite is then observed when much of the labor force is already absorbed by existing established enterprises, which wage payments allow individuals to satisfy their wants without the potential need to undertake additional entrepreneurial ventures to supplement their income [44]. Indeed, as Figure A3 and Figure A4 in the Appendix B show that, globally, saving and borrowing for entrepreneurial purposes does appear to be more prevalent in the developing world, much of which in Africa and Asia where unemployment rates are typically relatively higher [45].
In times of global uncertainty, such as that imposed upon the world by the ongoing COVID-19 crises and its adverse socioeconomic impacts [46], the above mentioned indirect influences of governments’ and private enterprises’ financial transfers on individuals’ entrepreneurial intensions in the global economy are just as relevant and critical as the direct support policy schemes for entrepreneurial ventures [47]. Since the resulting rise in global unemployment is socially unsustainable [48], individual welfare recipients and other salary recipients in this global context would have to think innovatively to undertake income-generating activities for livelihood supports.
Though in recent years the advocacy for formal financial inclusion has been felt at both policy (nationally and internationally) and academic levels due to its effect on inclusive growth and sustainable development [49], our findings show that formal education does contribute significantly to the likelihood of this outcome in the global economy. However, formal education appears to not significantly influence global entrepreneurial supply, while adversely impacting the global entrepreneurial demand. This latter adverse effect on entrepreneurial finance demand could be potentially explained by the fact that individuals with secondary or at least tertiary education levels are better able to enter the formal labor market, securing employment from already established business enterprises, thereby reducing their need for funding to undertake an entrepreneurial venture [44].
Conversely, individuals with natural entrepreneurial spirits often fail to undertake much schooling, as they perceive the formal educational system to not meet their learning needs, while individuals with a low level of education and potentially no initial entrepreneurial drive might feel compelled to resort to entrepreneurship to support their livelihood, especially in times of limited labor market opportunities and high unemployment [15,16]. These latter findings seem to further suggest a potential need for formal education curricula to properly address the art and science of entrepreneurship, to allow graduates to globally develop entrepreneurial mindsets [45].
Furthermore, on the issue of female entrepreneurship, our findings showed that globally, compared to their male counterparts, females are more likely to own a formal account with a financial institution and are also more likely to save and borrow for entrepreneurial (farming or business) purposes. These results align with those reported in the Australian context, where [23] revealed agricultural SMEs with growth intentions and clear business plans to be more likely to seek bank financing compared to their counterparts that are export oriented, with incremental product innovation strategy, and of male CEOs. The results are also in line with the latest report on women entrepreneurship by the Global Entrepreneurship Monitor [50], which shows 231 million businesses lunched or operated by women between 2018 and 2019, across 59 economies. Moreover, they corroborate [51,52,53,54], in suggesting the relative potential of women to contribute to the growth of the GEFM.
Finally, though the data remains rich enough to allow for the reported spatial and temporal findings on the topic of entrepreneurial financing as a global economic phenomenon, one key limitation imposed by the retrospective design of the study is the researcher’s inability to get more current data to investigate the market dynamics within the ongoing context of the global COVID-19 pandemic. Nonetheless, as heterogeneous entrepreneurial finance market segments emerge in response to emerging technologies, including bloc chain, which allow for greater decentralization and interdependence between financial markets globally, the ability of these systems to carry out the vision of a globalized entrepreneurial finance market needs revisiting in a future study.

Funding

This research received no external funding.

Institutional Review Board Statement

The study was conducted in accordance with the Declaration of Helsinki. However, Ethical review and approval were not applicable due to the secondary nature of the raw data, which is anonymized and publically available from the World Bank micro-data library.

Informed Consent Statement

Not applicable, due to fully anonymized raw data usage.

Data Availability Statement

All relevant data and materials are available from the author upon reasonable request.

Acknowledgments

The author wishes to thank the World Bank for its initial collection and open sharing of the raw data used in this paper. The manuscript is submitted under the sole responsibility of the author. The opinions expressed and arguments employed herein are without prejudice to the status of or sovereignty over any territory, city, or area.

Conflicts of Interest

The author declares no conflict of interest.

Appendix A

Table A1. Study variables description.
VariableDescription
account_fin= 1 if an individual has a formal account with a financial institution; and 0 otherwise.
SavFarmBusPurp12M= 1 if an individual saved in the previous 12 months for Entrepreneurial (farming or business) purposes; and 0 otherwise.
BorwFarmBusPurpos12M= 1 if an individual borrowed in the previous12 months for Entrepreneurial (farming or business) purposes; and 0 otherwise.
LoanFinInstHomAptLand= 1 if an individual has a pending loan from a financial institution to purchase a home, an apartment or a land; and 0 otherwise.
GovTransf12m= 1 if an individual reports any governmental support in the previous 12 months, for education, medication, unemployment, but non-inclusive of work related wages or salaries; and 0 otherwise.
WagPaiRec12m= 1 if an individual reports any salary or wage payment in the previous 12 months, from an employer, but non-inclusive of payments from clients or customers for doing work; and 0 otherwise.
EmerFundAces= 1 if an individual is able to come up with emergency funds, (defined as
5% of per-capita gross national income, within the next month); and 0 otherwise.
DebCard= 1 if an individual has an automated tailor machine debit card; and 0 otherwise.
CredCard= 1 if an individual has a credit card; and 0 otherwise.
InterntBasdPaymt= 1 if an individual has made online payments in the previous 12 months, using a computer, mobile phone, or any other devices; and 0 otherwise.
educEducation Level (1 if at most primary, 2 if secondary, and 3 if at least tertiary).
inc_qIncome quintile, based on pre-tax household income; inclusive of wages, salaries, remittances, and farming income.
female= 1 if an individual of female gender; and 0 if male gender.
ageIndividual’s Age measured in years.
yearData collection period (one of 2014 or 2017).
economy2Country of residency (one of 153 nations-see Figure A1)
wgtCountry level final weight of each individual in the sample.
Source: Author’s own construction using the global financial inclusion surveys (2014 and 2017).
Table A2. Quantitative summary description of the study variables.
Quantitative
Factors
UnitsPooled (2014 + 2017) Sample
(N = 224,677)
MeanStandard Deviation
Sampling Weight (wgt)-0.9850.658
AGE(in years)41.8317.53
Qualitative FactorslevelsAbsolute FrequencyRelative Frequency (%)
YEAR1: 2017140,53362.55
0: 201484,14437.45
account_fin 1: Yes142,08563.24
0: No82,59236.76
SavFarmBusPurp12M1: Yes33,48614.90
0: No191,19185.10
BorwFarmBusPurpos12M1: Yes15,7086.99
0: No208,96993.01
LoanFinInstHomAptLand 1: Yes34,03415.15
0: No190,64384.85
GovTransf12M1: Yes33,39214.86
0: No191,28585.14
WagPaiRec12M1: Yes86,03538.29
0: No138,64261.71
EmerFundAcess1: Yes124,86855.58
0: No99,80944.42
DEBITCARD1: Yes108,52648.30
0: No116,15151.70
CREDITCARD1: Yes50,56322.50
0: No174,11477.50
InterntBasdPaymt1: Yes59,66426.56
0: No165,01373.44
FEMALE1: Yes107,14447.69
0: No117,53352.31
EDUCATION1: At most Primary68,41330.45
2: Secondary 114,09650.78
3: At least Tertiary42,16818.77
INCOME
QUINTILE
1: Lowest 20%32,99314.68
2: Second 20%37,78616.82
3: Middle 20%42,98119.13
4: Fourth 20%49,38621.98
5: Highest 20% 61,53127.39
Source: Author’s own construction using the global financial inclusion surveys (2014 and 2017).
Table A3. Chi-square test of Independence between the nominal predictors and formal account ownership, Entrepreneurial saving and Entrepreneurial borrowing over the previous 12 months.
Whole Sample
(N = 224,677)
CategoriesChi2 Test
Account_finSavFarmBusPurp12MBorwFarmBusPurpos12M
X-Statp-ValueX-Statp-ValueX-Statp-Value
GovTransf12M1: Yes8181.9 < 2.2 × 10⁻¹⁶ ***27.7411.387 × 10−7 ***4.38730.03621 *
0: No
WagPaiRec12M1: Yes24,083 < 2.2 × 10⁻¹⁶ ***260.26 < 2.2 × 10⁻¹⁶ ***49.0562.487 × 10−12 ***
0: No
EmerFundAcess1: Yes12,778 < 2.2 × 10⁻¹⁶ ***2790.9 < 2.2 × 10⁻¹⁶ ***103.33 < 2.2 × 10⁻¹⁶ ***
0: No
DEBITCARD1: Yes117,140 < 2.2 × 10⁻¹⁶ ***295.36 < 2.2 × 10⁻¹⁶ ***232.48 < 2.2 × 10⁻¹⁶ ***
0: No
CREDITCARD1: Yes33,094 < 2.2 × 10⁻¹⁶ ***325.35 < 2.2 × 10⁻¹⁶ ***8.895 0.002859 **
0: No
InterntBasdPaymt1: Yes32,506 < 2.2 × 10⁻¹⁶ ***987.05 < 2.2 × 10⁻¹⁶ ***26.1233.203 × 10−07 ***
0: No
FEMALE1: Yes1000.7 < 2.2 × 10⁻¹⁶ ***1848.2 < 2.2 × 10⁻¹⁶ ***532.16 < 2.2 × 10⁻¹⁶ ***
0: No
EDUCATION1: At most Primary 32,086 < 2.2 × 10⁻¹⁶ *** 275.97 < 2.2 × 10⁻¹⁶ *** 358.55 < 2.2 × 10⁻¹⁶ ***
2: Secondary
3: At least Tertiary
INCOMEQUINTILE1: Lowest 20% 5074.9 < 2.2 × 10⁻¹⁶ *** 2165.1 < 2.2 × 10⁻¹⁶ *** 198.57 < 2.2 × 10⁻¹⁶ ***
2: Second 20%
3: Middle 20%
4: Fourth 20%
5: Highest 20%
YEAR2014696.93 < 2.2 × 10⁻¹⁶ ***65.778 5.047 × 10⁻¹⁶ ***38.647 5.078 × 10⁻¹⁰ ***
2017
ECONOMY2153 factor levels
(country fixed effects)
77,016 < 2.2 × 10⁻¹⁶ ***11,507 < 2.2 × 10⁻¹⁶ ***9423.5 < 2.2 × 10⁻¹⁶ ***
LoanFinInstHomAptLand1: Yes12,840 < 2.2 × 10⁻¹⁶ ***1000.3 < 2.2 × 10⁻¹⁶ ***3209.7 < 2.2 × 10⁻¹⁶ ***
0: No
* indicates 0.05 significance; ** significance at 0.01; *** significance at 0.001 for the chi-square tests. Source: Author’s own construction using the global financial inclusion surveys (2014 and 2017).
Table A4. Levine’s Test for homogeneity in groups’ variances in the model with formal account ownership, saving and borrowing for Entrepreneurial (Farming or Business) purposes.
Age
Account_finDegree of freedom1
F-statistic49.822
p-value1.688 × 10−12 ***
SavFarmBusPurp12MDegree of freedom1
F-statistic4266.3
p-value < 2.2 × 10⁻¹⁶ ***
BorwFarmBusPurpos12MDegree of freedom1
F-statistic2540.4
p-value < 2.2 × 10⁻¹⁶ ***
*** significance at 0.001 for Levine’s tests. Ho: Equal age variance between respondents with “formal account” and those without V.S. Ha: Unequal variance; Ho: Equal age variance between respondents with “Entrepreneurial Savings” and those without V.S. Ha: Unequal variance between the two groups; Ho: Equal age variance between respondents with “Entrepreneurial Borrowings” and those without V.S. Ha: Unequal variance between the two groups. Source: Author’s own construction using the global financial inclusion surveys (2014 and 2017).
Table A5. Welch two-sample t-test of difference in groups’ means, with corresponding 95% confidence interval (C.I.) for the model with formal account ownership, Entrepreneurial saving and Entrepreneurial borrowing globally.
Age
Account_finGroup Mean ValuesNo37.42
Yes44.38
Difference in group means
C. I. on the Difference in group means
p-value
−6.04
(−6.189; −5.888)
<2.2 × 10⁻¹⁶ ***
SavFarmBusPurp12MGroup Mean ValuesNo42.55
Yes37.68
Difference in group means
C. I. on the Difference in group means
p-value
4.87
(4.701; 5.043)
<2.2 × 10⁻¹⁶ ***
BorwFarmBusPurpos12MGroup Mean ValuesNo42.15
Yes37.48
Difference in group means
C. I. on the Difference in group means
p-value
4.67
(4.446; 4.891)
<2.2 × 10⁻¹⁶ ***
*** significance at 0.001 for Levine’s tests. Source: Author’s own construction using the global financial inclusion surveys (2014 and 2017).
Table A6. Demand side determinants of the conditional probabilities of individuals’ joint likelihood of formal account ownership, saving and borrowing for Entrepreneurial (Farming or Business) purposes.
N = 224,677Fully-Parametric SpecificationSemi-Parametric Specification
Account_finSavFarmBus
Purp12M
BorwFarmBusPurpos12MAccount_finSavFarmBus
Purp12M
BorwFarmBusPurpos12M
(INTERCEPT) −1.486 ***
(0.091)
−2.621 ***
(0.048)
−3.384 ***
(0.074)
−0.558 ***
(0.088)
−2.028 ***
(0.044)
−2.619 ***
(0.067)
GovTransf12M1: Yes0.696 ***
(0.014)
0.103 ***
(0.011)
0.144 ***
(0.013)
0.692 ***
(0.014)
0.101 ***
(0.011)
0.143 ***
(0.013)
WagPaiRec12M1: Yes0.403 ***
(0.010)
−0.060 ***
(0.008)
−0.114 **
(0.010)
0.394 ***
(0.010)
−0.071 ***
(0.008)
−0.122 ***
(0.010)
EmerFundAcess1: Yes0.223 ***
(0.009)
0.367 ***
(0.008)
0.131 ***
(0.010)
0.222 ***
(0.009)
0.366 ***
(0.008)
0.131 ***
(0.010)
DEBITCARD1: Yes2.602 ***
(0.016)
0.199 ***
(0.010)
0.123 ***
(0.012)
2.596 ***
(0.016)
0.187 ***
(0.010)
0.115 ***
(0.013)
CREDITCARD 1: Yes0.705 ***
(0.022)
0.153 ***
(0.011)
0.203 ***
(0.014)
0.701 ***
(0.023)
0.155 ***
(0.011)
0.205 ***
(0.014)
InterntBasdPaymt1: Yes0.313 ***
(0.016)
0.358 ***
(0.010)
0.218 ***
(0.014)
0.315 ***
(0.016)
0.355 ***
(0.010)
0.214 ***
(0.014)
FEMALE1: Yes0.066 ***
(0009)
0.230 ***
(0.007)
0.185 ***
(0.009)
0.070 ***
(0.009)
0.234 ***
(0.007)
0.188 ***
(0.009)
EDUCATION2: Secondary 0.254 ***
(0.010)
0.007
(0.009)
−0.072 ***
(0.012)
0.249 ***
(0.010)
0.001
(0.009)
−0.077 ***
(0.012)
3: At least Tertiary0.506 ***
(0.019)
0.025 *
(0.013)
−0.143 ***
(0.017)
0.478 ***
(0.019)
0.003
(0.013)
−0.159 ***
(0.017)
INCOME QUINTILE2: Second 20%0.052 ***
(0.013)
0.016
(0.012)
0.011
(0.015)
0.052 ***
(0.013)
0.016
(0.012)
0.011
(0.015)
3: Middle 20%0.125 ***
(0.013)
0.041 ***
(0.012)
0.008
(0.015)
0.126 ***
(0.013)
0.041 ***
(0.012)
0.001
(0.015)
4: Fourth 20%0.162 ***
(0.013)
0.104 ***
(0.012)
0.004
(0.015)
0.163 ***
(0.014)
0.104 ***
(0.012)
0.004
(0.015)
5: Highest 20%0.255 ***
(0.014)
0.174 ***
(0.012)
0.002
(0.015)
0.258 ***
(0.014)
0.176 ***
(0.012)
0.018
(0.015)
YEAR2017−0.051 ***
(0.009)
−0.122 ***
(0.008)
−0.090 ***
(0.010)
−0.049 ***
(0.010)
−0.120 ***
(0.008)
−0.112 ***
(0.010)
AGE0.034 ***
(0.001)
−0.036 ***
(0.001)
0.044 ***
(0.002)
p - val
<2 × 10⁻¹⁶ ***
(edf = 7.03)
p - val
<2 × 10⁻¹⁶ ***
(edf = 8.12)
p - val  
<2 × 10⁻¹⁶ ***
(edf = 8.69)
AGE Square−0.0003 ***
(0.00001)
−0.0005 ***
(0.00001)
−0.0005 ***
(0.00002)
---
LoanFinInstHomAptLand1: Yes--0.631 ***
(0.012)
--0.631 ***
(0.012)
θ ^ A S   0.203 *
(0.194, 0.216)
0.201 *
(0.187, 0.211)
θ ^ A B   0.193 *
(0.178, 0.206)
0.191 *
(0.176, 0.206)
θ ^ S B   0.514 *
(0.504, 0.522)
0.513 *
(0.503, 0.521)
AIC363,667.3
363,063.5
BIC368,942368,522.4
Numbers in parenthesis are respectively: the standard error (s.e.) of the coefficients, and the 95% C.I. on the correlation coefficients. * indicates 0.05 significance; ** significance at 0.01; *** significance at 0.001. Source: Author’s own construction using the global financial inclusion surveys (2014 and 2017).
Table A7. Marginal Effects of Demand side determinants of formal account ownership, saving and borrowing for Entrepreneurial (Farming or Business) purposes.
VariablesAccount_finSavFarmBusPurp12MBorwFarmBusPurpos12M
d F d x
(s.e.)
d F d x
(s.e.)
d F d x
(s.e.)
GovTransf12M1: Yes0.077 ***
(0.0018)
0.020 ***
(0.0022)
0.014 ***
(0.0014)
WagPaiRec12M1: Yes0.065 ***
(0.0018)
−0.016 ***
(0.0016)
−0.013 ***
(0.0008)
EmerFundAcess1: Yes0.038 ***
(0.0016)
0.070 ***
(0.0015)
0.011 ***
(0.0008)
DEBITCARD 1: Yes0.451 ***
(0.0044)
0.038 ***
(0.0019)
0.008 ***
(0.0011)
CREDITCARD 1: Yes0.086 ***
(0.0024)
0.033 ***
(0.0023)
0.020 ***
(0.0016)
InterntBasdPaymt1: Yes0.046 ***
(0.0022)
0.078 ***
(0.0025)
0.023 ***
(0.0015)
FEMALE1: Yes0.008 ***
(0.0014)
0.046 ***
(0.0014)
0.016 ***
(0.0008)
EDUCATION2: Secondary 0.045 ***
(0.0018)
0.003
(0.0019)
−0.006 ***
(0.0011)
3: At least Tertiary 0.068 ***
(0.0021)
0.006 *
(0.0026)
−0.012 ***
(0.0013)
INCOME
QUINTILE
2: Second 20%0.009 ***
(0.0021)
0.006 *
(0.0027)
0.001
(0.0015)
3: Middle 20%0.019 ***
(0.0020)
0.012 ***
(0.0026)
0.001
(0.0014)
4: Fourth 20%0.024 ***
(0.0020)
0.024 ***
(0.0027)
0.001
(0.0014)
5: Highest 20% 0.041 ***
(0.0020)
0.039 ***
(0.0027)
0.001
(0.0014)
YEAR2017−0.009 ***
(0.0015)
−0.023 ***
(0.0015)
−0.009 ***
(0.0010)
AGE 0.005 ***
(0.0002)
0.007 ***
(0.0002)
0.004 ***
(0.0002)
AGE Square −0.00004 ***
(0.000002)
−0.00009 ***
(0.000003)
−0.00005 ***
(0.000002)
LoanFinInstHomAptLand1: Yes--0.097 ***
(0.0022)
Numbers in parenthesis are respectively: the standard error (s.e.) of the coefficients. * indicates 0.05 significance; *** significance at 0.001. Source: Author’s own construction using the global financial inclusion surveys (2014 and 2017).

Appendix B

Figure A1. Global map of respondents’ absolute frequency count by country in the pooled sample (2014 and 2017). Source: Author’s own construction using the global financial inclusion surveys (2014 and 2017). (See dynamic web link at https://rpubs.com/brassbe1982/respondentCount_figb1 (accessed on 21 December 2021)).
Joitmc 08 00026 g0a1
Figure A2. Country level weighted proportion (percentage) of formal account owners between 2014 and 2017 globally. Source: Author’s own construction using the global financial inclusion surveys (2014 and 2017). (See dynamic web link at https://rpubs.com/brassbe1982/formalAccountOwn_figb2 (accessed on 21 December 2021)).
Joitmc 08 00026 g0a2
Figure A3. Country level weighted proportion of savers for entrepreneurial (farming or business) purposes between 2014 and 2017, globally. Source: Author’s own construction using the global financial inclusion surveys (2014 and 2017). (See dynamic web link at https://rpubs.com/brassbe1982/SavFarmBusPurp12M_figb3 (accessed on 21 December 2021)).
Joitmc 08 00026 g0a3
Figure A4. Country level weighted proportion of borrowers for entrepreneurial (farming or business) purposes between 2014 and 2017, globally. Source: Author’s own construction using the global financial inclusion surveys (2014 and 2017). (See dynamic web link at https://rpubs.com/brassbe1982/BorwFarmBusPurpos12M_fig4 (accessed on 21 December 2021)).
Joitmc 08 00026 g0a4

References

  1. Block, J.H.; Colombo, M.G.; Cumming, D.J.; Vismara, S. New players in entrepreneurial Finance and why they are there. Small Bus. Econ. 2018, 50, 239–250. [Google Scholar] [CrossRef] [Green Version]
  2. Klein, M.; Neitzert, F.; Hartmann-Wendels, T.; Kraus, S. Start-up Financing in the Digital Age–A Systematic Review and Comparison of New Forms of Financing. J. Entrep. Financ. 2020, 21, 46–98. [Google Scholar]
  3. Bellavitis, C.; Filatotchev, I.; Kamuriwo, D.S.; Vanacker, T. Entrepreneurial finance: New Frontiers of research and practice: Editorial for the special issue embracing entrepreneurial funding innovations. Ventur. Cap. 2017, 19, 16. [Google Scholar] [CrossRef] [Green Version]
  4. Bertoni, F.; Martí, J.; Reverte, C. The impact of government-supported participative loans on the growth of entrepreneurial ventures. Res. Policy 2019, 48, 371–384. [Google Scholar] [CrossRef]
  5. Cumming, D.; Groh, A.P. Entrepreneurial finance: Unifying themes and future directions. J. Corp. Finance 2018, 50, 538–555. [Google Scholar] [CrossRef]
  6. Nguyen, M.-H.; Pham, T.-H.; Ho, M.-T.; Nguyen, H.T.T.; Vuong, Q.-H. On the social and conceptual structure of the 50-year research landscape in entrepreneurial finance. SN Bus. Econ. 2020, 1, 29. [Google Scholar] [CrossRef]
  7. Salman, A.; Jamil, S. Entrepreneurial finance and its impact on e-business. Probl. Perspect. Manag. 2017, 15, 24–41. [Google Scholar] [CrossRef] [Green Version]
  8. Lindholm-Dahlstrand, Å.; Andersson, M.; Carlsson, B. Entrepreneuria experimentation: A Key function in systems of innovation. Small Bus. Econ. 2019, 3, 591–610. [Google Scholar] [CrossRef] [Green Version]
  9. Kohn, M. A loanable funds theory of unemployment and monetary disequilibrium. Am. Econ. Rev. 1981, 71, 859–879. [Google Scholar]
  10. Tsiang, S.C. Loanable Funds. In Money; Palgrave Macmillan: London, UK, 1989; pp. 190–194. [Google Scholar]
  11. Cavallo, E.; Eichengreen, B.; Panizza, U. Can Countries Rely on Foreign Saving for Investment and Economic Development? Rev. World Econ. 2018, 154, 277–306. [Google Scholar] [CrossRef] [Green Version]
  12. Niankara, I. Government and private sectors’ electronic transfer practices and financial inclusion in the economic community of the West African States. Int. J. Financ. Econ. 2020, 1–30. [Google Scholar] [CrossRef]
  13. Lambsdorff, J.G. Savings and investments—an old debate in times of trouble. J. Post Keynes. Econ. 2011, 33, 645–666. [Google Scholar] [CrossRef]
  14. Virick, M.; Basu, A.; Rogers, A. Antecedents of Entrepreneurial Intention among Laid-Off Individuals: A Cognitive Appraisal Approach. J. Small Bus. Manag. 2013, 53, 450–468. [Google Scholar] [CrossRef]
  15. Anjum, T.; Farrukh, M.; Heidler, P.; Díaz Tautiva, J.A. Entrepreneurial Intention: Creativity, Entrepreneurship, and University Support. J. Open Innov. Technol. Mark. Complex. 2021, 7, 13. [Google Scholar] [CrossRef]
  16. Agu, A.G.; Kalu, O.O.; Esi-Ubani, C.O.; Agu, P.C. Drivers of sustainable Entrepreneurial intentions among university students: An integrated model from a developing world context. Int. J. Sustain. High. Educ. 2021, 22, 659–680. [Google Scholar] [CrossRef]
  17. Soto-Simeone, A.; Kautonen, T. senior entrepreneurship following unemployment: A Social identity theory perspective. Rev. Manag. Sci. 2020, 15, 1683–1706. [Google Scholar] [CrossRef]
  18. Tenca, F.; Croce, A.; Ughetto, E. Business Angels Research in Entrepreneurial Finance: A Literature Review and a Research Agenda. J. Econ. Surv. 2018, 32, 1384–1413. [Google Scholar] [CrossRef]
  19. Mason, C.; Botelho, T.; Harrison, R. The changing nature of angel investing: Some research implications. Ventur. Cap. 2019, 21, 177–194. [Google Scholar] [CrossRef]
  20. Vincenzo, B.; Annalisa, C.; Elisa, U. Network dynamics in business angel group Investment decisions. J. Corp. Financ. 2020, 66, 101812. [Google Scholar]
  21. Cavallo, A.; Ghezzi, A.; Dell’Era, C.; Pellizzoni, E. Fostering digital entrepreneurship from startup to scaleup: The role of venture capital funds and angel groups. Technol. Forecast. Soc. Chang. 2019, 145, 24–35. [Google Scholar] [CrossRef]
  22. Lerner, J.; Nanda, R. Venture Capital’s Role in Financing Innovation: What We Know and How Much We Still Need to Learn. J. Econ. Perspect. 2020, 34, 237–261. [Google Scholar] [CrossRef]
  23. McCarthy, S.; Oliver, B.; Verreynne, M.-L. Bank financing and credit rationing of Australian SMEs. Aust. J. Manag. 2017, 42, 58–85. [Google Scholar] [CrossRef]
  24. Bedendo, M.; Siming, L. Bank financing and credit ratings. Appl. Econ. Lett. 2020, 27, 965–970. [Google Scholar] [CrossRef]
  25. Tykvová, T. Venture capital and private equity financing: An overview of recent literature and an agenda for future research. J. Bus. Econ. 2018, 88, 325–362. [Google Scholar] [CrossRef]
  26. Stulz, R.M. Public versus private equity. Oxf. Rev. Econ. Policy 2020, 36, 275–290. [Google Scholar] [CrossRef]
  27. Billah, M.S. Islamic Lease Financing (Al-Ijarah). In Islamic Financial Products; Palgrave Macmillan: Cham, Switzerland, 2019; pp. 227–241. [Google Scholar]
  28. Abdulkarim, U.F.; Mohammed, L.; Musa-Mubi, A. Lease Finance in Nigeria: Current Status, Challenges and Future Prospects. J. Account. Res. Organ. Econ. 2020, 3, 172–181. [Google Scholar] [CrossRef]
  29. Martínez-Sola, C.; García-Teruel, P.J.; Martínez-Solano, P. SMEs access to finance and the value of supplier financing. Span. J. Financ. Account./Rev. Esp. Financ. Contab. 2017, 46, 455–483. [Google Scholar] [CrossRef]
  30. Lin, Q.; Peng, Y.; Hu, Y. Supplier financing service decisions for a capital-constrained Supply chain: Trade credit vs. combined credit financing. J. Ind. Manag. Optim. 2020, 16, 1731–1752. [Google Scholar] [CrossRef]
  31. Munim, Z.H.; Shneor, R.; Adewumi, O.M.; Shakil, M.H. Determinants of crowdfunding Intention in a developing economy: Ex-ante evidence from Bangladesh. Int. J. Emerg. Mark. 2020, 16, 1105–1125. [Google Scholar] [CrossRef]
  32. De Crescenzo, V.; Botella-Carrubi, D.; García, M.R. Civic crowdfunding: A new Opportunity for local governments. J. Bus. Res. 2021, 123, 580–587. [Google Scholar] [CrossRef]
  33. Ackermann, E.; Bock, C.; Bürger, R. Democratising Entrepreneurial Finance: The Impact of Crowdfunding and Initial Coin Offerings (ICOs). In Contemporary Developments in Entrepreneurial Finance; Springer: Cham, Switzerland, 2020; pp. 277–308. [Google Scholar]
  34. Howell, S.T.; Niessner, M.; Yermack, D. Initial Coin Offerings: Financing Growth with Cryptocurrency Token Sales. Rev. Financial Stud. 2020, 33, 3925–3974. [Google Scholar] [CrossRef] [Green Version]
  35. Bellavitis, C.; Fisch, C.; Wiklund, J. A comprehensive review of the global development of initial coin offerings (ICOs) and their regulation. J. Bus. Ventur. Insights 2021, 15, e00213. [Google Scholar] [CrossRef]
  36. Efrat, K.; Gilboa, S.; Wald, A. The emergence of well-being in crowdfunding: A study of Entrepreneurs and backers of reward and donation campaigns. Int. J. Entrep. Behav. Res. 2020, 27, 397–415. [Google Scholar] [CrossRef]
  37. Nandru, P.; Chendragiri, M.; Velayutham, A. Examining the influence of financial inclusion on financial well-being of marginalized street vendors: An empirical evidence from India. Int. J. Soc. Econ. 2021, 48, 1139–1158. [Google Scholar] [CrossRef]
  38. Lee, L.F.; Porter, R.H. Switching regression models with imperfect sample separation Information–with an application on cartel stability. Econom. J. Econom. Soc. 1984, 52, 391–418. [Google Scholar] [CrossRef] [Green Version]
  39. Niankara, I.; Muqattash, R.; Niankara, A.; Traoret, R.I. COVID-19 Vaccine Development in a Quadruple Helix Innovation System: Uncovering the Preferences of the Fourth Helix in the UAE. J. Open Innov. Technol. Mark. Complex. 2020, 6, 25. [Google Scholar] [CrossRef]
  40. R Core Team. R: A Language and Environment for Statistical Computing; R Foundation for Statistical Computing: Vienna, Austria, 2015; Available online: https://www.R-project.org/ (accessed on 17 August 2019).
  41. Wojtys, M.; Marra, G.; Radice, R. Copula based generalized additive models for location, Scale and shape with non-random sample selection. Comput. Stat. Data Anal. 2018, 127, 14. [Google Scholar] [CrossRef]
  42. Fernihough, A. Mfx: Marginal Effects, Odds Ratios and Incidence Rate Ratios for GLMs. R Package Version, 1.2-2. 2019. Available online: https://cran.r-project.org/web/packages/mfx/mfx.pdf (accessed on 22 November 2020).
  43. Wood, M.; McKinley, W.; Engstrom, C.L. Endings and visions of new beginnings: The Effects of source of unemployment and duration of unemployment on entrepreneurial intent. Entrep. Res. J. 2013, 3, 171–206. [Google Scholar] [CrossRef] [Green Version]
  44. Ozaralli, N.; Rivenburgh, N.K. Entrepreneurial intention: Antecedents to entrepreneurial behavior in the U.S.A. and Turkey. J. Glob. Entrep. Res. 2016, 6, 32. [Google Scholar] [CrossRef] [Green Version]
  45. Eneji, R.I.; Nwbagbara, E.N.; Kati, G.K. Entrepreneurship Training for Mitigating Unemployment in Nigeria: How have the Tertiary Institutions Fared? J. Soc. Econ. Res. 2020, 7, 42–50. [Google Scholar] [CrossRef]
  46. World Bank. Global Outlook: Pandemic, Recession: The Global Economy in Crisis; World Bank Group: Washington, DC, USA, 2020; pp. 1–66. [Google Scholar] [CrossRef]
  47. Essel, E.O.; Min, W.; Essel, C.H.; Dumor, K. Unemployment Blues: Analysis of the Dual Mediating Effects of Knowledge and Perception on Entrepreneurial Intentions in the Environment. SAGE Open 2020, 10, 13. [Google Scholar] [CrossRef]
  48. Gonzalez, L.; Cernev, A.K.; de Araujo, M.H.; Diniz, E.H. Digital complementary currencies and public policies during the COVID-19 pandemic. Rev. Adm. Pública 2020, 54, 1146–1160. [Google Scholar] [CrossRef]
  49. Adegbite, O.O.; Machethe, C.L. Bridging the financial inclusion gender gap in smallholder agriculture in Nigeria: An untapped potential for sustainable development. World Dev. 2020, 127, 104755. [Google Scholar] [CrossRef]
  50. Elam, A.B.; Brush, C.G.; Greene, P.G.; Baumer, B.; Dean, M.; Heavlow, R. Global Entrepreneurship Monitor 2018/2019 Women’s Entrepreneurship Report. Babson College, Smith College, and the Global Entrepreneurship Research Association (GERA). 21 July 2020. Available online: https://www.gemconsortium.org/report/gem-20182019-womensentrepreneurship-report (accessed on 22 November 2020).
  51. Ramadani, V.; Hisrich, R.D.; Gërguri-Rashiti, S. Female entrepreneurs in transition Economies: Insights from Albania, Macedonia and Kosovo. World Rev. Entrep. Manag. Sustain. Dev. 2015, 11, 391–413. [Google Scholar] [CrossRef]
  52. Brush, C.; Edelman, L.F.; Manolova, T.; Welter, F. A gendered look at entrepreneurship ecosystems. Small Bus. Econ. 2018, 53, 393–408. [Google Scholar] [CrossRef]
  53. Hechavarria, D.; Bullough, A.; Brush, C.; Edelman, L. High growth women’s Entrepreneurship: Fueling social and economic development. J. Small Bus. Manag. 2019, 57, 5–13. [Google Scholar] [CrossRef] [Green Version]
  54. Bullough, A.; Guelich, U.; Manolova, T.S.; Schjoedt, L. Women’s entrepreneurship and culture: Gender role expectations and identities, societal culture, and the entrepreneurial environment. Small Bus. Econ. 2021, 1–12. [Google Scholar] [CrossRef]
Figure 1. The optimality conditions for consuming, saving, and borrowing in the global economy. Note: In the above graphical representation, the point of tengency between the inter-temporal budget constraint (IBC), and the highest acheivable indifference curve, defines each individual’s optimal first period consumption level, along with the expected second period consumption level, and status as net saver (a), or net borrower (c), or neither (b) in the global entrepreneurial finance market.
Joitmc 08 00026 g001
Figure 2. Global Entrepreneurial Finance Market (GEFM).
Joitmc 08 00026 g002
Figure 3. GEFM dynamics under public and private sectors financial injection, with exogenous financial intermediation.
Joitmc 08 00026 g003
Figure 4. GEFM dynamics under public and private sectors financial injection, with endogenous financial intermediation.
Joitmc 08 00026 g004
Figure 5. Boxplots of age against formal account ownership, saving, and borrowing for entrepreneurial purposes. From left to right, the above figure compares the average age of individuals with a formal account, to that of those without (left panel); the average age of the individuals with entrepreneurial savings, against that of those without (middle panel); the average age of the individuals with entrepreneurial borrowings, against that of those without (right panel).
Joitmc 08 00026 g005
Figure 6. Smooth functions plots of the age variable in the semi-parametric specifications of the conditional probabilities of formal account ownership (left panel), entrepreneurial saving (middle panel), and entrepreneurial borrowing (right panel).
Joitmc 08 00026 g006
Publisher’s Note: MDPI stays neutral with regard to jurisdictional claims in published maps and institutional affiliations.

