Article

Central Banks Digital Currency: Detection of Optimal Countries for the Implementation of a CBDC and the Implication for Payment Industry Open Innovation

by
Sergio Luis Náñez Alonso
*,
Javier Jorge-Vazquez
* and
Ricardo Francisco Reier Forradellas
DEKIS Research Group, Department of Economics, Catholic University of Ávila, 05005 Avila, Spain
*
Authors to whom correspondence should be addressed.
J. Open Innov. Technol. Mark. Complex. 2021, 7(1), 72; https://doi.org/10.3390/joitmc7010072
Submission received: 27 January 2021 / Revised: 18 February 2021 / Accepted: 19 February 2021 / Published: 24 February 2021
(This article belongs to the Special Issue Financial Open Innovations for Sustainable Economic Growth)

Abstract

:
This article analyzes the current situation of Central Bank Digital Currencies (CBDCs), which are digital currencies backed by a central bank. It introduces their current status, and how several countries and currency areas are considering their implementation, following in the footsteps of the Bahamas (which has already implemented them in its territory), China (which has already completed two pilot tests) and Uruguay (which has completed a pilot test). First, the sample of potential candidate countries for establishing a CBDC was selected. Second, the motives for implementing a CBDC were collected, and variables were assigned to these motives. Once the two previous steps had been completed, bivariate correlation statistical methods were applied (Pearson, Spearman and Kendall correlation), obtaining a sample of the countries with the highest correlation with the Bahamas, China, and Uruguay. The results obtained show that the Baltic Sea area (Lithuania, Estonia, and Finland) is configured within Europe as an optimal area for implementing a CBDC. In South America, Uruguay (already included in the comparison) and Brazil show very positive results. In the case of Asia, together with China, Malaysia also shows a high correlation with the three pioneer countries, and finally, on the African continent, South Africa is the country that stands out as the most optimal area for implementing a CBDC.

1. Introduction

It has been more than 12 years since “a new electronic cash system”, baptized as Bitcoin, was born, being “a peer-to-peer electronic cash system” [1]. All this happened in 2008 after a message was sent to the metzdowd.com cryptocurrency mailing list, signed with the alias Satoshi Nakamoto and titled “Bitcoin P2P e-cash paper” [2]. Since that time, Bitcoin’s growth has been exponential more as a store of value than as a means of payment for transactions. However, its emergence and the threat it poses by competing with central bank-backed money [3] have awakened the interest of Central Banks around the world in digital currencies, in this case backed by the central bank. It is therefore the aim of this article to shed light on what would be the optimal country to implement a digital currency backed by the central bank, popularly known as a Central Bank Digital Currency (hereinafter CBDC). For this purpose, a series of motives put forward by the different central banks or monetary authorities was used as a starting point. Once the reasons have been selected, these reasons have been assigned variables that characterize that reason and are compared using bi-variate correlation (Pearson’s correlation, Spearman’s correlation and Kendall’s Tau-b) [4,5] to determine the optimal country or monetary area. For this purpose, we have used data from the Bahamas, which has already implemented its own CBDC in October 2020, China, which has completed two pilot tests, and Uruguay, which also completed a pilot test. The main result has been to generate a list of countries that, being more closely related to the three previous countries, are considered optimal for the implementation of a CBDC. At the technical level, the SPSS statistical program was used to analyze the correlations between the countries and variables. This article is structured as follows: an introduction highlighting the relevance and importance of CBDCs around the world today. A literature review section where CBDC is defined and its design features are discussed, as well as its differences with cash and cryptocurrencies. The material and results section explains how the motives for implementing CBDCs and the candidate countries are selected, as well as the assignment of variables. The results section shows those countries that have obtained the correlation results closest to those of the Bahamas, China, and Uruguay, and which are therefore optimal for implementing a CBDC. In the conclusion, it is indicated that the results obtained show that the Baltic Sea area (Lithuania, Estonia, and Finland), Uruguay and Brazil, China, Malaysia and finally South Africa stand out as optimal locations for implementing a CBDC.

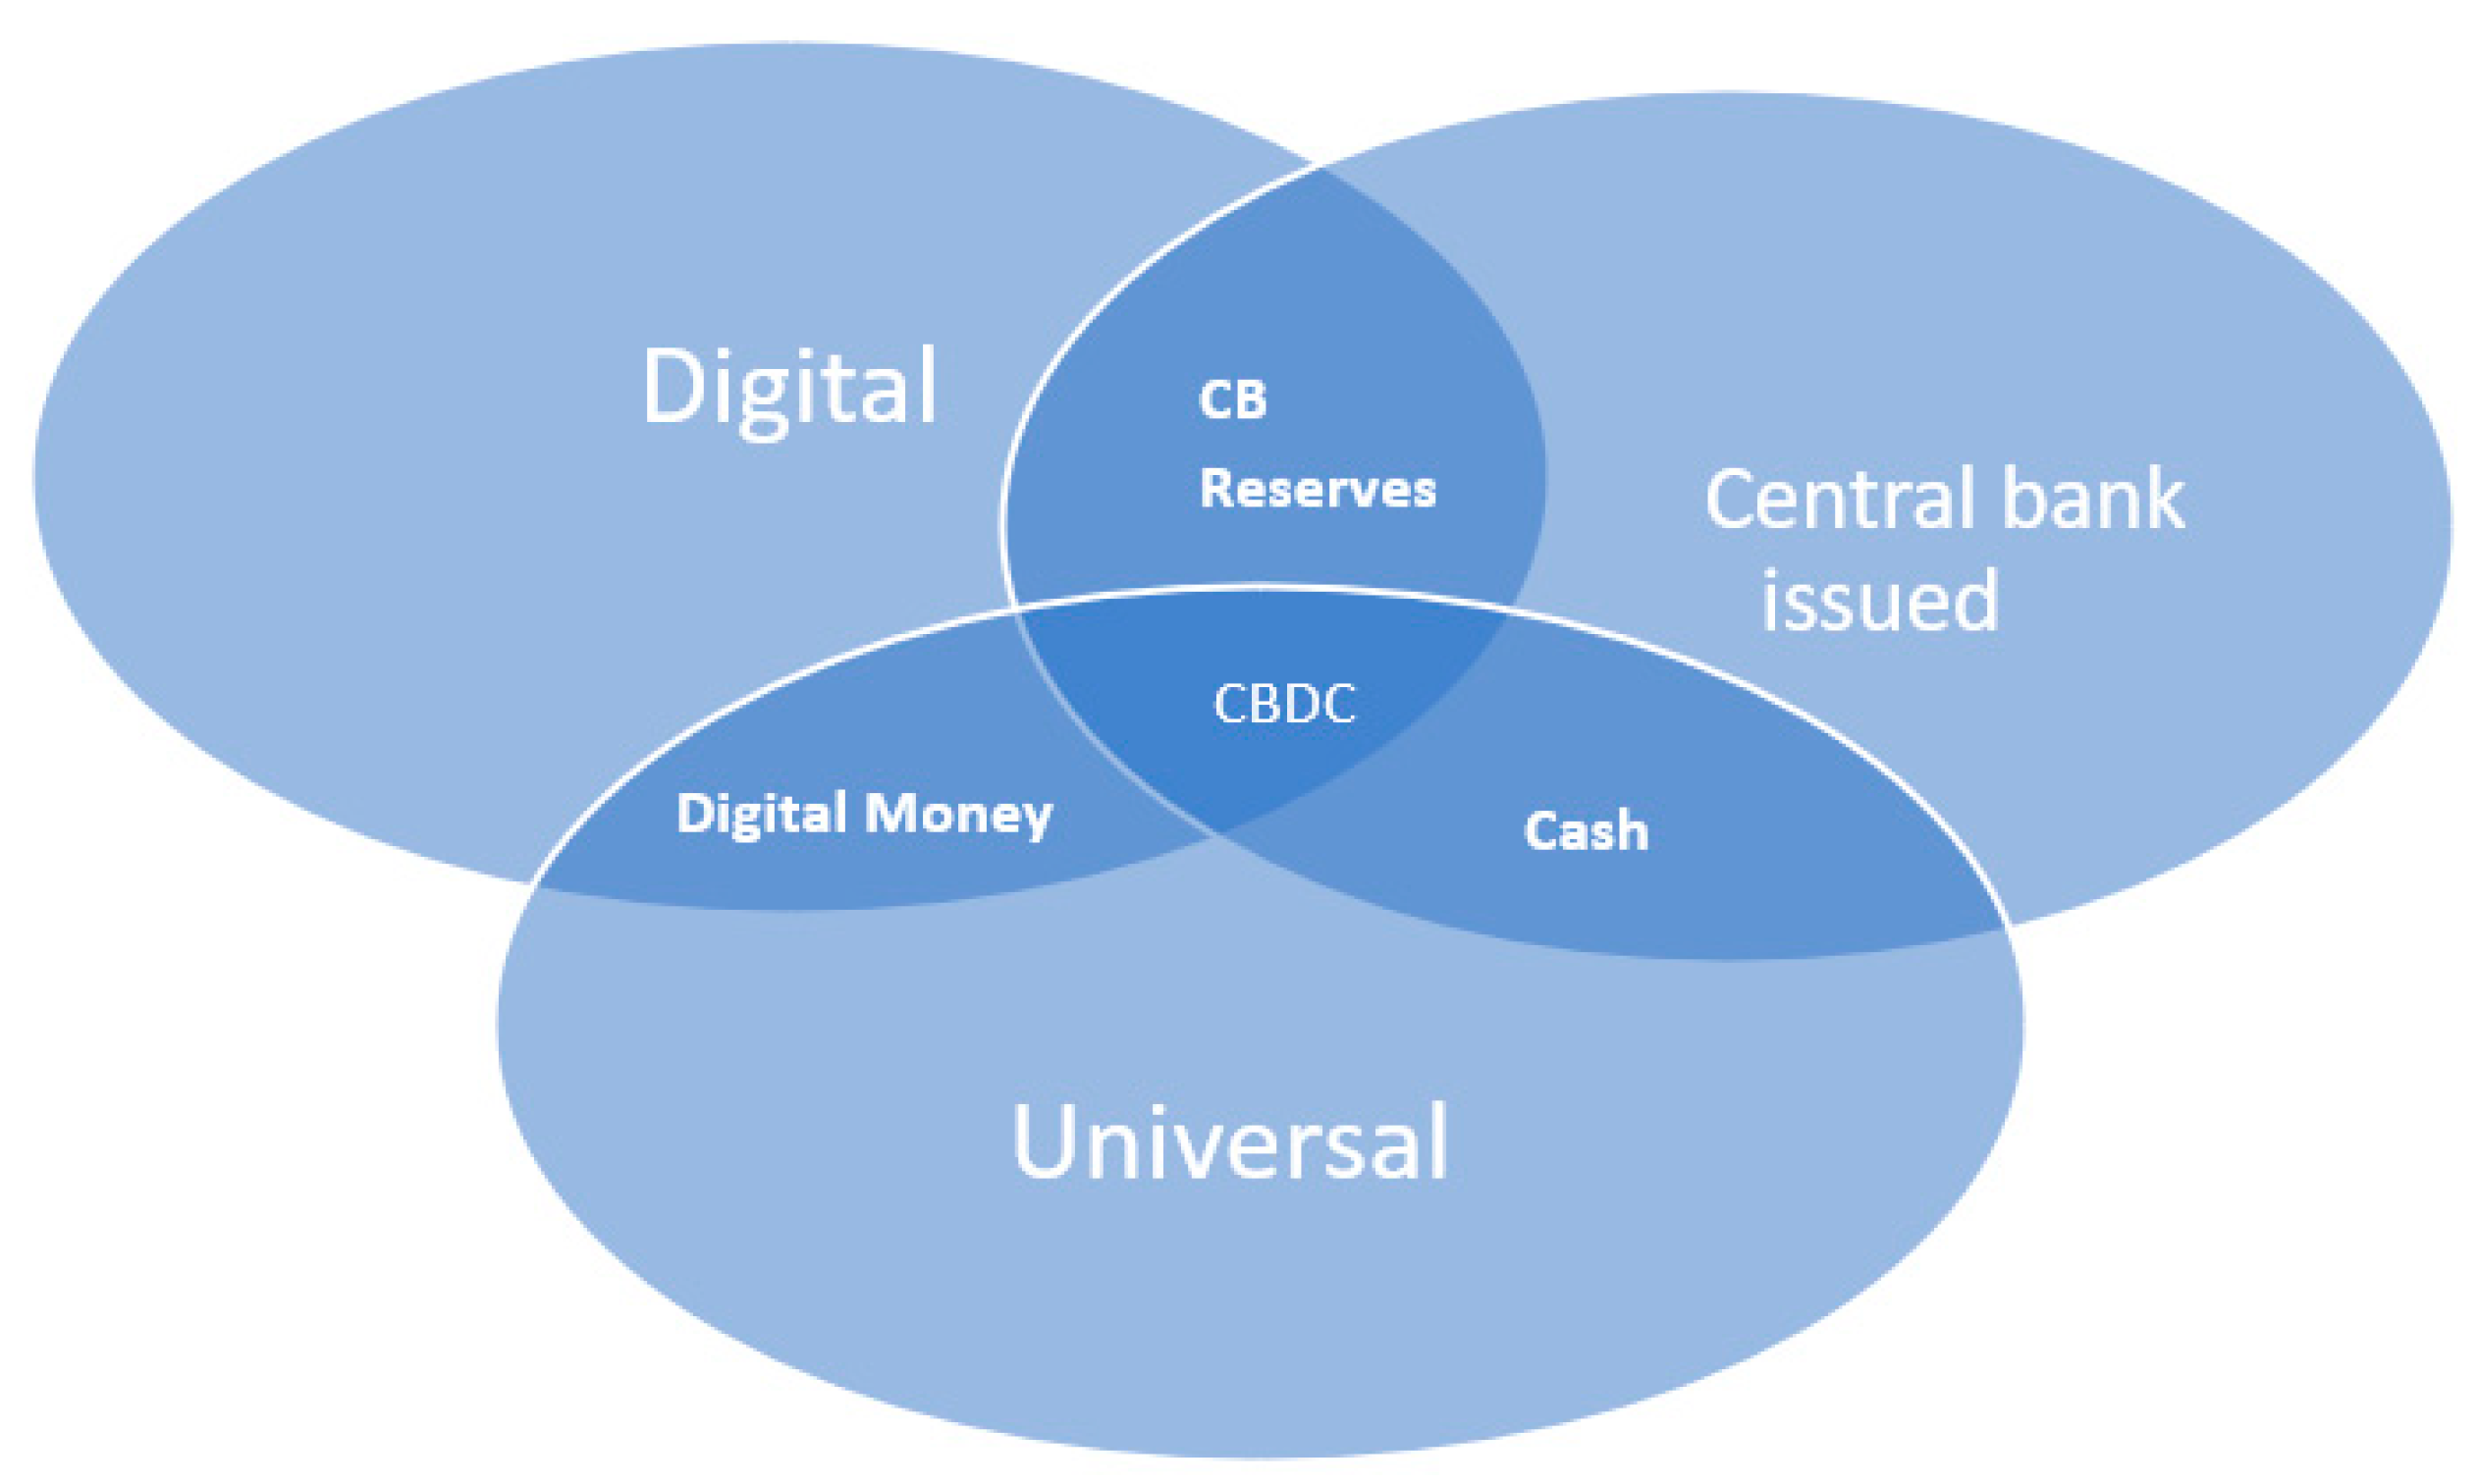
2. Literature Review: Definition of CBDCs, Differences with Cash and Cryptocurrencies

A CBDC is an electronic variant of cash issued by a central bank, which combines cryptography and digital ledger technology to offer this digital money [6]. It is therefore a central bank liability, which can:
-
Emulate the characteristics of cash (if held by the public).
-
Serve as a central bank reserve (if held only by banks and other financial intermediaries that have access to the payment system).
The different studies and debates currently revolving around the possible implementation of a CBDC had their origin (as we have already commented in the introduction) in the emergence of Bitcoin and other cryptocurrencies (such as Ripple, Ethereum or Litecoin among others) that, in theory, can perfectly compete with the physical money issued by a central bank [3,7], or as [8] points out, “Libra is going to challenge the current banking ecosystem”. It should also be considered that traditional cash is costly, as its issuance, circulation and withdrawal require costly infrastructure for the central bank and commercial banks [9]. It also generates crime (theft) and counterfeiting [10], and is also the main vehicle for money laundering, tax evasion and terrorist financing [11]. A CBDC would in principle be more efficient, cleaner, and safer. One of the fundamental questions regarding CBDCs is whether they preserve the anonymity inherent to cash, which will be discussed later in the discussion of technology.
As we can see in Figure 1, individuals can currently hold central bank-issued money (central bank cash) in the form of bi-currencies or coins, but only banks and other financial institutions can hold central bank-issued electronic money in the form of reserves.
Central bank digital currency (CBDC) would be an electronic form of money issued and backed by a central bank, which could be used by households and businesses to make payments and as a store of value. If we focus therefore on the Venn diagram above, a CBDC would thus be central bank-issued money in digital form and universally accessible [12,13].
If a CBDC is implemented, this new “digital cash” may create new opportunities. On the one hand, in payments, and on the other hand, it can directly affect monetary policy and how a central bank can ensure two of its core functions: monetary stability and financial stability. Previous research has explored how wholesale CBDCs could provide better liquidity and serve as a means of payment in financial markets [14]. However, in this paper we analyze from an innovation perspective the impact of a “retail CBDC”. This retail CBDC, implemented by a central bank, would be aimed at meeting the payment needs of households and businesses. Depending on how the CBDC is ultimately designed, it may (or may not) enable the execution of payments outside the traditional financial sector [15]. A CBDC issued by a central bank for payments between individuals would be a new form of money that would coexist alongside traditional cash and bank deposits [16], as we can see in Figure 1 containing the Venn diagram of the types of money.
A CBDC would be denominated in Dollars, Euros, Yen or any other currency, just like banknotes or physical coins, so 10, 50 or 100 monetary units of a CBDC would always have the same equivalence as a banknote of 10, 50 or 100 monetary units of banknotes or traditional physical coins. A CBDC is sometimes considered to be equivalent to a digital banknote, although in practice it may have other characteristics that will depend on its final design [17]. A CBDC requires the creation of a whole new infrastructure by the issuing central bank so that it can be used to make payments digitally.
-
A database in which the CBDC is registered.
-
An application through which payments with the CBDC are executed.
A CBDC would thus offer users an additional form of payment to complement cash, card, or bank transfer payments. Although the term CBDC includes the words “digital currency”, a CBDC would be somewhat different from “cryptocurrencies”, which in some cases are also called “crypto assets”, such as Bitcoin, Ethereum or others referred to in the introduction. Therefore, the initial classification made of a CBDC should be complemented by the so-called “money flower”.
The Venn diagram above shows the characteristics that, according to many authors, money must meet: 1. regarding the issuer of the money, it can be issued by the central bank or not; 2. regarding accessibility, it is to determine whether access will be broad (universal) or restricted (e.g., only to residents of the country or nationals); finally, 3. regarding the type of technology (whether it is account-based). In the diagram, CB means central bank and CBDC means central bank-issued digital currency (excluding central bank digital money that is already available to monetary counterparties and some non-monetary counterparties) [18]. Private (general purpose) digital tokens include crypto assets and currencies, such as Bitcoin among others. Bank deposits are not widely accessible in all jurisdictions [16].
Many crypto assets are privately issued and are not backed by a central bank. Due to the above, these crypto-assets are not considered money because they do not fulfill the essential functions of money that have been previously stated [19]: 1. they are too volatile to be a reliable store of value, i.e., their price oscillates very sharply; 2. they are not widely accepted as a medium of exchange at any time and jurisdiction; and 3. these crypto assets are not used as a unit of account.
There are also so-called stable coins, which are privately issued cryptocurrencies intended to overcome some of the shortcomings we have listed above affecting crypto assets. Fundamentally, they aim to provide stability through some form of backing [20]. These stable coins have also been classified [21] or even compared to cases of monetary policy happened in the past [20]. Depending on the nature of the assets backing the “currency” and how they are held, the stablecoin may be unable to provide value stability and may involve other risks [16]. In contrast, a CBDC backed by a central bank would be a new form of risk-free currency, issued by the central bank, and would therefore fulfill all the essential functions of money. According to [22], cash is an asset class that combines four characteristics:
1. It is exchanged between peers (without knowledge of the issuer). 2. It is universal (anyone can have it). 3. It is anonymous, and 4. CBDCs are an alternative to cash, and therefore meet the first characteristic mentioned above, but because of their digital nature (and depending on their design) they may differ from the other three characteristics mentioned above. A CBDC can be designed to be universally accessible or restricted to a group of users [23,24]. The CBDC can be designed to be open to the entire public or only available to a specific number of investors or individuals [23,24,25]. CBDCs can be designed to be anonymous or identified [24]. Finally, according to [22,25], the decoupling of digital cash from traditional cash (coins and banknotes) “opens up the possibility of including interest as a feature”.

3. Materials and Methods

3.1. Materials

Before applying the various statistical tools to analyze the data, it is necessary to select them. First, we start with the motives (and the variables associated with them) for implementing a CBDC for each country, which will serve as input for the model. To this end, we start from the information available on the motives that drive a country to establish a CBDC, based on that collected by [9,26], complemented by the speeches issued by central banks and information also collected by [27]. Based on the above, the motives present in central bank speeches, reports or briefing notes and the variables associated with them have been selected, as shown in the following table (see Table 1).
Therefore, as can be seen in the figure above, we start from the reasons put forward by the different Central Banks for implementing CBDCs in their territory and assign a series of variables. The purpose of the above is to carry out a statistical correlation analysis that allows us to determine a list of optimal countries or currency areas, as well as those that would be optimal (because they are less closely related) for implementing a CBDC. Once this has been done, we have created a matrix (shown in Table A1 in the Appendix A) in which the variables appear for each of the selected countries. The countries have been selected on the basis of the following criterion: the existence of a speech by a member of their central bank giving information on CBDCs, especially if their implementation is being considered in the short term, in the medium term or in the long term.
In order to measure geographic dispersion, we have assigned the variable inhabitant per square kilometer [28]. This variable has been inserted since some countries have difficulties in providing banking services to their population precisely because of this geographical dispersion. Regarding access to banking services, the variable used was commercial bank branches (per 100,000 adults) [29] to allow us to compare access to this service among the list of selected countries. Regarding the reason for increasing the banking penetration rate, one of the ways to measure this is through financial sector credit to the private sector (% of GDP), selecting data from [30], as it shows the relationship between credit and GDP. The reason given is that quantifying the credit represents the incidence of the system in the economy. The rationale for implementing a CBDC based on the financial sector not becoming obsolete has been measured through the Digital Readiness Index [31], which measures seven components that are standardized and summed to obtain an overall score of the digital readiness of each country. The relative motive for implementing a CBDC as consumer protection is determined by the reason that the more online commerce there is, and the more payments made in this way, the more “digital” protection the consumer will need, and the UNCTAD B2C E-commerce Index [32] has been used as a variable for this purpose. Other central banks have put forward as a reason for implementing CBDCs the power to maintain control over monetary and macroeconomic policy [9], so to measure this, we have turned to the speeches of governors or members of central banks, reports or technical notes alluding to this specific reason, with its presence or absence in the item analyzed as the variable used. The more mobile payment is used or cryptocurrencies are available to the public without a Central Bank alternative, the more risk there is that other forms of payment not controlled by the Central Bank, such as Bitcoin, Ripple and other cryptocurrencies, will be used, and the more difficult it will be to control monetary policy. Many countries, such as Sweden, Norway, or the United Kingdom, have experienced a large drop in the use of cash [33,34]. To measure this reason, the variable used is currency in circulation as a percentage of each country’s GDP [35]. Another of the reasons used to establish a CBDC is the lower costs and greater efficiency of the banking system [34], so that the variable used to measure this situation has again been its presence in the speeches of governors or members of central banks, reports or technical notes where this specific reason is alluded to; its presence or not in the item analyzed being the variable used. There is a fundamental motive when it comes to determining the real interest of a central bank or monetary area in establishing its own CBDC: the central bank’s discourse indicating this motive in the short term, medium term or long term (or even its rejection).
Table 1. Reasons for establishing a CBDC and associated variables.
Reason for Establishing a CBDCAssociated Variable
Geographic dispersionInhab/km2
Access to financial servicesCommercial bank branches (per 100,000 adults)
Increase the banking penetration rateFinancial sector credit to the private sector (% of GDP)
Financial sector does not become obsoleteDigital Readiness Index
Security reasons: avoid money laundering and terrorism financingShadow economy, percent of GDP
Consumer protectionUNCTAD B2C E-commerce Index
Maintain control over monetary and macroeconomic policy
Fall in use of cash (alternative)
Corresponding CB speech
Broad money (% of GDP)
Lower costs and increased efficiency of the banking system
Central Bank Speech
Public interest/CBDC 1
Public interest/CBDC 2
CB speech on CBDC
CB speech on CBDC
Search interest Keyword “CBDC” (2013–2020) annual average of the period.
Search Interest topic “CBDC” (2013–2020) annual average of the period
Source: Own elaboration based on [9,27,28,29,30,31,32,35].
To measure this situation, we start from the data of [27] and its “central_bankers_speech_stance_index_index_normalized” index. Finally, the reason for establishing a CBDC is the public’s own interest in its acceptance. There are still few studies like that of [26], so we start from two quantifiable variables: Search Interest Keyword “CBDC” and Search Interest topic “CBDC”, both collected by [27], but in this case, considering the annual average for the period between 2013 and 2020. All the above allows us to generate the table of countries and variables shown in the Appendix A as Table A1.

3.2. Methodology

Before starting to analyze the relationships between the different countries with the variables that we characterized in the previous section, we performed an analysis of the descriptive statistics for each country (shown in Table A2 in the Appendix A) and also a frequency analysis of the variables (shown in Table A3 in the Appendix A). Once this had been done, we carried out the application of Pearson’s correlation coefficient [36] using the SPPS statistical program. The objective is to find those countries with the highest degree of correlation [37], and then Spearman’s Rho and Kendall’s Tab U with the Bahamas in first place, China in second place and Uruguay in third place. The reason for choosing these three countries, as already announced at the beginning of the manuscript, is that they are the countries that have already committed to a CBDC. The Bahamas was one of the first countries to launch its own CBDC backed by a Central Bank. The CBOB (Central Bank of the Bahamas) announced via Twitter and the radio following a speech by its Governor, John Rolle, the launch (following pilot tests conducted earlier) of the “Sand Dollar”. Sand Dollar tokens are crypto representations of the Bahamian dollar, issued and regulated by the country’s central bank, which facilitates their integration into existing payment networks. The Sand Dollar is pegged 1:1 to the Bahamian dollar, which, in turn, is pegged to the US dollar [38]. On the other hand, China already conducted pilot tests in 2019 to establish its own CBDC. However, the final tests were conducted in April 2020. Subsequently, the pilots expanded to nine cities, including Shenzhen, Guangzhou, as well as Hong Kong and Macau. The mass trial in Shenzhen has been conducted through a lottery, where the graceful (50,000 out of 2 million applicants) received 200 digital yuan (about USD 30) to spend at merchants by October 18 (12–18 October 2020) [39,40]. In the case of Uruguay, the Central Bank of Uruguay completed a pilot program with a retail CBDC in April 2018, as part of a broader government financial inclusion program. The pilot test began in November 2017. It proceeded to issue, circulate, and test an e-peso. Thus, “Transfers were made instantly and peer-to-peer, through cell phones using text messages or the e-peso app” [41]. However, blockchain was not used. Twenty million e-pesos were issued, all of which were cancelled when the pilot ended [42]. The program is now in an evaluation phase before a decision can be made on further trials and possible issuance. As of today, the Central Bank of Uruguay has not yet decided. In our study, we used Pearson’s correlation coefficient, Spearman’s Rho, and Kendall’s Tau-b first. We used Pearson’s correlation coefficient to measure the degree of relationship of the continuous variables under study, since they are quantitative. However, we complemented this with Spearman’s Rho, which measures the interdependence between two random variables (both continuous and discrete) in case there is any discrepancy. Finally, to complement the study, we used Kendall’s Tau-b, which measures the similarity in the ordering of the data when they are classified in ranks for each of the quantities, selecting Tau-b, since it adjusts for ties.

3.2.1. Pearson’s Correlation

Therefore, the aim is to look for those countries that present a higher degree of co-relation with the Bahamas, China, and Uruguay as possible optimal candidates to be the next to establish their own CBDC. To this end, we apply the following formula (Equation (1)) to each country, in this case for grouped data:
r = n ·   f · d x · d y (   f x · d x ) (   f y · d y ) [ n ·   f x · d x 2 (   f x · d x ) 2 ] [ n ·   f y · d y 2 (   f y · d y ) 2 ]
where n = number of data, which in our case will be the data collected by each country. f = cell frequency, fx = frequency of variable X (which in our case will be the Bahamas, China or Uruguay as appropriate), fy = frequency of variable Y (which in our case will be the rest of the countries excluding the three previous ones), dx = coded or changed values for the intervals of variable X, making sure that the central interval corresponds to dx = 0 to make the calculations easier, and finally, dy = coded or changed values for the intervals of the variable X, ensuring that the central interval corresponds to dy = 0 to make the calculations easier [37,43,44]. The results are shown in Table 2.
Following the method described above, there is a perfect positive correlation when the result is equal to 1; if it is between 0.9 and 0.99, it would be a very high positive correlation; and from 0.7 to 0.89, a high positive correlation [37,44,45]. In our case, we will select the first ten countries if they meet these requirements. In the results section (Section 4), an analysis of the results is carried out.

3.2.2. Correlation by Spearman’s Rho

Secondly, Spearman’s Rho was applied, as before, with the Bahamas in first place, China in second place and Uruguay in third place. The reason for choosing these three countries, as already announced at the beginning of the manuscript, is that they are those countries that have already committed to a CBDC. The ρ (rho) is a measure of the correlation (the association or interdependence) between two random variables (both continuous and discrete). To calculate ρ, the data are sorted and replaced by their respective order [46], as shown in Equation (2):
rs = 1 − 6∑21n/(n2 − 1)
The application of the above formula has allowed us to obtain the results shown in Table 3. In this case, Spearman’s Rho has been used to contrast the results obtained with Pearson, since Spearman’s correlation coefficient is less sensitive than Pearson’s for values far from the expected [47].
The results obtained in the table above have been ordered from highest to lowest correlation with the Bahamas, China, and Uruguay. In this case, the interpretation of Spearman’s coefficient is the same as that of Pearson’s correlation coefficient, which we have already analyzed in the previous section. It ranges between −1 and +1, indicating negative or positive associations, respectively, 0 zero, meaning no correlation, but not independence [43,45]. In the third section, we analyze the results.

3.2.3. Kendall Tau-b Correlation

Thirdly, Kendall’s correlation coefficient was applied, as before, with the Bahamas in first place, China in second place and Uruguay in third place. The reason for choosing these three countries, as already announced at the beginning of the manuscript, is that they are those countries that have already committed to a CBDC. Kendall’s rank correlation coefficient is a measure of rank correlation, i.e., it measures the similarity in the ordering of the data when they are sorted into ranks by each of the quantities [45,48]. We have used the Tau-b statistic (which captures Equation (3)) as it adjusts for ties:
τ B = n c n d / ( n 0 n 1 ) ( n 0 n 2 )
where nc is the number of concordant pairs (in our case concordant countries), nd is the number of discordant pairs (in our case discordant countries), ti is the number of cases tied in the first quantity, and ui is the number of cases tied in the second quantity. The application of the above formula has allowed us to obtain the results shown in Table 4.
The results obtained in the table above have been ordered from highest to lowest correlation with the Bahamas, China, and Uruguay. In this case, the interpretation of Kendall’s correlation between two variables will be high when the observations have a similar rank (or identical for a correlation of 1), and low when the observations have a different rank (or completely different for a correlation of −1) between the two variables [43,45]. So again, the result oscillates as in Pearson’s and Spearman’s correlation between −1 and 1.

4. Results

Figure 2 shows the countries with the highest Pearson correlation with the Bahamas, China, and Uruguay. As we can see, the highest degree of correlation with the Bahamas, and therefore the most identical countries, are Lithuania, Uruguay, and Estonia (all above 0.9). This means, as we analyzed in the previous section, a very high degree of correlation. This implies that these three countries have similar characteristics in terms of banking penetration rate, digitalization of the economy or difficulties of access to bank branches to those of the Bahamas, and would therefore be ideal candidates for implementing a CBDC. The fact that Uruguay is in this group reinforces our methodology, since, as has been discussed in different sections of this manuscript, Uruguay is one of the countries that has carried out a pilot test and is seriously considering implementing a CBDC.
China, which has completed two pilot tests with a CBDC, shows a higher degree of correlation with Switzerland, Malaysia, and Tunisia. These countries did not appear in the previous Bahamas result; however, Lithuania appears again, so it appears to be a good candidate. Malaysia and Finland also appeared in the Bahamas result, although with a lower correlation.
Finally, Figure 2 shows the correlation between Uruguay and the rest of the countries in the sample. Again, in the top positions (as was the case with the Bahamas), Lithuania and Estonia appear in the first positions, together with the United States. It is worth noting that the Bahamas also appears (as we pointed out earlier) and Finland repeats once again.
Present in all three comparisons are Lithuania (also being the one with the highest correlation with the Bahamas and Uruguay) and South Africa. In two are Estonia, with a very high correlation with the Bahamas, and Uruguay, Malaysia, Russia, Finland, and Brazil. Therefore, the Baltic Sea area with Lithuania, Estonia and Finland is configured as an optimal area to implement a CBDC, in South America, Uruguay (which was already in the comparison) and Brazil, and in the case of Asia, together with China, Malaysia. In the case of Africa, South Africa stands out.
Figure 3 shows the countries that are most highly correlated with the Bahamas, China, and Uruguay, respectively, using Spearman’s method.
In the case of the Bahamas, Uruguay, Brazil and Estonia occupy the first positions, together with Lithuania and South Africa. If we compare this with the results for the Bahamas in the Pearson correlation, we see that Uruguay moves from second to first place, Lithuania drops from first place, but remains among those with the highest correlation, and Estonia, Brazil and South Africa also remain.
In the case of China, Malaysia, South Africa and South Korea hold the top positions, followed by Japan and Finland. Estonia also appears. In this case, compared with Pearson, Malaysia remains unchanged, Switzerland drops, and South Korea and Japan are better positioned.
As for Uruguay, the Bahamas appears in first place, followed by Estonia and Lithuania (which also occupied prominent positions in Pearson).
Therefore, the results of the optimal countries for implementing a CBDC obtained in Pearson seem to be repeated for the most part: Estonia, Lithuania (and to a lesser extent, Finland) in Europe; in the case of South America, together with Uruguay, there is Brazil, although with less intensity; and in the Asian zone, together with China, Malaysia repeats (although South Korea also appears in this case). In the African continent, South Africa stands out.
Figure 4 shows the countries with the highest correlation using the Kendall method, also with the Bahamas, China, and Uruguay. In the case of the Bahamas, with a very high correlation, Uruguay, Brazil, Lithuania, and Estonia stand out, followed by Russia, South Africa, and Malaysia. Comparing this with the result obtained for Pearson, Uruguay, Lithuania, and Estonia are repeated.
In the case of China, Malaysia, South Africa, and South Korea stand out, followed by Japan and Finland. Estonia also appears again, but with a lower correlation. In this case, we do find notable differences with Pearson, because although Malaysia is maintained, Tunisia disappears, and Switzerland appears with a much lower correlation. Finland practically maintains the result together with Japan and South Africa.
In the case of Uruguay, the Bahamas is again the country with the highest correlation, followed by Estonia and Lithuania. Brazil, Russia, and South Africa also appear as good candidates. Finland and Malaysia also appear with a high Kendall correlation.

5. Discussion of Results: Central Bank Digital Currency, and Payment Industry Open Innovation

5.1. Discussion: The Way of Central Bank Digital Currency

According to [9], once a country with great global weight (as is the case of China) takes a step forward and decides to establish its own CBDC, many others would at least study the phenomenon further and even decide to implement their own CBDC (as has been the case of the Bahamas). The attention that is being paid, whether by central banks, monetary areas, or citizens themselves, has only increased, as [27] points out by analyzing Internet searches on CBDCs. Reactions to all this interest can be found, for example, in the European Central Bank itself, which at the end of 2020 launched an open survey to its citizens asking them about their own CBDC, which would be called “digital euro” [49], and in which more than 8000 citizens of the European Union participated [50]. Therefore, the attention and importance that CBDCs are gaining worldwide is indisputable. CBDCs therefore represent a major innovation in the field of money, which in the short and medium term may revolutionize the way in which citizens make their payments, in this case by means of “digital” cash payments. This innovation is open and in continuous change. This change is accelerating in recent times due to the great boom that cryptocurrencies are acquiring, especially thanks to Bitcoin.
In our article, we have analyzed the countries that have already established their own CBDC (Bahamas) and those two that are more advanced in this implementation (China and Uruguay). We have characterized different variables, using statistical means (bivariate correlation: Pearson’s, Spearman’s, and Kendall’s correlation). The results obtained show that the degree of correlation between the three countries under study and other previously selected countries has already been described.
The results show that the Baltic Sea area with Lithuania, Estonia and Finland is an optimal area for implementing a CBDC. In South America, Uruguay (which was already included in the comparison) and Brazil are optimal areas, and in the case of Asia, together with China, Malaysia is an optimal area for implementing a CBDC. In the case of Africa, we would highlight South Africa.
With respect to the first zone, the Baltic countries, the results obtained are consistent. These countries have a low population density, a low number of bank branches per 100,000 inhabitants and a high level of digital transformation. In addition, they are societies in which cash is in decline. It is striking that Sweden does not appear next to them, as it shares similar characteristics, or even Switzerland.
As far as South America is concerned, let us remember that Uruguay has already conducted a pilot test. Uruguay shares many characteristics with the previous group of countries. In this region, Brazil also appears as an optimal option for implementing a CBDC. It shares certain characteristics with Uruguay and there is interest among Brazilian citizens in this type of virtual currency. Perhaps in societies where electronic means of payment are more established (such as Bizum, We-chat pay, Alipay or Swish), citizens do not see as much advantage in CBDCs as in places where it is not as developed [51].
On the Asian continent, along with China, Malaysia appears. China has already conducted two tests with real CBDC among its population, and among the reasons that stand out for implementing a CBDC is the large number of digital payment users in the country (through the aforementioned We Chat pay and Alipay platforms), and although the first tests have been positive, there are people who claim that it does not offer anything different from the aforementioned payment platforms [52]. Two other Chinese motives for establishing this CBDC are on the one hand to protect the population from the use of cryptocurrencies not backed by a central bank, and on the other hand to achieve the worldwide implementation of the Digital Yuan as an exchange currency (in competition with the dollar) [52]. Malaysia shares certain characteristics with China that make our results meaningful. Both share a similar number of bank branches per 100,000 inhabitants, similar e-commerce implementation and public interest in CBDCs.
Africa seems beforehand an unlikely place for the establishment of this new monetary technology, virtual currencies backed by a central bank. The key is therefore geographical dispersion. The inhabitants of the African continent live in remote areas and do not have access to traditional banking services. South Africa shows a high degree of correlation with the countries most advanced in the implementation of a CBDC. This result is not entirely surprising, as mobile payments are highly developed and accepted on the African continent. See the case of the M-pesa in Kenya or other West African countries such as Mali, Senegal, Togo, or Ivory Coast [53].

5.2. Discussion: CBDC and Its Implication for Payment Industry Open Innovation

We can therefore conclude that CBDCs are an innovation of central banks which, depending on the country, will be implemented at a greater or lesser rate. In our study, we have detected that the optimal countries for the proximity of the variables and motives studied to the Bahamas, China and Uruguay are Lithuania, Estonia, and Finland in Europe, and Uruguay (which has already conducted a pilot test) and Brazil in South America. In the case of Asia, together with China, Malaysia is an optimal country, and lastly, in the case of Africa, South Africa stands out.
The use of these digital currencies backed by the central bank is one more step in the necessary digital transformation of societies [54] and, together with other measures such as those proposed by [55,56], will serve to promote this digital transformation, the one proposed by [26], since his study concluded that a CBDC would be accepted.
However, and given that technology and consumer tastes change, more research is needed to determine what advantages these CBDCs can bring to users in each country, whether this effort pays off (since there are already other digital means of payment), and to resolve some issues related to security (possible hacking) or the privacy of the CBDC user [57].
Undoubtedly, CBDCs, if eventually implemented in a territory, may pose a threat to existing payment systems. This may lead to an abandonment of some digital and innovative means of payment, but the opposite may also occur. It may happen that the E-money payment industry reacts with great speed (it is a very dynamic and innovative sector). This may cause users to see no advantage in the use of a CBDC and end up failing. This last point of view was referenced in the first pilot test carried out with the Chinese CBDC, when some users, after the test, declared that “the CBDC was no different from other means of payment”, in clear allusion to We Chat Pay or Alipay (Alibaba group) [51].
There may, however, be a third way, and it is the alliance to innovate between payment technology companies and central banks. This could be the best way forward, as it would combine the trust and security provided by a central bank with the dynamism and innovation characteristic of this type of e-payment company. The latter has already occurred with the CBDC in the Bahamas, where several e-payment companies are involved in its implementation and operation [58]. The clear winner of this alliance would undoubtedly be the user of the means of payment [59,60].
The first limitation of this study is the number of variables collected and analyzed, which could be increased in subsequent studies. Additionally, as a second limitation, we would like to point out possible changes in central bank decisions in a sudden and rapid manner. The latter could change the results of our study in the future.

6. Conclusions

The conclusion drawn from this article is that CBDCs are an innovation of the Central Banks which, depending on the country, will be implemented at a greater or lesser speed. In our study, we have detected that the optimal countries for the proximity of the variables and reasons studied to the Bahamas, China and Uruguay are the Baltic Sea area (Lithuania, Estonia and Finland), which is configured within Europe as an optimal area to implement a CBDC. In South America, Uruguay (already included in the comparison) and Brazil show very positive results. In the case of Asia, together with China, Malaysia also shows a high correlation with the three pioneering countries, and finally, on the African continent, South Africa is the country that stands out as an optimal area for implementing a CBDC.
The use of these digital currencies backed by the central bank is a further step in the necessary digital transformation of societies. It remains to be seen, however, the degree of acceptance they will have in society, so more research is needed on this issue. However, as technology and consumer tastes change, more research is needed to determine what advantages these CBDCs can bring to users in each country, and whether the effort pays off (given the existence of other digital means of payment).

Author Contributions

Conceptualization, S.L.N.A.; Data curation, S.L.N.A.; Formal analysis, S.L.N.A. and J.J.-V.; Funding acquisition, R.F.R.F.; Investigation, S.L.N.A. and J.J.-V.; Methodology, S.L.N.A.; Project administration, S.L.N.A., J.J.-V. and R.F.R.F.; Resources, R.F.R.F.; Software, J.J.-V. and R.F.R.F.; Supervision, J.J.-V.; Visualization, J.J.-V.; Writing—original draft, S.L.N.A.; Writing—review and editing, J.J.-V. and R.F.R.F. All authors have read and agreed to the published version of the manuscript.

Funding

The APC was partially funded by the incentive granted to the authors by the Catholic University of Ávila.

Institutional Review Board Statement

Not applicable.

Informed Consent Statement

Not applicable.

Data Availability Statement

Not applicable.

Acknowledgments

We would like to thank the Catholic University of Avila, which has allowed us to use IBM-SPPS Statistics for the statistical calculations performed in this study. Also, we want to thank Tableu Inc. for allowing us to use Tableau Desktop Professional Edition free of charge for scientific purposes.

Conflicts of Interest

The authors declare no conflict of interest.

Appendix A

Table A1. Reasons for establishing a CBDC and associated variables by country.
Country/Reason for Establishing CBDCGeographic DispersionAccess to Financial ServicesIncrease the Banking Penetration RateFinancial Sector Not to Become ObsoleteSecurity Reasons: Avoid Money Laundering and Terrorist FinancingConsumer ProtectionMaintain Control over Monetary and Macroeconomic PolicyFall in Use of Cash (Alternative)Lower Costs and Greater Efficiency of the Banking SystemCentral Bank SpeechPublic Interest/CBDC 1Public Interest/CBDC 2
VariableInhab/km2Commercial bank branches (per 100,000 adults)Financial sector credit to the private sector (% of GDP)Digital Readiness IndexShadow economy, percent of GDP UNCTAD B2C E-commerce IndexCorresponding CB speechBroad money (% of GDP)CB speech on CBDCCB speech on CBDCSearch interest Keyword “CBDC” (2013–2020) Annual average of the periodSearch Interest topic “CBDC” (2013–2020) Annual average of the period
Australia3.228.2135.817.898.1921122.60059.848.3
Bahamas38.524.445.212.7438.5565055.714
Brazil25.118.767.312.3135.2262098.210141.5154.4
Canada4.119.6 17.339.42921122.900573.9461.4
China148.38.9164.713.2212.116011970239.494
South Korea529.415.1151.718.2219.8384.30151.804108.6126.1
Ecuador68.810.140.211.2930.1841029.800
Spain93.749.794.715.7422.0180165.810109.1106.1
United States of America35.730.551.919.03787192.80−1163.6152.8
Estonia30.48.95917.1418.4990165.810
Eurozone111.82286.316.317.02 165.810
Philippines357.79.24811.0328.0440076.61455.679
Finland18.13.195.117.9513.393165.81−4
France122.334.3107.616.2511.6590165.812141.5134.8
Ghana130.88.512.49.5539.3735026.900
India454.914.650.29.4617.8944176.100329.8160.4
Indonesia147.815.632.511.6821.7636138.810189166.6
Iceland3.530.590.618.1612.4593166.400365.1160.4
Israel410.516.865.416.6719.1881186.81043.527.3
Jamaica2717.341.311.5524.9765150.110
Japan347.133.9111.217.698.1993.612550−263.3109.8
Kuwait232.223.289.313.3621.72631101.504
Lithuania44.710.438.914.7818.6579165.81 1
Madagascar45.12.414.26.4845.2929024.600
Malaysia9610.1120.914.3126.07771123.10162.479.5
Norway14.5 128.417.9815.0796.39166.20 0
New Zealand18.425.414617.758.97931103.81−2
Netherlands511.59.210018.667.8395.9165.810142.8123.4
United Kingdom274.7 133.617.868.3295.11141.80017498.4
Russia8.825.652.413.6333.7271158.6107695
Senegal82.35.829.38.1133.68300 41.20 0
Swaziland66.1720.9 40.9429028.400
South Africa47.69.666.711.3921.9954074.100
Sweden2516.4132.718.4211.7494.6 074.51340.951.4
Switzerland215.538.4 18.866.9496.43 0189.314
Trinidad and Tobago270.911.540.112.5931.447.5067.400
Tunisia74.422.16410.8730.9470 74.20 0
Ukraine770.422.811.4742.960036.210
Uruguay19.71028.113.8820.3859 054.20 0
Source: Own elaboration.
Table A2. Descriptive statistics by country.
NMinimum Maximum Mean Mean Deviation Variance
Australia120.00135.8043.074249.33454
Bahamas100.0065.0028.509023.53701
Brazil120.00154.4051.310854.48703
Canada100574130.16210.077
China11119767.3372.428
South Korea120.00529.40100.7542147.79425
Ecuador10 0.00 68.80 23.1370 22.86584
Spain12 0.00 109.10 53.2375 43.51692
United States of America12 −1.00 163.60 53.3608 58.33803
Estonia10 0.00 90.00 29.1730 31.69478
Eurozone9 0.00 111.80 35.6911 41.61316
Philippines12 0.00 357.70 59.1808 98.18086
Finland10 −4.00 95.10 30.4350 38.89312
France12 1.00 141.50 60.6833 56.04434
Ghana10 0.00 130.80 26.2520 39.48668
India12 0.00 454.90 96.5292 147.85946
Indonesia12 0.00 189.00 55.1450 69.76761
Iceland12 0.00 365.10 70.0925 105.64317
Israel12 0.00 410.50 64.0958 113.27797
Jamaica10 0.00 271.00 47.3220 81.85365
Japan12 −2.00 347.10 86.5650 110.49680
Kuwait10 0.00 232.20 54.9280 72.41640
Lithuania9 1 79 30.48 28.286
Madagascar10 0.00 45.29 16.7070 18.22546
Malaysia12 0.00 123.10 50.9483 47.64363
Norway8 0 128 42.45 48.564
New Zealand10 −2.00 146.00 41.3320 52.74819
Netherlands12 0.00 511.50 89.7575 142.89136
United Kingdom11 0.00 274.70 85.8891 90.36690
Russia12 0.00 95.00 36.3958 33.28043
Senegal8 0 82 28.80 26.264
Swaziland9 0.00 66.10 21.3711 22.55034
South Africa10 0.00 74.10 28.5380 29.21708
Sweden11 1 133 42.69 42.137
Switzerland8 1 216 71.30 86.845
Trinidad and Tobago10 0.00 270.90 48.1390 81.57949
Tunisia8 0 74 40.44 28.851
Ukraine10 0.00 77.00 25.1770 27.87591
Uruguay8 0.00 59.00 25.6625 20.82992
Source: Own elaboration using IBM SPSS Statistics 27 and data from Table A1.
Table A3. Frequency table of the variables.
FrequencyPercentageValid PercentageCumulative Percentage
Broad money (% of GDP)18.38.38.3
Financial sector credit to the private sector (% of GDP)18.38.316.7
Digital Readiness Index 2019 18.38.325.0
CB’s discourse on CBDC 18.38.333.3
Inhab/km2 (2018)18.38.341.7
Shadow economy, percent of GDP, 201518.38.350.0
CB speech on CBDC216.716.766.7
Search interest Keyword “CBDC” (2013–2020) annual average of the period18.38.375.0
Search Interest topic “CBDC” (2013–2020) Annual average of the period18.38.383.3
Commercial bank branches (per 100,000 adults)18.38.391.7
UNCTAD B2C E-commerce Index, Index 18.38.3100.0
Total12100.0100.0
Source: Own elaboration using IBM SPSS Statistics 27 and data from Table A1.

References

  1. Chohan, U.W. A History of Bitcoin. SSRN Electron. J. 2017. [Google Scholar] [CrossRef]
  2. Vigna, P.; Casey, M.J. The Age of Cryptocurrency: How Bitcoin and Digital Money Are Challenging the Global Economic Order; St. Martin’s Press: London, UK, 2015. [Google Scholar]
  3. Fung, E.W.; Siu-Cheong, B. Central Bank Digital Currency: Motivations and Implications; Bank of Canada, Ed.; Bank of Canada: Ottawa, ON, Canada, 2017; Available online: https://www.econstor.eu/bitstream/10419/200452/1/1008638439.pdf (accessed on 21 December 2020).
  4. Aste, T. Cryptocurrency market structure: Connecting emotions and economics. Digit. Financ. 2019, 1, 5–21. [Google Scholar] [CrossRef] [Green Version]
  5. Gkillas, K.; Bekiros, S.; Siriopoulos, C. Extreme Correlation in Cryptocurrency Markets. SSRN Electron. J. 2018. [Google Scholar] [CrossRef]
  6. De Lis, S.F.; Sebastián, J. Central Bank Digital Currencies and Distributed Ledger Technology; BBVA Research: Madrid, Spain, 2019; p. 5. Available online: http://www.bbvaresearch.com/publicaciones/las-monedas-virtuales-de-bancos-centrales-y-la-tecnologia-de-contabilidad-distribuida/ (accessed on 8 December 2020).
  7. Fung, E.W.; Siu-Cheong, B.; Hendry, S. Is a Cashless Society Problematic? Bank of Canada, Ed.; Bank of Canada: Ottawa, ON, Canada, 2018; Available online: https://www.bankofcanada.ca/wp-content/uploads/2018/10/sdp2018-12.pdf (accessed on 11 December 2020).
  8. Tercero-Lucas, D. A Global Digital Currency to Rule Them All? A Monetary-Financial View of the Facebook’s LIBRA for the Euro Area; GEAR-Graduate in Applied Economic Research-Departamento de Economí a Aplicada UAB, Ed.; Universitat Autónoma de Barcelona: Barcelona, Spain; Available online: https://ddd.uab.cat/pub/worpap/2020/232413/Gear_wp_2020_06_b.pdf (accessed on 3 December 2020).
  9. Alonso, S.L.N.; Fernández, M.; Ángel, E.; Bas, D.S.; Kaczmarek, J. Reasons Fostering or Discouraging the Implementation of Central Bank-Backed Digital Currency: A Review. Economies 2020, 8, 41. [Google Scholar] [CrossRef]
  10. Rogoff, K.S. The Curse of Cash: How Large-Denomination Bills Aid Crime and Tax Evasion and Constrain Monetary Policy; Princeton University Press: Princeton, NJ, USA, 2017. [Google Scholar]
  11. Alonso, S.L.N. Activities and Operations with Cryptocurrencies and Their Taxation Implications: The Spanish Case. Laws 2019, 8, 16. [Google Scholar] [CrossRef] [Green Version]
  12. Kumhof, M.; Noone, C. Central Bank Digital Currencies—Design Principles and Balance Sheet Implications Bank of England Working Paper No. 725; Bank of England: London, UK, 2018; Available online: https://papers.ssrn.com/sol3/papers.cfm?abstract_id=3180713 (accessed on 21 December 2020).
  13. Bank of England. Central Bank Digital CurrencyOpportunities, Challenges and Design; Bank of England: London, UK, 2020; Available online: https://www.bankofengland.co.uk/-/media/boe/files/paper/2020/central-bank-digital-currency-opportunities-challenges-and-design.pdf (accessed on 21 December 2020).
  14. Panetta, F. 21st Century Cash: Central Banking, Technological innovation, and Digital Currencies. In Do We Need Central Bank Digital Currency? Economics, Technology, and Institutions; Gnan, E., Masciandaro, D., Eds.; Bocconi University and BAFFI CAREFIN: Vienna, Austria, 2018; pp. 28–31. Available online: https://iris.unibocconi.it/retrieve/handle/11565/4014058/92065/Masciandaro%20SUERF%20book%20%2b%20SUERF%20book%20chapter.pdf (accessed on 4 December 2020).
  15. Meaning, J.; Dyson, B.; Barker, J.; Clayton, E. Broadening Narrow Money: Monetary Policy with a Central Bank Digital Currency. SSRN Electron. J. 2018. [Google Scholar] [CrossRef] [Green Version]
  16. Bindseil, U. Central Bank Digital Currency: Financial System Implications and Control. Int. J. Political Econ. 2019, 48, 303–335. [Google Scholar] [CrossRef]
  17. Auer, R.; Böhme, R. The Technology of Retail Central Bank Digital Currency; BIS Quarterly Review; BIS: Basel, Switzerland, March 2020; Available online: https://ssrn.com/abstract=3561198 (accessed on 25 November 2020).
  18. Ward, O.; Rochemont, S. Understanding Central Bank Digital Currencies (CBDC). Inst. Fac. Actuar. 2019. Available online: https://cointhinktank.com/upload/CBDC%20-%20Understanding%20CBDCs.pdf (accessed on 23 February 2021).
  19. Carney, M. The Future of Money; Bank of England, Ed.; Bloomberg HQ: London, UK; Available online: https://www.bankofengland.co.uk/-/media/boe/files/speech/2018/the-future-of-money-slides.pdf (accessed on 23 December 2020).
  20. Frost, J.; Shin, H.S.; Wierts, P. An Early Stablecoin? The Bank of Amsterdam and the Governance of Money. SSRN Electron. J. 2020. [Google Scholar] [CrossRef]
  21. Moin, A.; Sekniqi, K.; Sirer, E.G. SoK: A Classification Framework for Stablecoin Designs. arXiv 2020, arXiv:1910.10098. [Google Scholar]
  22. de Lis, S.F.; Gouveia, O. Monedas Digitales Emitidas Por Bancos Centrales: Características, Opciones, Ventajas Y Desventajas. Documento De Trabajo. Madrid: BBVA Research. 2019. Available online: https://www.bbvaresearch.com/wp-content/uploads/2019/03/WP_Monedas-digitales-emitidas-por-bancos-centrales-ICO.pdf (accessed on 23 December 2020).
  23. Raskin, M.; Yermack, D. Digital Currencies, Decentralized Ledgers, And The Future Of Central Banking; NBER Working Paper Series; National Bureau of Economic Research: Cambridge, MA, USA, 2016; Available online: http://www.nber.org/papers/w22238 (accessed on 15 December 2020).
  24. Niepelt, D. Reserves For All? Central Bank Digital Currency, Deposits, And Their (Non)-Equivalence. Cesifo Working Papers; Munich Society for the Promotion of Economic Research—CESifo GmbH: Munich, Germany, 2018; Available online: http://www.CESifo-group.org/wp (accessed on 24 November 2020).
  25. Bordo, M.; Levin, A. Central Bank Digital Currency And The Future of Monetary Policy; NBER Working Papers; National Bureau of Economic Research: Cambridge, MA, USA, 2017; Available online: http://www.nber.org/papers/w23711 (accessed on 15 November 2020).
  26. Alonso, S.L.N.; Jorge-Vazquez, J.; Forradellas, R.F.R. Detection of Financial Inclusion Vulnerable Rural Areas through an Access to Cash Index: Solutions Based on the Pharmacy Network and a CBDC. Evidence Based on Ávila (Spain). Sustainability 2020, 12, 7480. [Google Scholar] [CrossRef]
  27. Auer, R.; Cornelli, G.; Frost, J. Rise of the Central Bank Digital Currencies: Drivers, Approaches and Technologies; Bank for International Settlements, Ed.; Bank for International Settlements: Basel, Switzerland, 2020; pp. 20–21. Available online: https://www.bis.org/publ/work880.pdf (accessed on 26 December 2020).
  28. The World Bank. Population Density (People Per sq. km of Land Area). 2020. Available online: https://data.worldbank.org/indicator/EN.POP.DNST (accessed on 22 January 2021).
  29. The World Bank. Commercial Bank Branches (Per 100,000 Adults). 2020. Retrieved 22 January 2021, from The World Bank. Available online: https://data.worldbank.org/indicator/FB.CBK.BRCH.P5 (accessed on 22 January 2021).
  30. The World Bank. Monetary Sector Credit to Private Sector (% GDP). 2020. Available online: https://data.worldbank.org/indicator/FM.AST.PRVT.GD.ZS?end=2019&start=2018 (accessed on 22 January 2021).
  31. Cisco. Cisco Digital Readiness 2019. 2020. Available online: https://www.cisco.com/c/m/en_us/about/corporate-social-responsibility/research-resources/digital-readiness-index.html#/ (accessed on 22 January 2021).
  32. United Nations. Technical Notes on ICT for Development N° 15; United Nations Conference on Trade and Development: Geneva, Switzerland, 2019; Available online: https://unctad.org/system/files/official-document/tn_unctad_ict4d15_en.pdf (accessed on 8 December 2020).
  33. Arvidsson, N.; Hedman, J.; Segendorf, B. Cashless Society: When Will Merchants Stop Accepting Cash in Sweden—A Research Model. In Enterprise Applications, Markets and Services in the Finance Industry; Lecture Notes in Business Information Processing; Feuerriegel, S., Neumann, D., Eds.; Springer: Cham, Switzerland, 2017; Volume 276, Available online: https://doi.org/10.1007/978-3-319-52764-2_8 (accessed on 11 November 2020).
  34. Fabris, N. Cashless Society—The Future of Money or a Utopia? J. Central Bank. Theory Pr. 2019, 8, 53–66. [Google Scholar] [CrossRef] [Green Version]
  35. The World Bank. Broad Money (% of GDP). 2020. Available online: https://data.worldbank.org/indicator/FM.LBL.BMNY.GD.ZS (accessed on 22 January 2021).
  36. Santabárbara, J. Cálculo del tamaño de muestra necesario para estimar el coeficiente de correlación de Pearson mediante sintaxis en SPSS. REIRE Rev. d’Innovació Recer. Educ. 2021, 14. [Google Scholar] [CrossRef]
  37. Suárez, I.; Mario, O. Coeficiente de Correlación de Karl Pearson. Available online: http://repositorio.utn.edu.ec/handle/123456789/766 (accessed on 24 January 2021).
  38. Gross, J. CBDC Pioneers: Which Countries are Currently Testing a Retail Central Bank Digital Currency? Available online: https://jonasgross.medium.com/cbdc-pioneers-which-countries-are-currently-testing-a-retail-central-bank-digital-currency-49333be477f4 (accessed on 20 June 2020).
  39. Kim, G. Why is China going to issue CBDC (Central Bank Digital Currency)? J. Internet Electron. Commer. Res. 2020, 20, 161–177. [Google Scholar] [CrossRef]
  40. Chorzempa, M. China, the United States, and central bank digital currencies: How important is it to be first? China Econ. J. 2021, 1–14. [Google Scholar] [CrossRef]
  41. Berkmen, P.; Beaton, K.; Gershenson, D.; Del Granado, J.A.; Ishi, K.; Kim, M.; Kopp, E.; Rousset, M. Fintech in Latin America and the Caribbean: Stocktaking. IMF Work. Pap. 2019, 19, 1. [Google Scholar] [CrossRef] [Green Version]
  42. Wilson, M.P. El Billete Electrónico Emitido Por El BCU: Avance En Su Aplicación; Lecture, VII Jornadas de Derecho Bancocentralista; Montevideo, Uruguay; Available online: https://www.bcu.gub.uy/Comunicaciones/DraMariaPazWilson.ppt (accessed on 7 December 2020).
  43. Anderson, D.R.; Sweeney, D.J.; Williams, T.A.; Camm, J.D.; Cochran, J.J. Statistics for Business & Economics. Cengage Learning. 2016. Available online: https://www.cengage.com/c/statistics-for-business-economics-14e-anderson/9781337901062/ (accessed on 23 February 2021).
  44. Suárez, I.; Mario, O. Probabilidades y Estadística Empleando las TIC. Available online: http://repositorio.utn.edu.ec/handle/123456789/8698 (accessed on 24 January 2021).
  45. Keller, G. Statistics for Management and Economics, 10th ed.; Cengage Learning: Boston, MA, USA, 2014. [Google Scholar]
  46. Barrera, M.A.M. Uso de la correlación de spearman en un estudio de intervención en fisioterapia. Movimiento Científico 2014, 8, 98–104. [Google Scholar] [CrossRef]
  47. Zhang, L.; Lu, D.; Wang, X. Measuring and testing interdependence among random vectors based on Spearman’s ρ and Kendall’s τ. Comput. Stat. 2020, 35, 1685–1713. [Google Scholar] [CrossRef]
  48. Brossart, D.F.; Laird, V.C.; Armstrong, T.W.; Walla, P. Interpreting Kendall’s Tau and Tau-U for single-case experimental designs. Cogent Psychol. 2018, 5, 1518687. [Google Scholar] [CrossRef]
  49. European Central Bank. European Central Bank: Survey Digital Euro. Available online: https://epsilon.escb.eu/limesurvey3/434111?lang=en (accessed on 26 January 2021).
  50. European Central Bank. ECB Consultation on Digital Euro Ends with Record Number of Responses to Public Consultation. European Central Bank, Directorate General Communications Division Global Media Relations Division. Available online: https://www.bde.es/f/webbde/GAP/Secciones/SalaPrensa/ComunicadosBCE/NotasInformativasBCE/21/presbce2021_11.pdf (accessed on 12 December 2020).
  51. Fernández, M.Á.E.; Bas, D.S.; Alonso, S.L.N. Ventajas e inconvenientes de las divisas virtuales centralizadas (CBDC): Un análisis de la propuesta del Euro Digital. In XIII Congreso de Economía Austriaca; de Mariana, I.J., Marroquín, U.F., Carlos, U.R.J., Eds.; Instituto Juan de Mariana: Madrid, Spain; pp. 50–66. Available online: https://www.juandemariana.org/investigacion/archivo-de-publicaciones/revista-del-xiii-congreso-de-economia-austriaca (accessed on 24 December 2020).
  52. Blockchain, O. China Aspira a Que Los Yuanes Digitales se usen Como Moneda de Reserva. Available online: https://observatorioblockchain.com/cbdc/banco-de-china-volvera-a-repartir-yuanes-digitales-en-ciudades-para-probar-su-cbdc/ (accessed on 26 January 2021).
  53. Banque Centrale des Etats de l’Afrique de l’Ouest (BCEAO). Etablissements de Monnaie Electronique. Available online: https://www.bceao.int/fr/content/etablissements-de-monnaie-electronique (accessed on 4 January 2021).
  54. Vázquez, J.J.; Cebolla, M.P.C.; Ramos, F.S. La transformación digital en el sector cooperativo agroalimentario español: Situación y perspectivas. CIRIEC-España Rev. Econ. Pública Soc. Coop. 2019, 95, 39–70. [Google Scholar] [CrossRef] [Green Version]
  55. Alonso, S.L.N. The Tax Incentives in the IVTM and “Eco-Friendly Cars”: The Spanish Case. Sustainability 2020, 12, 3398. [Google Scholar] [CrossRef] [Green Version]
  56. Alonso, S.L.N.; Forradellas, R.R. Tax Incentives in Rural Environment as Economic Policy and Population Fixation. Case study of Castilla-León Region. In Business, Economics and Science Common Challenges; Bernat, T., Duda, J., Eds.; Filodiritto Editore: Bologna, Italy, 2020; pp. 205–210. [Google Scholar]
  57. Lee, M.; Garratt, R. Monetizing Privacy. SSRN Electron. J. 2021. [Google Scholar] [CrossRef]
  58. The Central Bank of the Bahamas. Key Players Sand Dollar—Bahamas. Available online: https://www.sanddollar.bs/keyplayers (accessed on 18 February 2021).
  59. Chan, S.; Chu, J.; Zhang, Y.; Nadarajah, S. Blockchain and Cryptocurrencies. J. Risk Financial Manag. 2020, 13, 227. [Google Scholar] [CrossRef]
  60. Polyviou, A.; Velanas, P.; Soldatos, J. Blockchain Technology: Financial Sector Applications Beyond Cryptocurrencies. Proceedings 2019, 28, 7. [Google Scholar] [CrossRef] [Green Version]
Figure 1. Initial classification of a Central Bank Digital Currency (CBDC) using the Venn diagram. Source: Own elaboration based on [12,13].
Joitmc 07 00072 g001
Figure 2. Countries with the highest Pearson correlation with the Bahamas, China, and Uruguay. Source: Own elaboration.
Joitmc 07 00072 g002
Figure 3. Countries with the highest Spearman’s Rho correlation coefficient with the Bahamas, China, and Uruguay. Source: Own elaboration.
Joitmc 07 00072 g003
Figure 4. Countries with the highest Kendall correlation coefficient with the Bahamas, China, and Uruguay. Source: Own elaboration.
Joitmc 07 00072 g004
Table 2. Pearson correlation between the Bahamas, China, and Uruguay with the rest of the countries analyzed.
Bahamas Pearson’s Correlation China Pearson’s Correlation Uruguay Pearson’s Correlation
Lithuania0.930Switzerland0.954Lithuania0.956
Uruguay0.924Malaysia0.950Estonia0.951
Estonia0.921Tunisia0.929United States0.937
Russia0.918South Africa0.922Canada0.924
South Africa0.901Eurozone0.891Bahamas0.924
Brazil0.894Japan0.850Russia0.905
United States0.886Kuwait0.772Brazil0.882
Spain0.838New Zealand0.743Finland0.827
Malaysia0.832United Kingdom0.730South Africa0.819
Finland0.829Lithuania0.706Iceland0.793
Iceland0.807Ecuador0.701Australia0.751
Tunisia0.792Australia0.699New Zealand0.715
Canada0.780Senegal0.675Malaysia0.709
Eurozone0.777South Korea0.673Sweden0.699
Ecuador0.774Bahamas0.669Norway0.676
Ukraine0.770Sweden0.664Tunisia0.656
France0.769Finland0.663Spain0.585
New Zealand0.764Estonia0.662China0.569
Sweden0.754Spain0.637Ukraine0.555
Australia0.753Norway0.615Switzerland0.549
Norway0.743France0.603Eurozone0.531
Madagascar0.714Trinidad and Tobago0.575France0.525
China0.669Uruguay0.569Ecuador0.455
Switzerland0.661Philippines0.558Japan0.422
Swaziland0.659Israel0.552Madagascar0.410
United Kingdom0.620Jamaica0.542Senegal0.364
Japan0.596Ukraine0.537United Kingdom0.327
Kuwait0.564Netherlands0.528Kuwait0.281
Senegal0.549Swaziland0.527Swaziland0.272
Indonesia0.465Ghana0.454Indonesia0.150
Ghana0.446Brazil0.438South Korea0.144
South Korea0.428Madagascar0.428Jamaica0.132
Jamaica0.410India0.400Ghana0.120
Trinidad and Tobago0.406Russia0.384Israel0.118
Israel0.392United States0.369Trinidad and Tobago0.117
Netherlands0.355Indonesia0.316Netherlands0.075
Philippines0.343Canada0.169Philippines0.057
India0.306Iceland0.097India0.028
Source: Own elaboration using IBM SPSS Statistics 27 and data from Table A1.
Table 3. Rho Spearman correlation between the Bahamas, China, and Uruguay with the rest of the countries analyzed.
Bahamas Rho Spearman Correlation Coefficient China Rho Spearman Correlation Coefficient Uruguay Rho Spearman Correlation Coefficient
Uruguay0.976Malaysia0.989Bahamas0.976
Brazil0.942South Africa0.962Estonia0.976
Estonia0.936South Korea0.955Lithuania0.929
Lithuania0.929Japan0.936Brazil0.905
South Africa0.926Finland0.900Russia0.905
Russia0.924Trinidad and Tobago0.895South Africa0.905
Malaysia0.869Kuwait0.883Finland0.857
United States of America0.867Israel0.882United States0.810
Finland0.863Philippines0.873Malaysia0.810
Iceland0.851Estonia0.867Norway0.786
Trinidad and Tobago0.841Lithuania0.862Sweden0.786
Norway0.833Switzerland0.857China0.762
Sweden0.833Tunisia0.857Iceland0.762
Philippines0.830Sweden0.842Jamaica0.762
South Korea0.827Jamaica0.833Trinidad and Tobago0.738
Indonesia0.827New Zealand0.833Indonesia0.714
Israel0.827United Kingdom0.806Israel0.714
Jamaica0.827Bahamas0.800Australia0.690
New Zealand0.827Eurozone0.786South Korea0.690
Ecuador0.816India0.782Ecuador0.690
Australia0.815Uruguay0.762Philippines0.690
Kuwait0.806Netherlands0.755New Zealand0.690
Spain0.802Ecuador0.745Ukraine0.690
India0.802Norway0.738India0.667
China0.800Australia0.736Tunisia0.667
Eurozone0.795Brazil0.733Canada0.643
Madagascar0.791United States0.727Spain0.643
Ghana0.779Indonesia0.718Madagascar0.643
France0.778Senegal0.714Senegal0.643
Ukraine0.772France0.709Ghana0.619
Canada0.762Spain0.700Eurozone0.607
Japan0.733Ukraine0.695Kuwait0.595
Switzerland0.729Ghana0.661Netherlands0.571
Switzerland0.714Madagascar0.611France0.548
Swaziland0.712Swaziland0.611Japan0.548
Tunisia0.695Canada0.588Switzerland0.536
Tunisia0.690Russia0.573Switzerland0.464
Senegal0.619Iceland0.545Swaziland0.429
Source: Own elaboration using IBM SPSS Statistics 27 and data from Table A1.
Table 4. Kendall’s rank correlation between the Bahamas, China and Uruguay with the rest of the countries analyzed.
Bahamas Kendall’s Correlation China Kendall’s Correlation Uruguay Kendall’s Correlation
Uruguay0.929Malaysia0.954Bahamas0.976
Brazil0.854South Africa0.873Estonia0.976
Lithuania0.817South Korea0.855Lithuania0.929
Estonia0.809Japan0.818Brazil0.905
Russia0.809Finland0.778Russia0.905
South Africa0.782Trinidad and Tobago0.761South Africa0.905
Malaysia0.719Philippines0.745Finland0.857
Trinidad and Tobago0.690Estonia0.722United States0.810
United States of America0.689Kuwait0.722Malaysia0.810
Philippines0.689Switzerland0.714Norway0.786
South Korea0.674Tunisia0.714Sweden0.786
Finland0.674Israel0.709China0.762
Indonesia0.674Lithuania0.704Iceland0.762
Iceland0.674United Kingdom0.689Jamaica0.762
Israel0.674Sweden0.689Trinidad and Tobago0.738
Jamaica0.674Bahamas0.667Indonesia0.714
China0.667Jamaica0.667Israel0.714
Sweden0.667New Zealand0.667Australia0.690
Kuwait0.644Uruguay0.643South Korea0.690
Ecuador0.644India0.600Ecuador0.690
Madagascar0.644Ecuador0.592Philippines0.690
Norway0.643Ukraine0.592New Zealand0.690
Spain0.629Brazil0.587Ukraine0.690
France0.629Norway0.571India0.667
India0.629Senegal0.571Tunisia0.667
Ghana0.598Australia0.564Canada0.643
Eurozone0.592Netherlands0.564Spain0.643
Australia0.584Ghana0.535Madagascar0.643
New Zealand0.584United States0.527Senegal0.643
Ukraine0.584Eurozone0.500Ghana0.619
Canada0.571France0.491Eurozone0.607
Switzerland0.571Indonesia0.491Kuwait0.595
Tunisia0.571Madagascar0.479Netherlands0.571
Swaziland0.551Swaziland0.473France0.548
Japan0.511Spain0.455Japan0.548
Netherlands0.494Canada0.422Switzerland0.536
United Kingdom0.479Russia0.418
Senegal0.429Iceland0.345Swaziland0.429
Source: Own elaboration using IBM SPSS Statistics 27 and data from Table A1.
Publisher’s Note: MDPI stays neutral with regard to jurisdictional claims in published maps and institutional affiliations.

