Effectiveness Improvement in Manufacturing Industry; Trilogy Study and Open Innovation Dynamics

 ,
, 
 ,
,  ,
,  and
and 
Abstract
:1. Introduction
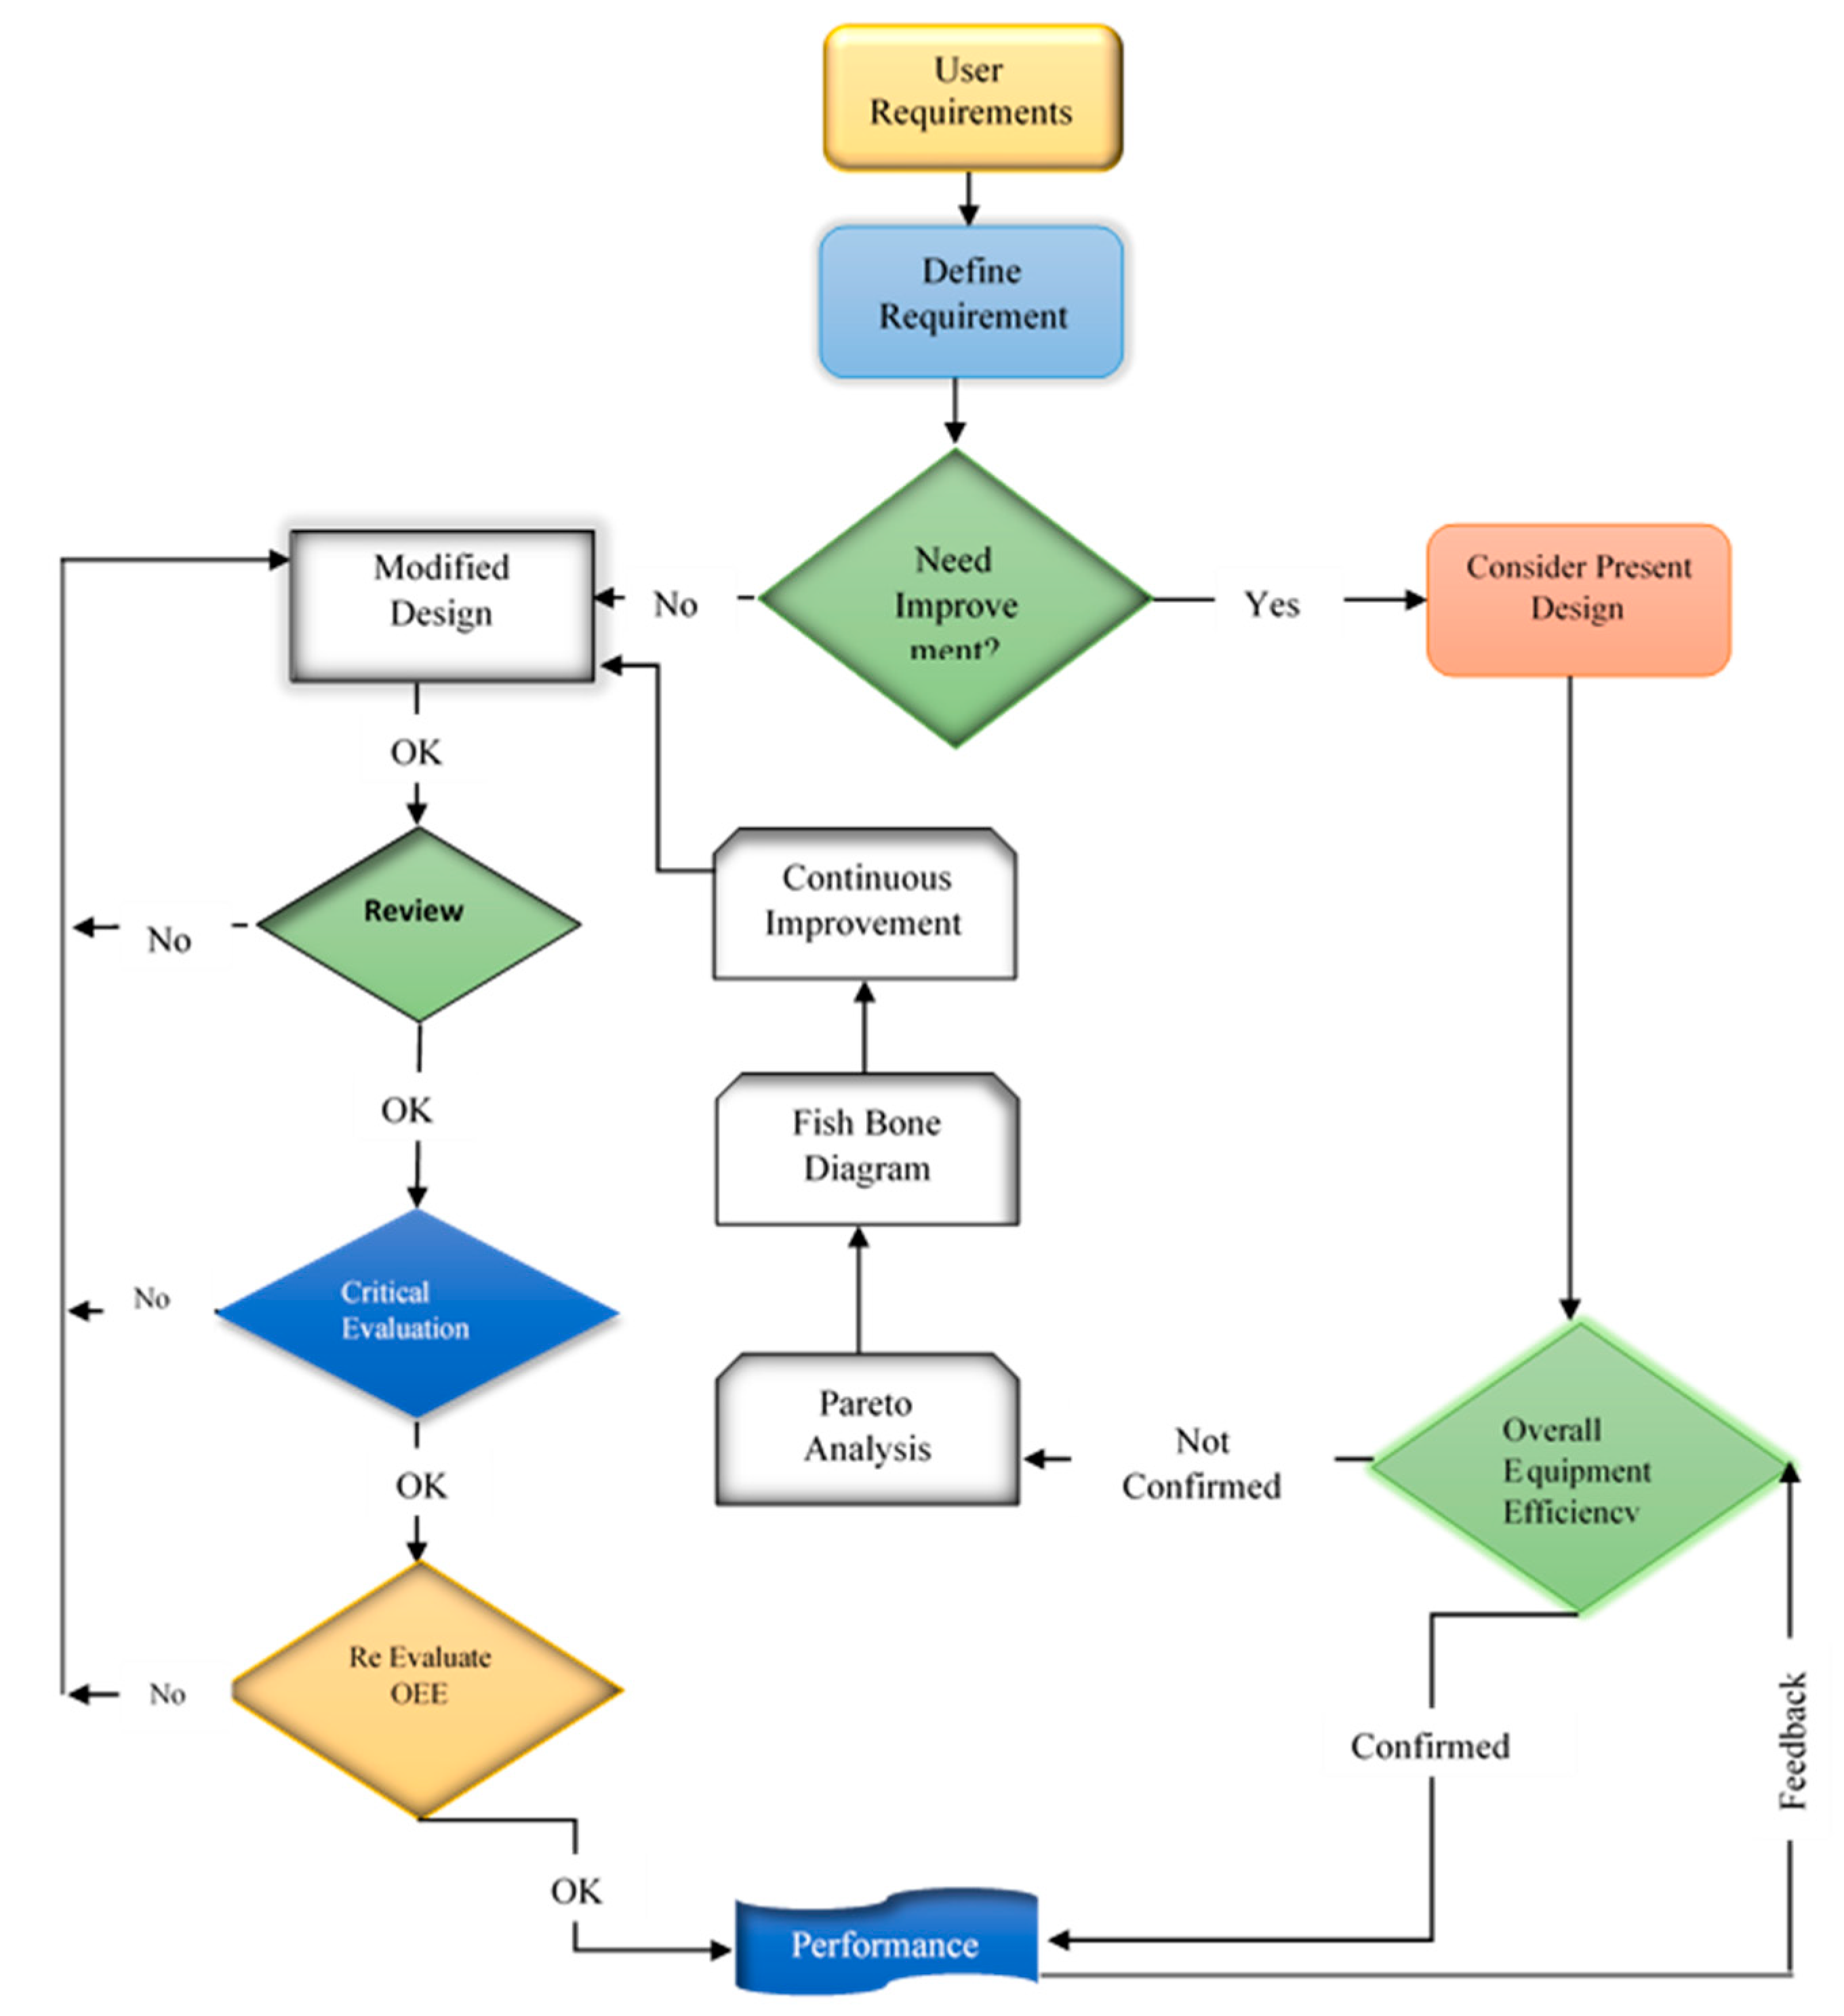
2. Materials and Methods
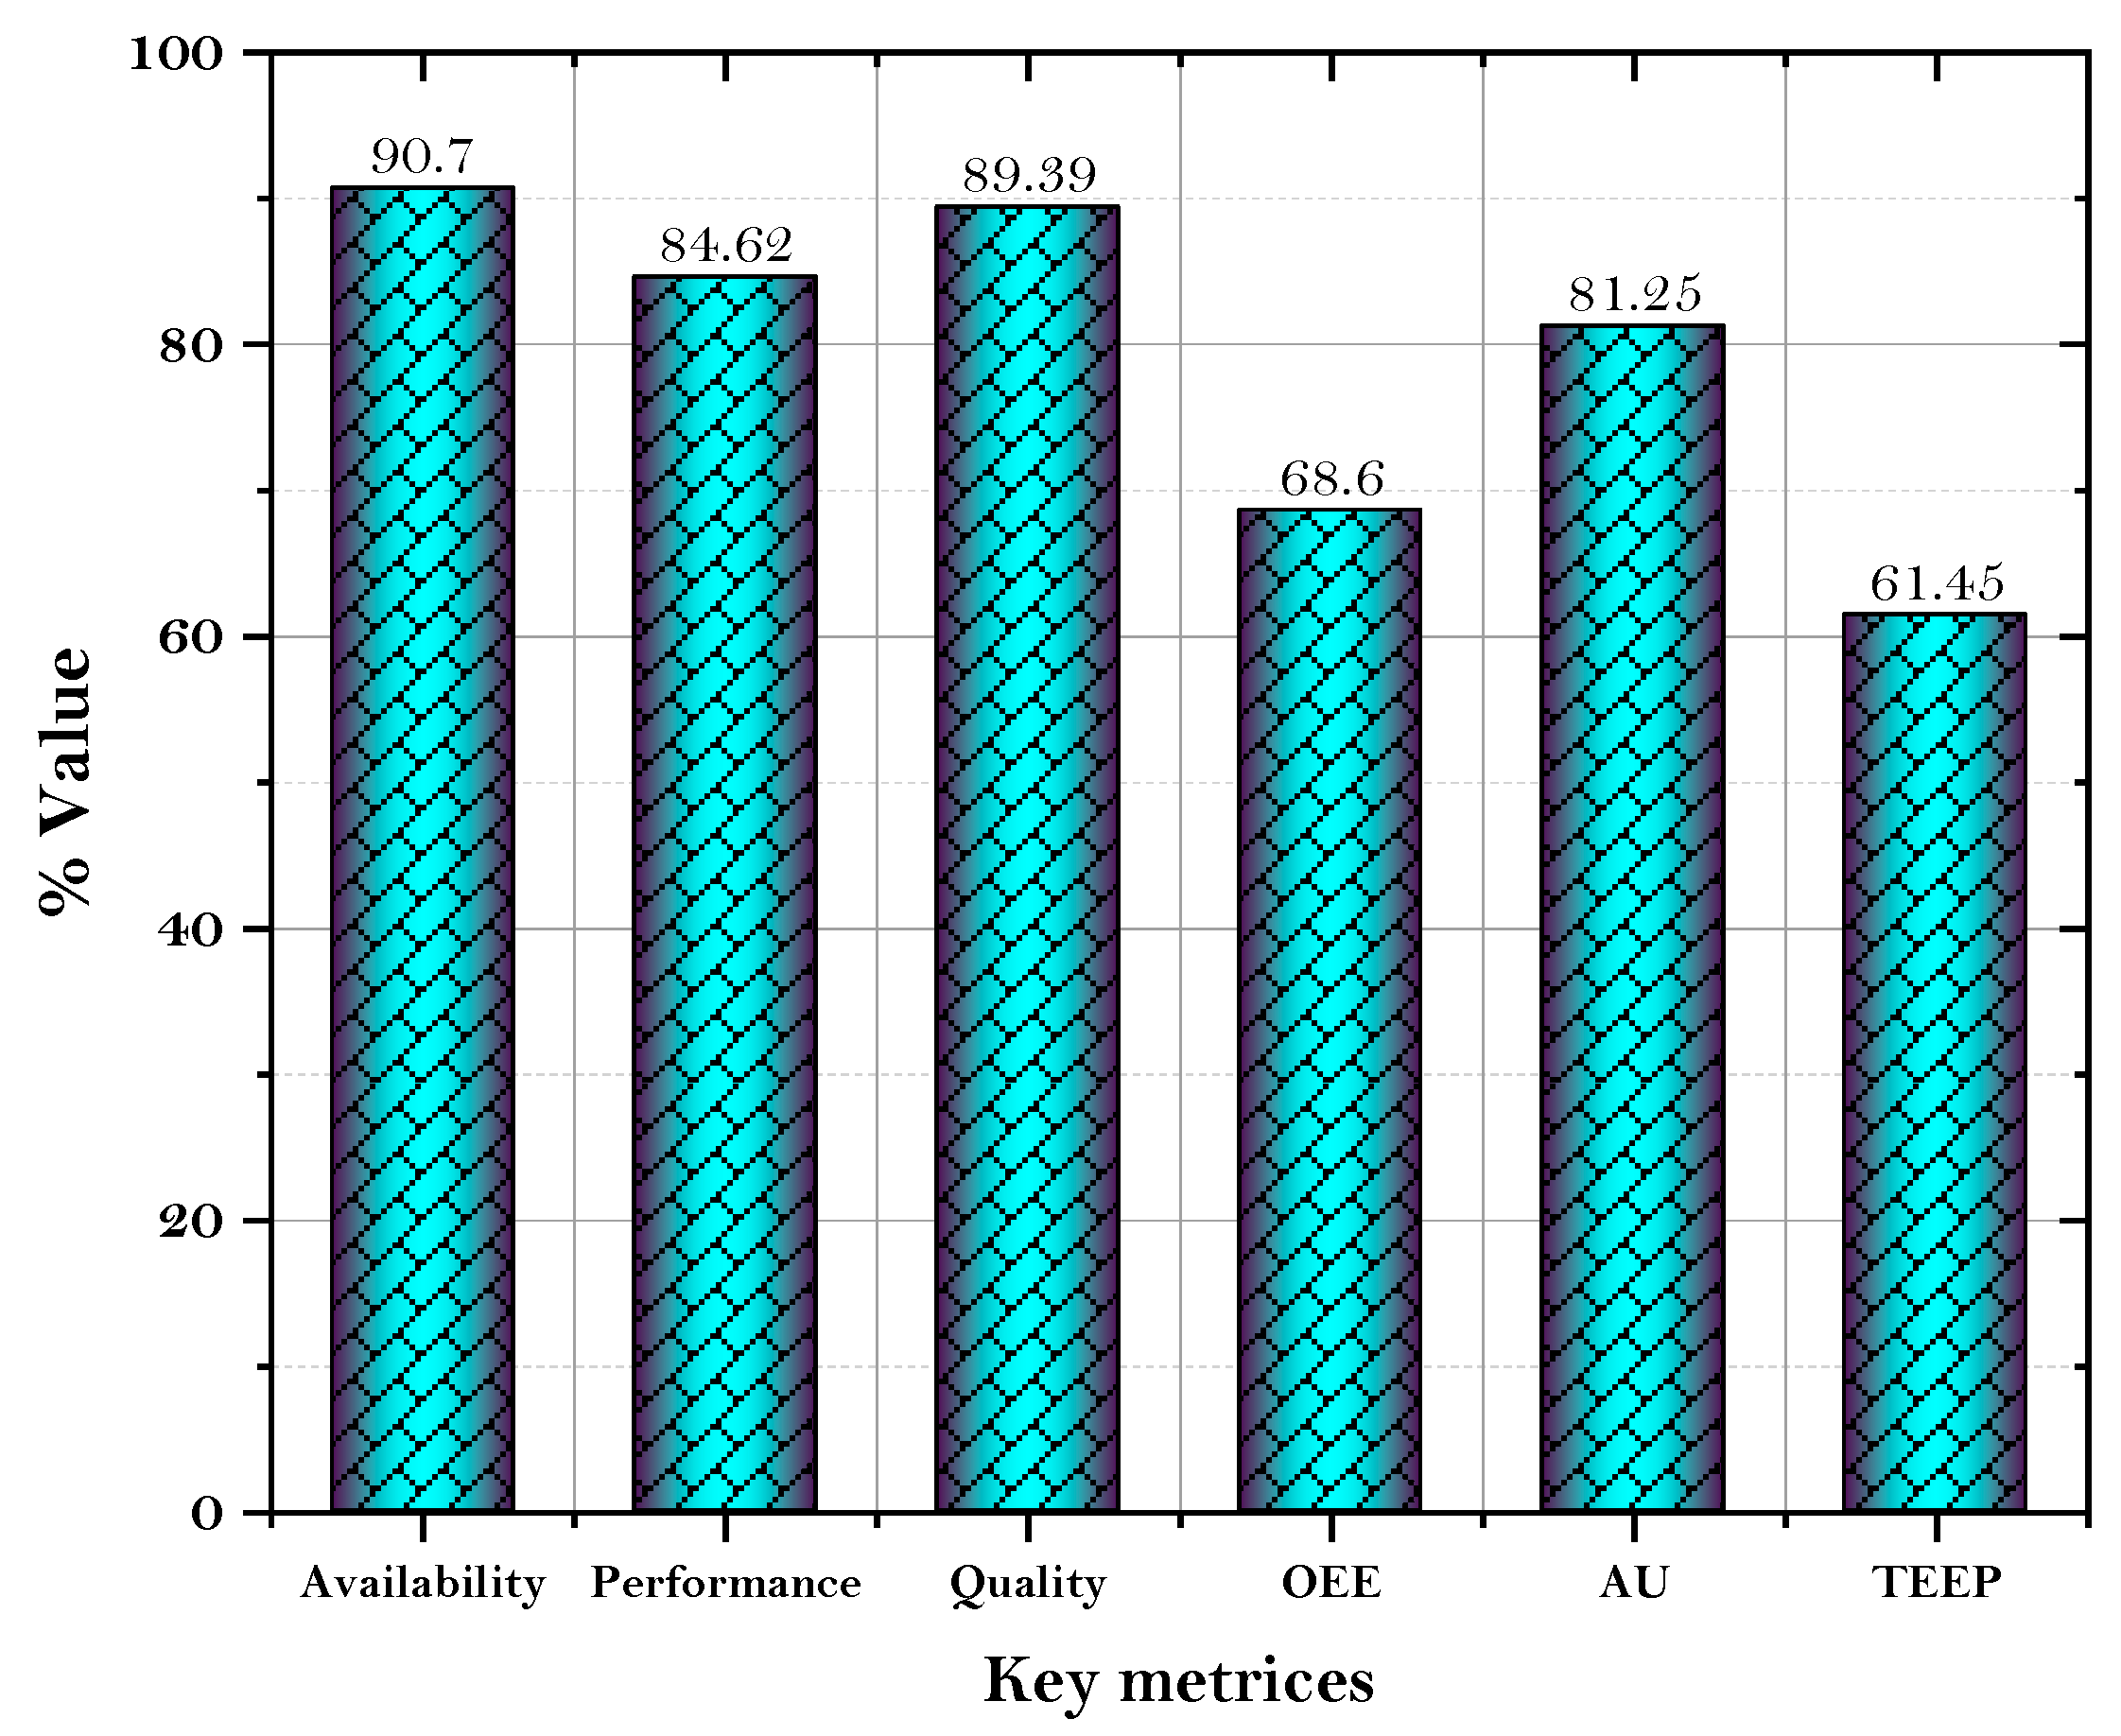
Overall Equipment Effectiveness
3. Results and Discussion
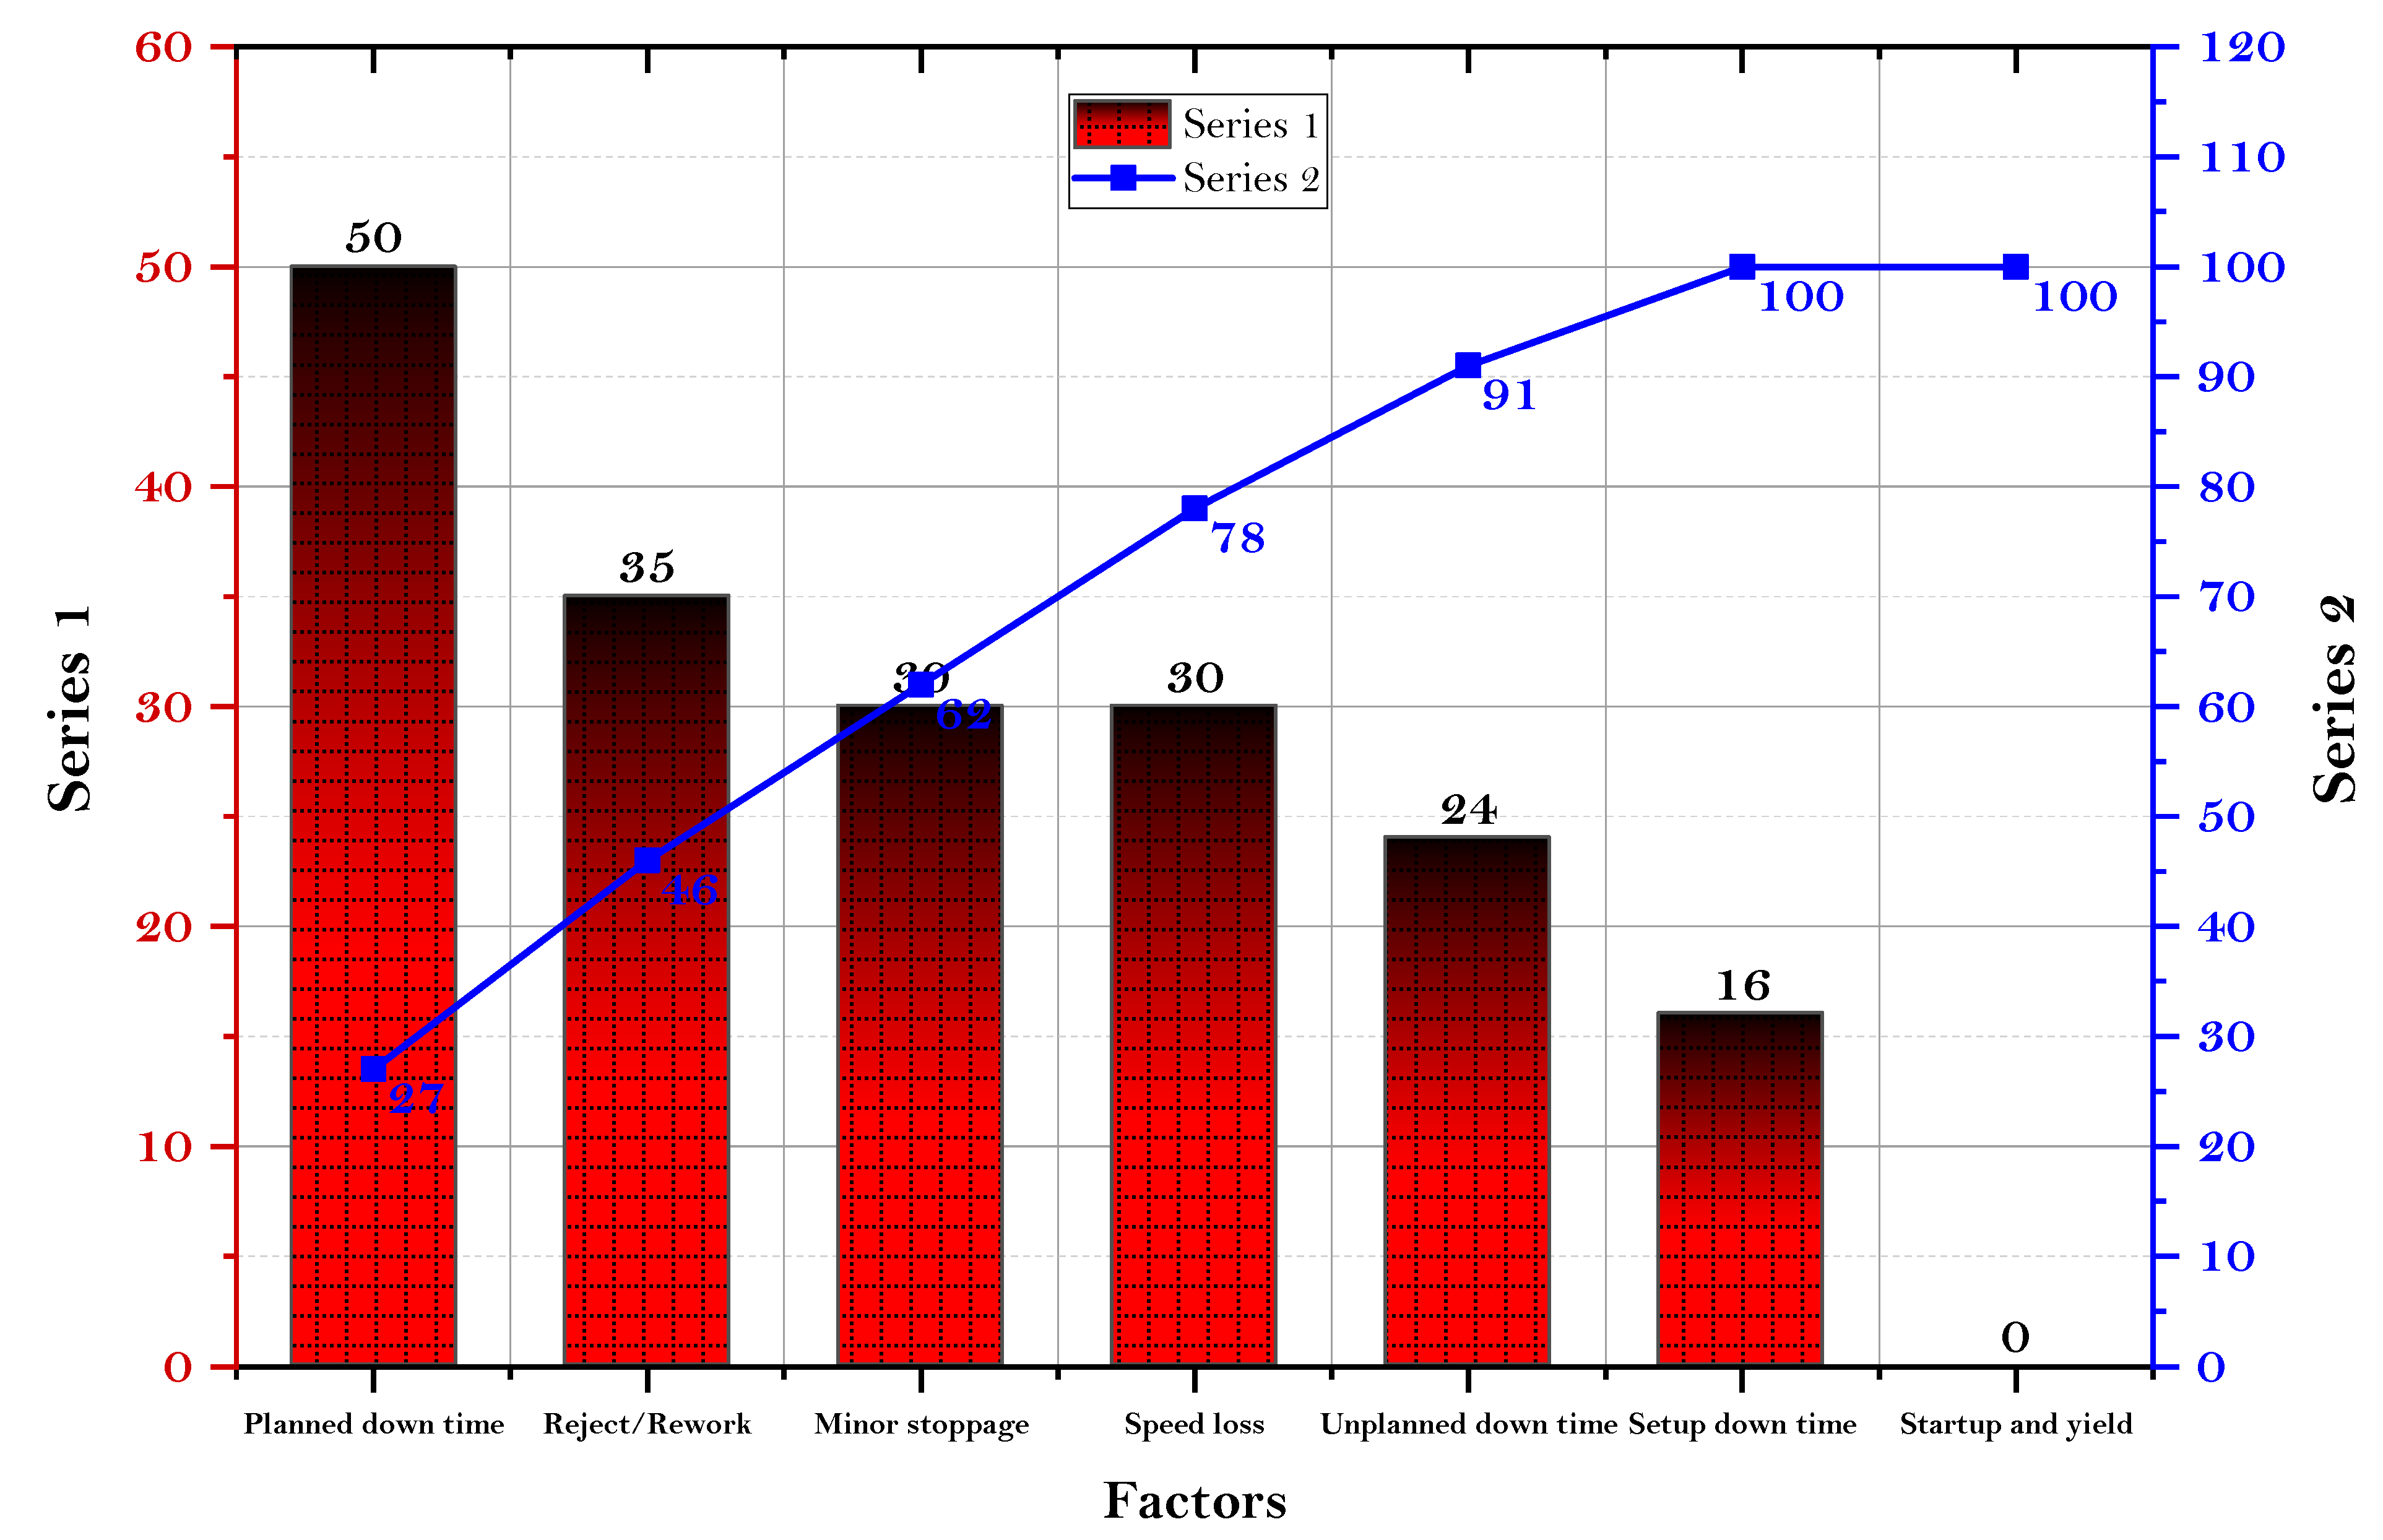
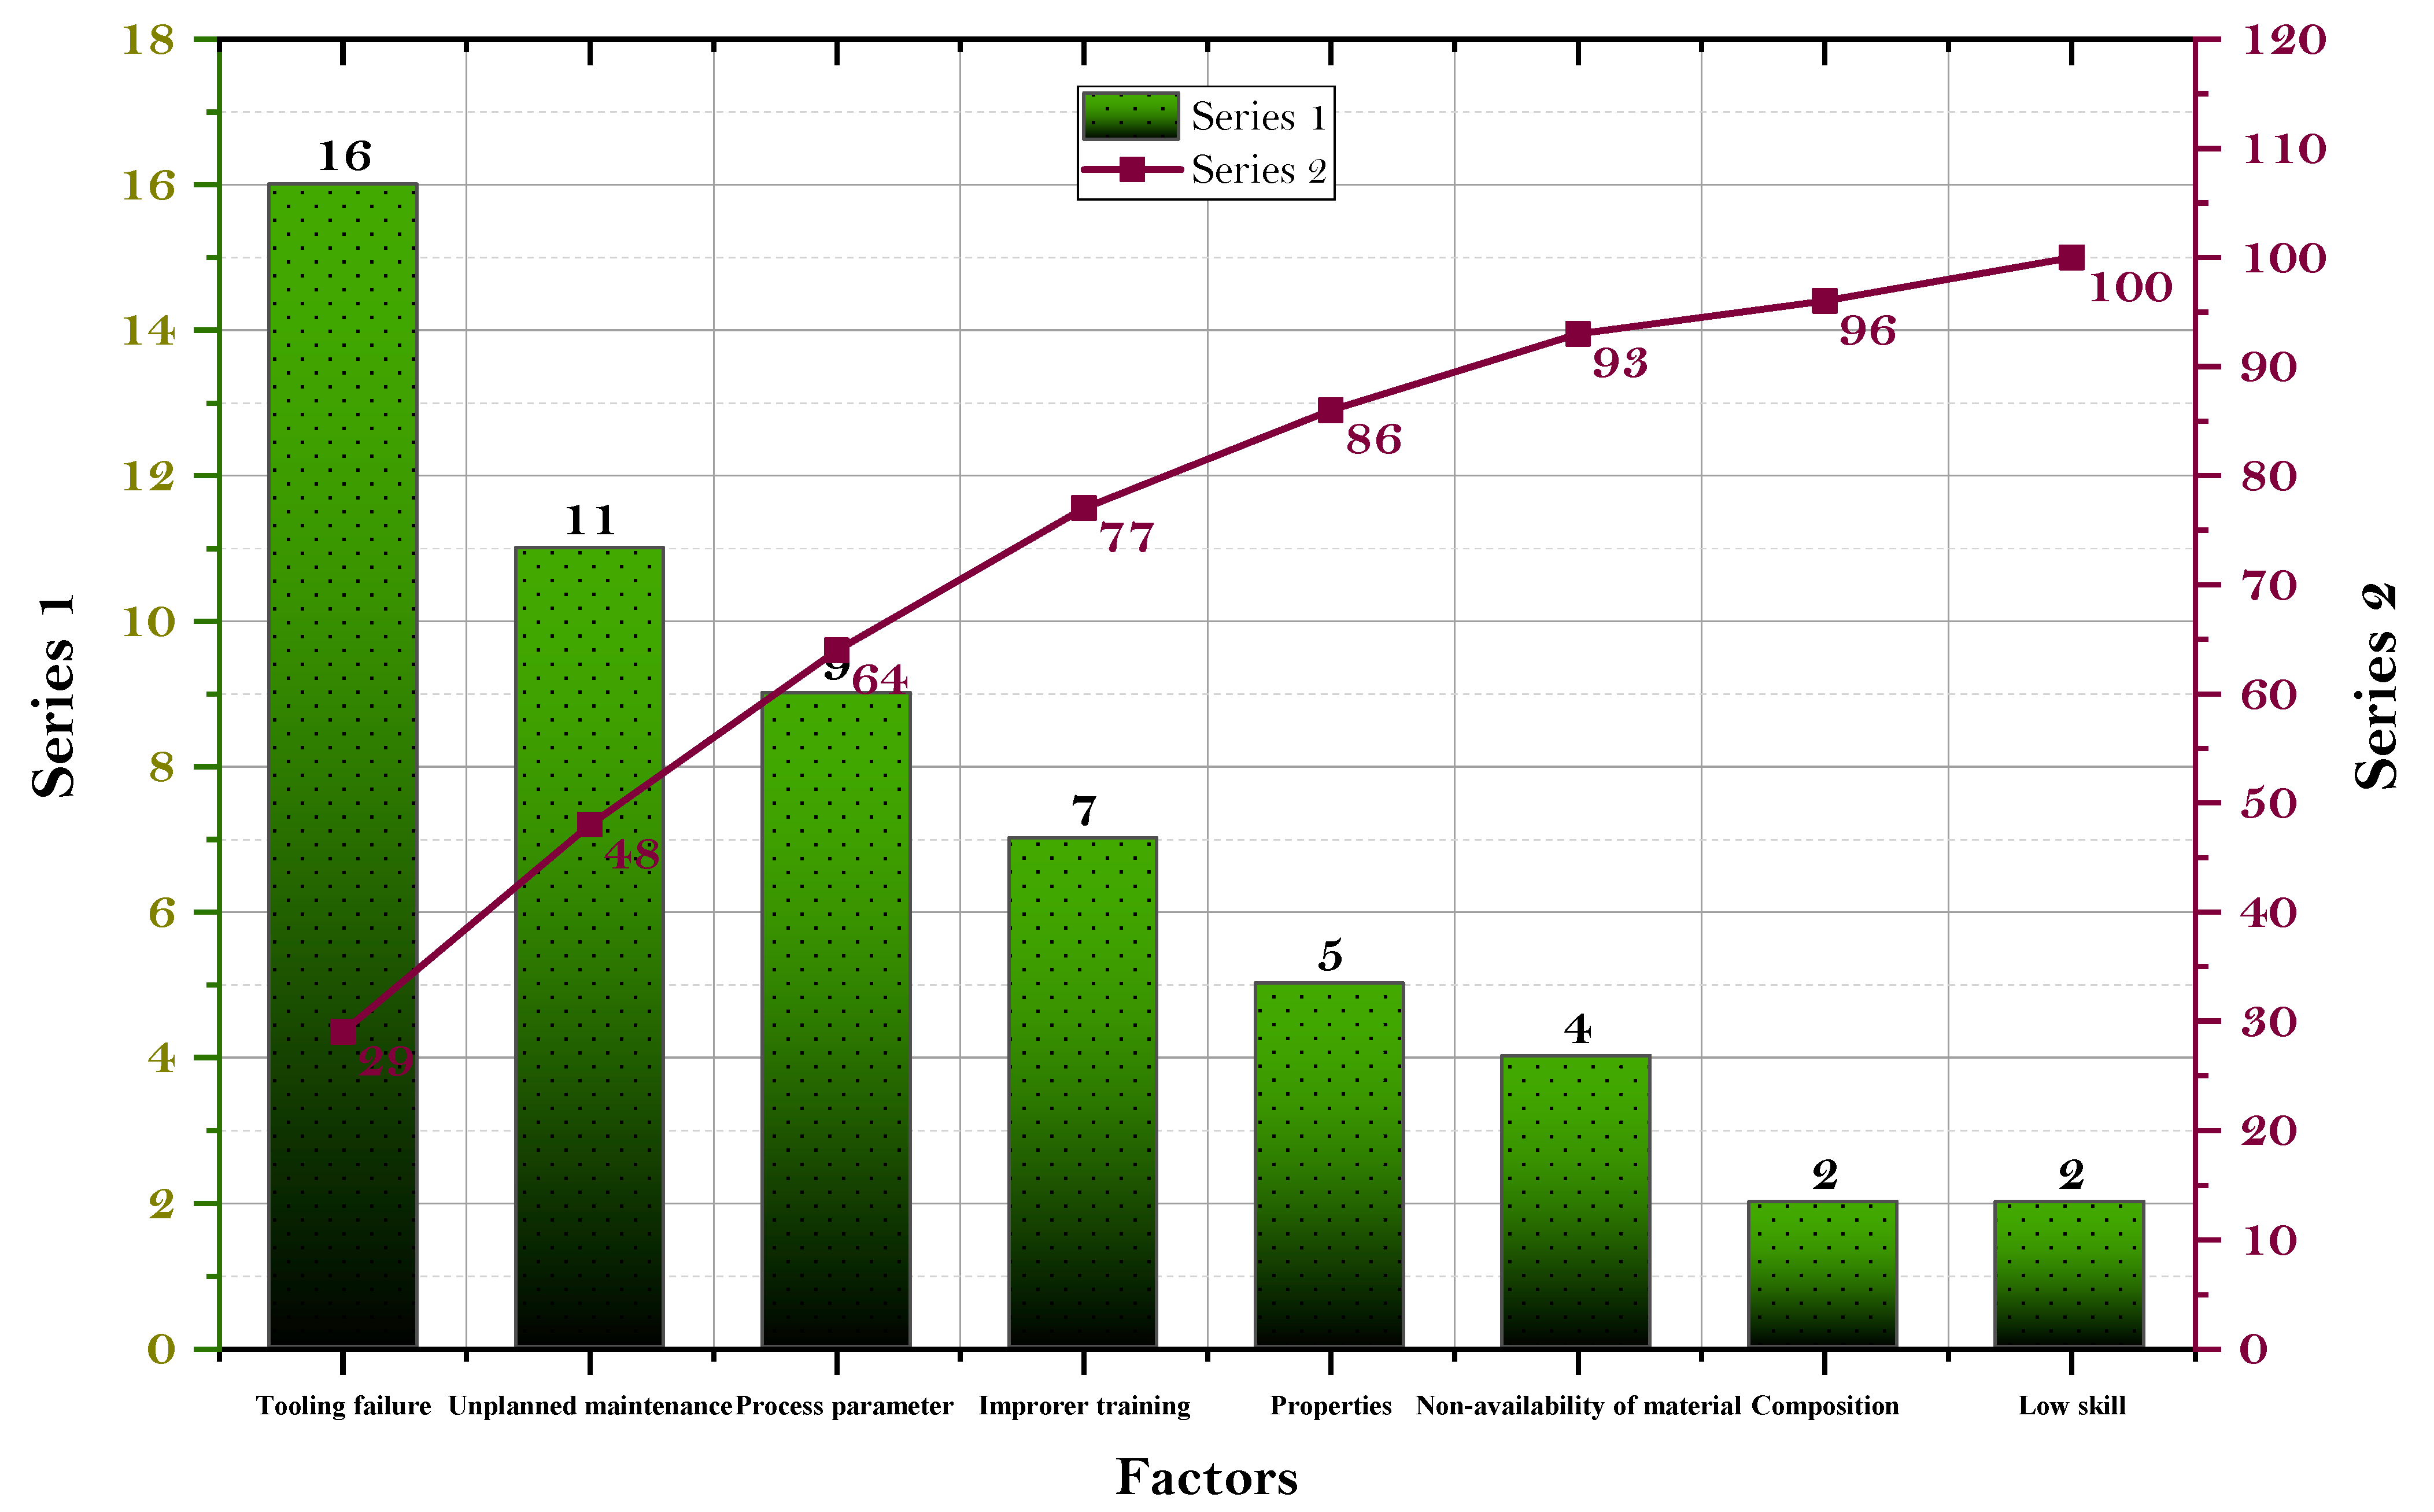
3.1. Pareto Analysis
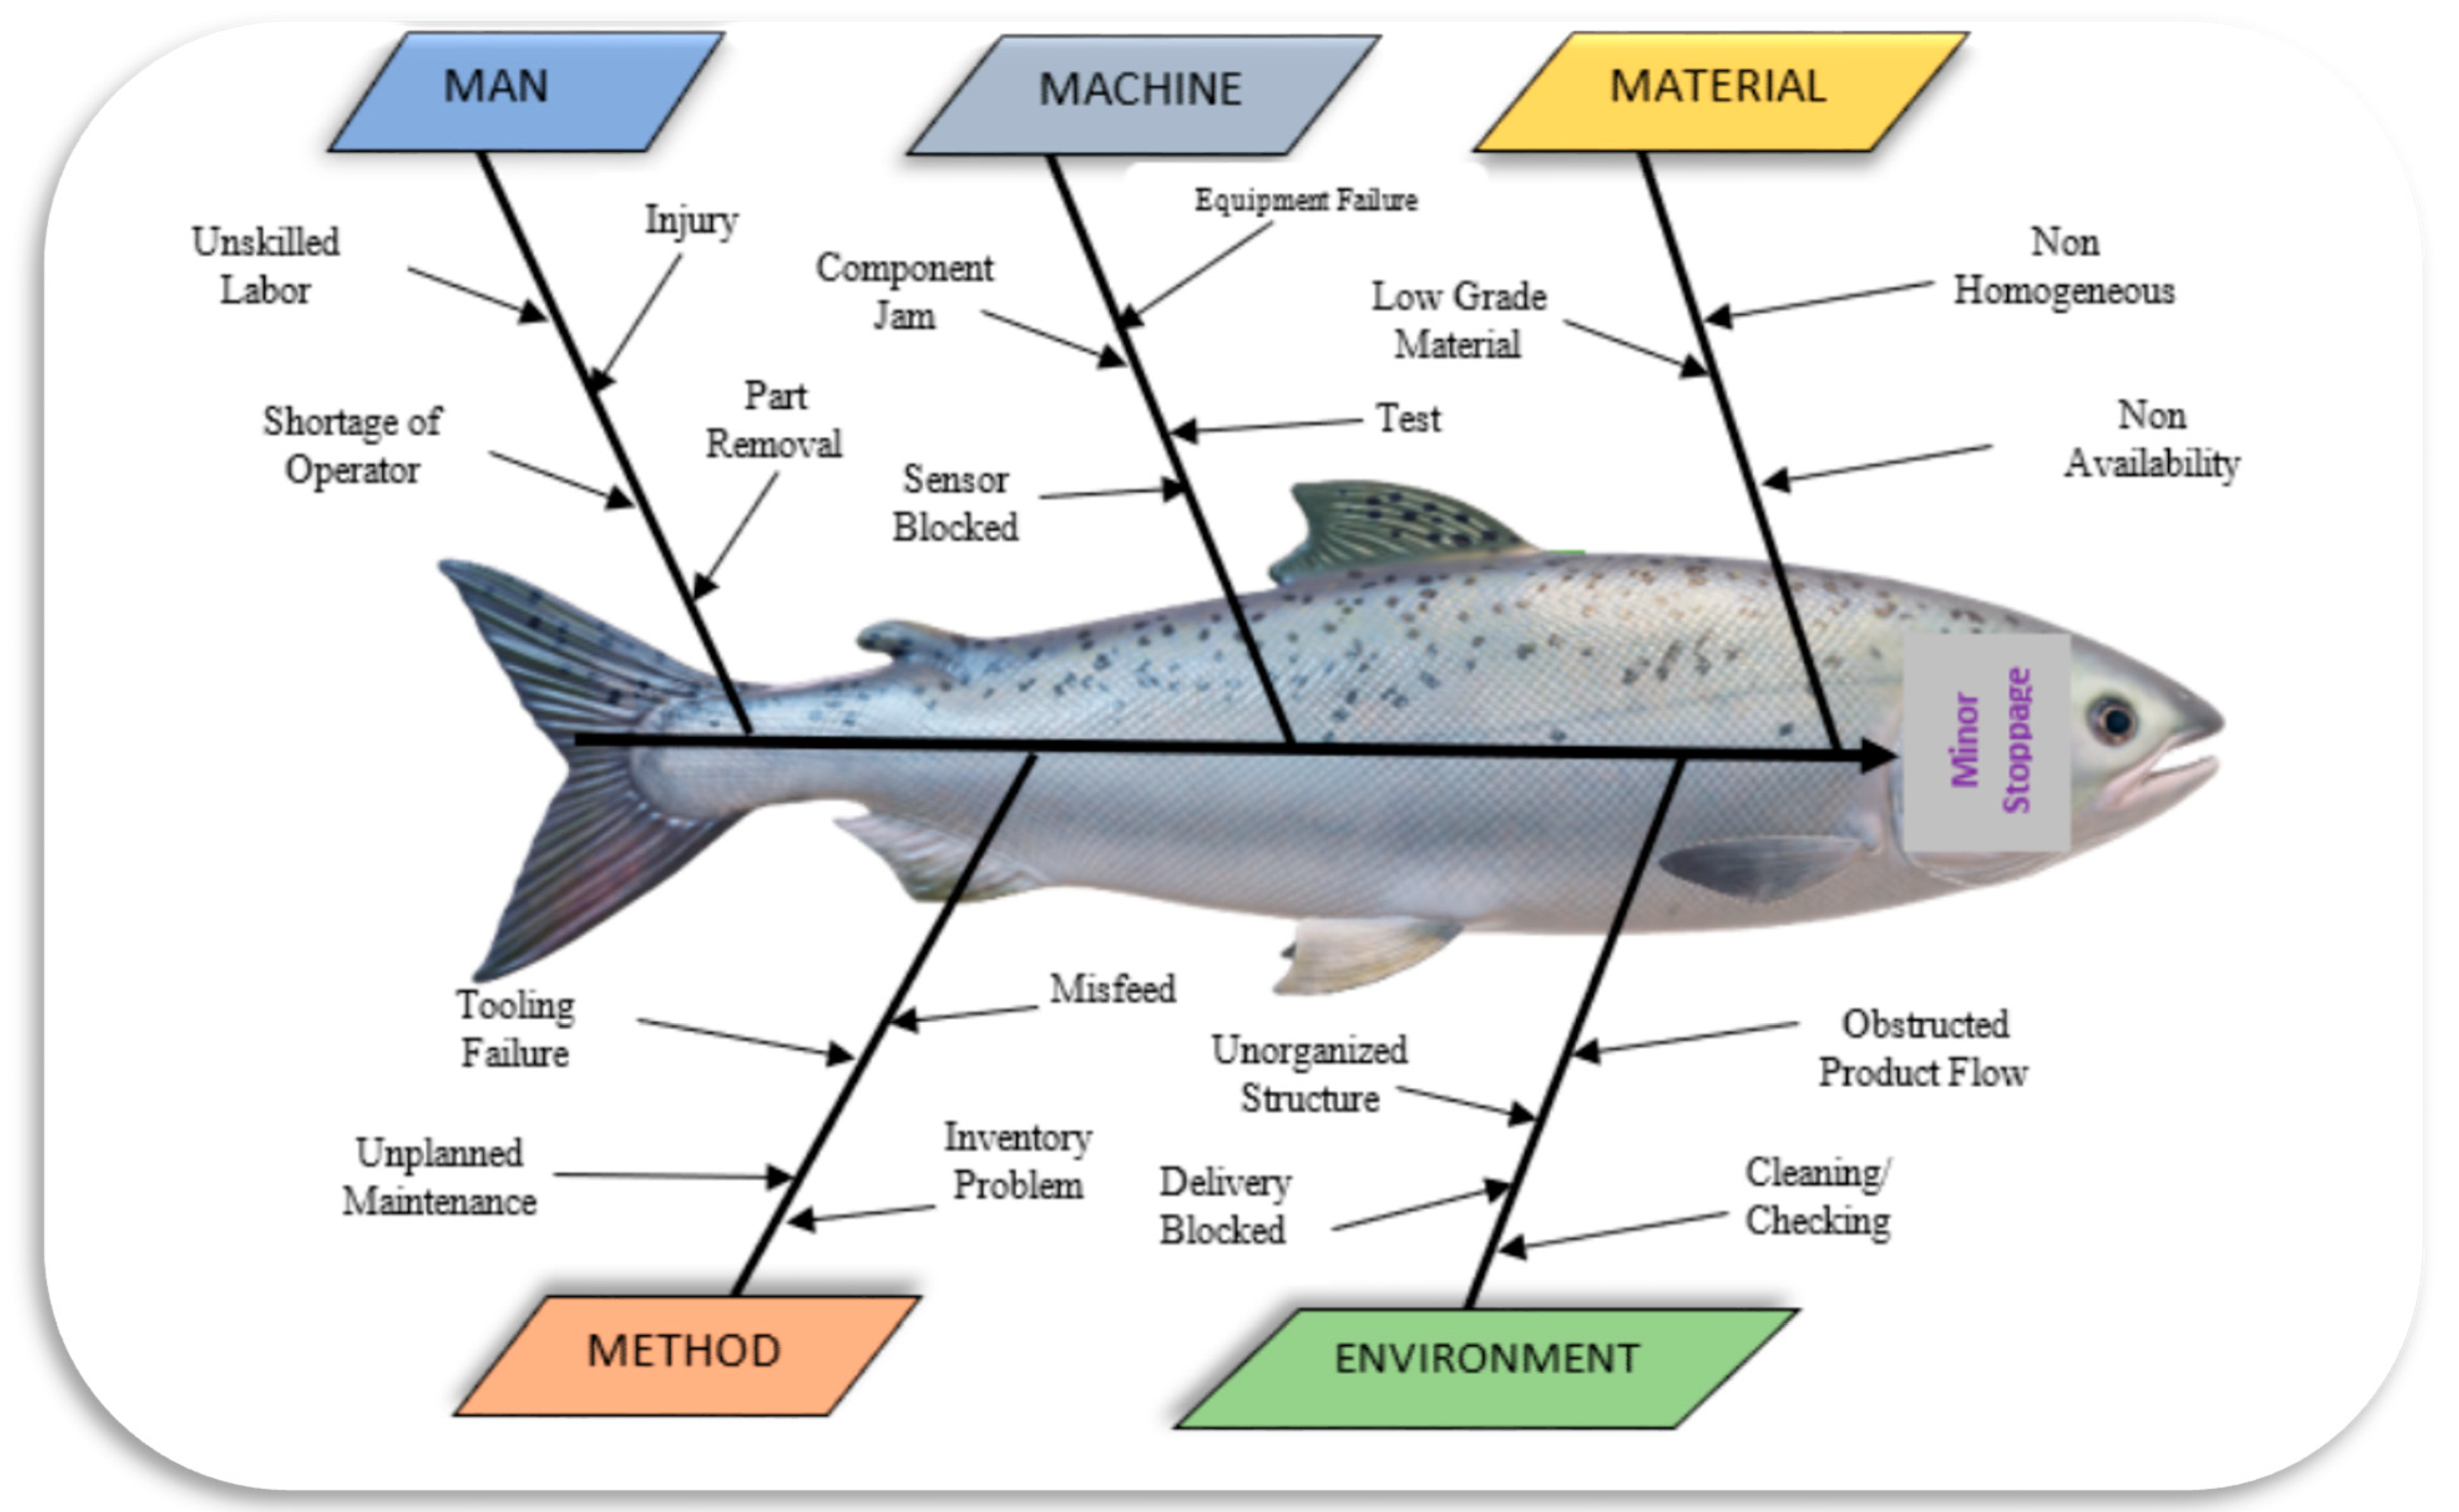
3.2. Fish Bone Diagram (FBD) Analysis
- The problem that was analyzed must be put into the right side of the fishbone diagram, sketch the skeleton with right side pointed arrow.
- The effective causes of the problem, e.g., method, material, man, environment, and machine, are categorized into the main fishbone.
- The main causes as mentioned in the second step need to be excavated thoroughly. The consequent causes are treated as middle fishbone and one cause represents one fishbone only.
- The cause is further expanded until it reaches its maximum. The numerous branches can be draw laterally on the skeleton through middle and small fishbone. Use an appropriate name and place with arrows.
- This complete step-by-step procedure is called FBD as it looks like a spiky fishbone.
3.3. OEE Improvement Practices
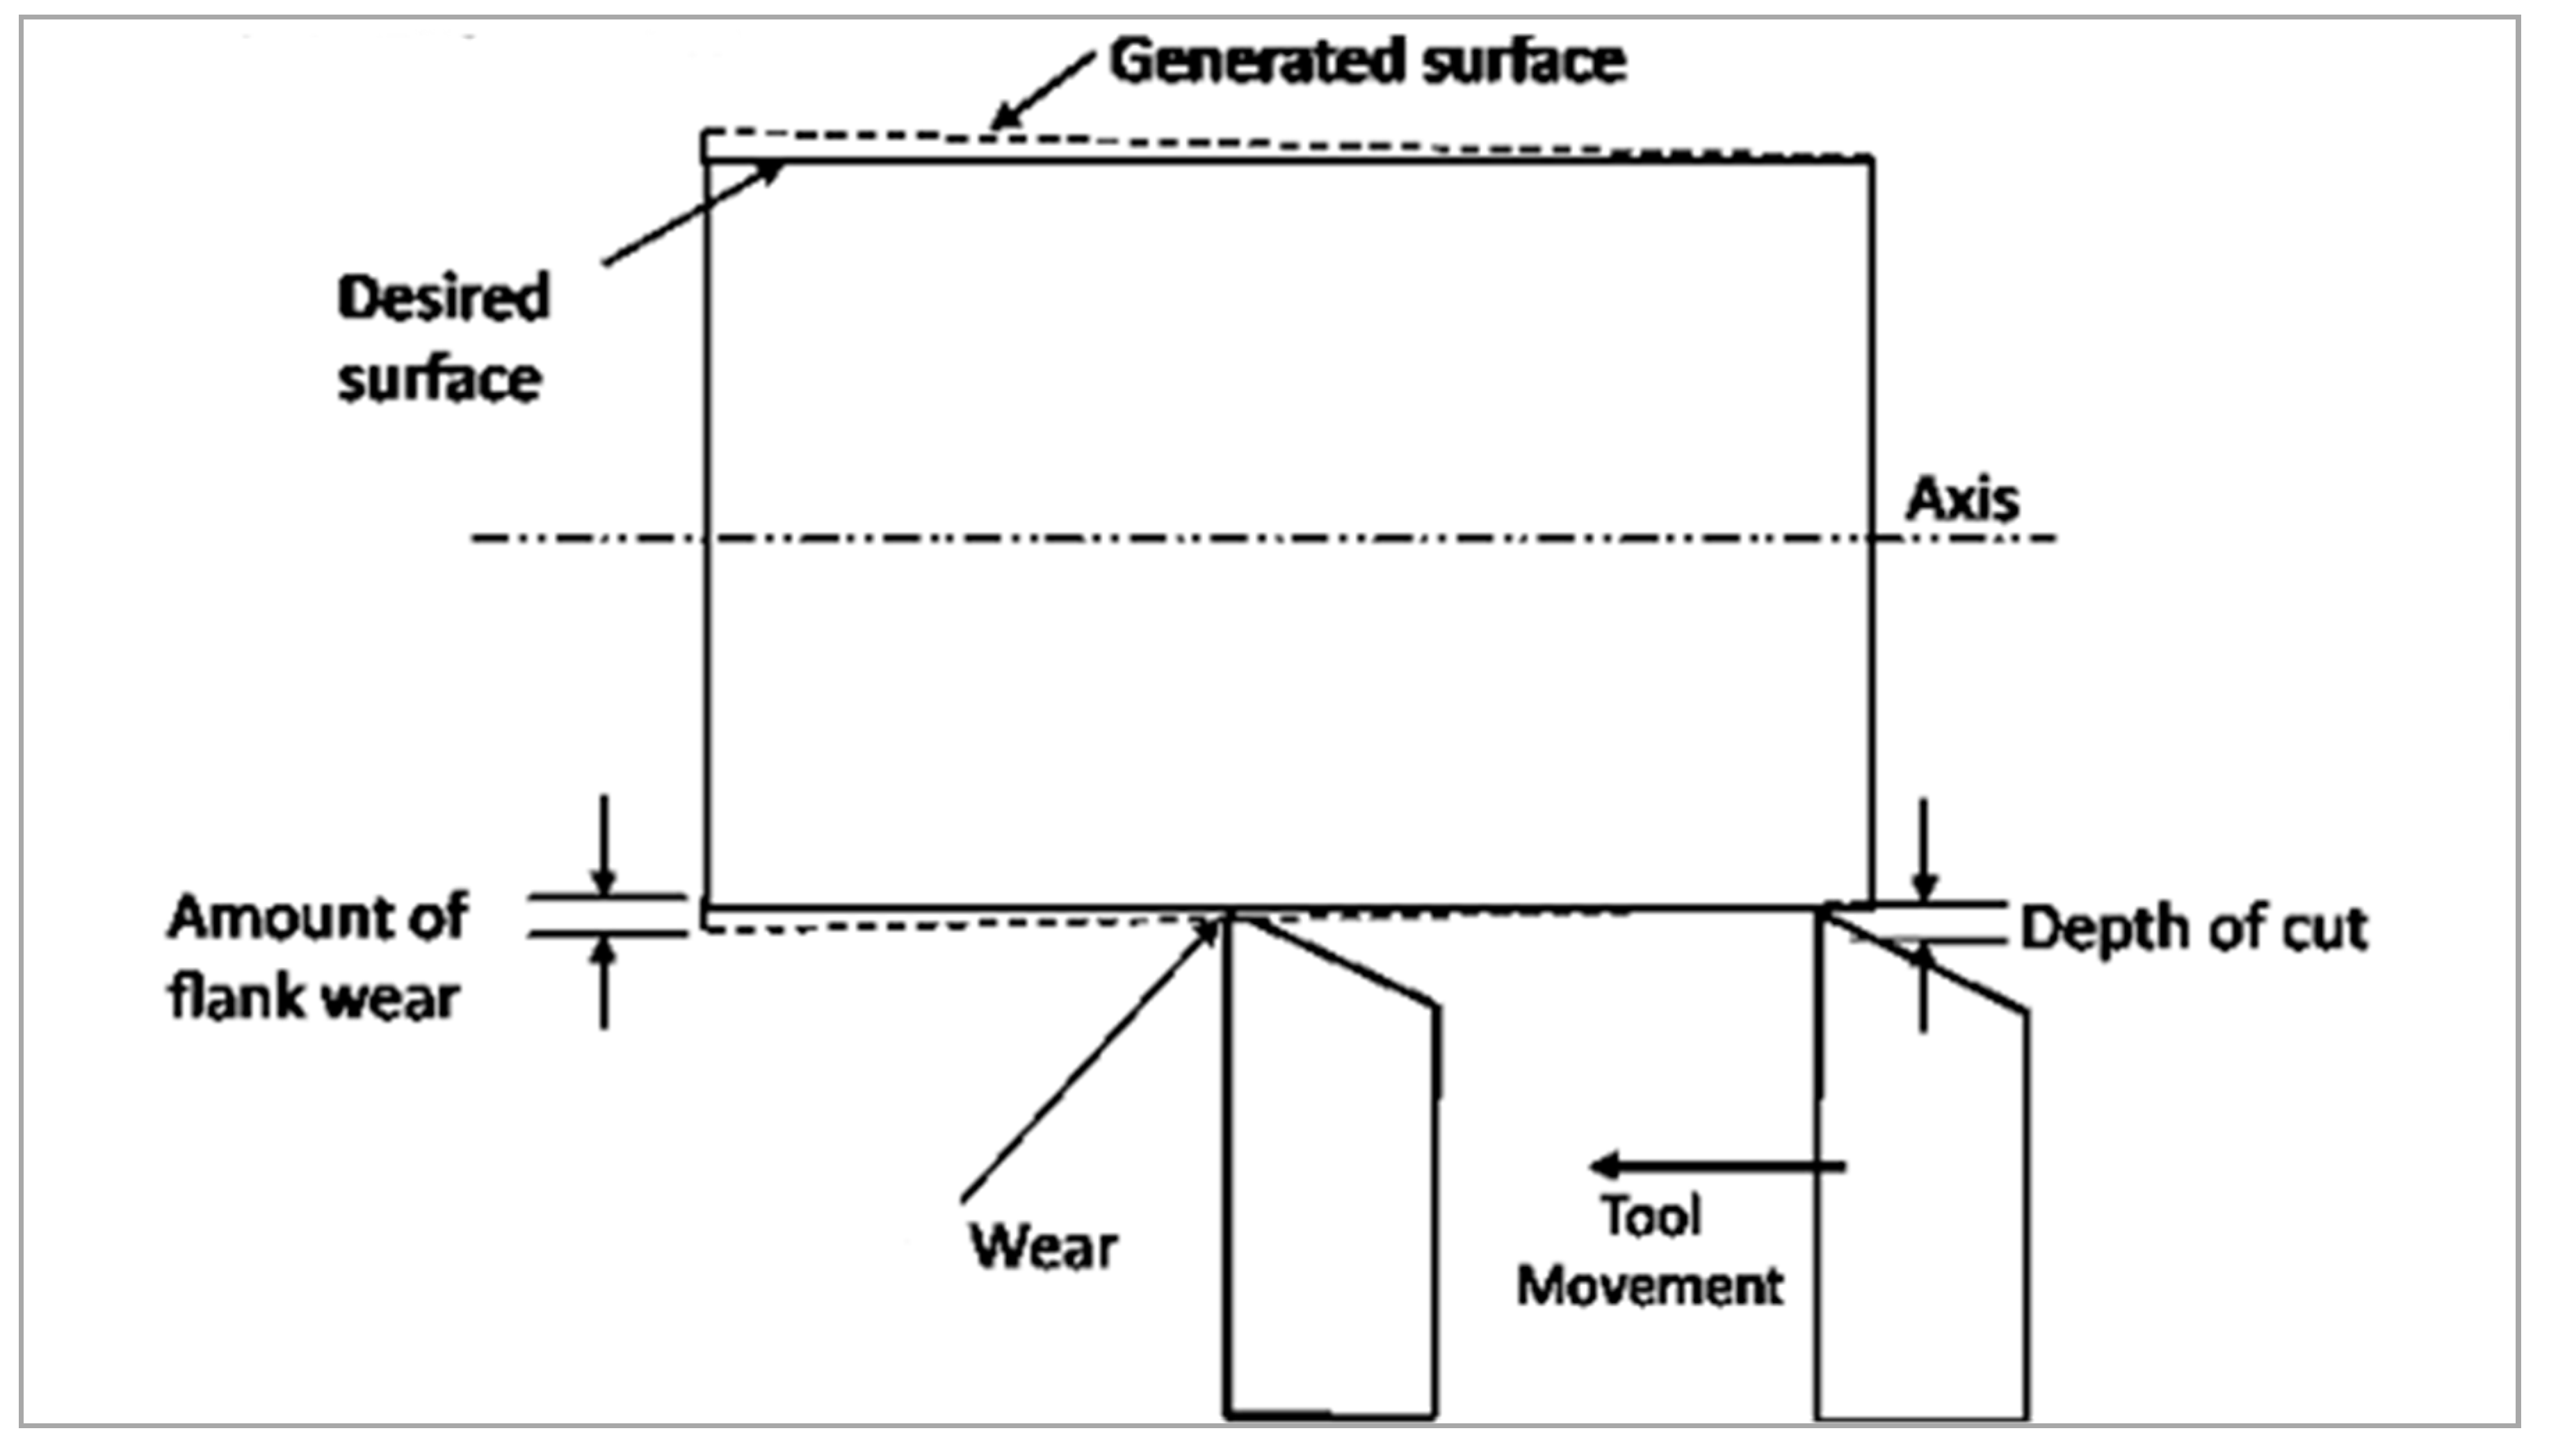
3.3.1. Tooling Failure
3.3.2. Unplanned Maintenance
- Improve interchangeability: This concept is useful in lowering maintenance time; the inclusion of interchangeability during replacing and removing parts consumes less time and further extends planned production time.
- Improve fault acknowledgement, position, isolation: These three main activities consume the most time in the industry. Faults can be timely acknowledged and positioned through effective maintenance procedure and well-trained personnel employed in the industry. Effective training helps to diagnose and locate the fault through minimal efforts within the system. Vibration monitoring, oil particle analysis, and thermal imaging are some of the approaches by which faults can be easily positioned and isolated. An effective troubleshooting procedure easily monitors and recognizes the fault. The indisputable fault isolation provides more accuracy in the time.
- Human factors: The ergonomically designed components help to mitigate the corrective maintenance time. The various components, pointers, and dials must be arranged ergonomically on the machine as per their size, shape, and weight criterion. This practice reduces efforts as well as time to convert failure state into operational state within minimal time.
- Use redundancy: The redundancy in the system will reduce the load on the production line in case of breakdown or failure in the line. The redundant components can be exchanged any time for the period of failure of the specific component for maintaining continuity in the system. Even though whole maintenance may not be affected, the equipment downtime decreases appreciably.
3.3.3. Process Parameters
3.3.4. Improper Training
3.3.5. 5’S Methodology
3.3.6. Autonomous Maintenance
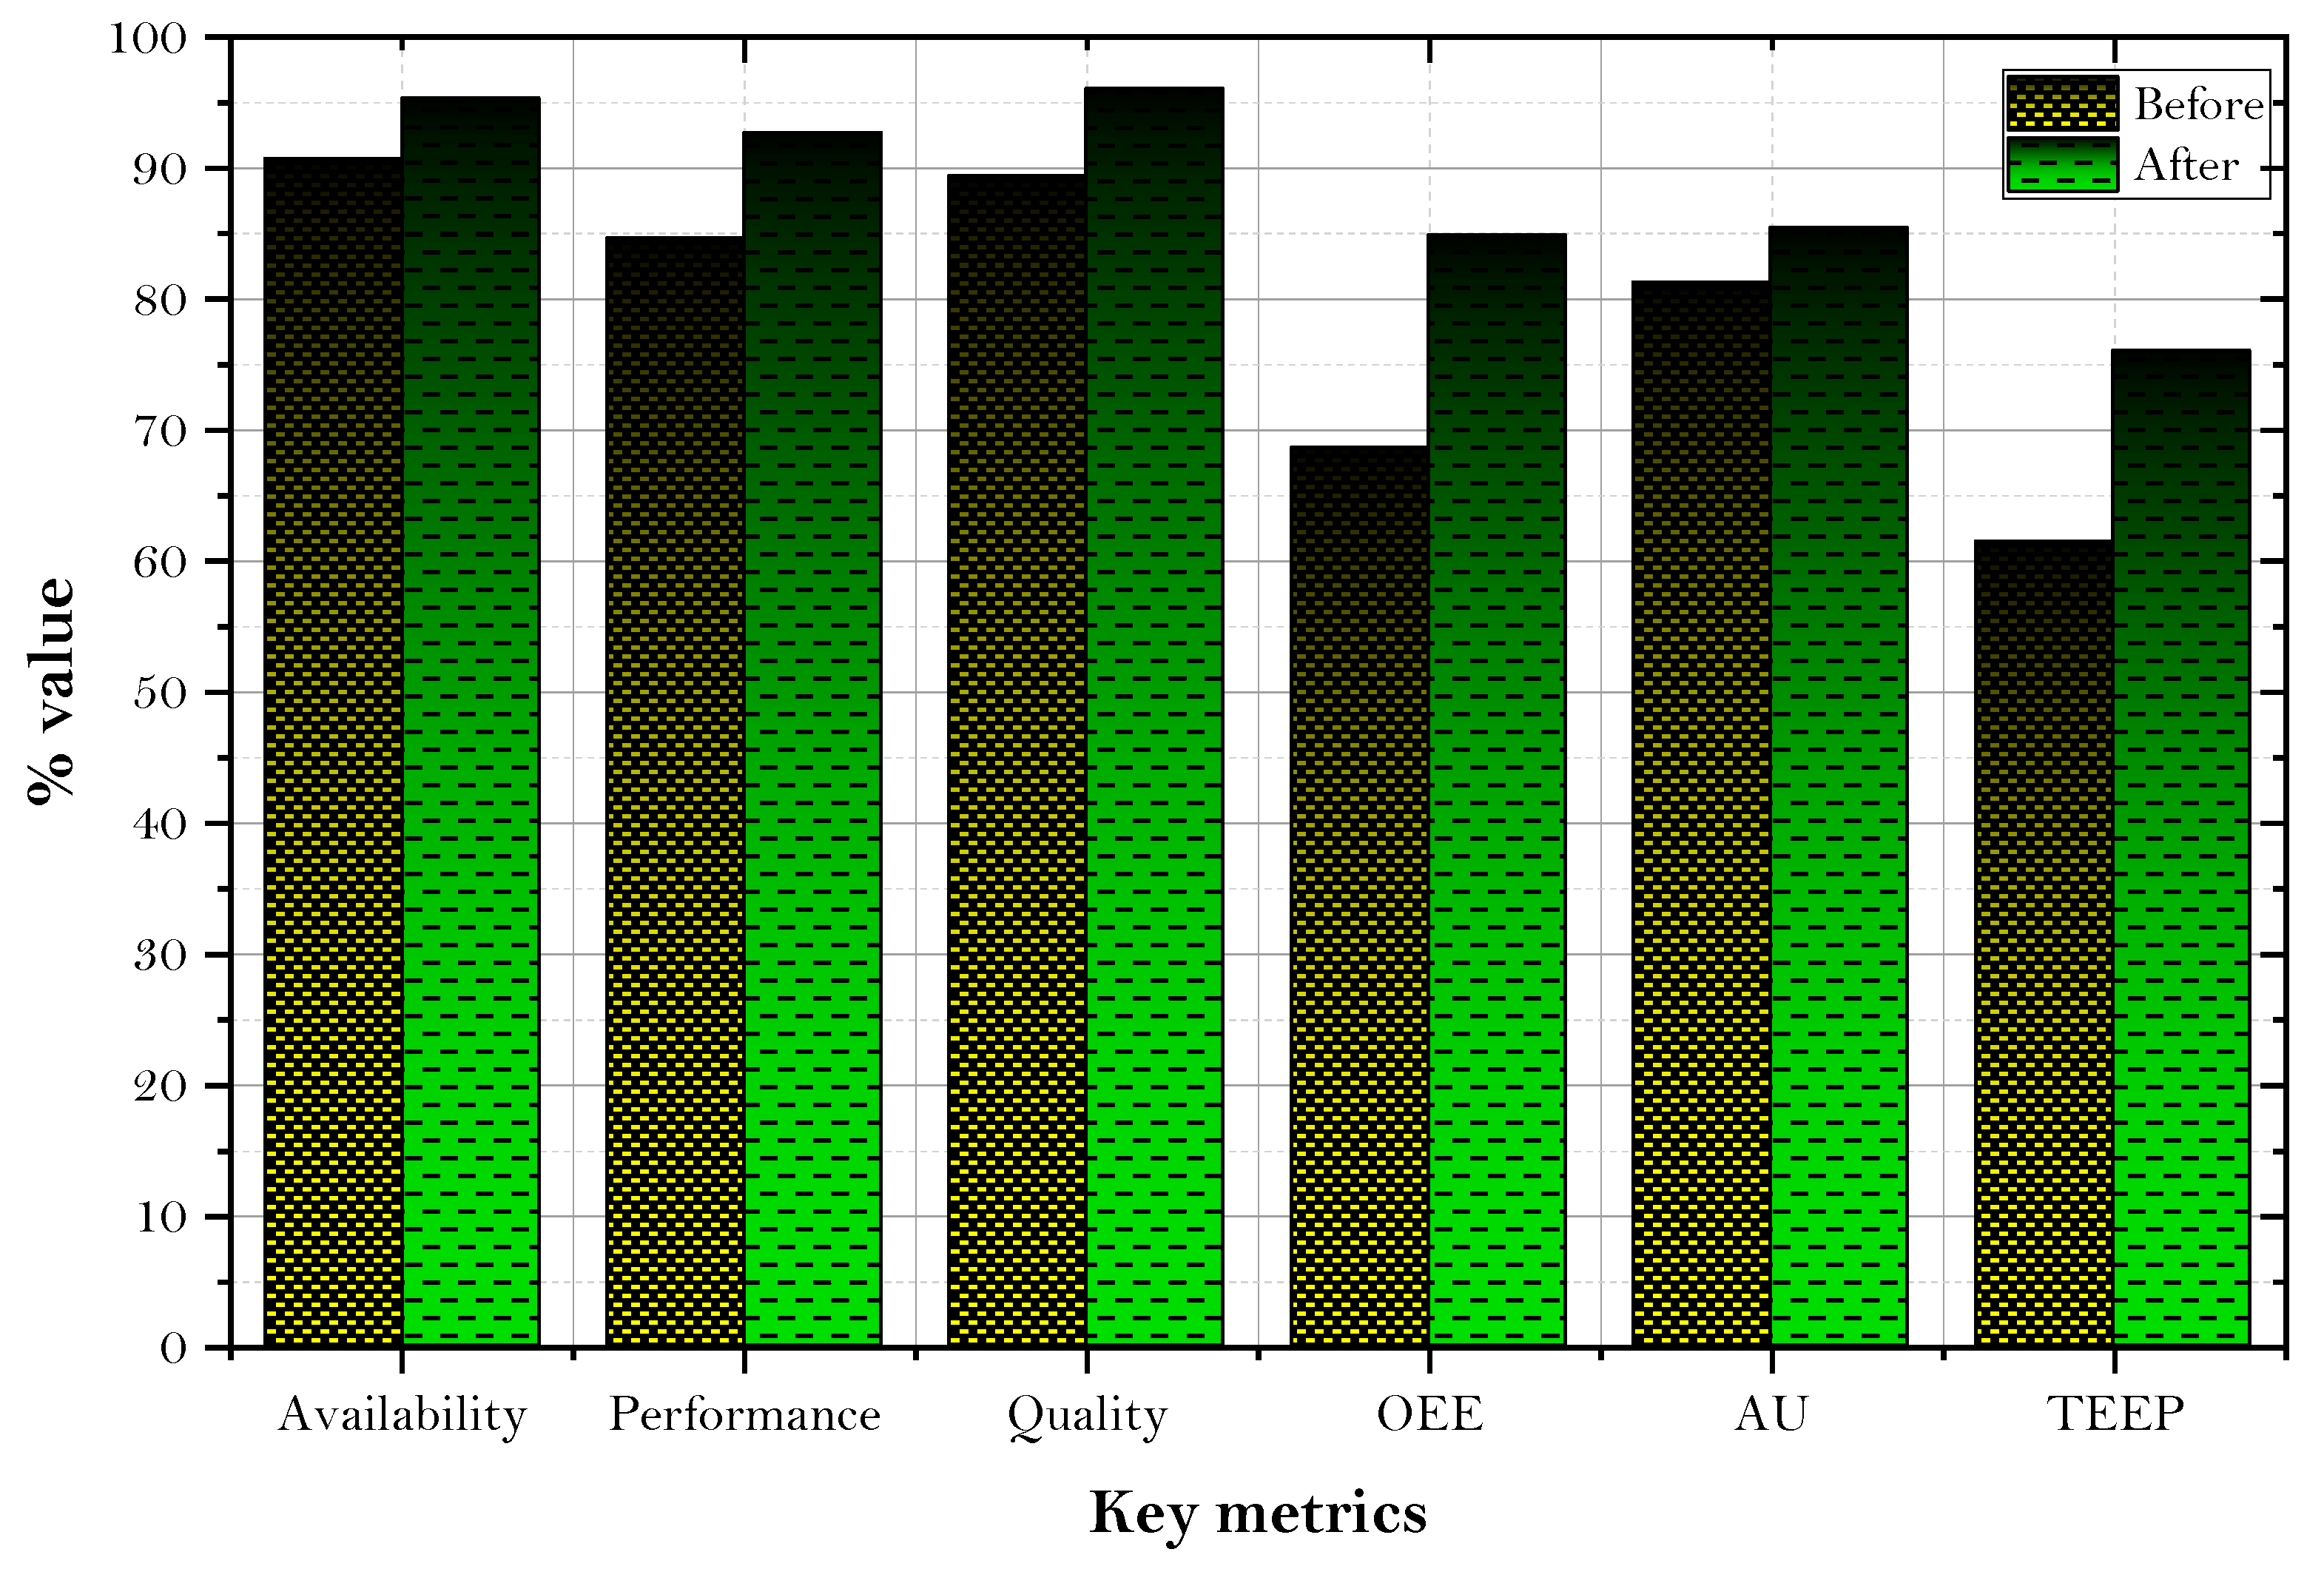
3.4. Improved OEE
4. Conclusions
Author Contributions
Funding
Data Availability Statement
Conflicts of Interest
References
- Franco, M.; Haase, H. Interfirm Partnerships and Organizational Innovation: Study of SMEs in the Automotive Sector. J. Open Innov. Technol. Mark. Complex. 2020, 6, 193. [Google Scholar] [CrossRef]
- Rocco, C.M.; Hernandez-Perdomo, E.; Mun, J. Introduction to Formal Concept Analysis and Its Applications in Reliability Engineering. Reliab. Eng. Syst. Saf. 2020, 107002. [Google Scholar] [CrossRef]
- Freiheit, T.; Hu, S.J. Impact of Machining Parameters on Machine Reliability and System Productivity. J. Manuf. Sci. Eng. 2002, 124, 296–304. [Google Scholar] [CrossRef]
- Supattananon, N.; Akararungruangkul, R. Modified Differential Evolution Algorithm for a Transportation Software Application. J. Open Innov. Technol. Mark. Complex. 2019, 5, 84. [Google Scholar] [CrossRef] [Green Version]
- Sooraj, S.; Vijayakumar, N.; Gaitonde, V.N.; Kotturshettar, B.B. Productivity Improvement of a Manufacturing Industry by Process Improvement through Bottleneck and Root Cause Analysis. In AIP Conference Proceedings; AIP Publishing LLC: Melville, NY, USA, 2019; Volume 2200, p. 20053. [Google Scholar]
- Basu, P.; Nath, A. Productivity Improvement by Root Cause Analysis in Manufacturing Industry. Int. J. Sci. Res. Dev. 2016, 4, 36–42. [Google Scholar]
- Jirasirilerd, G.; Pitakaso, R.; Sethanan, K.; Kaewman, S.; Sirirak, W.; Kosacka-Olejnik, M. Simple Assembly Line Balancing Problem Type 2 by Variable Neighborhood Strategy Adaptive Search: A Case Study Garment Industry. J. Open Innov. Technol. Mark. Complex. 2020, 6, 21. [Google Scholar] [CrossRef] [Green Version]
- Purba, H.H.; Wijayanto, E.; Aristiara, N. Analysis of Overall Equipment Effectiveness (OEE) with Total Productive Maintenance Method on Jig Cutting: A Case Study in Manufacturing Industry. J. Sci. Eng. Res. 2018, 5, 397–406. [Google Scholar]
- Chong, K.E.; Ng, K.C.; Goh, G.G.G. Improving Overall Equipment Effectiveness (OEE) through Integration of Maintenance Failure Mode and Effect Analysis (Maintenance-FMEA) in a Semiconductor Manufacturer: A Case Study. IEEE Int. Conf. Ind. Eng. Eng. Manag. 2016, 1427–1431. [Google Scholar] [CrossRef]
- Kapuria, T.K.; Rahman, M.; Haldar, S. Root Cause Analysis and Productivity Improvement of An Apparel Industry in Bangladesh Through Kaizen Implementation. J. Appl. Res. Ind. Eng. 2017, 4, 227–239. [Google Scholar] [CrossRef]
- Nallusamy, S. Enhancement of Productivity and Efficiency of CNC Machines in a Small Scale Industry Using Total Productive Maintenance. Int. J. Eng. Res. Africa 2016, 25, 119–126. [Google Scholar] [CrossRef]
- Nallusamy, S.; Muthamizhmaran, S. Enhancement of Productivity and Overall Equipment Efficiency Using Time and Motion Study Technique—A Review. Adv. Eng. Forum 2015, 14, 59–66. [Google Scholar] [CrossRef]
- Low, S.-N.; Chong, S.-H.; Sim, H.-Y.; Razalli, S.; Kamaruddin, S. Measurement of Overall Performance Effectiveness in Setup Improvement. J. Ind. Eng. 2014, 2014, 264980. [Google Scholar] [CrossRef]
- Garza-Reyes, J.A. From Measuring Overall Equipment Effectiveness (OEE) to Overall Resource Effectiveness (ORE). J. Qual. Maint. Eng. 2015, 21, 506–527. [Google Scholar] [CrossRef]
- Hedman, R.; Subramaniyan, M.; Almström, P. Analysis of Critical Factors for Automatic Measurement of OEE. Procedia CIRP 2016, 57, 128–133. [Google Scholar] [CrossRef]
- Azizi, A. Evaluation Improvement of Production Productivity Performance Using Statistical Process Control, Overall Equipment Efficiency, and Autonomous Maintenance. Procedia Manuf. 2015, 2, 186–190. [Google Scholar] [CrossRef] [Green Version]
- Puvanasvaran, A.P.; Mei, C.Z.; Alagendran, V.A. Overall Equipment Efficiency Improvement Using Time Study in an Aerospace Industry. Procedia Eng. 2013, 68, 271–277. [Google Scholar] [CrossRef] [Green Version]
- Puvanasvaran, A.P.; Yoong, S.S.; Tay, C.C. Effect of Hidden Wastes in Overall Equipment Effectiveness Calculation. ARPN J. Eng. Appl. Sci. 2017, 12, 6443–6448. [Google Scholar]
- Wolniak, R. Downtime in the Automotive Industry Production Process—Cause Analysis. Qual. Innov. Prosper. 2019, 23, 101–118. [Google Scholar] [CrossRef] [Green Version]
- Wan, S.; Li, D.; Gao, J.; Roy, R.; He, F. A Collaborative Machine Tool Maintenance Planning System Based on Content Management Technologies. Int. J. Adv. Manuf. Technol. 2018, 94, 1639–1653. [Google Scholar] [CrossRef] [Green Version]
- Salonitis, K.; Kolios, A. Reliability Assessment of Cutting Tool Life Based on Surrogate Approximation Methods. Int. J. Adv. Manuf. Technol. 2014, 71, 1197–1208. [Google Scholar] [CrossRef] [Green Version]
- Yun, J.J.; Kim, D.; Yan, M.-R. Open Innovation Engineering—Preliminary Study on New Entrance of Technology to Market. Electronics 2020, 9, 791. [Google Scholar] [CrossRef]
- Yun, J.J.; Zhao, X.; Park, K.; Shi, L. Sustainability Condition of Open Innovation: Dynamic Growth of Alibaba from SME to Large Enterprise. Sustainability 2020, 12, 4379. [Google Scholar] [CrossRef]
- Yun, J.J.; Zhao, X.; Jung, K.; Yigitcanlar, T. The Culture for Open Innovation Dynamics. Sustainability 2020, 12, 5076. [Google Scholar] [CrossRef]
- Munir, H.; Linåker, J.; Wnuk, K.; Runeson, P.; Regnell, B. Open Innovation Using Open Source Tools: A Case Study at Sony Mobile. Empir. Softw. Eng. 2018, 23, 186–223. [Google Scholar] [CrossRef] [Green Version]
- Enkel, E.; Gassmann, O.; Chesbrough, H. Open R&D and Open Innovation: Exploring the Phenomenon. R D Manag. 2009, 39, 311–316. [Google Scholar] [CrossRef]
- Sonmez, V.; Testik, M.C.; Testik, O.M. Overall Equipment Effectiveness When Production Speeds and Stoppage Durations Are Uncertain. Int. J. Adv. Manuf. Technol. 2018, 95, 121–130. [Google Scholar] [CrossRef]
- Chikwendu, O.C.; Chima, A.S.; Edith, M.C. The Optimization of Overall Equipment Effectiveness Factors in a Pharmaceutical Company. Heliyon 2020, 6, e03796. [Google Scholar] [CrossRef] [PubMed]
- Yazdani, A.-A.; Tavakkoli-Moghaddam, R. Integration of the Fish Bone Diagram, Brainstorming, and AHP Method for Problem Solving and Decision Making—a Case Study. Int. J. Adv. Manuf. Technol. 2012, 63, 651–657. [Google Scholar] [CrossRef]
- Gupta, M.K.; Sood, P.K.; Singh, G.; Sharma, V.S. Sustainable Machining of Aerospace Material—Ti (Grade-2) Alloy: Modeling and Optimization. J. Clean. Prod. 2017, 147, 614–627. [Google Scholar] [CrossRef]
- Gupta, M.K.; Sood, P. Machining Comparison of Aerospace Materials Considering Minimum Quantity Cutting Fluid: A Clean and Green Approach. Proc. Inst. Mech. Eng. Part C J. Mech. Eng. Sci. 2017, 231, 1445–1464. [Google Scholar] [CrossRef]
- Singh, G.; Pruncu, C.I.; Gupta, M.K.; Mia, M.; Khan, A.M.; Jamil, M.; Pimenov, D.Y.; Sen, B.; Sharma, V.S. Investigations of Machining Characteristics in the Upgraded MQL-Assisted Turning of Pure Titanium Alloys Using Evolutionary Algorithms. Materials 2019, 12, 999. [Google Scholar] [CrossRef] [PubMed] [Green Version]
- Gupta, M.K.; Song, Q.; Liu, Z.; Pruncu, C.I.; Mia, M.; Singh, G.; Lozano, J.A.; Carou, D.; Khan, A.M.; Jamil, M.; et al. Machining Characteristics Based Life Cycle Assessment in Eco-Benign Turning of Pure Titanium Alloy. J. Clean. Prod. 2020, 251, 119598. [Google Scholar] [CrossRef]
- Gupta, M.K.; Mia, M.; Pruncu, C.I.; Kapłonek, W.; Nadolny, K.; Patra, K.; Mikolajczyk, T.; Pimenov, D.Y.; Sarikaya, M.; Sharma, V.S. Parametric Optimization and Process Capability Analysis for Machining of Nickel-Based Superalloy. Int. J. Adv. Manuf. Technol. 2019, 102, 3995–4009. [Google Scholar] [CrossRef] [Green Version]
- Sarıkaya, M.; Yılmaz, V.; Dilipak, H. Modeling and Multi-Response Optimization of Milling Characteristics Based on Taguchi and Gray Relational Analysis. Proc. Inst. Mech. Eng. Part B J. Eng. Manuf. 2016, 230, 1049–1065. [Google Scholar] [CrossRef]
- Gupta, M.K.; Mia, M.; Jamil, M.; Singh, R.; Singla, A.K.; Song, Q.; Liu, Z.; Khan, A.M.; Rahman, M.A.; Sarikaya, M. Machinability Investigations of Hardened Steel with Biodegradable Oil-Based MQL Spray System. Int. J. Adv. Manuf. Technol. 2020, 108, 735–748. [Google Scholar] [CrossRef]
- Gupta, M.K.; Mia, M.; Singh, G.R.; Pimenov, D.Y.; Sarikaya, M.; Sharma, V.S. Hybrid Cooling-Lubrication Strategies to Improve Surface Topography and Tool Wear in Sustainable Turning of Al 7075-T6 Alloy. Int. J. Adv. Manuf. Technol. 2019. [Google Scholar] [CrossRef]
- Grzesik, W. Chapter Fourteen-Machining Economics and Optimization. In Advanced Machining Processes of Metallic Materials, 2nd ed.; Elsevier: Amsterdam, The Netherlands, 2017; pp. 265–283. [Google Scholar]
- Khan, A.M.; Jamil, M.; Mia, M.; He, N.; Zhao, W.; Gong, L. Sustainability-Based Performance Evaluation of Hybrid Nanofluid Assisted Machining: Sustainability Assessment of Hybrid Nanofluid Assisted Machining. J. Clean. Prod. 2020, 257, 120541. [Google Scholar] [CrossRef]
- Khan, A.M.; Gupta, M.K.; Hegab, H.; Jamil, M.; Mia, M.; He, N.; Song, Q.; Liu, Z.; Pruncu, C.I. Energy-Based Cost Integrated Modelling and Sustainability Assessment of Al-GnP Hybrid Nanofluid Assisted Turning of AISI52100 Steel. J. Clean. Prod. 2020, 257, 120502. [Google Scholar] [CrossRef]
- Yıldırım, Ç.V.; Kıvak, T.; Sarıkaya, M.; Erzincanlı, F. Determination of MQL Parameters Contributing to Sustainable Machining in the Milling of Nickel-Base Superalloy Waspaloy. Arab. J. Sci. Eng. 2017, 42, 4667–4681. [Google Scholar] [CrossRef]
- Sarikaya, M.; Güllü, A. Taguchi Design and Response Surface Methodology Based Analysis of Machining Parameters in CNC Turning under MQL. J. Clean. Prod. 2014, 65, 604–616. [Google Scholar] [CrossRef]
- Sarıkaya, M.; Güllü, A. Multi-Response Optimization of Minimum Quantity Lubrication Parameters Using Taguchi-Based Grey Relational Analysis in Turning of Difficult-to-Cut Alloy Haynes 25. J. Clean. Prod. 2015, 91, 347–357. [Google Scholar] [CrossRef]


| No. | Key Terms | Symbol | Formula | Value | Unit |
|---|---|---|---|---|---|
| 1. | Plant Operating Time | PO | No. of shiftWorking Hours | 1× 8 hrs. = 8hrs = 480 | Min |
| 2. | Planned Shutdown Time | PS | This includes short breaks/meal breaks/preventive maintenance schedule | 2 Short Breaks @10 min = 201 Meal Break @ 30 min = 30 Total = 50 | Min |
| 3. | Planned Production Time | PT | Plant Operating Time (PO)—Planned Shutdown Time (PS) | 480 − 50 = 430 | Min |
| 4. | Down Time | DT | Downtime arises due to tooling failures, unplanned maintenance, general breakdowns, equipment failure, setup/changeover, and material shortages | 40 | Min |
| 5. | Operative Time | OT | Plant Production Time (PT)—Down Time Loss (DT) | 430 − 40 = 390 | Min |
| 6. | Ideal Cycle Time | CT | The time needed to achieve the product in a suitable time | 1 | Min |
| 7. | Total no. of Pieces | N | Total production in a single shift during planned production time | 330 | Count |
| 8. | Minor Stoppages | M | Misfeed, jams, sensor failure, etc. | 30 | Min |
| 9. | Net Operating Time | NT | Operative Time-Minor stoppages | 390 − 30 = 360 | Min |
| 10. | Efficient Net Operating Time | ET | Ideal Cycle Time (CT)Total Pieces (N) | 1 × 330 = 330 | Min |
| 11. | Rejected Pieces | NR | Total no of pieces which do not adhere with the specification | 35 | Count |
| 12. | Good Unit | G | Total no of Pieces (N)—Rejected Pieces (NR) | 330 − 35 = 295 | Count |
| Availability | |||||
| 13. | Availability | A | Operating Time (OT)⁄Planned Production Time (PT) | 390/430 = 90.70 | % |
| Performance | |||||
| 14. | Performance | P | = 84.62 | % | |
| Quality | |||||
| 15. | Quality | Q | 295/330 = 89.39 | % | |
| Overall Equipment Efficiency | |||||
| 16. | Overall Equipment Efficiency | OEE | APQ | 90.70 × 84.62 × 89.39 = 68.60 | % |
| 17. | Asset Utilization | AU | Operating Time (OT)⁄Plant Operating Time (PO) | 390/480= 81.25 | % |
| 18. | Total Effective Equipment performance | TEEP | AUPQ | 81.25 × 84.62 × 89.39 = 61.45 | % |
| Corrective Maintenance Down Time | AdministrativeandLogisticTime: Time taken for implementing decision through administrative department and provide the same without any hinderence. |
| Active Repair Time: Time taken to convert the failure state into operational state. This will depend upon checkout, preparation, fault correction, location, adjustment and calibration, and spare item time. | |
| Delay Time: The actual time taken by the system from the scheduled time referred as delay time. |
| Classification | Descriptions | Rating | Remarks | ||||||
|---|---|---|---|---|---|---|---|---|---|
| L1 | L2 | L3 | L4 | L5 | |||||
| A | SEIRI ORGANIZE (SORT) | 1. | Distinguish between wanted and unwanted items | ||||||
| 2. | Unwanted equipment, tool, other items on the shop floor. | ||||||||
| 3. | Purpose of the items, frequency of use | ||||||||
| 4. | Unwanted items in the staircase, corners. | ||||||||
| 5. | Unwanted items on walls and information board. | ||||||||
| 6. | Unwanted inventory supplies or materials. | ||||||||
| B | SEITON UNIFORMITY (SET IN ORDER) | 7. | A place of everything and everything in its place. | ||||||
| 8. | Items are not in order | ||||||||
| 9. | Workstations, items location not demarcated | ||||||||
| 10. | Correct items not grouped | ||||||||
| 11. | Quantity limits are not appropriate | ||||||||
| C | SEISO CLEANLINESS (SHINE) | 12. | Cleaning and looking ways are not organized | ||||||
| 13. | Workplace area, floor, stairs are contaminated | ||||||||
| 14. | Machine tools, equipment’s and other items are not clean. | ||||||||
| 15. | Sanitary items are not easily assessable. | ||||||||
| 16. | Signage and board are either dirty or broken. | ||||||||
| 17. | Relevant issues | ||||||||
| D | SEIKETSU STANDARDIZE (NORMALIZE) | 18. | Implementation of the first 3S | ||||||
| 19. | Standards are not properly documented | ||||||||
| 20. | Job, cleaning, and another checklist not framed | ||||||||
| 21. | Part recognition is poor | ||||||||
| 22. | Items located in specified limit | ||||||||
| E | SHITSUK DISCIPLINE (SUSTAIN) | 23. | Adhere with rules | ||||||
| 24. | Workers not undergone 5S training | ||||||||
| 25. | The frequency for not performing 5S in last week | ||||||||
| 26. | How many jobs not updated as per standard | ||||||||
| 27. | The frequency for last week that belongings not properly maintained | ||||||||
| No. | Key Terms | Symbol | Past Value | Present Value | Unit |
|---|---|---|---|---|---|
| 1. | Plant Operating Time | PO | 1 8 hrs. = 8 hrs = 480 | 1 8 hrs. = 8 hrs = 480 | min |
| 2. | Planned Shutdown Time | PS | 2 Short Breaks @10 min = 20 1 Meal Break @ 30 min = 30 Total = 50 | 2 Short Breaks @10 min = 20 1 Meal Break @ 30 min = 30 Total = 50 | min |
| 3. | Planned Production Time | PT | 480 − 50 = 430 | 480 − 50 = 430 | min |
| 4. | Down Time | DT | 40 | 20 | min |
| 5. | Operative Time | OT | 430 − 40 = 390 | 430 − 20 = 410 | min |
| 6. | Ideal Cycle Time | CT | 1 | 1 | min |
| 7. | Total no. of Pieces | N | 330 | 380 | count |
| 8. | Minor Stoppages | M | 30 | 15 | min |
| 9. | Net Operating Time | NT | 390 − 30 = 360 | 410 – 15 = 395 | min |
| 10. | Efficient Net Operating Time | ET | 1 330 = 330 | 1 380 = 380 | min |
| 11. | Rejected Pieces | NR | 35 | 15 | count |
| 12. | Good Unit | G | 330 − 35 = 295 | 380 − 15 = 365 | count |
| 13. | Availability | A | 390/430 = 90.70 | 410/430 = 95.30 | % |
| 14. | Performance | P | = 84.62 | = 92.68 | % |
| 15. | Quality | Q | 295/330 = 89.39 | 365/380 = 96.05 | % |
| 16. | Overall Equipment Efficiency | OEE | 90.70 84.62 89.39 = 68.60 | 95.30 92.68 96.05 = 84.83 | % |
| 17. | Asset Utilization | AU | 390/480 = 81.25 | 410/480= 85.41 | % |
Publisher’s Note: MDPI stays neutral with regard to jurisdictional claims in published maps and institutional affiliations. |
© 2020 by the authors. Licensee MDPI, Basel, Switzerland. This article is an open access article distributed under the terms and conditions of the Creative Commons Attribution (CC BY) license (http://creativecommons.org/licenses/by/4.0/).
Share and Cite
Tayal, A.; Kalsi, N.S.; Gupta, M.K.; Pimenov, D.Y.; Sarikaya, M.; Pruncu, C.I. Effectiveness Improvement in Manufacturing Industry; Trilogy Study and Open Innovation Dynamics. J. Open Innov. Technol. Mark. Complex. 2021, 7, 7. https://doi.org/10.3390/joitmc7010007
Tayal A, Kalsi NS, Gupta MK, Pimenov DY, Sarikaya M, Pruncu CI. Effectiveness Improvement in Manufacturing Industry; Trilogy Study and Open Innovation Dynamics. Journal of Open Innovation: Technology, Market, and Complexity. 2021; 7(1):7. https://doi.org/10.3390/joitmc7010007
Chicago/Turabian StyleTayal, Ashwani, Nirmal Singh Kalsi, Munish Kumar Gupta, Danil Yurievich Pimenov, Murat Sarikaya, and Catalin I. Pruncu. 2021. "Effectiveness Improvement in Manufacturing Industry; Trilogy Study and Open Innovation Dynamics" Journal of Open Innovation: Technology, Market, and Complexity 7, no. 1: 7. https://doi.org/10.3390/joitmc7010007
APA StyleTayal, A., Kalsi, N. S., Gupta, M. K., Pimenov, D. Y., Sarikaya, M., & Pruncu, C. I. (2021). Effectiveness Improvement in Manufacturing Industry; Trilogy Study and Open Innovation Dynamics. Journal of Open Innovation: Technology, Market, and Complexity, 7(1), 7. https://doi.org/10.3390/joitmc7010007