1. Introduction
The seven emirates of Abu Dhabi, Dubai, Sharjah, Ajman, Umm Al-Quwain, Fujairah, and Ras Al Khaimah are collectively called the United Arab Emirates (UAE). Abu Dhabi is the capital city. Most of the UAE except Dubai depend on oil revenues. It is a member of the Gulf Cooperation Council (GCC), which also includes Bahrain, Kuwait, Oman, Qatar, and Saudi Arabia. According to the World Bank Data of 2019, the UAE’s population increased from 4.6 million in 2005 to roughly 9.77 million in 2019.ItsGDP is estimated to be US
$421.142 billion, and it has a per capita income of US
$43,470 [
1]. The UAE suffers from a substantial shortage of qualified local workers, and relies heavily on foreigners to fill the gap. More than 85% of the UAE labor workforce comprises expatriates from more than 100 nationalities, reflective of many races, cultures, ethnicities, and languages. The largest groups of non-UAE nationals are South Asian, 59.4% (includes Indian, 38.2%; Bangladeshi, 9.5%; Pakistani, 9.4%; other, 2.3%); Egyptian, 10.2%; Filipino, 6.1%; and others, 12.8% [
2].
The economy will contract this year, 2020, as the pandemic and low oil prices weigh on productivity. Next year, GDP is expected to recover on the back of stronger aggregate demand as economies reopen globally. Nevertheless, downside risks remain. Uncertainty over the pandemic lingers, and further spikes in infections could dampen the oil demand ahead. Focus Economics panelists forecast the GDP to expand 3.0% in 2021, which is unchanged from last month’s forecast, and 3.6% in 2022 [
3].
According to Schein [
4] corporate culture is a pattern of shared basic assumptions that the group learns as it solves its problems that works well enough to be considered valid and is passed on to new members as the correct way to perceive, think, and feel in relation to those problems. It is a mirror of corporate identity and an image of its maturity. According to Sedliakova [
5] a decent corporate culture is basically one in which the organization is fruitful during the time spent meeting its targets and workers’ needs. Creativity as the sole difference in corporate culture is not as simple as it appears.
According to Hawes [
6] corporate culture messages constantly state that fruitful partnerships adjust and consistently improve their societies in light of changes in the outer business climate. Societies are moldable. This implies that a “fruitful” administrator (or generously compensated administration specialist) should have the option to go into any enterprise with a negative or “broken” culture and utilize the different social strategies referenced above to change that culture into a positive one that improves worker execution and profitability.
ElKelish et al. [
7] found that the organizational culture of hierarchy has a critical positive outcome on the UAE corporations’ risk metric. A study made on the “impact of organizational culture and perceived process safety in the UAE oil and gas industry” conducted by Mazrouei et al. [
8] showed that different attributes affect and improve the safety performance in the UAE’s oil and gas industry. The findings of their study indicated that mentalities and convictions decided the degree of safety culture effectiveness of society viability, which matched with earlier literature.
A study conducted by Shwana et al. [
9] on workers and clients of an Iraqi telecommunication organization demonstrated the effect of human resources development practices on human capital, which would instigate positive conduct in workers and would influence insight, aptitudes, capacities, and perspectives, thus affecting organizational performance. Alrawi et al. [
10] found that getting trust and the perceptions of management executives in light of directors’ individual insights and managerial styles has a negative relationship with the apparent advantages of these creativity negligence factors.
A study conducted by Sweis et al. [
11] on “the relationship between total quality management (TQM) implementation and organization performance: evidence from the airlines companies in UAE” revealed that there is a positive relationship between TQM and organizational performance. A Dubai-based survey conducted by Obay [
12] demonstrated that organizations’ social responsibility programs, worker health, and safety policies were considered as the areas of strength. The views on inevitable worker offense were, then again, especially disturbing. Moral frameworks needed greater comprehensiveness. Aspects of irreconcilable circumstance, autonomy of board enrollment, segregation, misleading clients, illegal installments, and encroachment of natural law and principles, among others, are not appropriately addressed.
The UAE has been positioned second in the Arab world and is among the main 20 nations monetarily indicated by The Economist’s investigation of 66 nations. The UAE’s solid sovereign wealth resources worth
$1.16 trillion provide an important part of its financial stability [
13]. The present study narrates the influence of corporate culture toward the attitude, performance, productivity, and behavior of 200 employees working in two major foreign exchange companies of the United Arab Emirates.
1.1. Background of the Study
It is a fact that corporate culture plays a vital role towards the behavior, performance, attitude, and productivity of workers. The United Arab Emirates, comprising seven Emirates, has few locals of its own to fulfill the demand for labor. As a result, workers from various countries, western and non-western, entered these Emirates and started forming into a large workforce. They are ethnic groups. It was observed through analytical study that there is a strong influence by corporate culture on the attitude, performance, productivity, and behavior of employees working in diverse industries in the UAE. There were separate studies on corporate culture and its impact on other factors. Some studies focused on the impact on employees’ attitude on account of corporate culture, whereas other studies focused on the impact of performance and productivity [
7,
14,
15,
16,
17]. This study necessitated a comprehensive study of corporate culture, having impact on all of the above factors. The researcher, therefore, selected the workers of two popular foreign exchange companies of the UAE and collected their information through a questionnaire. This study found that 69% of workers concurred that corporate culture makes a critical or significant effect on their presentation, while 62% and 63% of the workers moreover concurred that corporate culture affects mentality and conduct, respectively. The majority of the target employees agreed that a company influences the productivity level of the employee and, therefore, the organization itself.
Corporate tradition is difficult to inculcate formally in newcomers to an organization, though it has to be learned nonetheless. It is gradually uncovered through a set of company processes, values, customs, incentive programs, and approaches, wherein employees are managed, they engage with each other, and they prioritize essentials. Altogether, culture is both a rationale and a set of outcomes of behavior in the day-to-day running of an organization, as a primary enabler of high-performing businesses.
1.2. The Significance of Culture
Culture is a word for the lifestyle of gatherings of individuals, which means the manner in which they get things done. Various communities or societies may have various cultures. A culture followed by the past generation is generally followed by the present generation, which will be practiced by the future generation. We find various cultures in religions, communities, music, cooking, and so on. Culture can be perceived as a major part of a company’s marquee. However, if a culture is not aligned with the brand or that brand no longer naturally comes up from that culture, then companies can develop a credibility gap by way of promising one thing to the market and providing something else or something less. That is why corporate culture and the values upon which it is based needs to be built into every side of a company, together with management training and efficiency direction. It will have to evolve in tandem with external developments, such as financials, as determined by the market. Furthermore, it should be communicated constantly both internally and externally to stakeholders.
Culture can affect industry results in a number of ways, both positively and negatively. For instance, cultures that are not aligned with corporate systems can lead to reduced loyalty, a reduction in motivation, and excessive employee turnover. However, healthy cultures produce greater job satisfaction, increased productivity, and greater collaboration of company strategies, such as with the employees at a high-production manufacturing plant. Strategy, operational efficiency, and tradition are all strongly related. High-performing companies most commonly view culture as an enabler of technique and efficiency, and wish to create a culture as a way to aid and enable employees to achieve those goals.
Cooke et al. [
18] are of the opinion that organizational level factors shape the cultures of organizations. According to the study conducted by Hofstede et al. [
19], there is agreement that authoritative culture is comprehensive, generally shared, and socially built; it includes suppositions, convictions, and desires for conduct, exists at an assortment of levels, and shows itself in a wide scope of features of organizational life. According to Schein [
4] culture is commonly known to have several components or layers, including underlying assumptions, beliefs, and behavioral standards. Constructive cultures, according to Weidner [
20] have been shown to have a positive effect on organizational participants, including confidence in their managers and organizations. Chaudhry [
21] is of the opinion that the variability of cultures is due to business as well as organizational variables. It is suggested that the strength of the three types of cultures—positive, passive/defensive, and aggressive/defensive—are influenced at the industry and organizational level. Research using the structure and culture survey conducted by Corbett and Rastrick [
22] found that constructive cultures are positively connected to positive results across industries, including success in manufacturing organizations.
Once organizational cultures have begun, they have a tendency to sustain themselves in many ways, in most cases by means of members of the institution. Other group members may experiment with the ways and extent to which their own values and behavior fit in. New members are explicitly taught the crew type. Old experiences and various stories of legendary proportion are revisited from time to time to remind everyone of the crew’s values and their significance. Managers explicitly behave and act in ways that exemplify the culture and its ideals. Managerial and senior individuals of the group may communicate the key values time and again in their everyday conversations or through detailed rituals and ceremonies. Those folks who follow the cultural norms are rewarded, and those who do not may be penalized. A penalty may be as casual and benign as a look of disapproval.
1.3. Mastery Implemented for Employee Behaviours
Organizational culture serves as a swaying mechanism for employee behavior. If the tradition of the group is characterized by using competition, then individuals could be inclined to behave in ways that might be self-serving instead of enhancing the greater interest of the company. However, if the culture is characterized by collaboration, as stated by Nwugwo [
23] members will tend to behave in ways that serve the team as a whole. The question that arises is whether a heterogeneous workforce can be influenced by one work culture. However, routinely, where there is a clash of cultures, particularly when a character or group of contributors has a separate set of values, then those prevailing within the organization’s main traditions may be challenged. Strongly held differences of values or opinions can be deleterious to a company.
1.4. Statement of the Problem
There is a considerable body of research confirming the role of work cultures in largely homogeneous organizations, in which the employee body is comprised of similar backgrounds, educations, and meaning systems. The question that arises is whether, in heterogeneous cultures like those of the UAE, thrift, hard work, tenacity, fairness, and tolerance are sufficiently established to make all of the difference. In the two forex organizations used in this study as cases, are their cultures strong and influential enough to inculcate employee awareness of the company mission, and do these employees feel that their attitude and behaviors are being shaped by working towards the overall goal of the company? In other words, is the culture effective by impacting these employees, even if they stay for less than a year?
The competitiveness of corporations should not only be reflected in their technology, but also in their corporate culture. A confident organizational culture can promote the healthy progress of an enterprise, and actively mobilize the productivity of the employee, making them work with extra enthusiasm. In addition, it will fortify production effectively. In short, the performance of a confident organizational tradition may often be self-evident.
One of the purposes of a company is to develop the loyalty of its consumer base. Thus, an excellent corporate image has to be a prime goal. A good corporate image brings good fiscal returns, dependent on an organizational culture that reinforces that image. Can a heterogeneous work force accomplish this? It is questionable, therefore, whether novice and trainee employees have enough time to make adjustments to a work culture that is new to them, and whether more long-standing employees of different backgrounds can make an effective adjustment.
1.5. Objectives
The main objective of this study is to examine the influence of corporate culture on the behavior of heterogeneous groups of employees. As a developing economy, the UAE has in its workforce different ethnicities and nationalities, each with its own distinctive national traditions, cultures, religions, histories, and work patterns. The study also aims to analyze the remittances made by two foreign exchange companies in the UAE as being characteristic of finance companies, in which most of the employees originate from different nations who work together regardless of their socio-cultural background. It is important to examine how company culture may influence employee behavior in an emerging economy when an organization comprises employees from heterogeneous national cultures and backgrounds.
1.6. Research Questions
In this research paper, the researchers have the following research questions:
- (1)
To what extent does corporate culture determine expatriate employee attitude?
- (2)
To what extent does corporate culture determine expatriate employee performance?
- (3)
To what extent does corporate culture determine expatriate employee behavior?
- (4)
To what extent does corporate culture determine the productivity of an expatriate employee?
1.7. Hypothesis
The present research has been based on the following hypotheses:
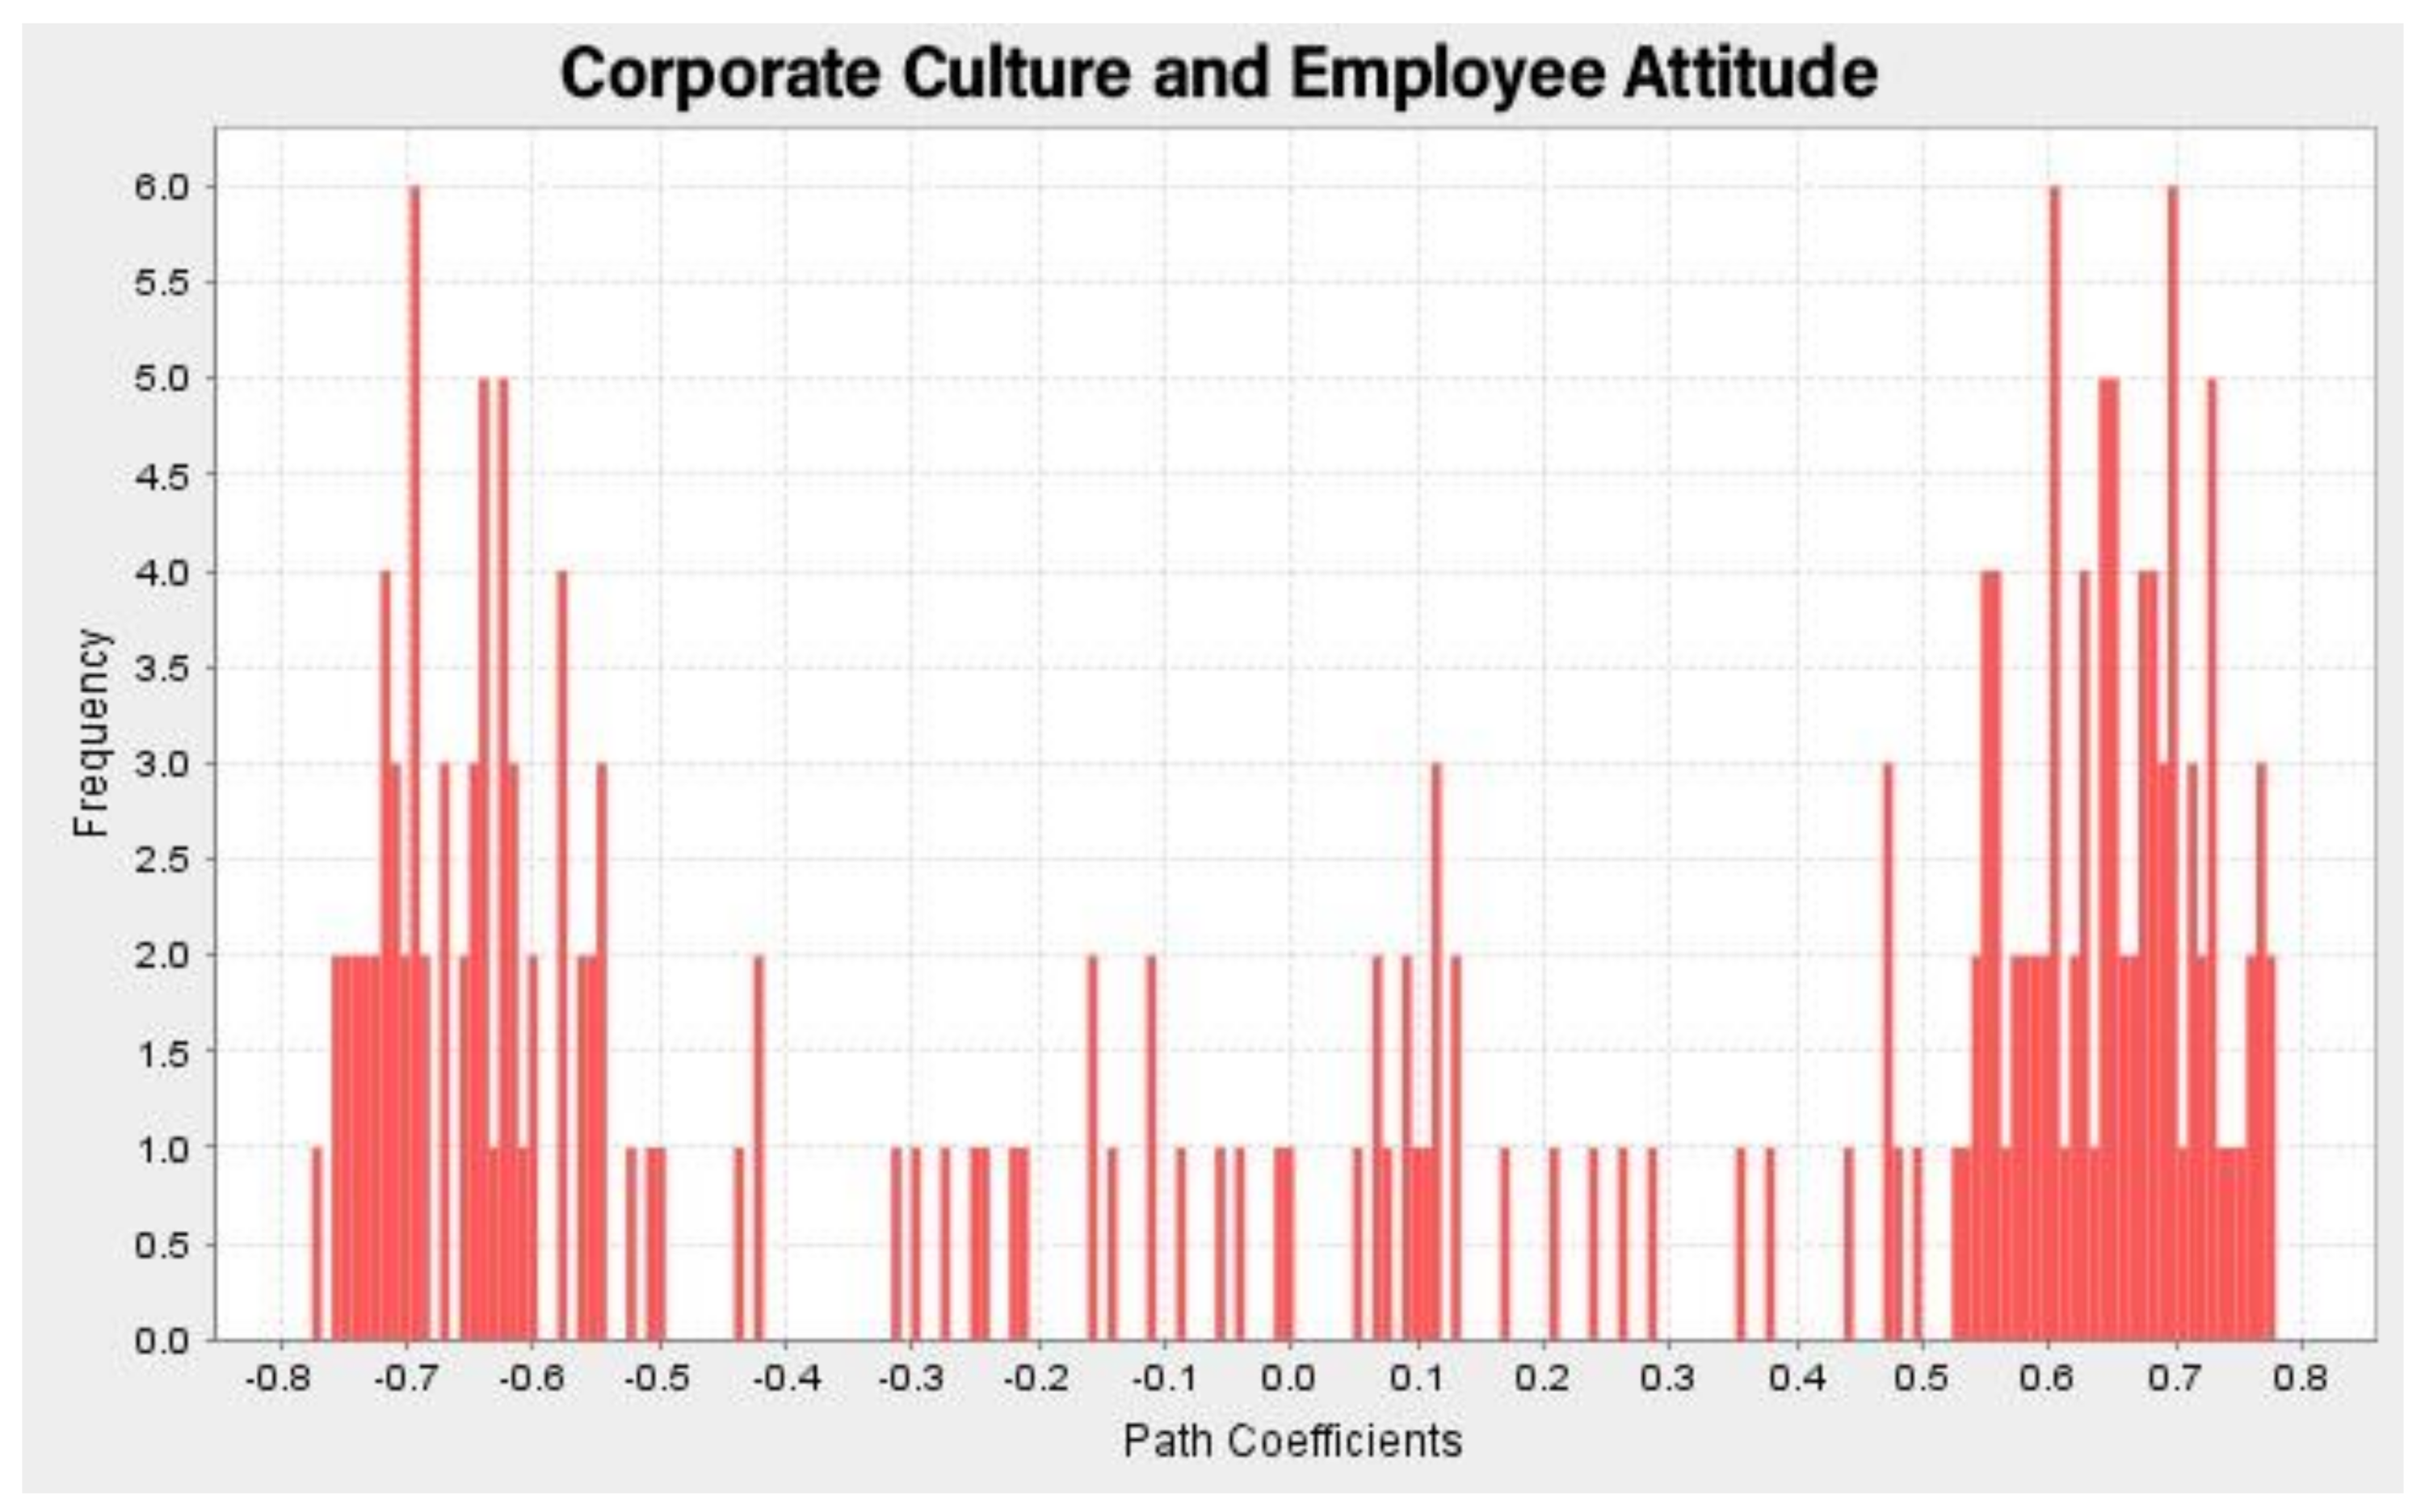
Hypothesis (H1): There is a significant impact of the corporate culture of the UAE on employee attitude.
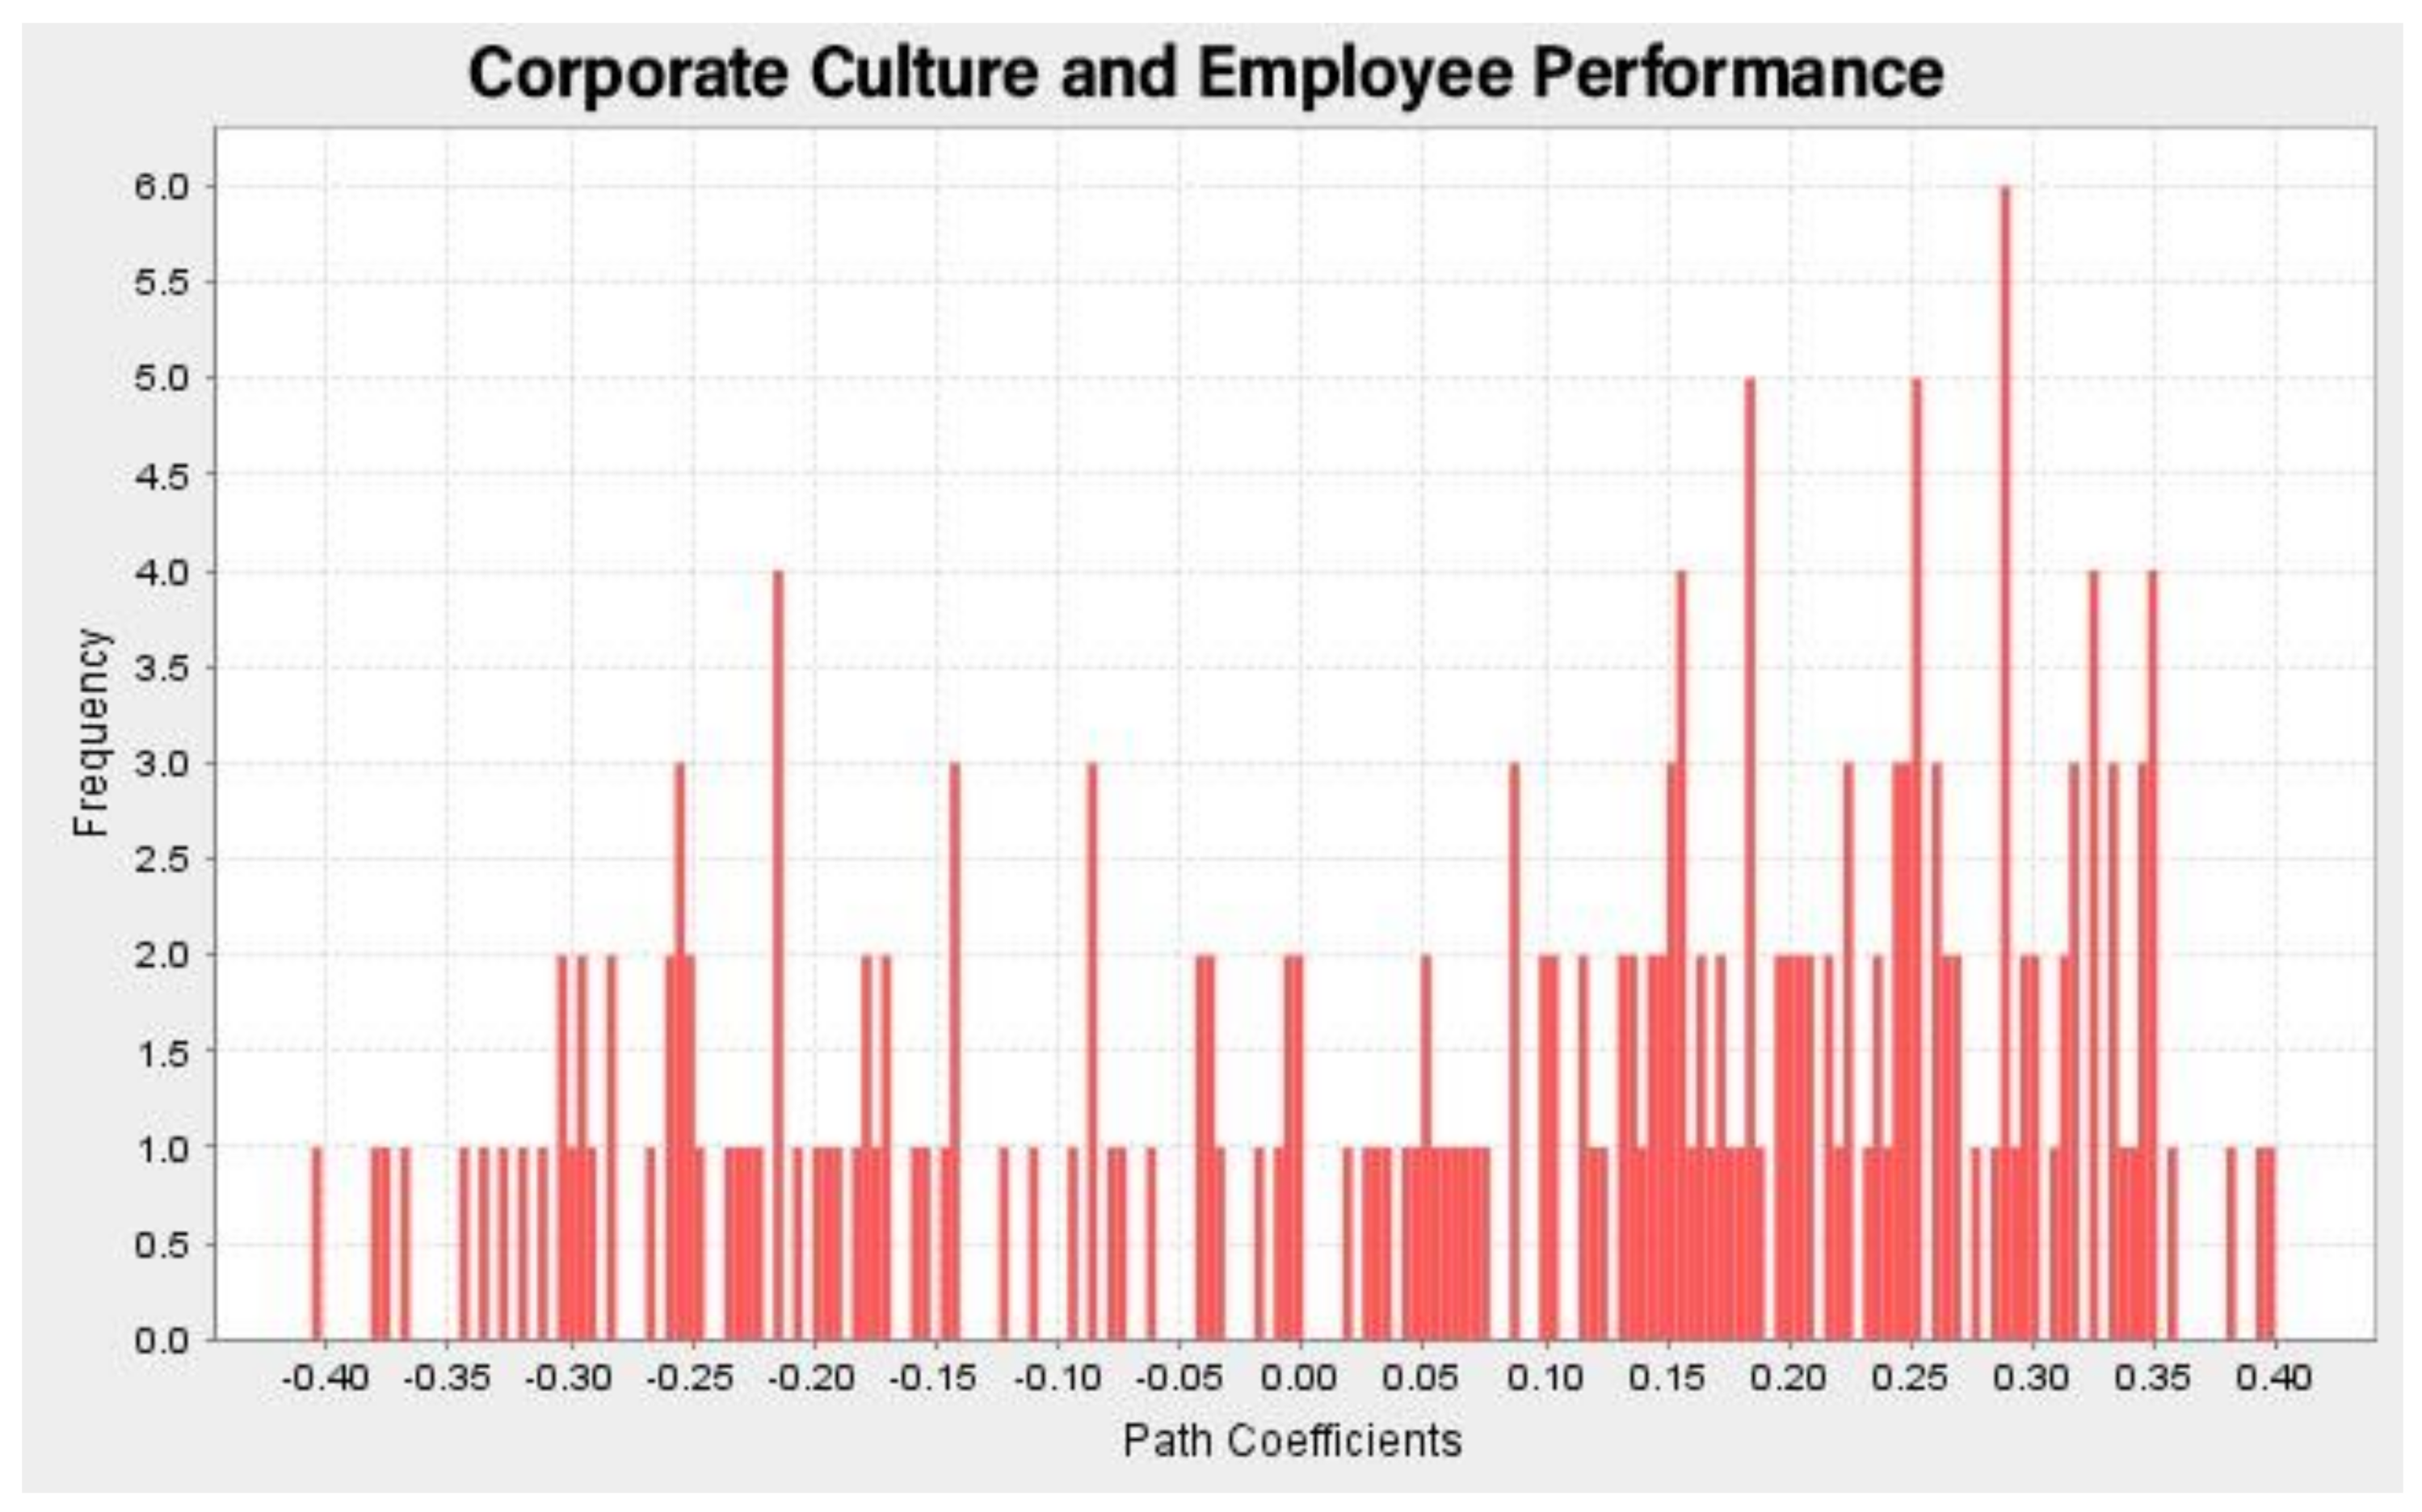
Hypothesis (H2): There is a significant impact of the corporate culture of the UAE on expatriate employee performance.
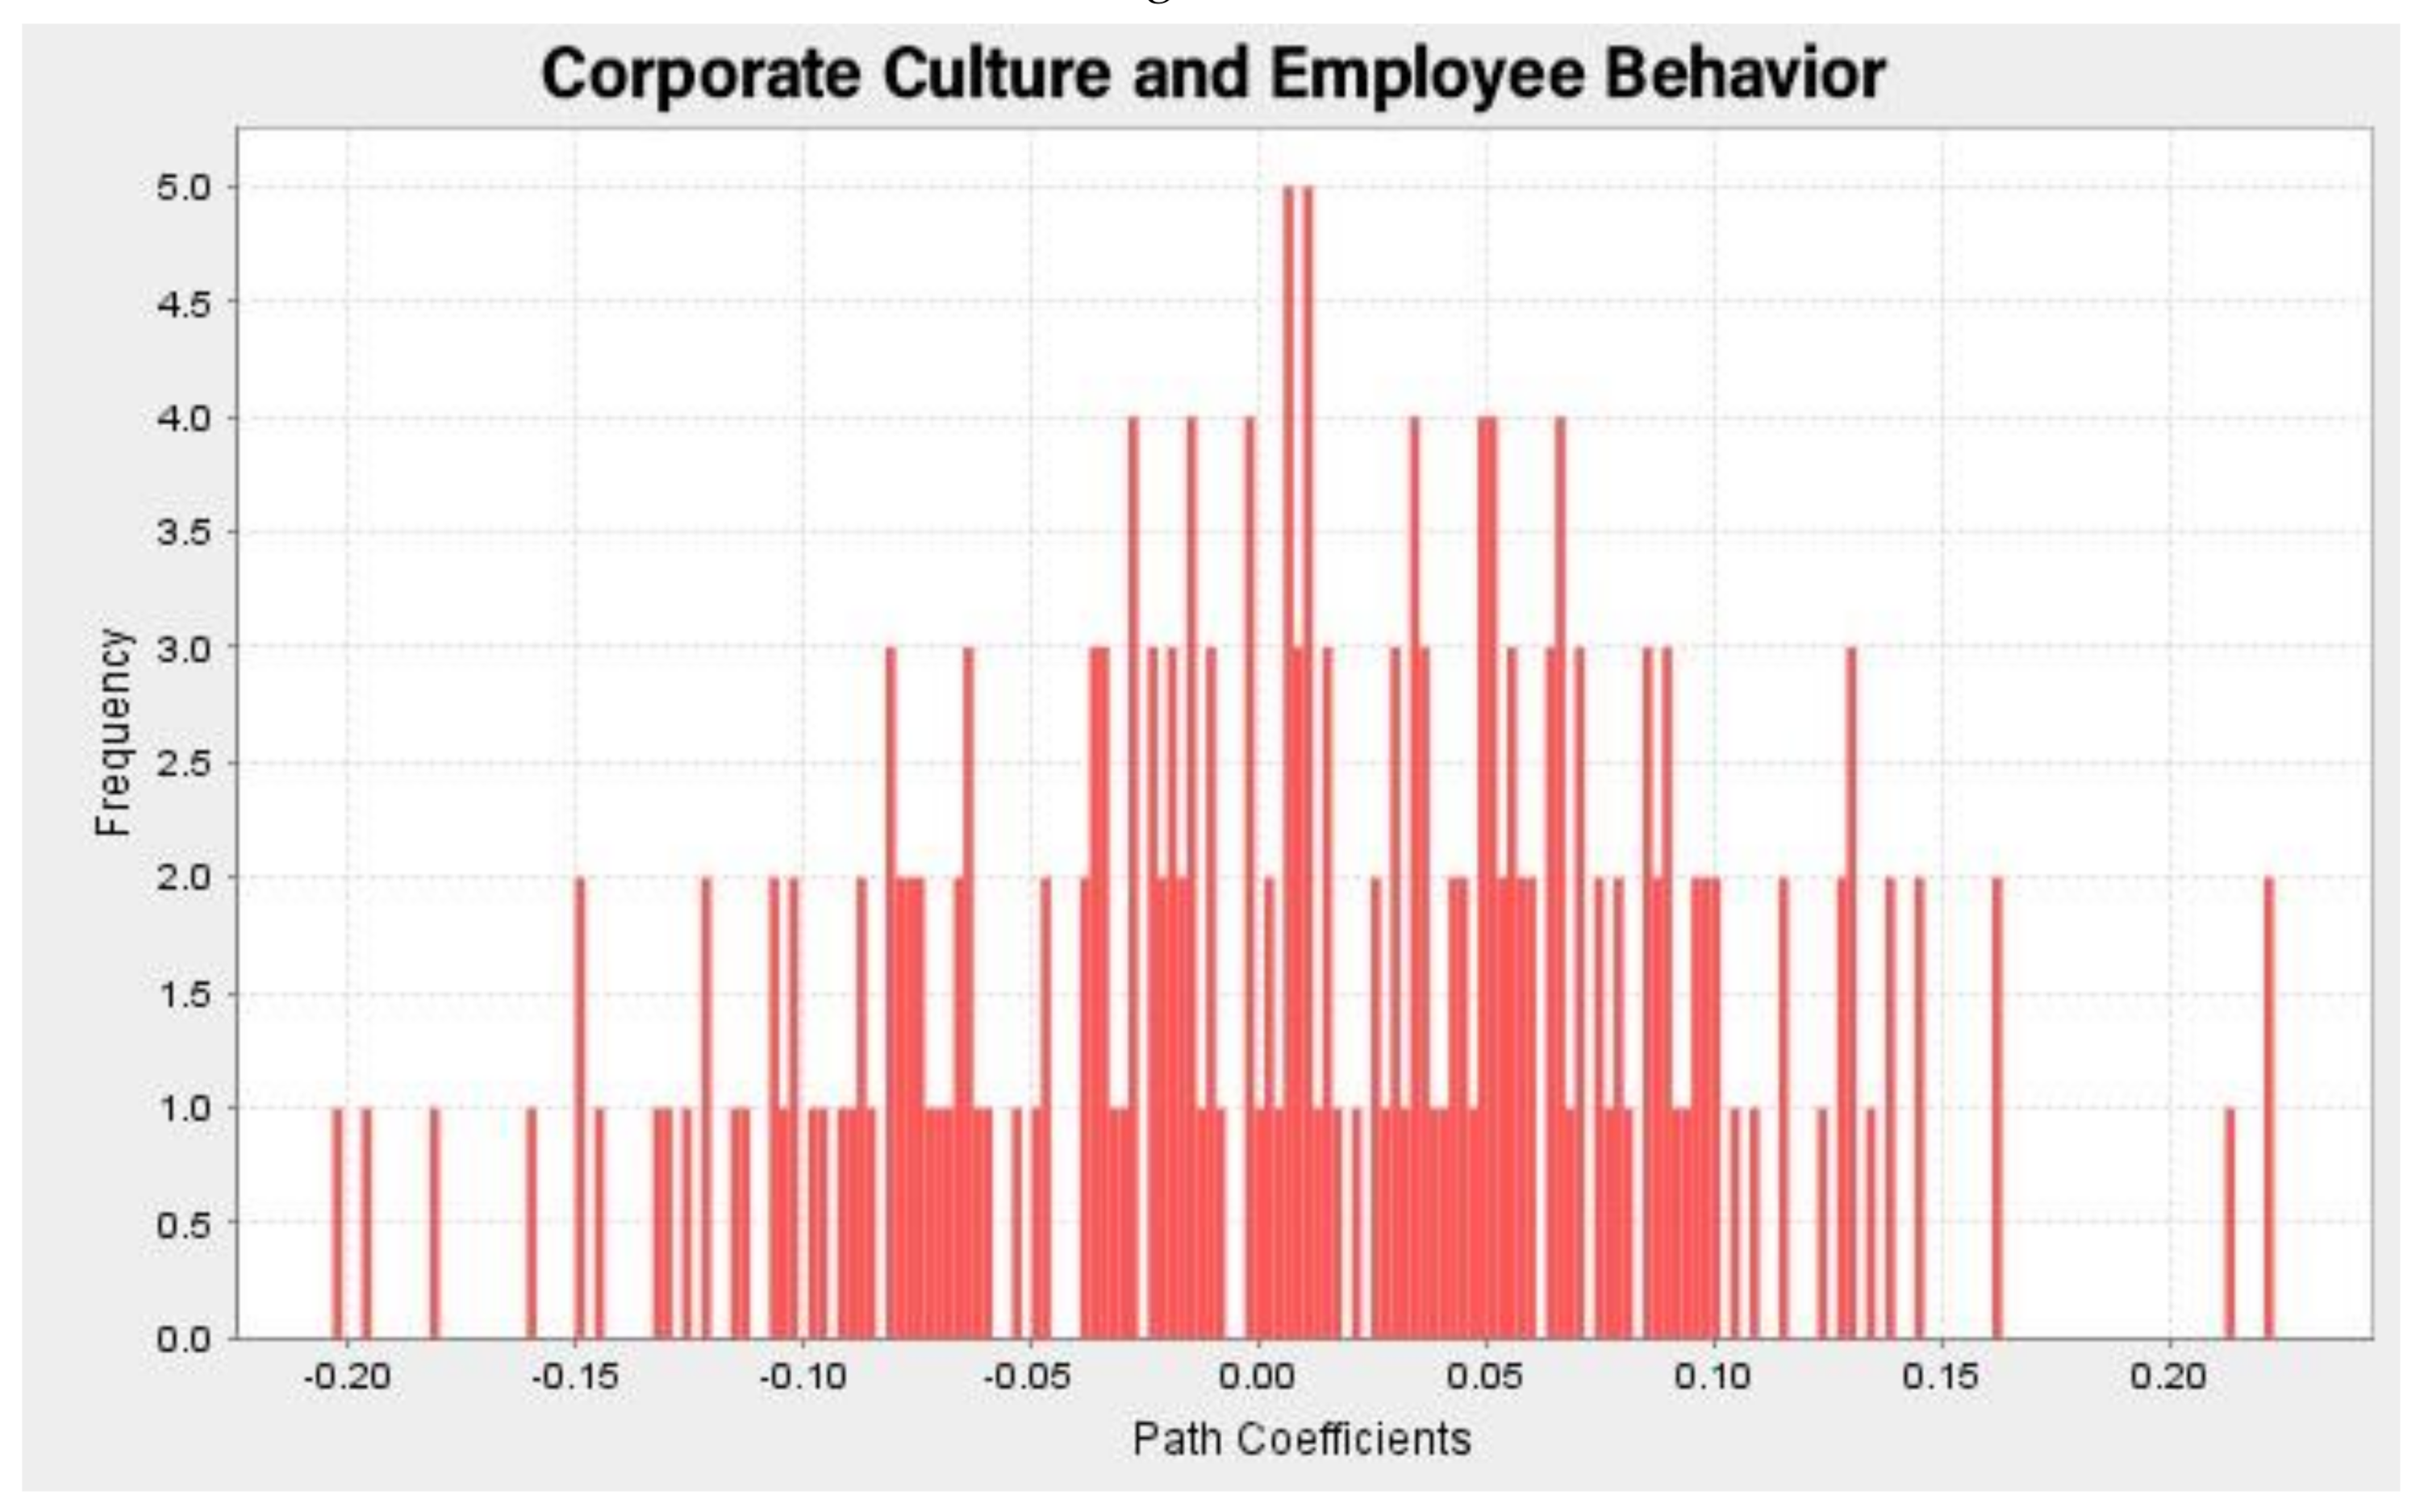
Hypothesis (H3): There is a significant impact of the corporate culture of the UAE on expatriate employee behavior.
Hypothesis (H4): There is a significant impact of the corporate culture of the UAE on productivity of an expatriate employee.
Hypothesis (H5): The work culture of diverse nationalities has a significant impact on organizational performance.
1.8. Theoretical Implications
Corporate culture can have a profound impact on employee morale, hence, it can be considered as the organization’s brand. A good corporate culture can attract better talents and inspire its employees towards better productivity. An organization with a strong corporate culture can leverage better performance from the employees, as they feel valued, and thereby gain better involvement in new tasks as well as in decision-making. Increased job satisfaction and loyalty to the organization are seen among the employees in an organization with a strong corporate culture. A corporate culture that promotes flexibility, supports professional development, and provides work–life balance will be the key attraction for a prospective employee. A positive work environment will minimize boredom and make the work exciting as well as interesting.
1.9. Limitations of the Study
- (1)
Although the study has been implemented very systematically, it could suffer from two deficiencies.
- (2)
The data collection may not have harvested sufficient data for generalizing the conclusions.
- (3)
An in-depth interview with the HR manager may have included subjective and personal comments.
- (4)
The research investigates only two cases of one industry: the financial industry.
2. Review of Literature
A study conducted by Sivakami and Samitha [
24] on 50 employees of Source Edge Software Technologies Pvt. Ltd revealed that there is a significant and strong relationship between the culture and performance of employees. Organization culture has made strength in the work environment. The findings further showed that the workforce is satisfied with the organization, and expected to remain in the organization for an extended time. A representative who is exceptionally associated with accomplishing the general objectives and targets of the organization is viewed as the basic indicator of organizational performance.
Ababneh et al. [
25] conducted a study by gathering data from 249 members of 26 colleges concerning personnel perspectives and practices. The study revealed that there is a considerable relationship between work attributes, business-related perspectives, and authoritative citizenship working in a non-Western nation, the UAE. The researchers found that there was a strong link between organizational commitment and civic virtue, and was more grounded than the link between authoritative responsibility and unselfishness.
Kapiszewski, A. [
26] found diverse behavior in migrant workers in Arab and Asian countries. This behavior of migrant workers happened on account of their pressure on labor markets, reduction of unemployment, and accelerated development. The employment of foreign workers is both gainful and expensive for receiving nations. The advantages of gain to the foreign workforce are genuinely perfect. These foreigners provide an essential workforce and specialization, with required skills, attitudes, and inspiration to the national consumption of goods supplied by native traders, and thereby increase the sales of local markets. They are typically capable of finding better remunerated jobs than those of their home country, providing a quality standard of living, and making opportunity for quick career advancement. They are capable of saving and, by remitting money to their home country, often called “motivating the economy in their home nations,” they do more than just provide for their families alone. The existence of a huge number of expatriates, a main threat to the constancy of GCC nations, risks the culture, impacts the organization of society, and has a strong influence on foreign policy.
Cherian, J. et al. [
27] highlighted higher education and elaborated that there is a need to foster an institutional culture of innovation among higher education institutes, which, in turn, will improve creativities and create awareness of the remuneration resultant from the accomplishment of innovation. This also minimizes the resistance to change and motivates openness to innovation.
A theory of implicit leadership in a cultural approach has been explained by Abdalla and Al-Homoud [
28]. According to their studies, the Arabian Gulf countries, from the early 1950s onwards, conveyed a version of modernization of hospitals, schools, and roads. The officials of Arab expatriates have developed work approaches and native administrative styles. Therefore, the current native administrative style is a combination of official and customary tribal techniques. Relying on expatriates is necessitated on account of a high illiteracy rate and deficiency of required aptitudes among locals. Though the outcomes display the high bunch of knowledge and education for exceptional leadership, certain leaders, predominantly the uneducated, are apprehensive of professional judgment, and they doom originality, intelligence, and imagination.
A study conducted by Shaw et al. [
29] on organizational commitment and performance among guest workers and citizens of an Arab country revealed the relationship between expatriates and local citizens. The Arab officials often positioned a stronger emphasis on organizational devotion than on personal devotion. UAE citizens with an extraordinary range of commitment to organizations may be dedicated to task performance. Serving behaviors decreased as affecting commitment altitudes enlarged across the sample, though the correlation was much tougher for UAE citizens than expatriates.
Barney [
30] opined in 1986 that a firm’s culture should generate sustained quality improvements. He acknowledged previous findings that the cultures of some corporations have imbibed this attribute. Corporations that do not have the desired cultures do not implement activities that will drive them to quality initiatives in order to generate sustained superior profit margins. Corporations that have cultures with the desired attributes will get sustained superior profits from their cultures. In fact, this is consistently observed: when a quality culture is achieved, all employees, from senior leadership to frontline staff, have infused quality improvement (QI) into the way they do business daily. Employees, at length, considered the ways improve quality, which was no longer seen as an additional task. Quality improvement (QI) refers to the consolidated and continuous endeavors of everyone in an organization to make every little thing about it, particularly its production process, better. It is a precise way to deal with the disposal or reduction of work, waste, and misfortunes in the production process.
Hafeez et al. [
31] found in their study on the “impact of workplace environment on employee performance” that there is a significant positive relationship between physical environment factors and employees’ health. They also found that there is a positive and significant relationship between behavioral factors and employees’ health. However, a blend of monetary and non-monetary rewards is more compelling in accomplishing higher levels of employee performance, which leads to accomplishment of organizational objectives. Improving physical and behavioral factors will improve the health of employees, which can lead to the employees performing their tasks more effectively.
Ghazi et al. [
32] also found that there is a positive relationship between organizational culture and job performance. They said that four authoritative culture sub-components, managing change, achieving goals, coordinating teamwork, and cultural strength, emphatically influence job performance, but with varying and distinct intensity. Customer orientation alone was adversely connected with job performance.
The results of the study done by Lolowang et al. [
33] showed that the direct leadership has no significant effect on employee performance; organizational culture has a significant effect on employee performance; leadership has a significant effect on work motivation; organizational culture has a significant effect on work motivation; work motivation has a significant effect on employee performance; work motivation is a perfect mediator of the influence of leadership on employee performance; and work motivation is a partial mediator of the influence of organizational culture on employee performance.
According to Kerdpitak et al. [
34] the organizational culture and high responsibility of employees are essential for successful human resource management practices, as the culture and responsibility enhance the inspiration of the employees to adapt with organizational goals.
A recent study conducted by Kaur et al. [
35] on work culture and employee satisfaction in the banking sector found that the atmosphere of work has a strong association with employee satisfaction. The level of employee satisfaction was increased by employee engagement in the corporate decision-making process, collaboration, knowledge exchange, consistent comprehension of the task, creative atmosphere, and position clarification.
As per the findings of Kerdpitak et al. [
34] the laws and regulations that govern corporate culture and employee engagement, as well as organization citizen behavior regulations that improve the efficiency of human resource management, will eventually improve the performance of the business.
3. Methodology
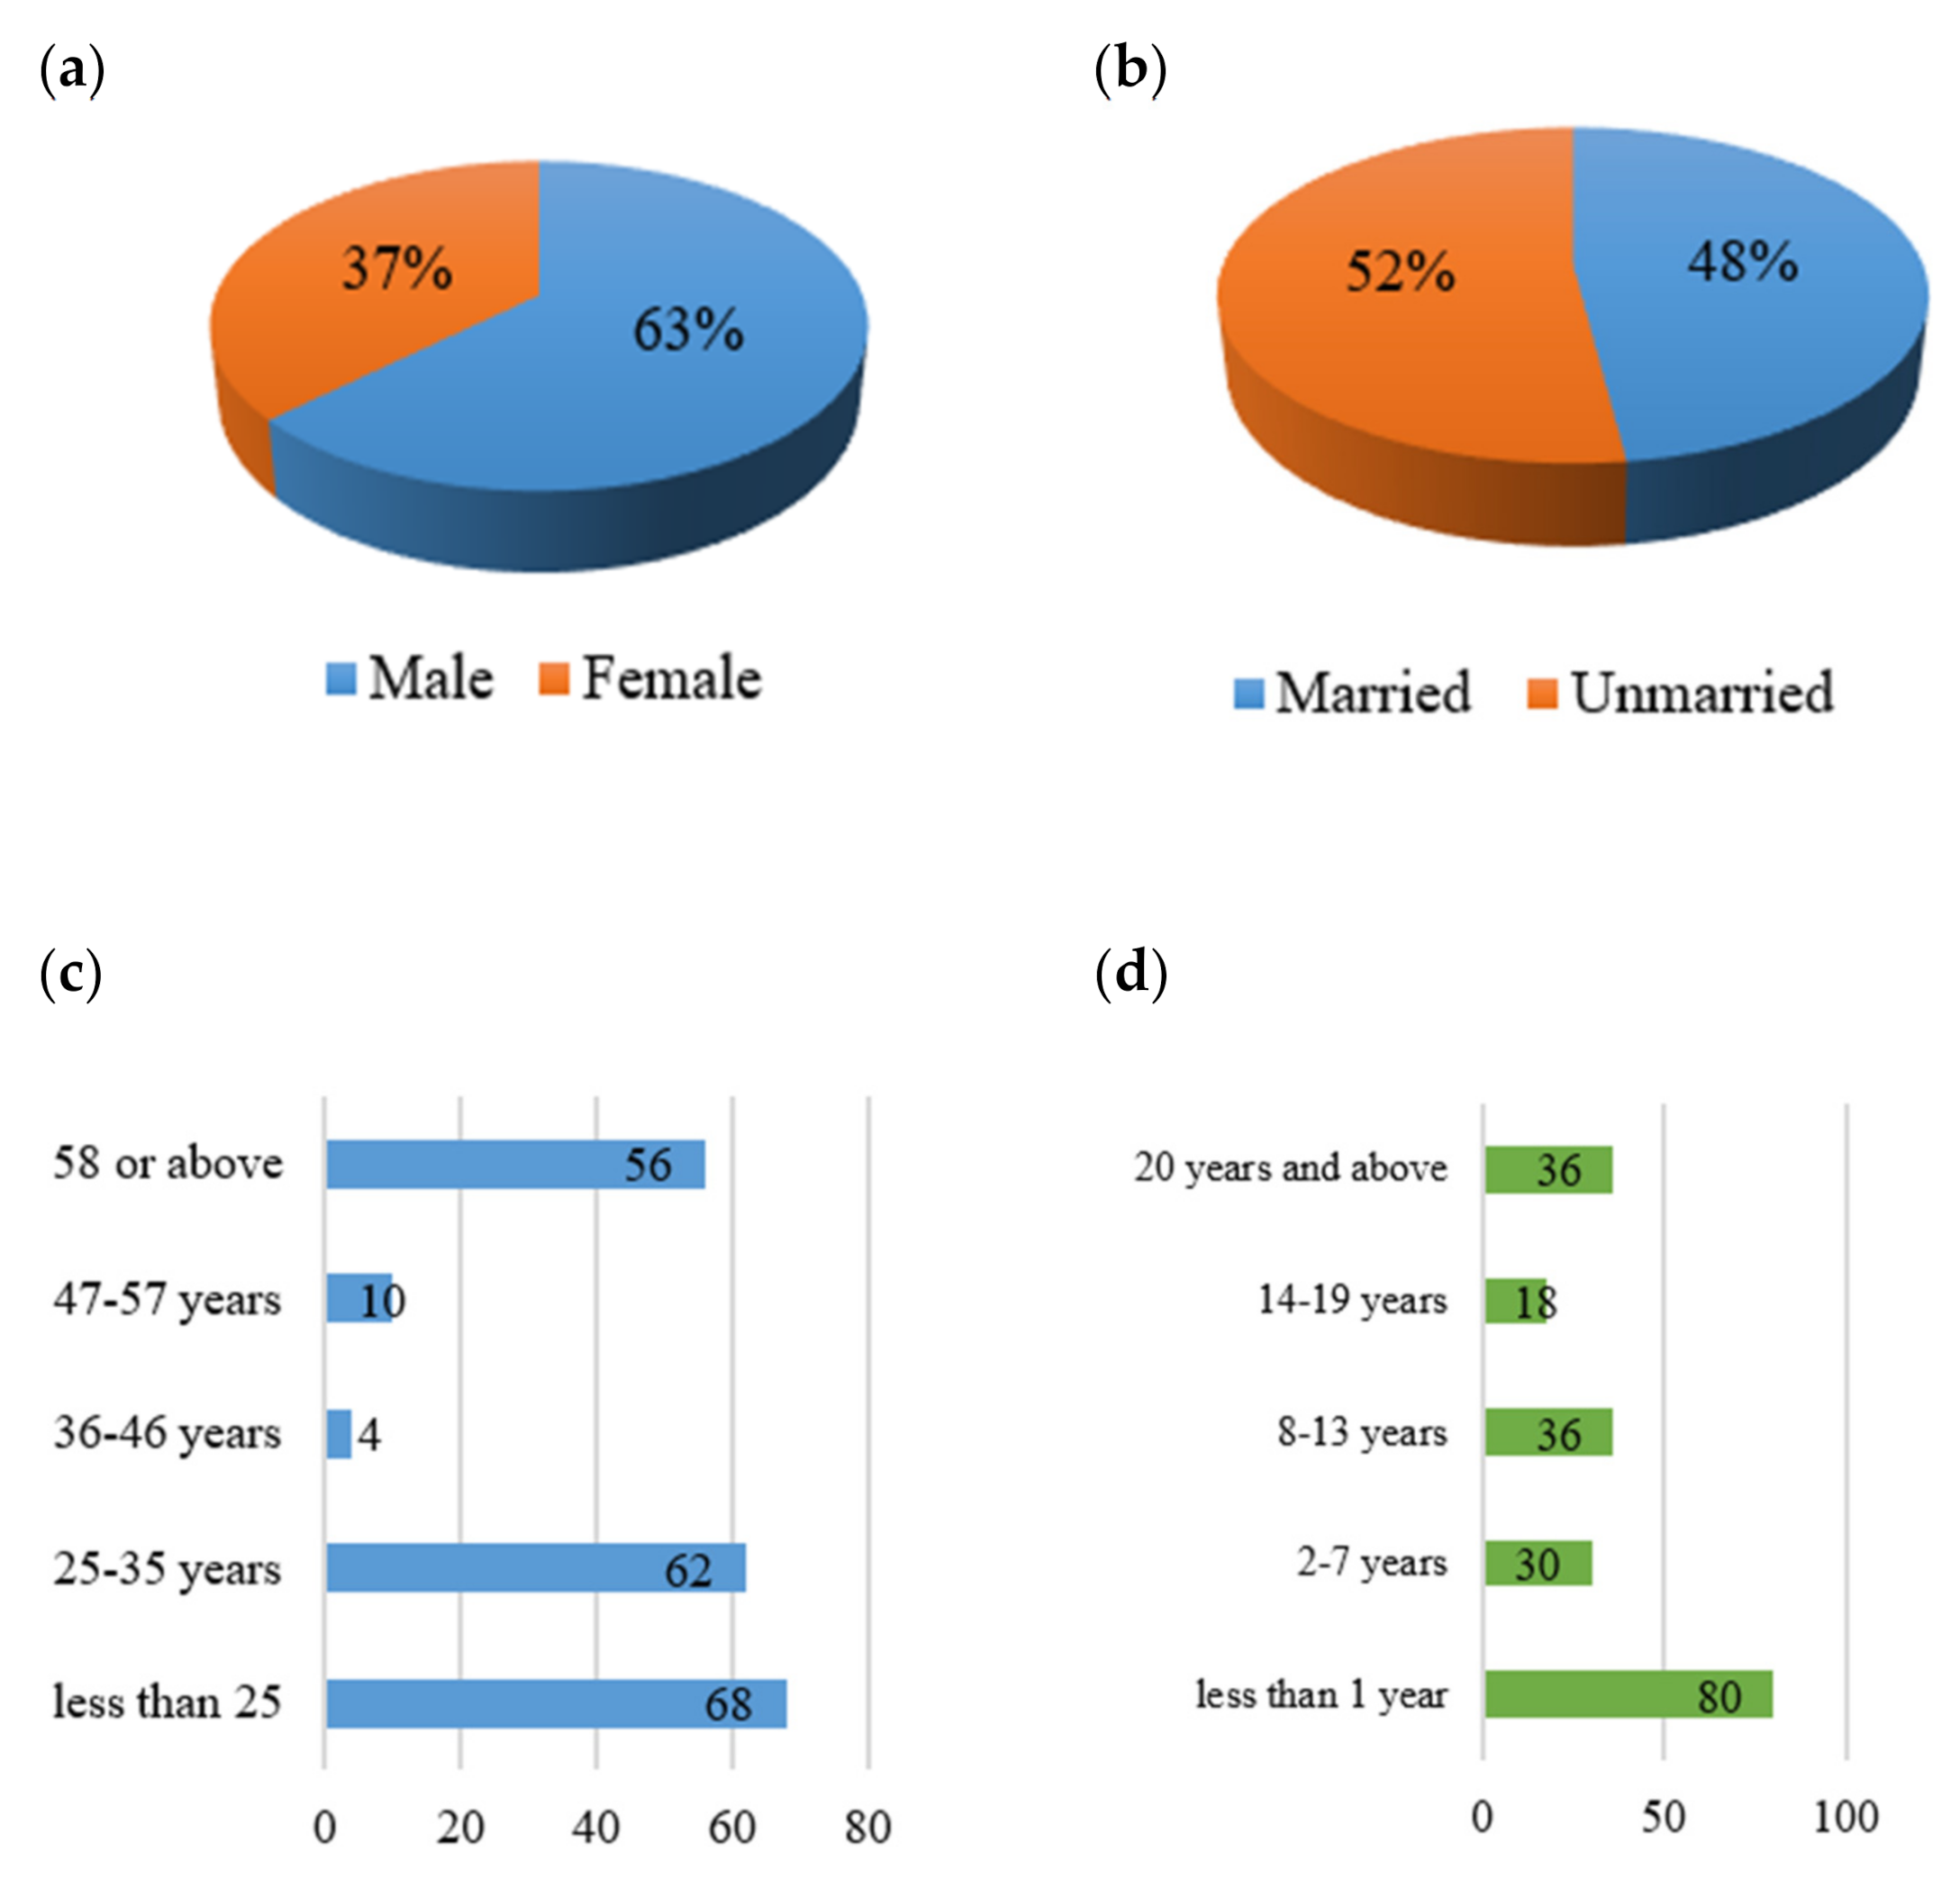
Data was collected from two forex companies of the UAE on a stratified sampling basis, which had a total working population of 415 employees. A questionnaire was developed for a self-administered survey, and was distributed among 275 employees of the total population. However, we received 221 questionnaires back after three weeks, out of which 18 were rejected for incomplete data. We finally considered only 200 questionnaires as the sample size, which was comprised of 126 males and 74 females. Stratified random sampling was used, for which the following formula was used to get the sample size of 200 [
36]
where
Z = Z value (e.g., 1.96 for 95% confidence level)
p = Percentage picking a choice, expressed as a decimal (0.5 used for sample size needed)
c = Confidence interval, expressed as a decimal (e.g., 0.05 = ±5)
The questionnaire contained personal information, including age, gender, marital status, experience in a corporate environment, experience in the position of the job, nationality, workgroup, and national origin to compile a composition, firm behavior, reasons affecting job fulfillment, and factors affecting institutional commitment. The questionnaires were presented in SPSS for data analysis. The style of the questions included the open-ended, closed, and Likert format with point–response scales. A Likert scale is a rating scale that requires the subject to indicate his/her measure of accordance to an assertion. Respondents were given five response alternatives ranging from 1 to 5. They are 1—Strongly Agree, 2—Agree, 3—Neutral, 4—Disagree, and 5—Strongly Disagree. The Likert scale was chosen because it provides precise and accurate results. It also addresses the open-ended questions systematically.
Quantitative analysis was used to measure the various perceptions of the employees. This analysis correlated the relationship between variables in a more direct manner. The researchers sought personal help from one of the HR managers while analyzing the data and findings.
3.1. Primary Data Collection
For this study, primary data were collected from the employees of two leading foreign exchange centers operating in Abu Dhabi and Dubai, the main Emirates of the United Arab Emirates. The respondents were comprised of 126 males (63 percent) and 74 females (27 percent); 52 percent of the respondents were married and 48 percent were unmarried. A foreign exchange company, otherwise known as a forex broker, does currency exchange and international payments. All of the respondents, both male and females, were from the clerical cadre. The term is regularly utilized for cash transactions that offer actual conveyance, not towards the ledgers. With Dubai being the center of the economic activities, the investors from throughout the world come to Dubai to explore investment opportunities, and thereby the need for cash trade organizations in Dubai emerges.
A questionnaire was used to collect the data. The questionnaire contained personal information like age, gender, marital status, experience in a corporate environment, experience in the position of the job, nationality, workgroup, and national origin to compile a composition, firm behavior, reasons affecting job fulfillment, and factors affecting institutional commitment.
3.2. Methods Used for Analysis
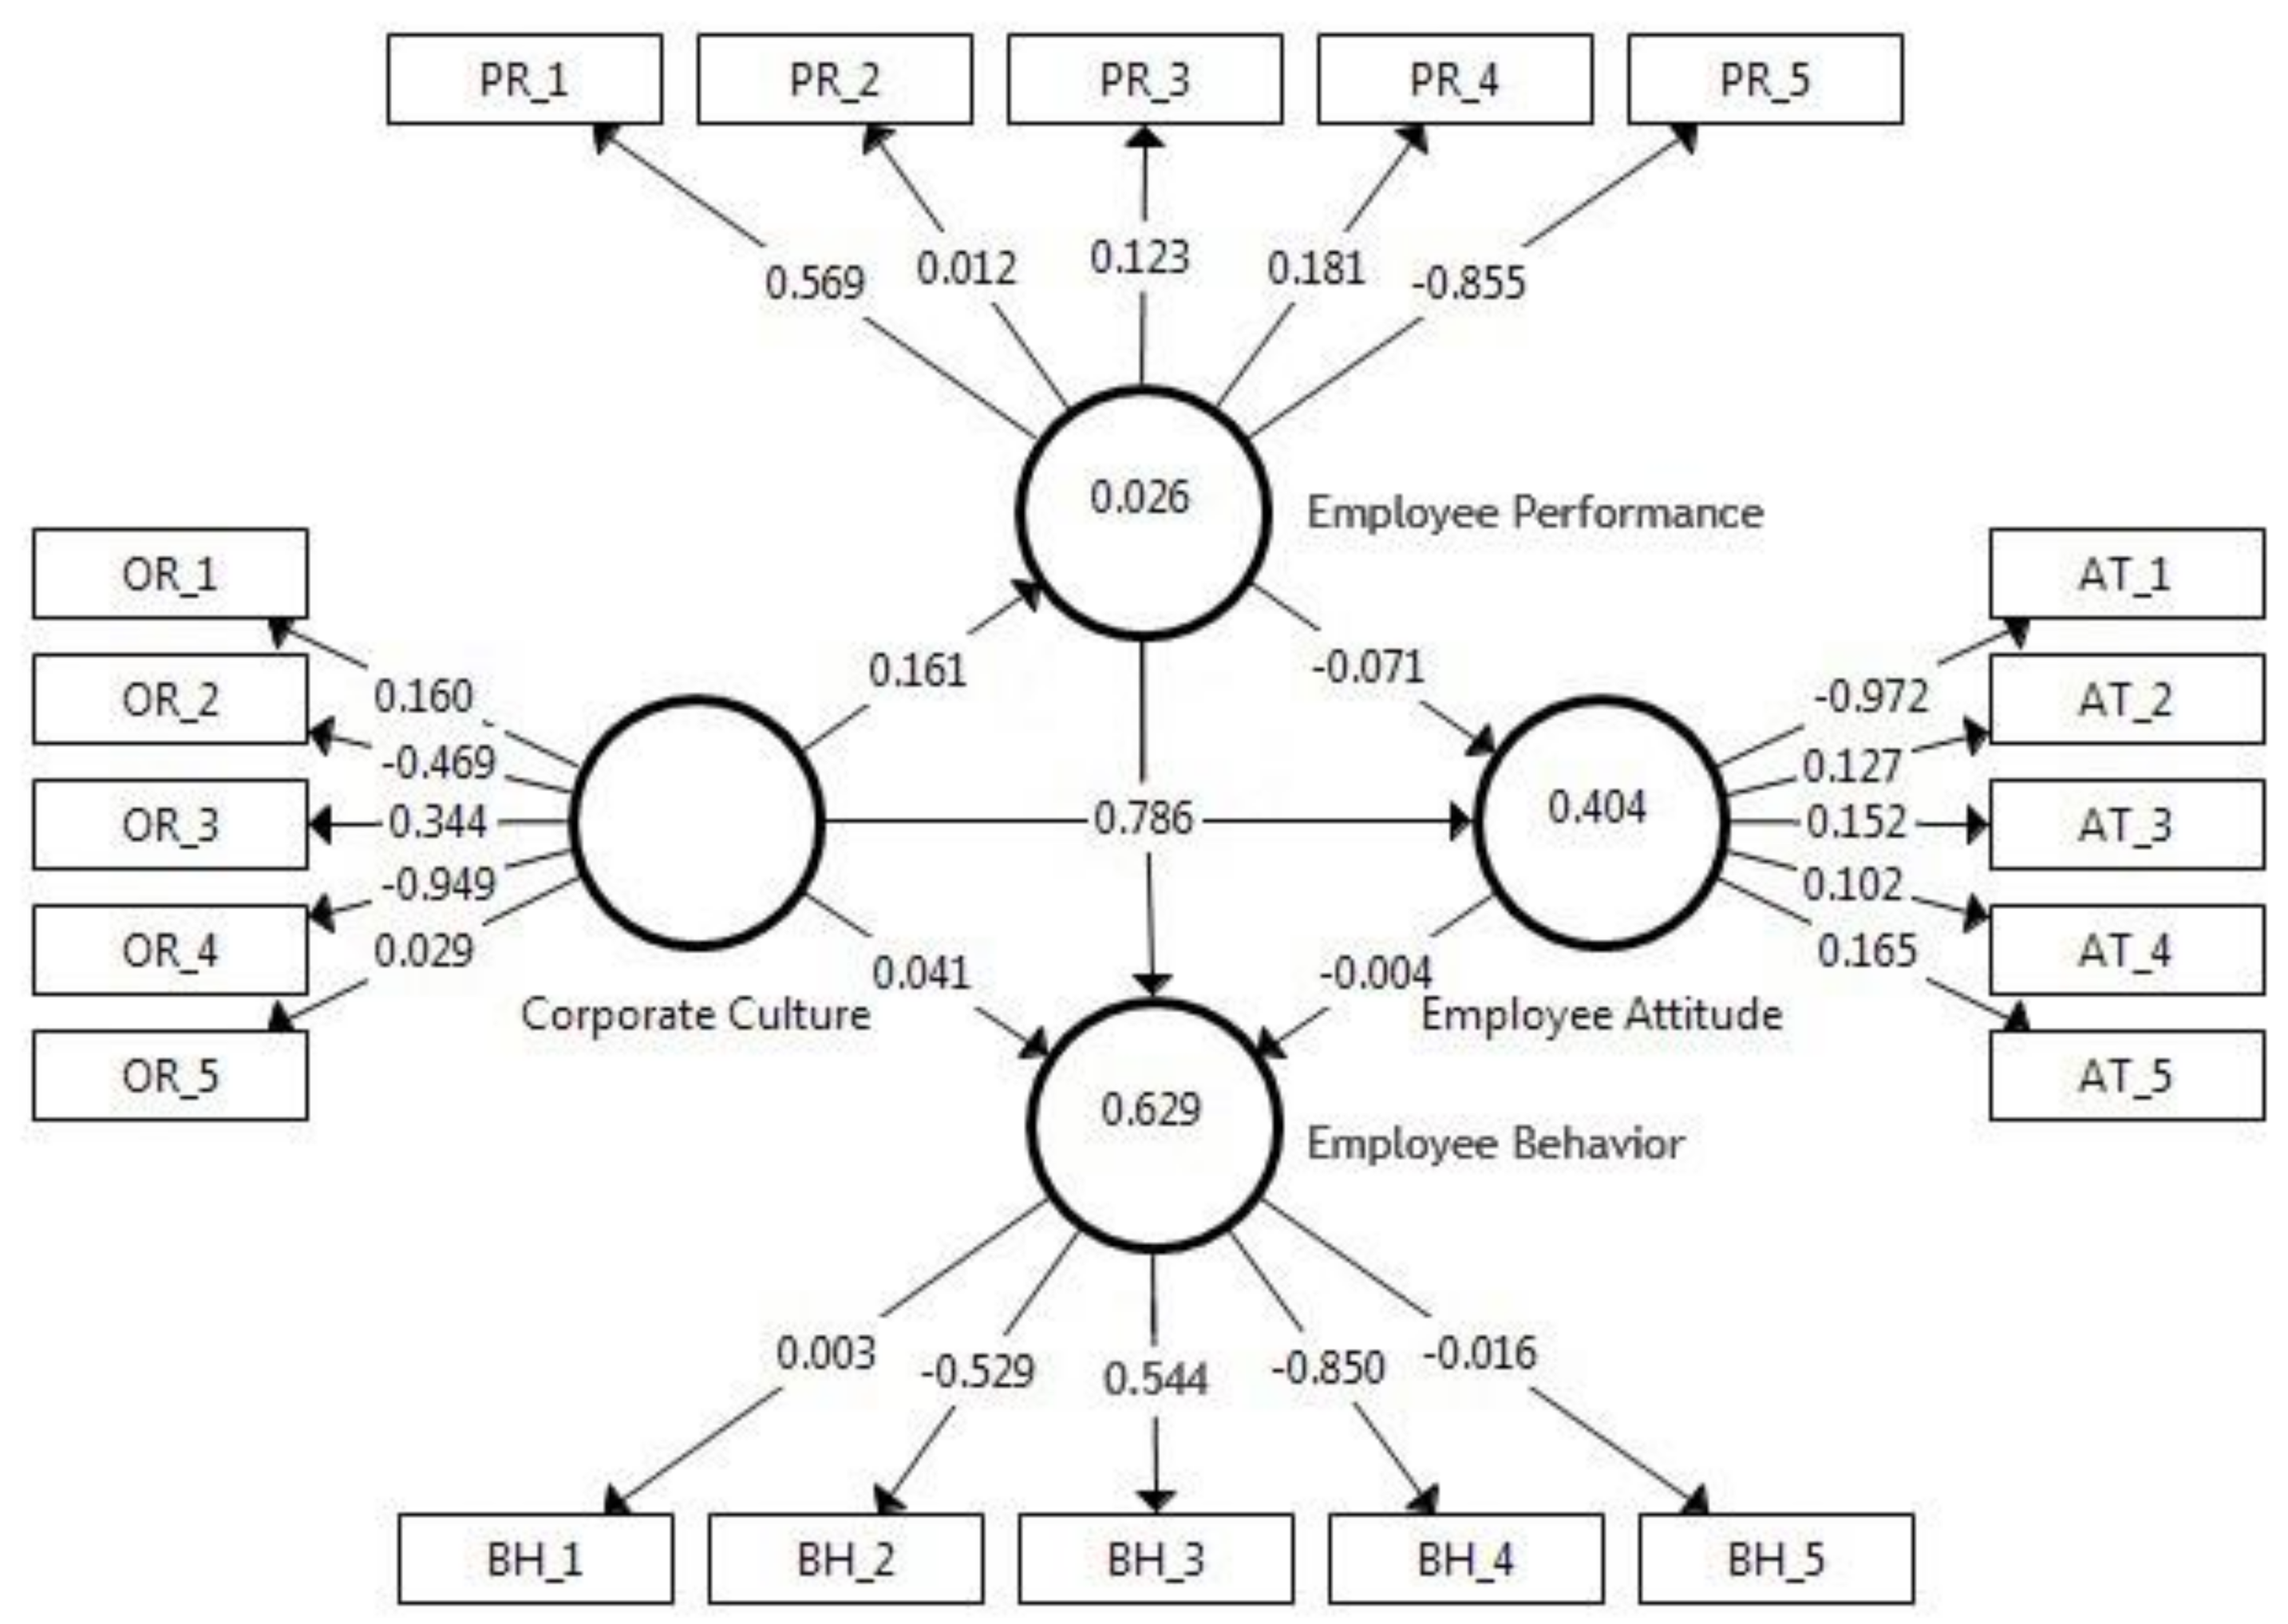
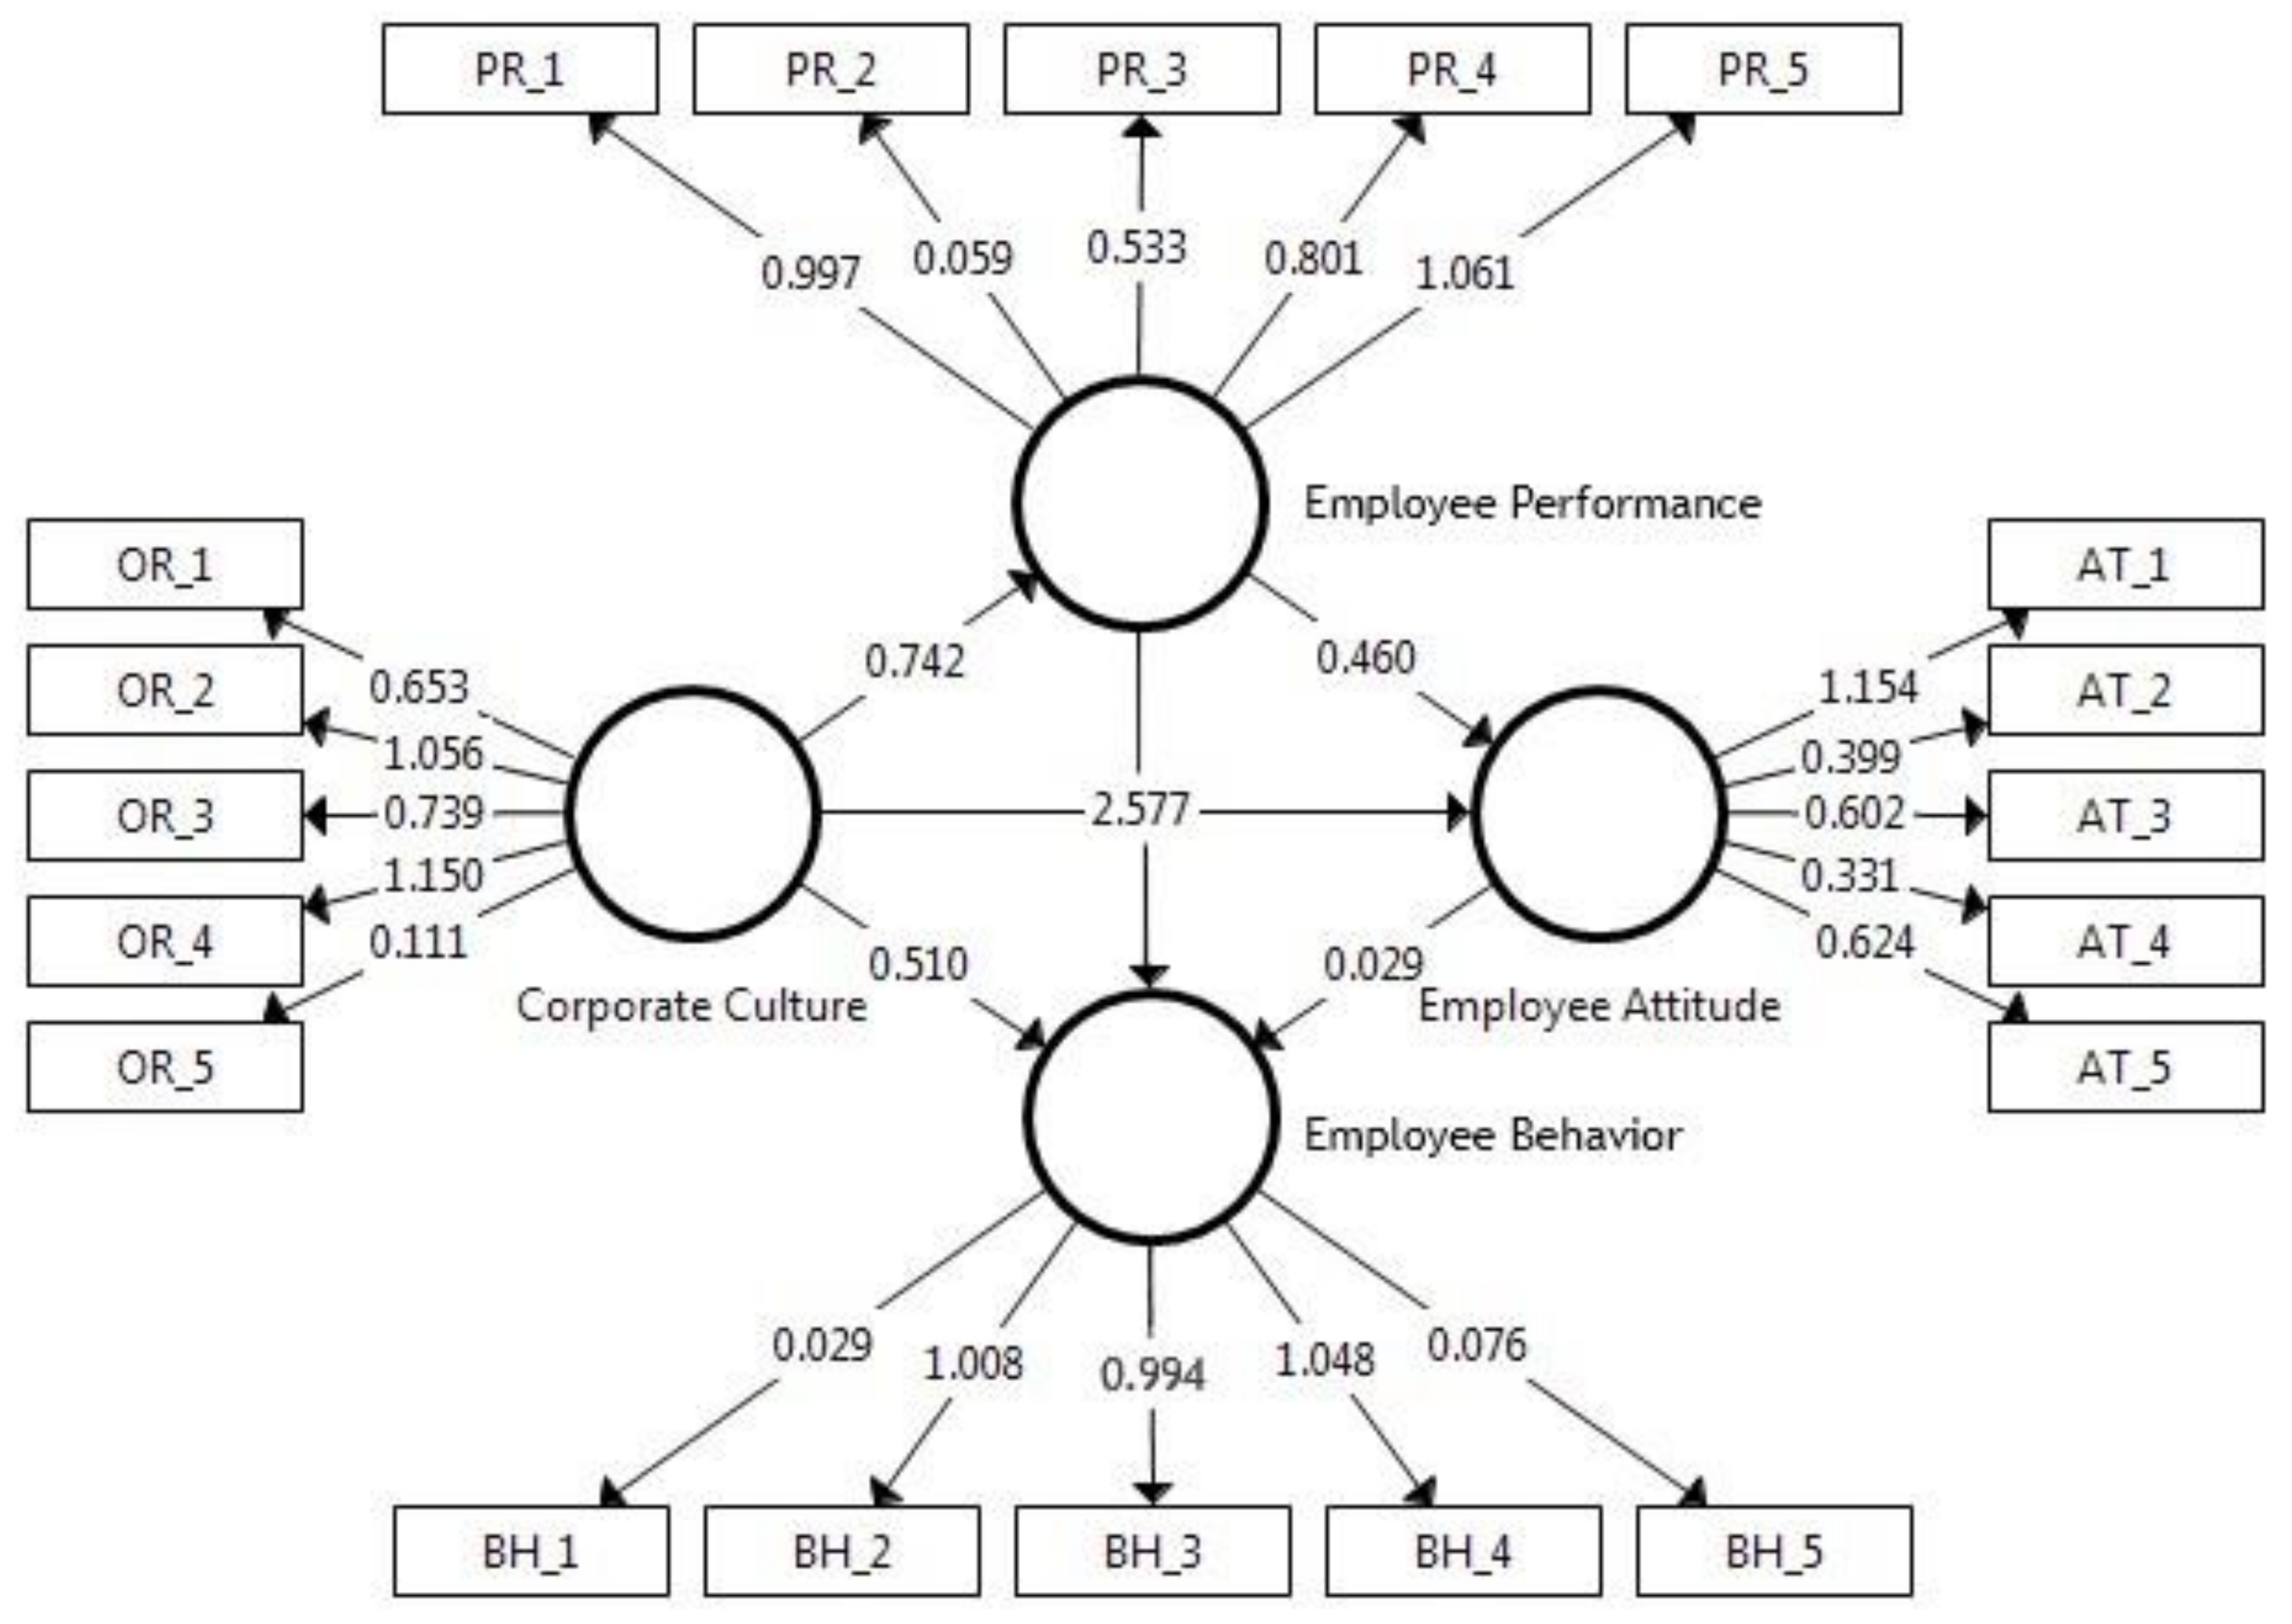
The respondents were given an assurance, while collecting primary data, that their identity would be kept confidential. Chi-square and ANNOVA were used for the study. The Smart PLS software was used in this research. This software uses the graphical interface for variance-based structural equation modeling (SEM), which is applied in the partial least squares (PLS) path modeling method. This software was used to prove hypotheses in this research. It has become a popular tool for analyzing relationships between latent variables, measured by sets of observed variables [
37,
38].
5. Discussions: Corporate Culture, Employees’ Behavior, and Open Innovation
In innovation literature, the use of external information for innovation has gained significant attention. Be that as it may, the human side of open innovation is still poorly known. We considered diversely cultured employees of many countries working in two organizations on the basis of their age, nationality, qualifications, and experience. The chief advantage of such a diverse group of employees is that it fetches many innovative ideas, which will ultimately lead to the development of the organization.
Organizations may not effectively use innovative ideas of its own using their own employees. The diversity of workers, thus, will often lead towards open innovations. They will embed outside–in external concepts and best practices into that organization’s own innovation process. An organization’s participatory and decentralized approach would surely contribute to an effective organizational culture in the pursuit of innovation. Therefore, it is always better to incorporate the underutilized ideas that are effectively shared among the employees of various countries.
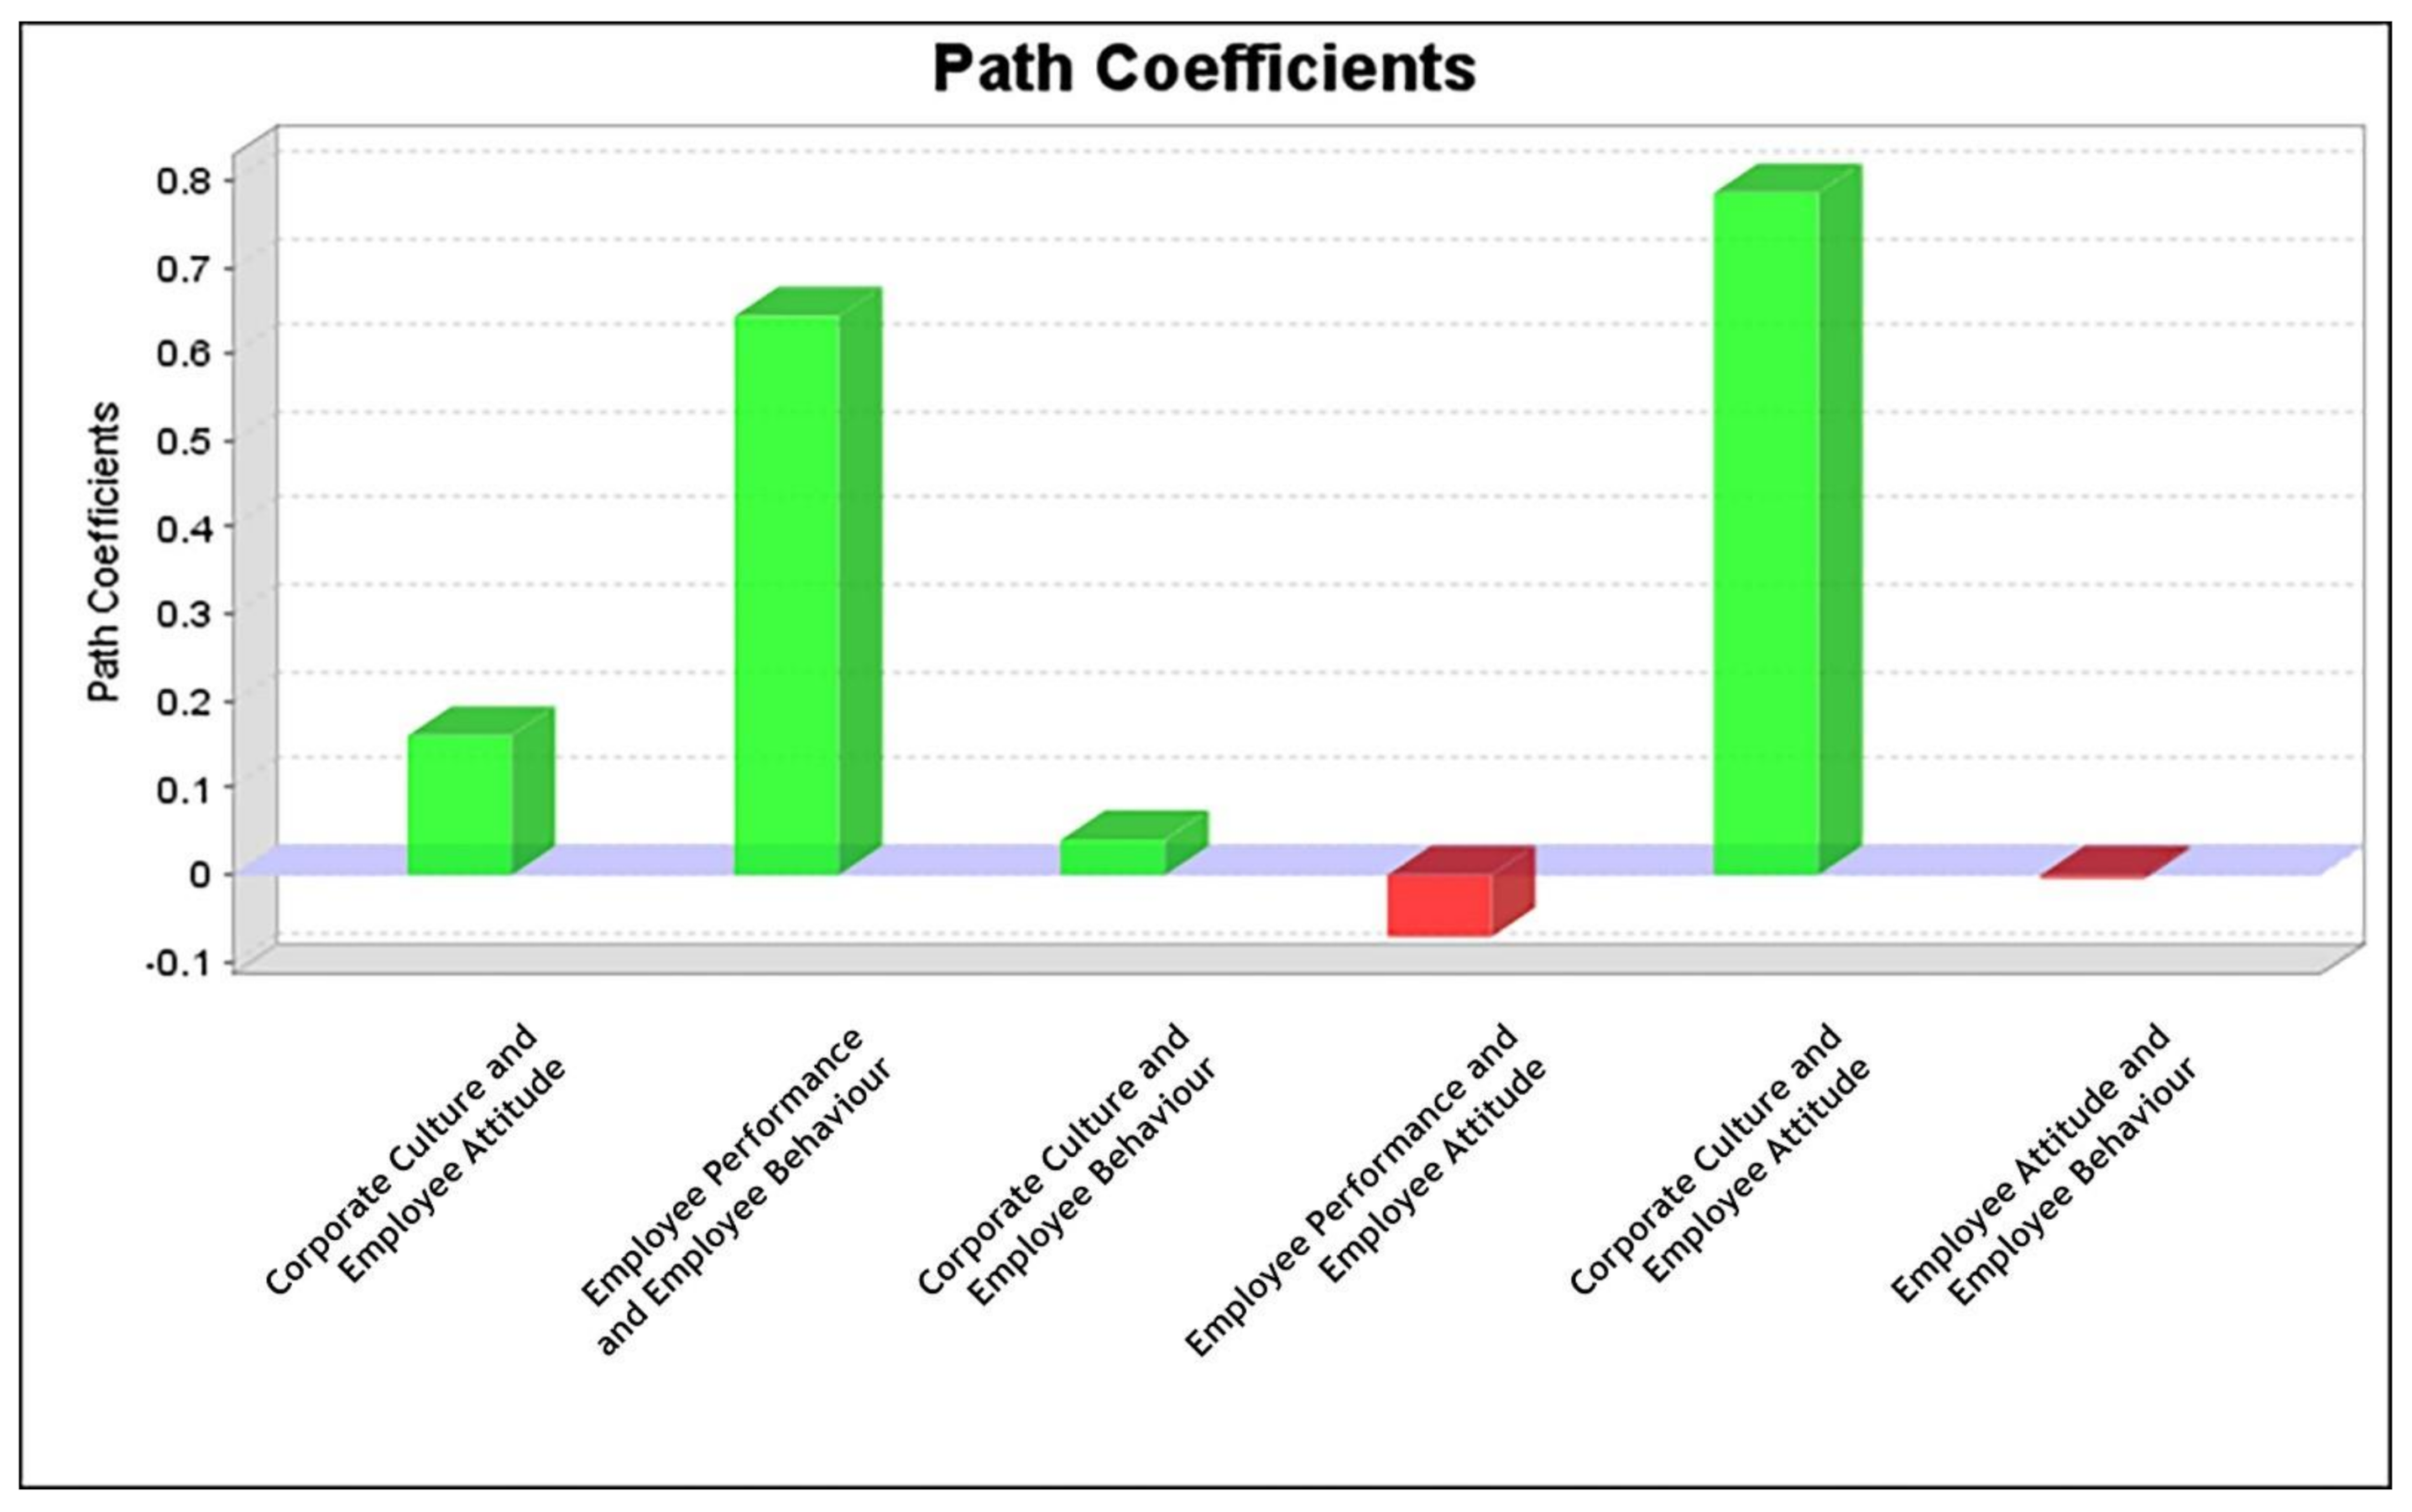
We find support for our hypotheses in an innovative way that there is a high influence of corporate culture on job efficiency, attitude, and actions of employees of the two selected companies. In consequence, although the composition of the two cases in the UAE forex industry shows a high degree of heterogeneity, the work culture of each has a major impact on employees. Hence, we considered the role of corporate culture concerning the prediction of firm-level openness.
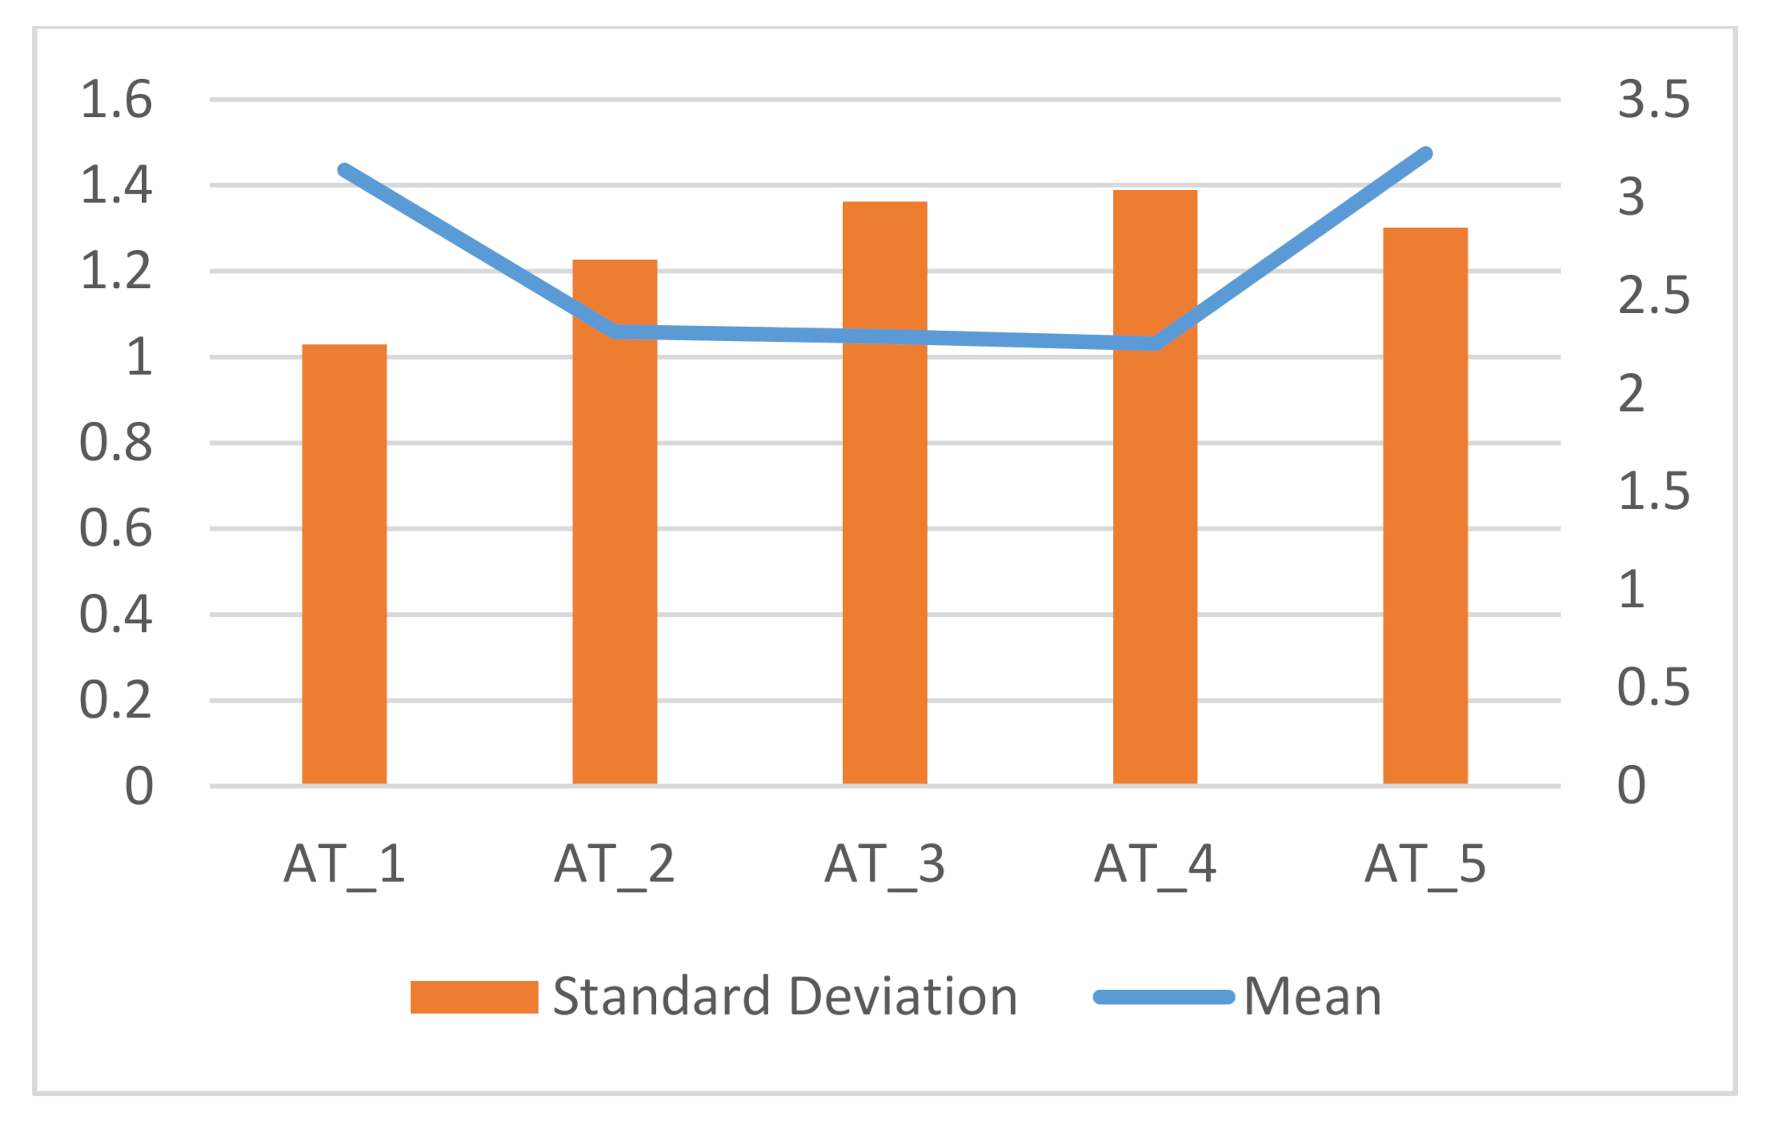
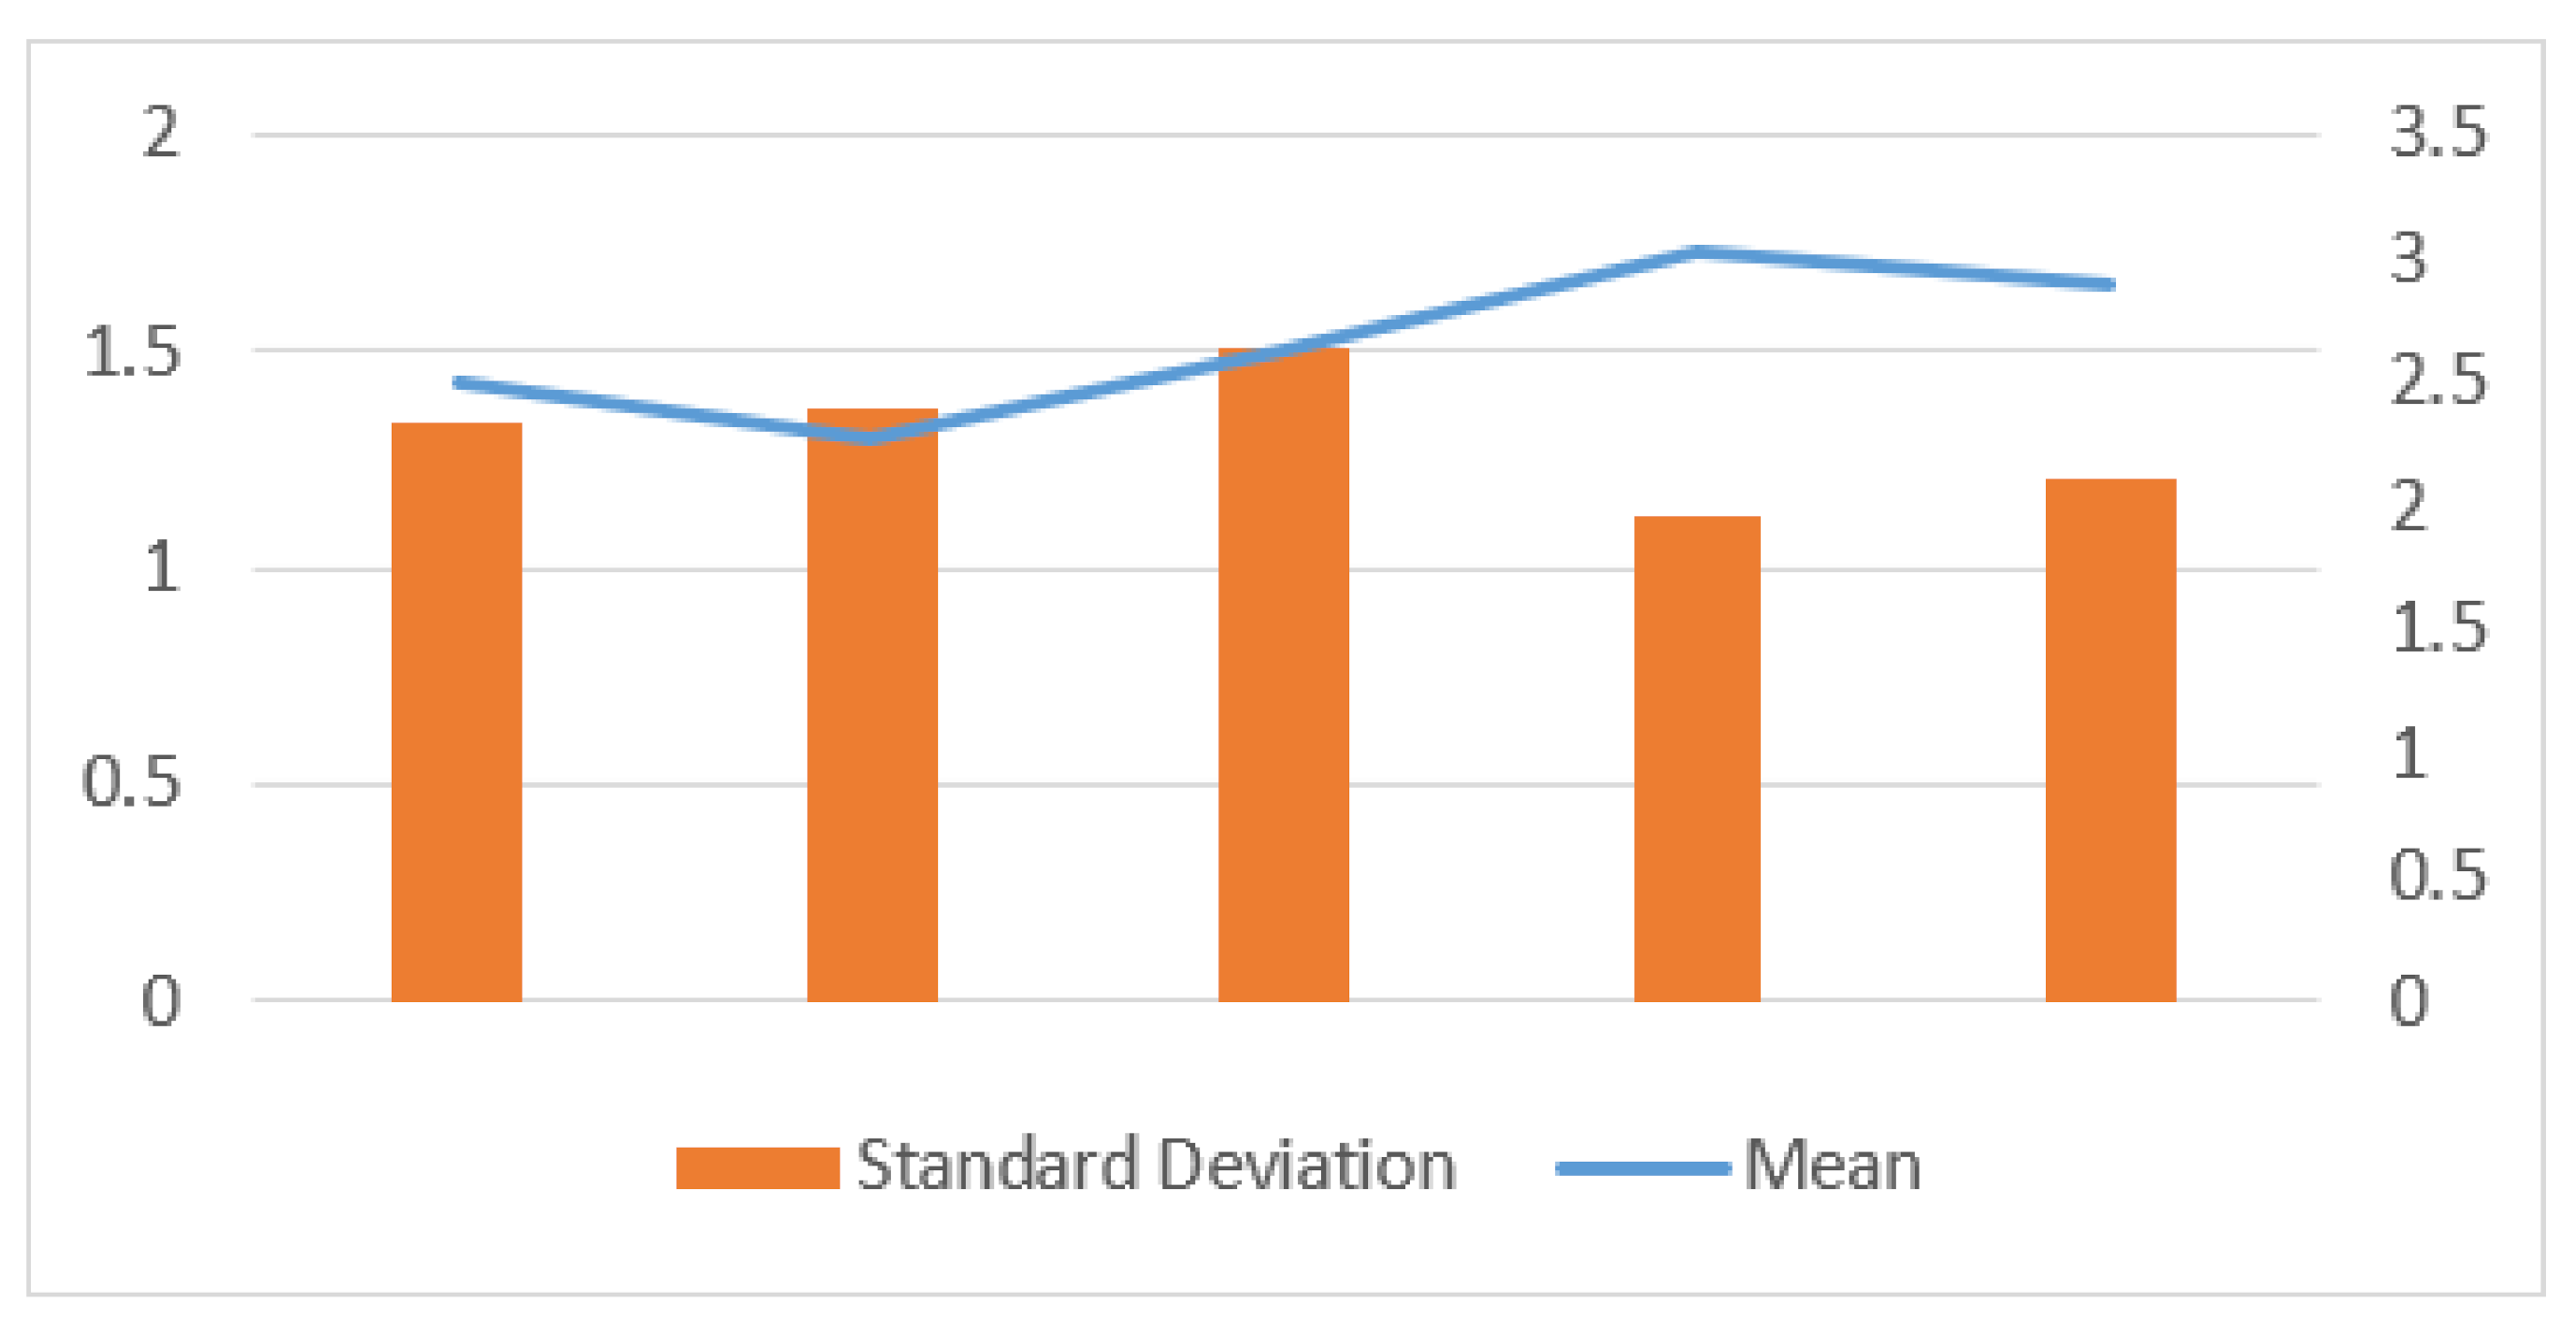
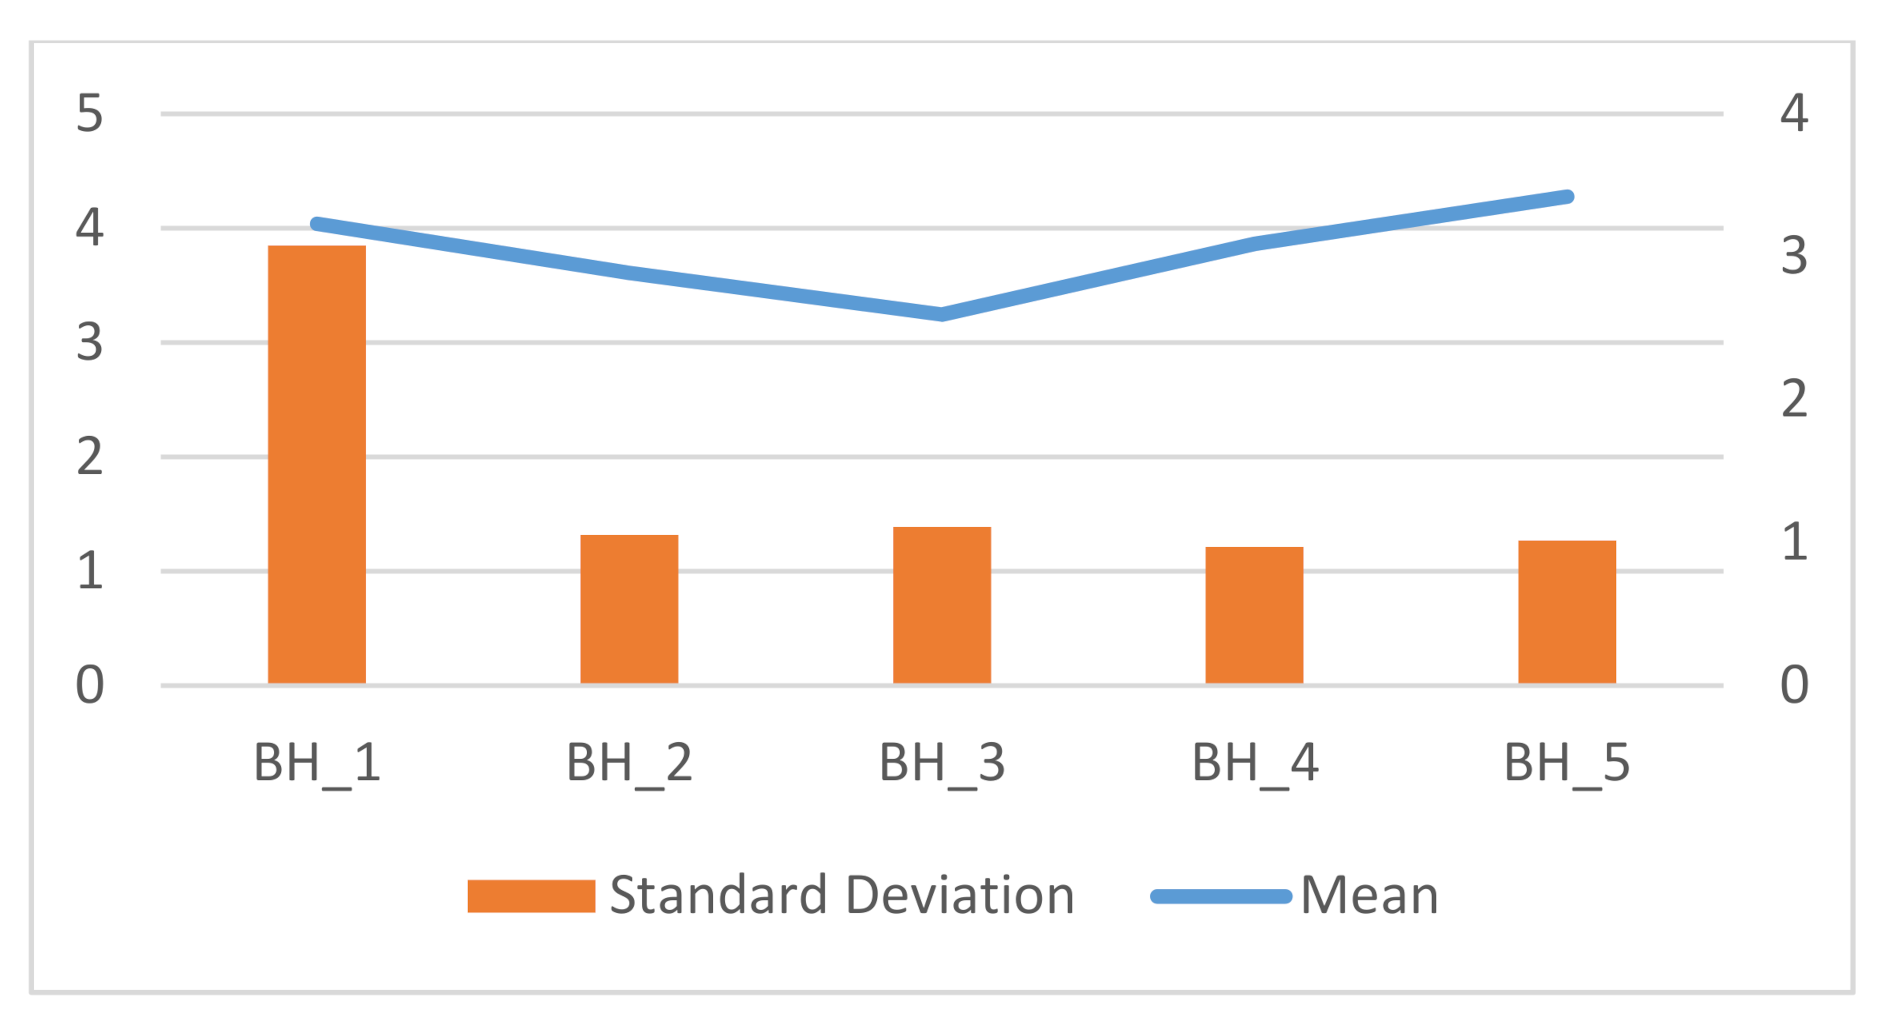
The largest proportion of employees, 69%, agreed that corporate culture makes a significant or meaningful impact on their performance, while 62% and 63% of the employees additionally agreed that corporate culture has an impact on attitude and behavior, respectively, and about 69% of the employees agreed that a company influences the productivity level of the employees and, therefore, the organization itself. This paper notes by quantification, therefore, that heterogeneity is still subject to significant impacts on employees’ attitude, performance, and behavior. This is demonstrated within the first hypothesis, in which the calculated value of chi-square is 68.85, 63.45, and 40.35, and these are higher than the tabulated value of 9.488. There is also a noteworthy impact on the employees in relation to organizational productivity. The calculated value of chi-square, 68.2, is larger than the tabulated value of 9.488, which leads the authors to accept alternate Hypothesis Four and to dismiss Null Hypothesis Four.
The reasons why work cultures in the UAE can exert such pressures towards conformity are subject to further investigation. More research in this phenomenon would widen our understanding of the ways in which work cultures operate in the UAE. However, the following may cast light on this phenomenon, even though this falls outside of the scope of this investigation. In addition to all of the aforementioned research findings about the nature of work culture, the UAE, as well as other countries in the GCC region, has unique conditions that may exert more influence than in heterogeneous workforces in more developed economies. Work cultures in the UAE may exert particularly strong pressure on employees because expatriates are subject to visa restrictions. Work visas are issued for one, two, or three years depending on circumstances, and correlate directly to residence visas. Without work, no work visa may be issued, which means that an expatriate must, by UAE law, return to his or her country of origin within a month. Since the majority of expatriates come from developing countries, they work in the UAE to support families who would otherwise not be well-supported financially in those countries. This situation generates considerable need, and would exert pressure for expatriate employees to conform to work cultures, because if they did not, they would be deemed unsuitable, and the consequences would likely be finding more suitable employment within a month or a return to their home country.
6. Conclusions
In this study, the researchers investigated the effect of corporate culture on employees’ job performance, attitude, and behavior in selected companies in the UAE. In effect, even though the composition of the two cases in the forex industry in the UAE shows a high degree of heterogeneity, the work culture of each impacts the employees to a high extent. The selected sample size allowed the researchers to reach the data saturation level in the study and to draw the conclusions based on sufficient data. The study had multiple stages of validity and credibility analysis. Research findings were consistent with the historical and new literature, based on a critical analysis and synthesis of literature related to the conceptual framework of organizational culture theory.
The questionnaires were administered to employees who were randomly selected from two forex organizations within the two major cities in the UAE to discover their opinions on whether corporate culture had an effect on their job efficiency, perspective, and conduct. The authors deduce from the data that corporate culture is a major influence in the two corporations under investigation, and that it indeed has a notable influence on employees’ performance, attitudes, behavior, and productivity, according to the participants in the study. Apart from that, corporate culture may affect employees to a different extent, but employees acknowledge that the influence is powerful. The authors conclude that culture has a notable effect on the productivity of UAE employees, with the purpose to reinforce their performance and generate corporate growth. Every organization has a unique culture and set of beliefs that an employee must understand and internalize, regardless of their previous nationality and background. The degree to which an employee adjusts to the corporate culture and integrates with it will significantly influence his or her performance. One corporate culture can collectively bind and produce uniformity even amongst diverse members of the organization, and, accordingly, enhances dedication and employee efficiency and effectiveness.
6.1. Recommendations
The authors make the following recommendations to corporations and other organizations that are interested in applying their culture with a view of facilitating their employees’ performance and efficiency:
- (1)
Management acculturates employees, as do long-standing colleagues. Each individual has specific beliefs and traditions that s/he works with when joining an institution that has a unique culture of its own. S/he will have to be acculturated to the firm’s customs, and the values that underpin them. These will impact the ways in which s/he will approach the job, especially in terms of performance, attitude, and behavior.
- (2)
Unity is possible in diverse workgroups. In instances where a corporate culture needs to develop, staff ought to be advised and made to learn new cultural elements, as this will affect their attitude and performance.
- (3)
Persistence in pursuing cultural elements is required. The culture of the organization will likely produce within a year a strong enough uniformity amongst the group, which highlights the efficiency of corporate productivity.
- (4)
Staff who commit to the organizational culture should receive recognition for their effort and loyalty.
- (5)
Staff who commit to the organizational culture should also be given opportunities to develop the culture further in their own inimitable ways if they further the overall aims of the organization.
6.2. Implications
The results of this study could be useful for business managers and corporate leaders. The results of the study represent important knowledge and relevant information for company leaders regarding the impact of organizational culture on corporate performance. Business managers must realize the importance of effective organizational culture, because organizational culture has the potential to affect corporate performance. This research study can contribute to the benefit of society, as there can be improvement in employment opportunity, job security, and the best customer service, which are essential to improve the lifestyle of the employees and their society.


