Abstract
This study aimed to compare two techniques of business knowledge extraction for the identification of insights related to the improvement of digital marketing strategies on a sample of 15,731 tweets. The sample was extracted from user generated content (UGC) from Twitter using two methods based on knowledge extraction techniques for business. In Method 1, an algorithm to detect communities in complex networks was applied; this algorithm, in which we applied data visualization techniques for complex networks analysis, used the modularity of nodes to discover topics. In Method 2, a three-phase process was developed for knowledge extraction that included the application of a latent Dirichlet allocation (LDA) model, a sentiment analysis (SA) that works with machine learning, and a data text mining (DTM) analysis technique. Finally, we compared the results of each of the two techniques to see whether or not the results yielded by these two methods regarding the analysis of companies’ digital marketing strategies were mutually complementary.
1. Introduction
Recent years have been marked by important changes in the corporate environment, as well as in the techniques used by companies to analyze data and draw conclusions [1]. In a globalized world where new technologies have come into wide use, companies need to employ new techniques for business knowledge discovery to improve their internal and external processes [1,2].
The business ecosystem—defined as the network of organizations such as suppliers, distributors, customers, competitors, government agencies, etc. [3]—is increasingly influenced by the analysis of large amounts of data [4]. Such analyses can help companies apply new recruitment and loyalty techniques based mainly on the analysis of patterns in transaction data and on behaviors related to the interaction between customers and companies [3]. Different methodological approaches have already been used from the perspective of information management and by following information theory to obtain these types of insights [5,6,7,8]. With this objective, the techniques used to identify insights from large datasets have been perfected, making it possible for companies to extract knowledge and to improve corresponding processes [9]. Therefore, it is important to highlight that one of the main problems that companies usually face is precisely how to use the extracted information [10,11] and how to incorporate this information in their decision-making systems [10,12].
Technologies and techniques to understand large amounts of data, such as the application of datamining, machine learning, big data analysis, or support vector machine (SVM) algorithms, create an ecosystem of methods and provide new opportunities for companies to increase their profitability [13,14].
In the context of this ecosystem characterized by data, this study compared two techniques used for business knowledge discovery applied to social networks. Business knowledge discovery is considered as the entirety of methods and techniques of data analysis that allow companies to identify insights into and knowledge about large datasets which they, in turn, use to improve their processes [15].
The analysis of these data is performed in the user generated content (UGC) framework and can be used to improve data-driven business strategies [16,17]. This knowledge can be applied to different business sectors, such as the tourism industry [18], the digital marketing industry [19] or education [20]. In the present study, we focused on the digital marketing industry, a professional area where practitioners routinely use UGC analysis of content from social networks and digital platforms [21]. This content shared by users in social networks includes comments, images or hashtags formats [22]. Based on the analysis of these UGC databases, digital marketing agencies and companies make decisions to develop their strategies [23]. However, there is a gap in the digital marketing industry related to the development of data-driven analytical methodologies that help companies obtain insights to improve their UGC-based strategies and the skills needed to develop such strategies [24,25].
Therefore, facing the challenges that UGC-type data offer to the industry, the digital marketing environment should use new analysis techniques to develop more precise and personalized strategies to increase engagement in social media [26,27]. Improvement of decision making in digital marketing can increase the profitability of the strategies and guide CEOs and managers of digital marketing agencies and companies in this field. With this objective, in the present study, we addressed the following three research questions:
RQ1: Is it possible to obtain insights related to the improvement of digital marketing strategies by analyzing UGC extracted from Twitter using knowledge extraction techniques?
RQ2: Is it possible to identify user communities that interact around the #DigitalMarketing hashtag on Twitter and extract insights that help improve digital marketing strategies on the Internet?
RQ3: What insights can be obtained from the same sample of UGC on Twitter applying a technique of community detection (Method 1) and a topic-modeling and data-mining technique (Method 2)? How can these results help improve digital marketing strategies on the Internet?
To address these questions, we compared the results to extract knowledge obtained from two innovative methods and determined whether or not these techniques are mutually complementary. Comparison of the study results will aid future studies in using these techniques for business knowledge extraction in digital marketing businesses and will help academics and practitioners to apply them in real cases.
2. Literature Review
Numerous previous studies have sought to compare knowledge-extraction and data-driven techniques to obtain new approaches and perspectives of data-based discovery [28,29].
For instance, in the analysis of big data approaches for business techniques, Hartmann et al. [30] proposed using different methods of data analysis based on big data techniques comparing the business objectives of different startups, i.e., small companies based on innovative or technological business models [16].
Likewise, Souza et al. [31] compared several methods based on value-driven data. This study aimed to experimentally use the results of both methods by focusing on their design. The results showed the usefulness of comparing different procedures or methods to obtain conclusions based on data—in this case, preparing different experimental designs of methodological procedures used.
Following this line of research, Müller and Thoring [32] compared two typologies or theoretical concepts applied to research. In this case, the authors focused on comparing the methods known as design thinking versus lean startups. They based their research on the exploration of these two methods of user-driven innovation strategies. In the results, the authors proposed using each methodology for a specific objective, thus specifying in what situations or for what purpose each of the developed methods should be used.
Furthermore, Moro et al. [33] proposed a data-driven approach to predict the success of banks in their telemarketing strategies. In the discussion and conclusions, Moro et al. [33] warned that the results may vary depending on the type of data-driven approach used and suggested that, based on their findings, other researchers can improve their experiments and data-based methods.
However, other authors, such as Grefenstette [28], argued that the analysis of the results of data extraction techniques could be evaluated automatically based on the results of other studies. Accordingly, Grefenstette [28] evaluated the results of automatic data extraction techniques. He highlighted the options to use different methods of data extraction with experimental filters for the analysis of datasets.
Furthermore, Olson and Rueter [34] also proposed the extraction of knowledge from experts by applying different knowledge acquisition techniques, comparing the results and using them for different purposes. Based on the results of a comparison of data extraction techniques, Gangemi [35] proposed focusing on the tools for the analysis of the semantic web. The authors analyzed the results obtained using different data-driven methods from several perspectives.
Similar to Gangemi [35], Schumacher et al. [36] compared several methods of data extraction focusing on the web. The authors used analysis techniques based on workflows to which they applied different analysis processes. Then, they compared the results and developed an exploratory analysis based on different approaches.
Likewise, Saura and Bennett [3] proposed a three-stage method for data text-mining analysis of UGC. The proposed model is based on the comparison of three independent data-driven methods analysis techniques. The authors concluded that each of the methods used should be applied to specific types of content. This study enriched the literature and contributed to the improvement of knowledge and methodologies based on data and knowledge discovery.
3. Materials and Methods
The present study was exploratory rather than hypothesis testing [3,37]. Therefore, our main aim was not to explore the impact of certain variables, but to discover them and illustrate how they can be analyzed in future research using the proposed methods [37,38]. Therefore, in the present study, we used a qualitative and exploratory research methodology [13,16]. Our primary source was Twitter-based UGC [39]. Following the work of Saura et al. [22], we used the hashtag #DigitalMarketing to focus on a topic of research, it was necessary to select a hashtag around which UGC communities are organized and then analyze the published content.
As discussed above, in order to analyze UGC in the digital marketing sector, we selected two methodological approaches (Methods 1 and 2) for the following two reasons. On the one hand, following References [40,41], triangulation of several methodologies is necessary to help technicians responsible for UGC analysis in the digital marketing sector; these methodologies can be replicated by practitioners. On the other hand, the use of UGC analytics techniques can provide useful information to CEOs and managers in the digital marketing sector to make better decisions (see Reference [42]).
The criteria for selecting Methods 1 and 2 were as follows. First, the software to be used and the data (to collect UGC) had to be open-source or free. Second, both methods had to be easy to use by practitioners in the digital marketing sector [3]. Third, these two techniques had to be mutually complementary and capable of providing enriched insights when used in combination (as compared to the situation when only one method was used). This makes it possible to compare the results and ensures that practitioners can variably use Methods 1 and 2 for their specific research purposes.
3.1. Data Sampling
In the data collection process, we followed relevant studies that have developed similar processes after downloading a database from the public Twitter API [1,3,13,16]. Specifically, after connecting to the public Twitter API to collect the data, we downloaded a total of 21,061 tweets that contained the hashtag #DigitalMarketing. Following Sherman et al. [43] and Banerjee et al. [44], we used a randomized controlled process to select this search term.
The data collection process was performed using the MAC version of Python software 3.7.0. [17]. To clean the data, we used Python with Pandas software library. For this filtering, according to the characteristics indicated below, we performed the cleaning of the database using commands of electing or replacing columns and indices to reshape lost or empty values and to debug repeated or unnecessary data.
The time span of data collection was 3–6 May 2019. The process of cleaning and filtering the database allowed us to obtain the final sample of 15,731 tweets [14]. The aim of filtering the results that formed the preliminary database was to increase its quality by eliminating noise and unnecessary data [3]. In this study, the filtering process included elimination of repeated tweets; elimination of URLs containing tweets; deletion of images and videos; and elimination of unnecessary words and connectors. As for the images, they were eliminated because with the techniques used they would not be analyzed, and the URLs that contained the tweets were eliminated because we considered that they could modify the results by including words and graphic symbols different from the content of each tweet [16].
In addition, the tweets had to contain a minimum of 65 characters and retweets were considered as a new tweet (retweets are the duplication of a tweet by another user; see Reference [3]). Therefore, a minimum quality was established for the content that makes up each tweet, ensuring a correct expression with a meaning linked to the purpose of the investigation.
Emojis were also excluded in this study, because the used techniques were not suitable for the analysis of feelings based on graphic icons. In the process of data sampling and data filtering, we followed the methodology presented by Saura and Bennet [3], Selwyn [23], and Reyes-Menendez et al. [45].
3.2. Method 1: Community Identification in Complex Networks
An open-source software for the analysis of UGC and visualization called Gephi was used for Method 1. With Gephi, we can apply algorithms for visualization of data and calculate the statistics related to them. In the present study, we used the algorithm known as Modularity Report (MR), first developed by Blondel et al. [46], for visualization of communities connected through nodes. This algorithm is a heuristic method based on modularity optimization. A node is a metric, or an indicator, that features characteristics homogeneous with another node and that can be interconnected through neural networks. This element connected among its nodes forms a complex neural network if we extract the data from social networks, thus obtaining the identification of communities and their topics by weight and relevance within a network of nodes.
To improve data visualization, the algorithm proposed by Lambiotte et al. [47] was also used. This algorithm makes it possible to improve the identification of communities to identify those with smaller topics, but that still boast relevant statistical significance [17,47].
The aim of the MR algorithm is the decomposition into communities of a neural network that offers modular communities. For the UGC analysis, the algorithm can be used to measure the connections and interactions among communities’ nodes. Also, if the results of the analysis of a dataset obtain an MR, the dataset has a sophisticated internal structure [46,47] known as community structure, and an indicator that identifies how a neural network is divided into sub-networks composed of groups of nodes [24].
These sub-networks or communities have a specific meaning [3,47]. Sub-networks analysis for companies consists of identifying the behavior of clients by using social networks and by grouping them around the topics of each community, which helps to better understand user behavior and interests in social networks [46,48].
Concerning the application of the algorithm in a neural network, a random assignment can produce a better decomposition resulting from a higher modularity score; however, the randomization increases the calculation time; this, in turn, may allow identification of smaller communities centered on specific, or at least more specific, topics that do not have much weight [3,48].
Likewise, as explained by Blondel et al. [46], in order to understand how an algorithm works, it should be divided into two processes. Each process has two additional steps. In one of these steps, modularity is optimized allowing for changes in communities according to their relevance. In the other step, the identified communities are aggregated in order to construct a network community [47,48]. These processes should be repeated alternately until modularity can no longer be increased [46].
In the present study, following Blondel et al. [46], we used Equation (1) to obtain a weighted network, i.e., networks composed of links among their nodes as well as reciprocal communications among them.
where Aij represents the weight of the edge between i and j, ki = Σi,j is the sum of the weights of the edges attached to vertex i, ci is the community to which vertex i is assigned, the δ-function δ (ci,cj) is 1 if δ = v and 0 otherwise, and m = 12 PijAij. The output of the algorithm depends on the order in which the nodes are considered. However, the order can influence the computation time [46]. The problem of choosing an order is thus worth studying, since it could give good heuristics to enhance computation time [48]. Blondel et al. [46] indicated that the efficiency of the results of the algorithm is related to the fact that the gain in modularity ∆Q obtained by moving an isolated node i into a community C can easily be computed (see Equation (2)).
where Σin is the sum of the weights of the links, Σtot is the sum of the weights of the links incident to nodes, ki is the sum of the weights of the links incident to node ki,in is the sum of the weights of the links from i to nodes, and m is the sum of the weights of all the links in the network. A similar expression is used to evaluate the change of modularity when i is removed from its community. Equations (1) and (2) were used to develop Method 2 [21]. Figure 1 shows the processes of the MR algorithm.
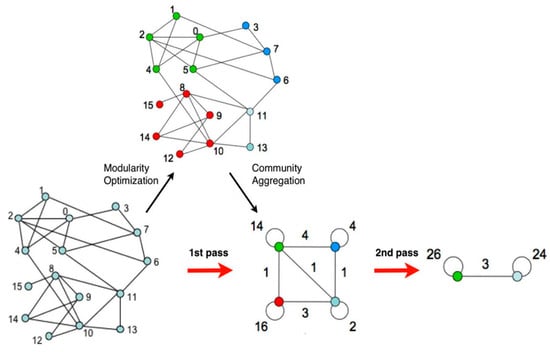
Figure 1.
Modularity Report algorithm explanation. Source: adapted from Blondel et al. [46].
Regardless of whether the MR can be used to measure users or labels and their connections through nodes, these labels published on Twitter group users around a topic [49].
In the present study, we defined these nodes which designated the communities of nodes as topics [1,5]. These topics had a relevance or a weight, which could be compared using Method 2, and could be determined by the intensity obtained by the MR [3,48].
As will be discussed in Section 3.3, the MR intensity was compared with the weight percentage (WP) of the insights obtained using Method 2 [3]. This allowed us to mine the topics and their weight to perform knowledge discovery extraction for businesses and then compare the results.
3.3. Method 2: A Three-Stage Method for Data Text Mining
Method 2 was initially proposed by Saura and Bennett [3], where the results of three data approximations (latent Dirichlet allocation (LDA), sentiment analysis (SA), and data text mining (DTM) analysis) were used together.
The LDA model is a model used on many occasions for data analysis and division of topics [49,50,51]. Therefore, an LDA is a model that performs an analysis of documents, such as files, documents, or different databases. It is a topic modeling technique that has been used on different occasions for the UGC analysis [16,48,52]. The LDA topic modeling technique was developed by Pritchard and Stephens [53] as a machine learning technique. Three years later, it was expanded by Blei et al. [54].
The LDA is an approximation model of analysis similar to pLSA [53]. However, in the LDA the distribution is assumed and can be expressed before gathering evidence. In essence, the LDA divides a given sample into topics by ordering the words that identify the model according to the times they are repeated, according to the links among them [53,54]. Then, the researcher manually names the topic based on the content of the most repeated words [3].
The second method used is an SA, an analysis technique that can identify sentiments expressed in text. There are SAs of different types [3,16,55]. In the present study, we used an SA that works with machine learning and that is composed of an SPV algorithm that can be trained to increase its chance of success [56].
The SA is also known as opinion mining (OM) and has been used in different studies [1,3,4] to obtain the sentiments from UGC samples extracted from social networks [13]. This type of data analysis technique is linked to natural language processing (NLP) techniques to obtain insights [10]. To obtain and measure the success of an SA algorithm that works with SVM and machine learning, we used Krippendorff’s alpha value (KAV) [46,57].
The KAV should obtain a result equal to or above 0.667, so that the results indicate that the algorithm has been trained a sufficient number of times, although Krippendorff [58] indicates that the minimum KAV should be adjusted according to the weight of the conclusions. Therefore, a high KAV is ≥0.800, while a KAV in the range 0.667–0.800 is used to draw tentative conclusions [3,57,58].
The basic formula for alpha is a relationship characterized by observed disagreement/expected disagreement. In Equation (3), an apparently simple proportion is shown, as the calculation method is computationally very complex. The calculation process involves resampling methods such as bootstrap [46]. The calculations in Equation (3) are explained in depth by Krippendorff [58].
Finally, as indicated by Saura and Bennett [3], the results of both processes (i.e., the sentiment of each identified topic (positive, negative, and neutral) as a result of the LDA and the SA) can be analyzed with DTM techniques to obtain insights. In this case, textual analysis software or languages such as Python should be used in order to establish relationships between the most repeated words and their links between databases classified into sentiments and topics [59,60].
The first technique corresponding to the LDA is divided into two separate processes [3]. In the first process, the model identifies keywords in addition to analyzing their comments. At this point, the number of documents that the model must analyze is established and, consequently, a larger or smaller number of words will be obtained. In the second classification step, the words and phrases related to each of the named topics are specifically identified. An example is provided in Equation (4) [17], which shows the importance of hidden and observed variables in the joint distribution [3]. In the second step, βi is the distribution of a word in topic i, with total K topics; θd is the proportion of topics in document d, with total D documents; zd is the topic assignment in document d; zdn is the topic assignment for the nth word in document d, with total N words; wd is the observed words for document d; and wd,n is the nth word for document d. As a result, the topics are identified using Equation (5) for Gibbs sampling. In the present study, both calculations were performed using Python LDA 1.0.5.
In Figure 2a, α is the parameter of the Dirichlet prior, β is the parameter that is representing the Dirichlet prior on the per-topic word distribution, is the topic distribution for document m, is the word distribution for topic k, and represents the topic for each word in the document. Finally, m represents the specific word. Figure 2b shows the plate notation for this model, where k denotes the number of topics, and are V dimensional vectors storing the parameters of the Dirichlet-distributed topic-word distributions [3,17].
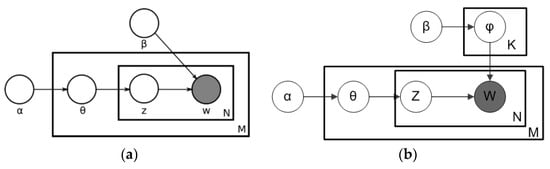
Figure 2.
The latent Dirichlet allocation (LDA) process: (a) LDA plate notation; (b) LDA Dirichlet-distributed topic-word distributions. Source: adapted from Saura and Bennett [3].
It is helpful to think of the entities represented by and as matrices created to decompose the original documents of the represented matrix to be modeled. In Figure 2b, refers to the number of lines defined by the documents that make up a sample in columns, while φ defines different topics. Therefore, , refers to a set of rows or vectors composed of the words containing different topics, while refers to a set of rows that define each topic [3,17].
The process of sentiment analysis with machine learning and the SVM on the identified topics is depicted in Figure 3a. Neuron A represents the Twitter API from which the tweets were downloaded. The neurons related to E and C represent the data extraction process and data collection. (D) represents the collection of the data where the dataset that forms the sample was constructed. Neuron S is the one that classifies the dataset where data filtering was performed before its execution. Finally, neuron LDA represents the model that will divide the sample into T1, T2, T3 ... (T = topics) until it reaches the maximum depending on the size of the database.
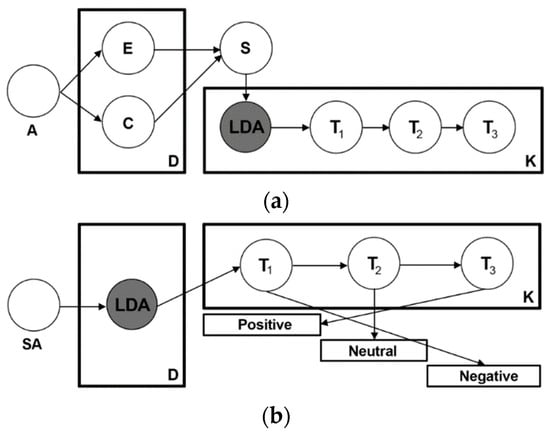
Figure 3.
Sentiment analysis (SA) process from LDA to SA: (a) topics classification process; (b) sentiment analysis process applied to topics. Source: Saura and Bennett [3].
In Figure 3b, the neuron labeled SA is applied to the LDA model, and this, in turn, is applied to the topics. Therefore, each topic is divided into positive, negative or neutral sentiment.
Similarly, Figure 4 represents the division and obtaining of the KAV of each sentiment, showing the average KAV by type of sentiment. Neuron SA represents the developed sentiment analysis, S1–S3 refer to different sentiments, and T1p, T2x, and T3n refer to different sentiments for each topic (namely, positive (p), neutral (x), and negative (n)).
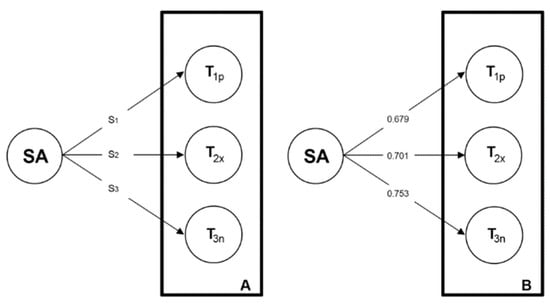
Figure 4.
Sentiment analysis reliability results with Krippendorff’s alpha value. Source: Saura and Bennett [3].
For the last process presented in Figure 5, the NVivo software, which is frequently employed by business researchers, was used. In this software, data are sorted into nodes, and each node composes a sentiment. In this case, the software filtered the data by eliminating unnecessary connectors, prepositions or words. In Equation (6), K is an empirical approximation constant and is the one that eliminates the words as many times as the software is used. K is the average of all the topics computed to obtain the global weight of X [3].
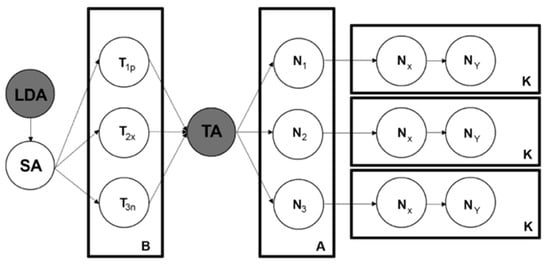
Figure 5.
Textual analysis process after LDA sentiment identification. Source: Saura and Bennett [3].
In addition, the structure and design of new nodes was used to group raw data as accurately as possible. An important indicator to perform a DTA process is the WP that shows the number of times a node repeats its content in the database. To calculate the WP, Equation (7) should be used.
In Equation (7), a query that allows the program to search the text is used to find K. The behavior of each of the words and each text sample can be observed, and the value of K should be found [3].
In what follows, we report the results obtained using both methods.
4. Analysis of Results
4.1. Results of Method 1
To obtain the results using Method 1, the sequence of actions was as follows. In the first place, the algorithm proposed by Blondel et al. [46] was applied (Equations (1) and (2)) to divide the sample into communities and identify those with a higher MR. Then, in order to obtain additional and visual results using the Gephi software, we applied the Lambiotte and Delvenne algorithm [47] to modify the resolution of the communities according to the MR level (Figure 5 and Figure 6). Next, in order to visually analyze the data, we proceeded to the visualization of the networks of neurons obtained as a result of MR analysis (See Table 1).
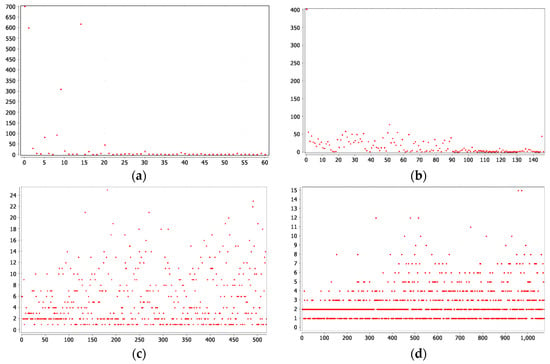
Figure 6.
Modularity report results: (a) test 1; (b) test 2; (c) test 3; and (d) test 4.

Table 1.
MR measurements.
In test 1, the most relevant communities related to the business environment from #DigitalMarketing were those related to #SocialSelling, #SocialMediaManagement, and #Retail.
In test 2, the communities with a greater weight of importance were #ROI, #PublicRelations, and #Entrepreneurs. In test 3, such communities were #Campaign, #Network, #Learn, and #Community. Finally, in relation to test 4, the communities were #Advertise, #PublicRelation, #Network, and #Lucidseo.
Therefore, Figure 6a–d shows the size distribution; the y-axis shows the size in number of nodes in a network, while the x-axis shows the modularity class. For the visualization of communities, two types of data visualization approaches were used.
Figure 6 shows the distance that separates the communities according to their relevance based on modularity. In Figure 6a, the identified communities are shown with the modularity value of 0.246 and the resolution of 1.0, suggesting the relevance of these communities according to their relationship. When the communities closer to the x-axis are represented by points, it means that their modularity was lower and, therefore, their importance in the subject studied as higher. In Figure 6a, there are a total of eight communities that stand out against the total of 71 communities identified with the used resolution. Therefore, it can be concluded that that 63 out of 71 communities were smaller in size and relevance as compared to those communities that appear along the y-axis with a greater relevance. To see the difference, Figure 6b shows that the number of communities increased to 147 with the modularity of 0.122. Therefore, a total of 92 communities (out of 147) had a modularity superior to that of the remaining communities, allowing their weight to be measured on the y-axis.
In Figure 6c,d, the resolutions increased to 0.01 and 0.001, respectively, so as to better visualize the relationship among the communities. As can be seen in the graphs, in both cases, the importance of these communities was lower than in Figure 6a,b; therefore, their connections obtained a lower modularity. In Figure 6c, there are 519 communities linked to each other, while in Figure 6d, there are 1073 communities. However, this low modularity had no measurable significance to investigate the relationships among them.
Therefore, Figure 6c,d visualizes which resolution is the division limit of the studied sample using the communities’ weight.
Figure 7a–d shows the real weight of the identified theme in the community. In Figure 7a, the communities were identified according to the number of nodes that compose them. In Figure 7b, the resolution was increased to understand the proximity of the communities of nodes, so they appeared with a greater contraction and a smaller distance among them. In this way, we can identify which topic is more related to another, which provides a better understanding of how communities work and interact with each other [48,50,59].
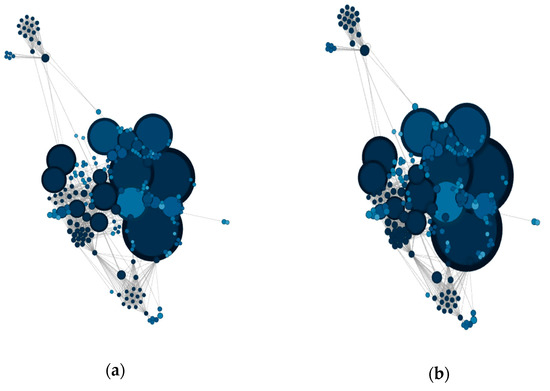
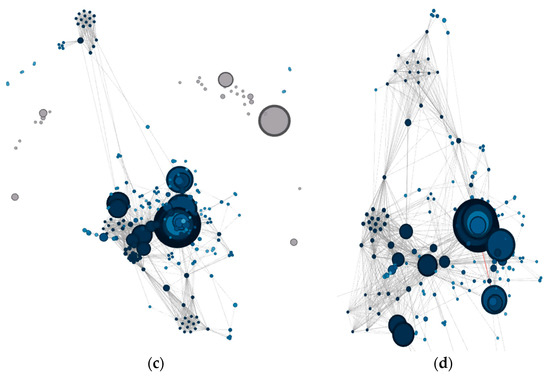
Figure 7.
Community network visualization applying different resolutions for community visualization. (a) Community network using a resolution of 1.0 points; (b) Community network using a resolution of 0.1 points; (c) Community network using a resolution of 0.01 points; (d) Community network using a resolution of 0.001 points.
As can be seen in Figure 7c, there are communities, such as #DigitalMarketing, that remain far from the main theme, which suggests that there are relevant nodes around which no community is established. Accordingly, we can discard these less important communities.
Finally, as shown in Figure 7d, the connections between each node can be studied in depth by increasing the resolution between communities. Specifically, what are the nodes that create the connections between communities? This makes it possible to identify the topics that offer a greater interest rate and weight for the specific creation of communities.
4.2. Results of Method 2
Using the LDA process, the topics were identified and classified according to their description. For the identification of the topics, the process of analyzing the repetition of the words in a sample was performed [3]. These words, categorized automatically, represent specific themes [16].
Next, the themes composed of these words should be named [17]. One of the techniques to decide which words can define the description of a topic is to choose the name when analyzing the 10 most repeated words and try to form a phrase using these words [17,22,23,24,25,26,27,28,29,30,31,32,33,34,35,36,37,38,39,40,41,42,43,44,45,46,47,48,49,50,51,52,53,54,55,56,57,58,59,60]. Table 2 shows the topics identified in the present study using the LDA process.
Table 2.
Topics identified by the LDA model.
The algorithm that works with SA’s machine learning was applied to these topics. The tweets in each topic were separated into different databases, and the SA was applied to obtain the sentiments for each topic. The number of times that the SA algorithm was trained with data-mining processes to increase its KAV was 381. The highest positive KAV was 0.824 relative to the SEO topic, while the lowest was related to the Influencers Marketing topic.
Finally, with the application of data-mining techniques, a DTM was performed to get insight into the topic and sentiment [3]. To obtain these, the WP of each indicator was measured according to the topic with the NVivo software and the number of times they are repeated. In this case, the results were subdivided into nodes. These nodes are word containers that group the insights according to the sentiment of each topic, which makes it possible to analyze them independently [3,14,58].
Table 3 presents the results on the insights identified using Method 2.
Table 3.
Results for N1–N3.
5. Discussion
Using Method 1, we obtained the results regarding the number of communities, their modularity, and weight within the complex neural network.
According to Müller [32], if we compare the results obtained using Methods 1 and 2, we can see which methods yields more detailed or conclusive conclusions.
In Method 1, the communities with a greater MR were those related to #SocialSelling, #SocialMediaManagement, and #Retail that had a resolution of 1.0; #ROI, #PublicRelations, and #Entrepreneurs had a resolution of 0.1; #Campaign, #Network, #Learn, and #Community had a resolution of 0.01; and, finally, #Advertise, #PublicRelation, #Network, and #Lucidseo had a resolution of 0.001. In Method 2, such communities were those related to SEO, Blackhat Strategies, Social Media Marketing (SMM), Content Marketing, Influencers Marketing, Tools, JavaScript, and Startups.
The results of several previous studies, such as Blondel et al. [46] and Lambiotte et al. [47], are consistent with our results using Method 1 based on the MR indicator. The topics identified using Method 1 are more general within the digital marketing environment, while the topics identified with Method 2 are more specific, which is congruent with Saura and Bennett [3]. These trends confirm that Method 1 can be used to obtain general and global results, while Method 2 can be used to find specific insights within a given topic, as previously demonstrated by Jia [18].
While it is true that the topics identified with the topics of the communities were not identical, we can group them by affinity of the results obtained using Methods 1 and 2. This confirms that by using methods based on knowledge extraction techniques for business with the same UGC sample or in data analysis based on big data, different results can be obtained within the same study theme [30,36].
Likewise, a previous study reported that analyzing UGC communities identified around these results can reinforce the identified results [48]. Accordingly, in the present study, communities related to #SocialSelling, #SocialMediaManagement, #Community, #Advertise, and #PublicRelations can include the topics identified as Social Media Marketing (SMM), Content Marketing, and Influencers Marketing. As concerns the community of #Entrepreneurs and #ROI, we can include the topic related to #Startups to the #Lean community, and we can group the topics of SEO, Blackhat strategies and Tool, leaving exclusive communities with highly specialized topics such as #Retail, #PublicRelations, and #Lucidseo, grouping the #Campaign and #Network communities and the JavaScript topic.
Therefore, although the topics identified by Method 1 and Method 2 were different, we were able to verify that they really have characteristics that lead us to link them in an exploratory way (see also Daugherty et al. [40]). Our results were also consistent with the findings reported by Provost [61] who concluded that the use of data-based or knowledge-based techniques helps obtain an exploratory interpretation factor that should be taken into account when considering new studies and which contributes to the literature as well as to the correct use and development of these techniques.
Although our results demonstrated that both methods are valid for the identification and discoveries of topics related to digital marketing, it is interesting to highlight the characteristics of each of the two methods, as well as their strengths and weaknesses of each of the two methods. The main characteristics of both methods are summarized in Table 4.
Table 4.
Main characteristics of Methods 1 and 2.
As to Method 1, with the resolution of the standard MR (1.0), Twitter user communities that were most relevant to digital marketing were those dealing with #SocialSelling, #SocialMediaManagement, and #Retail, and this discovery provides a clue for companies specializing in these issues. These communities had a high level of engagement and offered opportunities for companies working with social networks. It is evident that the use of the MR metric with Method 1 was a strength in the analysis of engagement of communities of UGC. The MR allowed us, as also confirmed by Blondel et al. [46] and Lambiotte et al. [47], to measure the relevance of these topics in a network of nodes. However, the complexity in the application and visualization of the MR according to the type of resolution for each community was a weakness of this method. Therefore, it is difficult to compare the importance of the MR among the resolutions used and to link them directly with the general theme that makes up the Twitter sample.
Therefore, the results of both methods were different, because Method 1 was focused on the quality of the engagement [46,47], while Method 2 focused on the weight of the content [3]. However, if we link the results obtained using both methods, we get an enriching panorama for digital marketing companies to analyze any topic of interest [17], allowing us to justify the exploratory nature of topics within knowledge discovery investigations (see also Gangemi [35]). However, despite using quantitative analysis methods, the qualitative and exploratory approach is a weakness of both methods.
Also, with the development of Method 2, one gains a sense of the identified topics. However, it remains impossible to visualize a neural network toward understanding of the dynamics of content in communities, as Method 1 does make feasible—and this, in turn, helps understand the weight and relevance of communication among communities. Undoubtedly, this is a strength that can be improved exponentially with the development of this approach.
It is also true that, with Method 2, when developing a sentiment analysis that works with machine learning, we obtained a credible percentage of success that can be improved with time and training of the KAV value. However, with Method 1, we obtained the communities and the content, allowing us to observe facts and to analyze in real time the dynamization of content in these networks, which is a weakness of this method.
Using Method 2 makes it possible to obtain more detailed insights related to the identified themes according to their sentiment, which is a strength of this method. At the same time, using Method 1, one can investigate the relationship and level of engagement among communities.
6. Conclusions
The present study focused on the methodological development of two different methods used to extract knowledge from large amounts of data. These data are usually collected from digital environments. Specifically, we compared two techniques, each offering the objective of modeling topics and the identification of communities via topics in complex networks. Our results demonstrate that the two methodologies and corresponding processes can be combined to obtain insights that aid companies and digital agencies to better develop social media strategies, taking into account the engagement of the main communities related to a specific topic or the analysis of sentiments of the main topics in the UGC content shared on social networks.
These methods can be extended to other social networks such as Facebook, Twitter, Instagram, YouTube, and other platforms with UGC, like Google Maps, GitHub, or TripAdvisor [3,48,61].
As concerns RQ1, our results obtained using topic-modeling and data-mining processes provide insights about the main topics that make up the UGC content and the sentiments associated with those topics.
Furthermore, with regard to RQ2, our results demonstrated how the application of community detection algorithms and visualization can be used to find the main themes in UGC and establish which factors contribute the weight and relevance of those topics. Our findings related to digital marketing that come from these communities outline specific profiles of clients or specific topics within broader communities linked to digital marketing.
Finally, with regard to RQ3, our results demonstrated that the two methods of data analysis applied to the same industry help to better understand and improve the digital marketing strategies of the relevant agencies and companies. Our results provide a road map and actions to increase engagement of companies with their customers in social networks, as well as highlight the importance of communication in social networks.
6.1. Theoretical Implications
The topics identified in the present study can be used by other researchers to develop, for example, models based on partial least squares structural equation modeling (PLS-SEM) or SPSS, AMOS (analysis of moment structures (AMOS)), among others. Such endeavors would contribute to research on knowledge extraction from large amounts of data. Out results make it possible to understand the influence of topics such as SEO, SMM or Content Marketing on strategies based on Influencers Marketing, which could be a hypothetical dependent variable in future models.
Furthermore, they can be used in order to understand the influence of the identified topics, such as black-hat strategies, in the development of SEO tactics and startups. In addition, our results also clarify the function of JavaScript in the tools that startups use to develop their digital marketing strategies. Similarly, our results can be used to understand the relationships among UGC communities identified around digital marketing and to measure the influence of strategies such as social selling or social media management in various sectors, including retail, public relations, or entrepreneurs.
Finally, future studies can focus on collecting Twitter data in UGC communities using various tags, such as #Retail, #ROI, #PublicRelations, #Entrepreneurs, #Campaign, #Network, #Learn #Advertise, #PublicRelation, #Network or #Lucidseo to investigate digital marketing in social networks. Academic researchers may apply our results to reinforce the theoretical frameworks of their scholarship toward correctly choosing a methodological procedure for their research.
Similarly, our results demonstrated that the analytical approaches in the two proposed methods contribute to the literature. Method 1 can be used to develop studies focused on the quality of the UGC and communities around these, while Method 2 focused on the quality of the content of those communities.
6.2. Managerial Implications
The results of the present study provide several important implications for practitioners. Our findings can be used by practitioners in the field to improve the profitability of their strategies. Specifically, the managerial implications can be grouped into the following three categories.
The first of these categories is digital marketing. Taking into account the MR of the topics identified, it can be concluded that it is necessary to identify the most important issues within the same topic, as in the case of #DigitalMarketing. Based on this MR, companies might carry out their digital marketing strategies. Digital marketing agencies or specialized companies can use our findings to understand how users are grouped in social networks and, by doing so, improve their techniques to increase user engagement in social media.
The second of the categories is business knowledge extraction. As demonstrated by our results, companies can obtain valuable information on platforms that gather UGC. In particular, they can use the content published on social networks. In this way, it may be convenient for businesses, in their knowledge extraction process, to use more than one method in order to obtain verifiable information for their decision making. To this end, managers have to first define the objectives they want to achieve with the extraction of knowledge, since Method 1 proved to be useful for measuring the quality of engagement, while Method 2 stood out when identifying the content weight. On the other hand, companies must not only extract knowledge, but also be able to incorporate it into their business improvement processes.
The third of these categories is data-driven methods. The diversity of the topics identified using two different methods is particularly relevant for managers who want to increase their chances of success. Our results demonstrate the complementarity of the two methods, so they that should be used in a combined and non-comparative way, since Method 1 stands out when measuring engagement, while Method 2 is relevant to identify the weight of the topics. This is so because there is a significant amount of methods and using more than one to extract knowledge will allow managers to deepen the complexity of the generated neural networks. Likewise, as shown by our results, practitioners can also effectively use the proposed to improve the databases of the clients by dividing respective datasets into networks interested in a specific field. Practitioners can also adapt the developed techniques to their professional strategies and introduce a more scientific approach to develop and apply their strategies in the industry.
6.3. Limitations and Future Research
The limitations of the present study are related to the size of the sample, as well as to the analyzed time horizon, and methods used, and the industry. Although UGC has been frequently used as a sample in the scientific literature, the use of a UGC-type sample is used as a general standard for experimental or exploratory studies.
In addition, with regard to the development of LDA and TA techniques, we should take into account that there are qualitative steps that depend on the thoroughness developed by researchers to obtain robust conclusions. Likewise, regarding the SA, we must consider possible sarcasm and irony in UGC, which can lead to errors in the conclusions obtained in the SA process based on machine learning.
However, the results of the techniques based on knowledge extraction or knowledge discovery can be used to support future studies that would test hypotheses based on quantitative techniques, so they are used as topic discovery techniques. With regard to the results of both methods, future research may focus on applying each of the methods used in specific research areas or with different samples to subsequently compare the methodologies used and to obtain consolidated findings.
Author Contributions
All the authors contributed equally to the conception of the idea, implementing and analyzing the experimental results, and writing the manuscript.
Funding
This research received no external funding.
Conflicts of Interest
The authors declare no conflict of interest.
References
- Saura, J.R.; Rodríguez Herráez, B.; Reyes-Menendez, A. Comparing a traditional approach for financial Brand Communication Analysis with a Big Data Analytics technique. IEEE Access 2019, 7, 37100–37108. [Google Scholar] [CrossRef]
- Hooper, P.; Dedeo, S.; Hooper, A.C.; Gurven, M.; Kaplan, H. Complexal Structure of a Traditional Amazonian Social Network. Entropy 2013, 15, 4932–4955. [Google Scholar] [CrossRef]
- Saura, J.R.; Bennett, D.R. A Three-Stage method for Data Text Mining: Using UGC in Business Intelligence Analysis. Symmetry 2019, 11, 519. [Google Scholar] [CrossRef]
- Reyes-Menendez, A.; Saura, J.R.; Martinez-Navalon, J.G. The impact of e-WOM on Hotels Management Reputation: Exploring TripAdvisor Review Credibility with the ELM model. IEEE Access 2019, 7, 68868–68877. [Google Scholar] [CrossRef]
- Gantz, J.; Reinsel, D. The digital universe in 2020: Big data, bigger digital shadows, and biggest growth in the far east. IDC iView IDC Anal. Future 2012, 2007, 1–16. [Google Scholar]
- Erlandsson, F.; Bródka, P.; Borg, A.; Johnson, H. Finding Influential Users in Social Media Using Association Rule Learning. Entropy 2016, 18, 164. [Google Scholar] [CrossRef]
- Qiao, T.; Shan, W.; Zhou, C. How to Identify the Most Powerful Node in Complex Networks? A Novel Entropy Centrality Approach. Entropy 2017, 19, 614. [Google Scholar] [CrossRef]
- Peruzzi, A.; Zollo, F.; Quattrociocchi, W.; Scala, A. How News May Affect Markets’ Complex Structure: The Case of Cambridge Analytica. Entropy 2018, 20, 765. [Google Scholar] [CrossRef]
- Saura, J.R.; Palos-Sanchez, P.R.; Correia, M.B. Digital Marketing Strategies Based on the E-Business Model: Literature Review and Future Directions. In Organizational Transformation and Managing Innovation in the Fourth Industrial Revolution; IGI Global: Hershey, PA, USA, 2019; pp. 86–103. [Google Scholar] [CrossRef]
- Abbate, T.; De Luca, D.; Gaeta, A.; Lepore, M.; Miranda, S.; Perano, M. Analysis of Open Innovation Intermediaries Platforms by Considering the Smart Service System Perspective. Procedia Manuf. 2015, 3, 3575–3582. [Google Scholar] [CrossRef]
- Scuotto, V.; Santoro, G.; Bresciani, S.; Del Giudice, M. Shifting intra- and inter-organizational innovation processes towards digital business: An empirical analysis of SMEs. Creat. Innov. Manag. 2017, 26, 247–255. [Google Scholar] [CrossRef]
- Del Giudice, M.; Caputo, F.; Evangelista, F. How are decision systems changing? The contribution of social media to the management of decisional liquefaction. J. Decis. Syst. 2016, 25, 214–226. [Google Scholar] [CrossRef]
- Saura, J.R.; Reyes-Menendez, A.; Palos-Sanchez, P. Un Análisis de Sentimiento en Twitter con Machine Learning: Identificando el sentimiento sobre las ofertas de #BlackFriday. A sentiment analysis in Twitter with machine learning: Capturing sentiment from #BlackFriday offers. Espacios 2018, 39, 75. [Google Scholar]
- Hartmann, P.M.; Zaki, M.; Feldmann, N.; Neely, A. Capturing value from big data–a taxonomy of data-driven business models used by start-up firms. Int. J. Oper. Prod. Manag. 2016, 36, 1382–1406. [Google Scholar] [CrossRef]
- Wu, X.; Kumar, V.; Quinlan, J.R.; Ghosh, J.; Yang, Q.; Motoda, H.; Zhou, Z.H. Top 10 algorithms in data mining. Knowl. Inf. Syst. 2008, 14, 1–37. [Google Scholar] [CrossRef]
- Saura, J.R.; Palos-Sanchez, P.R.; Grilo, A. Detecting Indicators for Startup Business Success: Sentiment Analysis using Text Data Mining. Sustainability 2019, 15, 553. [Google Scholar] [CrossRef]
- Jia, S. Leisure Motivation and Satisfaction: A Text Mining of Yoga Centres, Yoga Consumers, and Their Interactions. Sustainability 2018, 10, 4458. [Google Scholar] [CrossRef]
- Caputo, F.; Perano, M.; Mamuti, A. A macro-level view of tourism sector between smartness and sustainability. Enl. Tour. 2017, 7, 36–61. [Google Scholar] [CrossRef]
- Kunz, W.; Aksoy, L.; Bart, Y.; Heinonen, K.; Kabadayi, S.; Ordenes, F.V.; Theodoulidis, B. Customer engagement in a big data world. J. Serv. Mark. 2017, 31, 161–171. [Google Scholar] [CrossRef]
- Marsh, J.A.; Pane, J.F.; Hamilton, L.S. Making Sense of Data-Driven Decision Making in Education; RAND Corporation: San Monica, CA, USA, 2006. [Google Scholar]
- Tiago, M.T.P.M.B.; Veríssimo, J.M.C. Digital marketing and social media: Why bother? Bus. Horiz. 2014, 57, 703–708. [Google Scholar] [CrossRef]
- Saura, J.R.; Reyes-Menendez, A.; Alvarez-Alonso, C. Do online comments affect environmental management? Identifying factors related to environmental management and sustainability of hotels. Sustainability 2018, 10, 3016. [Google Scholar] [CrossRef]
- Selwyn, N. Digital division or digital decision? A study of non-users and low-users of computers. Poetics 2006, 34, 273–292. [Google Scholar] [CrossRef]
- Royle, J.; Laing, A. The digital marketing skills gap: Developing a Digital Marketer Model for the communication industries. Int. J. Inf. Manag. 2014, 34, 65–73. [Google Scholar] [CrossRef]
- Ghotbifar, F.; Marjani, M.; Ramazani, A. Identifying and assessing the factors affecting skill gap in digital marketing in communication industry companies. Indep. J. Manag. Prod. 2017, 8, 1–14. [Google Scholar] [CrossRef][Green Version]
- Truong, Y.; Simmons, G. Perceived intrusiveness in digital advertising: Strategic marketing implications. J. Strateg. Mark. 2010, 18, 239–256. [Google Scholar] [CrossRef]
- Couldry, N.; Turow, J. Advertising, big data and the clearance of the public realm: marketers’ new approaches to the content subsidy. Int. J. Commun. 2014, 8, 1710–1726. [Google Scholar]
- Grefenstette, G. Evaluation Techniques for Automatic Semantic Extraction: Comparing Syntactic and Window Based Approaches. 1993. Available online: https://www.aclweb.org/anthology/W93-0113 (accessed on 23 September 2019).
- Reyes-Menendez, A.; Saura, J.R.; Filipe, F. The importance of behavioral data to identify online fake reviews for tourism businesses: A systematic review. PeerJ Comput. Sci. 2019. [Google Scholar] [CrossRef]
- Hartmann, P.; Zaki, M.; Feldmann, N.; Neely, A. Big Data for Big Business? A Taxonomy of Data-Driven Business Models Used by Start-Up Firms. 2014. Available online: https://cambridgeservicealliance.eng.cam.ac.uk/resources/Downloads/Monthly%20Papers/2014_March_DataDrivenBusinessModels.pdf (accessed on 23 September 2019).
- Souza, E.; Abrahão, S.; Moreira, A.; Araújo, J.; Insfran, E. Comparing Value-Driven Methods: An Experiment Design. 2016. Available online: http://ceur-ws.org/Vol-1805/Souza2016HuFaMo.pdf (accessed on 23 September 2019).
- Müller, R.M.; Thoring, K. Design thinking vs. lean startup: A comparison of two user-driven innovation strategies. Lead. Through Des. 2012, 151, 91–106. [Google Scholar]
- Moro, S.; Cortez, P.; Rita, P. A data-driven approach to predict the success of bank telemarketing. Decis. Support Syst. 2014, 62, 22–31. [Google Scholar] [CrossRef]
- Olson, J.R.; Rueter, H.H. Extracting expertise from experts: Methods for knowledge acquisition. Expert Syst. 1987, 4, 152–168. [Google Scholar] [CrossRef]
- Gangemi, A. A comparison of knowledge extraction tools for the semantic web. In Extended Semantic Web Conference; Springer: Berlin/Heidelberg, Germany, 2013; pp. 351–366. [Google Scholar]
- Schumacher, P.; Minor, M.; Walter, K.; Bergmann, R. Extraction of procedural knowledge from the web: A comparison of two workflow extraction approaches. In Proceedings of the 21st International Conference on World Wide Web, Lyon, France, 16–20 April 2012; pp. 739–747. [Google Scholar]
- Corbin, J.; Strauss, A. Techniques and procedures for developing grounded theory. In Basics of Qualitative Research; Sage Publications: Thousand Oaks, CA, USA, 2008. [Google Scholar]
- Ha, H.; Han, H.; Mun, S.; Bae, S.; Lee, J.; Lee, K. An Improved Study of Multilevel Semantic Network Visualization for Analyzing Sentiment Word of Movie Review. Data Appl. Sci. 2019, 9, 2419. [Google Scholar] [CrossRef]
- Wang, Y.; Youn, H.Y. Feature Weighting Based on Inter-Category and Intra-Category Strength for Twitter Sentiment Analysis. Appl. Sci. 2019, 9, 92. [Google Scholar] [CrossRef]
- Daugherty, T.; Eastin, M.S.; Bright, L. Exploring consumer motivations for creating user-generated content. J. Interact. Advert. 2008, 8, 16–25. [Google Scholar] [CrossRef]
- Lacity, M.C.; Janson, M.A. Understanding qualitative data: A framework of text analysis methods. J. Manag. Inf. Syst. 1994, 11, 137–155. [Google Scholar] [CrossRef]
- Verhoef, P.C.; Kooge, E.; Walk, N. Creating Value with Big Data Analytics: Making Smarter Marketing Decisions; Routledge: London, UK, 2016. [Google Scholar]
- Sherman, K.J.; Cherkin, D.C.; Erro, J.; Miglioretti, D.L.; Deyo, R.A. Comparing yoga, exercise, and a self-care book for chronic low back pain: A randomized, controlled trial. Ann. Intern. Med. 2005, 143, 849–856. [Google Scholar] [CrossRef] [PubMed]
- Banerjee, S.; Chua, A.Y.; Kim, J. Using supervised learning to classify authentic and fake online reviews. In Proceedings of the 9th International Conference on Ubiquitous Information Management and Communication, Bali, Indonesia, 8–10 January 2015. [Google Scholar]
- Reyes-Menendez, A.; Saura, J.R.; Alvarez-Alonso, C. Understanding #WorldEnvironmentDay User Opinions in Twitter: A Topic-Based Sentiment Analysis Approach. Int. J. Environ. Res. Public Health 2018, 15, 2537. [Google Scholar] [CrossRef]
- Blondel, V.D.; Guillaume, J.; Lambiotte, R.; Lefebvre, E. Fast unfolding of communities in large networks. J. Stat. Mech. Theory Exp. 2008, 2008, 10008. [Google Scholar] [CrossRef]
- Lambiotte, R.; Delvenne, J.C.; Barahona, M. Random walks, Markov processes and the multiscale modular organization of complex networks. IEEE Trans. Netw. Sci. Eng. 2014, 1, 76–90. [Google Scholar] [CrossRef]
- Matta, J.; Obafemi-Ajayi, T.; Borwey, J.; Sinha, K.; Wunsch, D.; Ercal, G. Node-Based Resilience Measure Clustering with Applications to Noisy and Overlapping Communities in Complex Networks. Appl. Sci. 2018, 8, 1307. [Google Scholar] [CrossRef]
- Krippendorff. Content Analysis: An Introduction to Its Methodology, 3rd ed.; Sage: Thousand Oaks, CA, USA, 2013; pp. 221–250. [Google Scholar]
- Saura, J.R.; Reyes-Menendez, A.; Palos-Sanchez, P. Are Black Friday Deals Worth It? Mining Twitter Users’ Sentiment and Behavior Response. J. Open Innov. Technol. Mark. Complex. 2019, 5, 58. [Google Scholar] [CrossRef]
- Saif, H.; Fernández, M.; He, Y.; Alani, H. Evaluation datasets for Twitter sentiment analysis: A survey and a new dataset, the STS-Gold. In Proceedings of the 1st Interantional Workshop on Emotion and Sentiment in Social and Expressive Media: Approaches and Perspectives from AI (ESSEM 2013), Turin, Italy, 3 December 2013. [Google Scholar]
- Anderson, D.; Burnham, K. Model Selection and Multi-Model Inference, 2nd ed.; Springer: New York, NY, USA, 2004; ISBN 978-0-387-95364-9. [Google Scholar]
- Pritchard, J.K.; Stephens, M.; Donnelly, P. Inference of population structure using multilocus genotype data. Genetics 2000, 15, 945–959. [Google Scholar]
- Blei, D.M.; Ng, A.Y.; Jordan, M.I.; Lafferty, J. Latent Dirichlet Allocation. J. Mach. Learn. Res. 2003, 3, 993–1022. [Google Scholar]
- Guibon, G.; Ochs, M.; Bellot, P. From Emojis to Sentiment Analysis. 2016. Available online: https://hal-amu.archives-ouvertes.fr/hal-01529708/document (accessed on 23 September 2019).
- Jain, T.I.; Nemade, D. Recognizing Contextual Polarity in Phrase-Level Sentiment Analysis. Int. J. Comput. Appl. 2010, 7, 12–21. [Google Scholar] [CrossRef]
- Krippendorff, K. Bivariate Agreement Coefficients for Reliability Data. Chapter 8. In Sociological Methodology; Borgatta, E.R., Bohrnstedt, G.W., Eds.; Jossey Bass, Inc.: San Francisco, CA, USA, 1970; Volume 2, pp. 139–150. [Google Scholar]
- Krippendorff, K. Computing Krippendorff’s Alpha-Reliability. 2011. Available online: http://repository.upenn.edu/asc_papers/43 (accessed on 23 September 2019).
- Palos-Sanchez, P.; Martin-Velicia, F.; Saura, J.R. Complexity in the Acceptance of Sustainable Search Engines on the Internet: An Analysis of Unobserved Heterogeneity with FIMIX-PLS. Complexity 2018. [Google Scholar] [CrossRef]
- Van den Broek-Altenburg, E.M.; Atherly, A.J. Using Social Media to Identify Consumers’ Sentiments towards Attributes of Health Insurance during Enrollment Season. Appl. Sci. 2019, 9, 2035. [Google Scholar] [CrossRef]
- Provost, F.; Fawcett, T. Data science and its relationship to big data and data-driven decision making. Big Data 2013, 1, 51–59. [Google Scholar] [CrossRef]


© 2019 by the authors. Licensee MDPI, Basel, Switzerland. This article is an open access article distributed under the terms and conditions of the Creative Commons Attribution (CC BY) license (http://creativecommons.org/licenses/by/4.0/).