Article

Classifying Social Enterprises with Organizational Culture, Network and Socioeconomic Performance: Latent Profile Analysis Approach

1
Department of Social Welfare, Kyungpook National University, Daegu 41566, Korea
2
Department of Psychology, Kyungpook National University, Daegu 41566, Korea
*
Author to whom correspondence should be addressed.
J. Open Innov. Technol. Mark. Complex. 2019, 5(1), 17; https://doi.org/10.3390/joitmc5010017
Submission received: 13 February 2019 / Revised: 6 March 2019 / Accepted: 6 March 2019 / Published: 11 March 2019

Abstract

:
Culture is a key driving force in enhancing organizational performance. The results of recent studies indicate the importance of managers having the capacity to understand organizational culture and link it to organizational performance improvement. This study aims to examine the relationship between organizational culture and performance improvement in social enterprises. In the past, organizational culture was described in terms of a single dimension, but it is now understood that different cultures reflect different values and beliefs, in a seemingly contradictory manner, and can coexist within any given organization. We analyze the relationships among social enterprise networking, performance, and organizational culture, using the four organizational culture classifications of the competing values framework, which reflects recent perspectives. A survey was conducted among 100 social entrepreneurs, and latent profile analysis was applied to the data. The analytical results identify four latent profiles—namely, strong-balanced, weak-balanced, hierarchical, and group-dominant—and show that a balanced culture fosters high-level socioeconomic performance.

1. Introduction

As we face the limits of capitalism’s growth, interest in social enterprises that create socioeconomic value is increasing [1]. Social enterprises constitute a middle form between traditional profit-making enterprises and nonprofit organizations that aim to create social value [2]. Although social enterprises are meaningful in terms of providing social services and creating jobs, they have some contextual (situational) conditions, such as management’s lack of ability in creating stable earnings, and excessive emphasis on social objectives. Therefore, there is a need for a management strategy that enables social enterprises to enhance not only the likelihood of their own survival, but also their performance [3,4]. If social enterprises are to obtain market competitiveness, it is essential that their organizational cultures and human resource management be differentiated.
Since the 1980s, studies on corporate and organizational culture have been actively conducted in the business administration field [5]. Previous studies on organizational culture have largely focused on either the relationship between organizational culture and organizational context, or the relationship between the type of organizational culture and organizational performance. Many empirical studies on commercial enterprises have sought ways of improving corporate performance, and many have confirmed that corporate culture is a factor that affects performance [6,7,8]. For instance, a strong culture commercial organization showed high performance [9] and organizational culture promoting innovative norms affects performance of professional service firms like law firms [10]. The success of adopting new practices in a social welfare agency depends on the organizational culture [11]. Regardless of the type of organization, organizational culture influences the values and behaviors of organizational member by functioning as a social control mechanism [12]. These previous studies regarding organizational culture are based on the premise that, as a competitive factor, culture has a major effect on organizational performance. Social enterprises are expected to have an organizational culture that is distinct from commercial enterprises in terms of mission, management, and resources. Additionally, the distinctive organizational culture of social enterprises would affect organizational performance differently in commercial enterprises, as social enterprises have “hybrid” characteristics that distinguish them from commercial enterprises, nonprofit organizations, and public organizations. “Social enterprises pursue the dual mission of achieving both financial sustainability and social purpose” ([13]), and as such, they combine business and charity characteristics and take a distinctive organizational form [14]. Despite the importance of discussing the organizational culture of social enterprises, there has been a dearth of related research. This study aims to fill the literature gap regarding the relationship between organizational culture type and organizational performance, as well as the practical aspects of organizational culture type that can contribute to organizational performance.
In the past, the culture of an organization was described in terms of a single dimension; however, it is now understood that different cultures reflect different values and beliefs, often in a seemingly contradictory manner, and can coexist within any given organization [6,15,16,17,18]. Using the competing values framework (CVF)—a representative organizational culture model that reflects these perspectives—we examine how the organizational culture of social enterprises relates to organizational performance. The purpose of this study is to analyze the relationship among the organizational culture of social enterprises, networking in organizations and their socioeconomic performance, using data captured through a survey of South Korean social enterprise operators. Through latent profile analysis (LPA)—an analytical technique that finds the best-fitting model by dividing the participants’ responses into latent profiles—we analyze the relationship between organizational performance and organizational culture from both academic and policy perspectives. Additionally, we offer implications with regard to our research results.

2. Literature Review

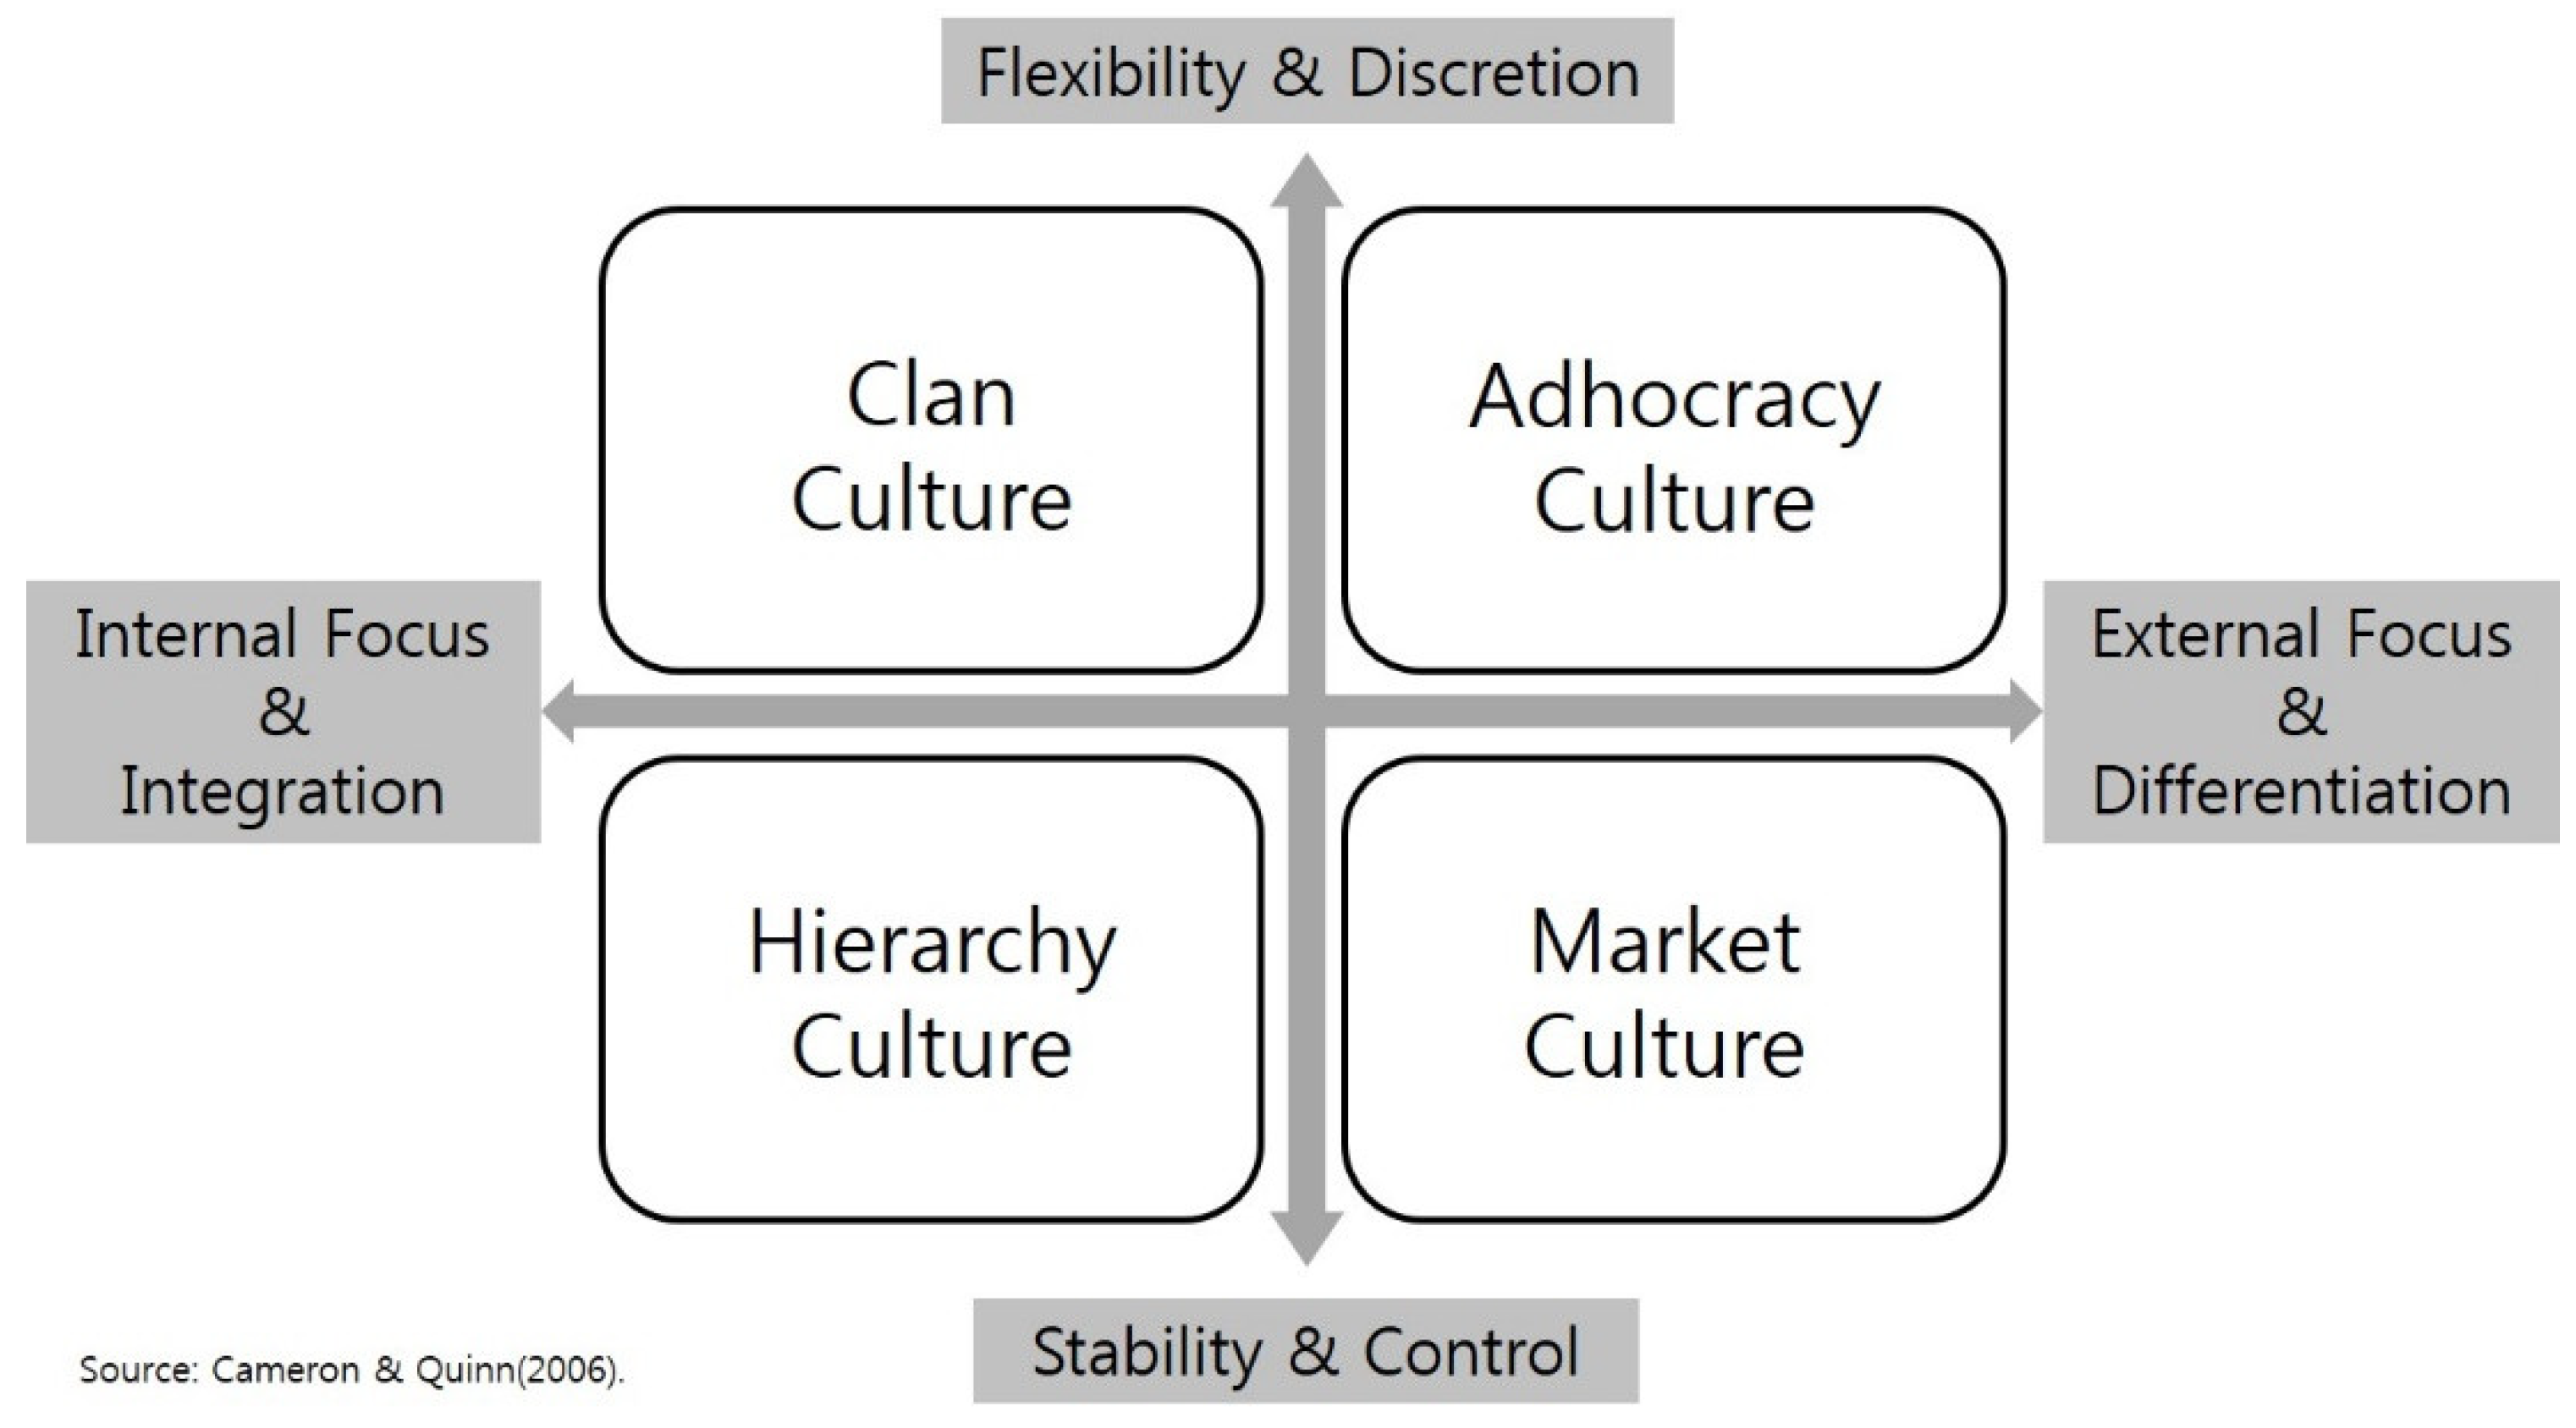
2.1. Organizational Culture, Competing Values Framework, and Performance

Organizational culture is a comprehensive and abstract concept that comprises the values, beliefs, customs, traditions, knowledge, skills, and symbols that an organization’s members share [5]. Organizational culture is further defined as a sense of meaning shared by members, which thus distinguishes one organization from others [15,16]. Every organization has a culture, and in a fast-paced and complex business environment, it is essential that an organization actively manage its organizational culture and gain a competitive advantage [19,20]. This concept has long been used as a useful tool in understanding organizational characteristics and explaining members’ behaviors, ultimately to improve organizational performance. In this way, an organization’s culture plays a very important role in its survival, and in how it forms and maintains its development and effectiveness.
Organizational culture influences organizational performance in many ways, by changing the thinking and behavior of organizational members. Not only does organizational culture influence the behavior of members—including how members feel, think, communicate, and justify their actions—but their actions, in turn, affect the organizational culture [21]. Organizational culture can increase the levels of engagement and commitment within an organization, which can result in increased efficiency that saves time and money. In this way, organizational culture increases an organization’s effectiveness, based on the consensus formed by the shared value system; additionally, it suggests directions for improvement in organizational performance by increasing members’ interest in organizational goals [18,22,23]. In contrast, if harmony is not achieved between the organization and its members, culture can act as a burden on the organization. In this study, we view organizational culture as a comprehensive concept that comprises the values, beliefs, ideologies, customs, knowledge, traditions, techniques, and symbols that the members of an organization share.
In recent years, scholars have developed a new interest in the relationship between organizational culture type and organizational performance and have linked these two factors empirically. Most of these studies view culture as a multidimensional structure [16]. According to previous studies, there is one of a kind generally no “good” organizational culture applicable to any organization. Given these characteristics, cultural typological research methods are used to study organizational culture, and the results thereof verify that organizational performance differs in line with the organization’s culture-type characteristics [6].
Recently, most studies on the relationship between organizational culture and organizational performance have measured organizational performance in terms of organizational culture type. Distinguishing this typology helps determine which characteristics affect organizational performance most. Harrison identifies four ideological types (i.e., role orientation, task orientation, power orientation, and person orientation) and their impact on organizational performance, while assuming that the cultural characteristics of an organization are contingent on its ideological orientation [24].
Organizational culture types can be classified into various categories, depending on the criteria applied. The most commonly used criteria are those in the competing values framework (CVF) of Cameron and Quinn [6]. The multidimensional CVF seeks to overcome the limitations inherent in earlier studies—studies that approached organizational culture as a single-dimension phenomenon, despite the fact that organizations share various values [17]. The CVF is a comprehensive framework and, unlike conventional thinking, it does not aim to define cultures in terms of a single dimension.
According to the CVF, organizational culture types can be divided into four categories, based on two dimensions—namely, internal versus external, and control versus flexibility (see Figure 1) [6]. The four models and their cultural characteristics are as follows. First, the clan model is a consensus culture that focuses on human relations and emphasizes integration and flexibility within the organization. It stresses values such as unity and cooperation and is characterized by a human and family atmosphere that focuses on the care of and attention to its members. Second, an adhocracy culture is characterized by adaptation, change, and elasticity with respect to the external environment. It emphasizes the importance of the organization’s development and growth in adapting to environmental change, and it values creativity, adventure, and conductivity within the organization. Third, a hierarchical culture aims to maintain integration, stability, and status within the organization. In other words, it emphasizes those values and norms of a traditional bureaucracy that speak to official orders, rules, surveillance, and control. Finally, a market culture emphasizes productivity in achieving organizational goals, based on an external orientation and stability. The values stressed in a market are productivity, efficiency, and rationality. Ultimately, the CVF shows that the organizational culture phenomenon is about culture types coexisting and combining with each other, rather than about one culture type exclusively dominating the organizational culture.
To change and manage organizational culture, a manager needs to leverage four competing values effectively, and blend four different imperatives. The comments of Quinn et al. [25] in this regard are summarized below. The clan culture is characterized by a focus on consideration and concern for the clan members, and on having a family atmosphere. Therefore, in a social enterprise, the presence of this culture is expected to contribute to improvements in social and economic performance. However, this culture type has negative aspects, including extreme permissiveness, uncontrolled individualism, inappropriate participation, and unproductive discussion. The adhocracy culture, on the other hand, supports creative and adventurous challenges, and members tend to perform autonomously; therefore, in a social enterprise, this culture type is also expected to contribute to improvements in social and economic performance. However, too much emphasis on change and adaptation can cause premature responsiveness, disastrous explanations, political expediency, and unprincipled opportunism. The hierarchy culture has the advantage of enhancing the effective management and integration of the organization, in terms of providing efficiency and stability by pursuing an internal orientation; moreover, organization members can become familiar with the procedures and operation methods. However, a hierarchy culture does have negative effects, including procedural sterility, unnecessary rigor, the perpetuation of habits, and an ironbound tradition (i.e., intransigence). Finally, the market culture emphasizes the achievement of goals, but relatively neglects the teamwork or collaborative work that comes with the macro-level consciousness of the group or organization level, given that this is a performance-oriented organizational culture. However, there is the possibility that excessive emphases on performance and productivity can lead to certain problems, such as overexertion, human exhaustion, problems in understanding regulations, and blind adherence to dogma. Quinn et al. stress that it is the responsibility of the manager to balance and integrate these four competing values, rather than rely on a single approach; to do so would be to exhibit “behavioral complexity” [25].
The CVF has the advantage of clearly distinguishing characteristics or concepts among organizational culture types, by modeling the four distinct types in a single unified framework. Although the nature and value inherent in an organization can be in competitive tension and conflict, the CVF assumes that the four organizational culture types can appear simultaneously in an organization. In a given situation or environment, in some organizations, one of the four culture types will dominate the organizational culture; in others, the culture types will combine to form a more balanced culture. The CVF is a useful tool for understanding the organizational culture profiles of social enterprises. As a hybrid organization, social enterprises need to harmonize various values and interests and respond to the duality of internal and external stakeholders. This poses a kind of “service paradox”: if the culture has not been managed well—that is, one logic has predominated—the social enterprise could lose the ability to address its problems [26]. The duality and hybridity of social enterprises cause organizational tension, and it is important that social enterprises manage such tensions [27,28].

2.2. Network and Performance

A network is a group of two or more individuals or groups who interact through a linking process—usually a tool for achieving organizational goals, securing resources, and undertaking collaboration [29,30,31]. Among start-up companies, capturing opportunities through social networks is important, and stronger (and more formal) linkages can be achieved as the business matures [32,33]. This means that networking is more significant for small-sized social enterprises that lack resources.
In exploring collaborative activities among human service organizations, it was found that when cooperative organizational relationships are established, both the organization and its members can achieve their desired performance level [34]. These results are equally applicable to social enterprises. The competitiveness of social enterprises has been found not only to improve the quality of their products and services, but also to secure product and service outlets. For social enterprises, the importance of social capital (e.g., networking) cannot be overemphasized. Recent studies of social enterprise performance have focused on social capital’s relationship to network activities [35,36]. According to network theory, networking ability and intensity are key characteristics among social entrepreneurs. Successful business ownership might depend on the ability of owners to gain access to resources in a cost-effective way, through networking. The significant and positive relationship between networking and both organizational survival and growth has been empirically determined [37].

2.3. The Function of Organizational Culture Profiles among Networks, and Social Enterprise Performance

The performance of a social enterprise cannot be easily defined, because the concept of a social enterprise is in itself complex and can be defined variously, according to its breadth, scope, and characteristics [38,39]. Although there is a dearth of discussion on social enterprise performance, it is generally agreed that economic performance (i.e., profit generation) and the creation of social value (i.e., fulfilling a social purpose) comprise the performance of a social enterprise.
To investigate the effect of organizational culture on organizational performance, some studies on commercial enterprises have empirically demonstrated the relationships among those variables. Empirical research on the relationship between the organizational culture and organizational performance of social enterprises mainly analyzes how organizational culture affects economic performance and subjective performance, such as organizational commitment and job satisfaction. Many studies suggest that an organizational culture drives efficiency and effectiveness by elevating commitment, job satisfaction, and productivity [40,41]. Based on the results of previous studies, we know that shared beliefs and values that have been managed in appropriate ways among the four complex competing values can help maximize both the social and economic performance of social enterprises. Nonetheless, there is a lack of research on the effects of a social enterprise’s organizational culture on that enterprise’s performance.
Prior studies on social enterprises mainly focus on organizational characteristics and performance evaluations. The CVF underscores that an organization with balanced and mixed competing values will achieve better performance than one in which a single particular culture dominates [18,20,23,25]. Therefore, one can deduce that a social enterprise with a balanced culture type that features more than one of the four competing cultures will achieve better performance than a social enterprise with a single predominant culture. As mentioned, a manager’s network activities relate to the organizational performance of his or her enterprise. Based on the results of previous research, we set two hypotheses, as follows.
Hypotheses 1 (H1).
The LPA-classified organizational culture type will affect the relationship between a social entrepreneur’s network and the enterprise’s economic performance.
Hypotheses 2 (H2).
The LPA-classified organizational culture type will affect the relationship between a social entrepreneur’s network and the enterprise’s social performance.
Based on the results of previous studies, we expect that social enterprises’ profiles, as identified through LPA, are functions of networking and performance. We thus propose hypotheses about how LPA-classified type and other external variables, networking, and performance, all interrelate. Our hypotheses are as follows.
Hypotheses 3 (H3).
Latent profile membership will differ across social enterprises, in line with the four organizational cultures.
Hypotheses 4 (H4).
The networking of social enterprises will affect the derived latent profile membership.
Hypotheses 5 (H5).
Latent profile membership will affect a social entrepreneur’s social and economic performance.
To test these hypotheses, we built a conceptual LPA model. This model was used not only to identify social enterprises’ underlying organizational culture profiles, but also to explore mediating relationships between latent profile memberships and related external variables (including social and economic performance and networks).

3. Method

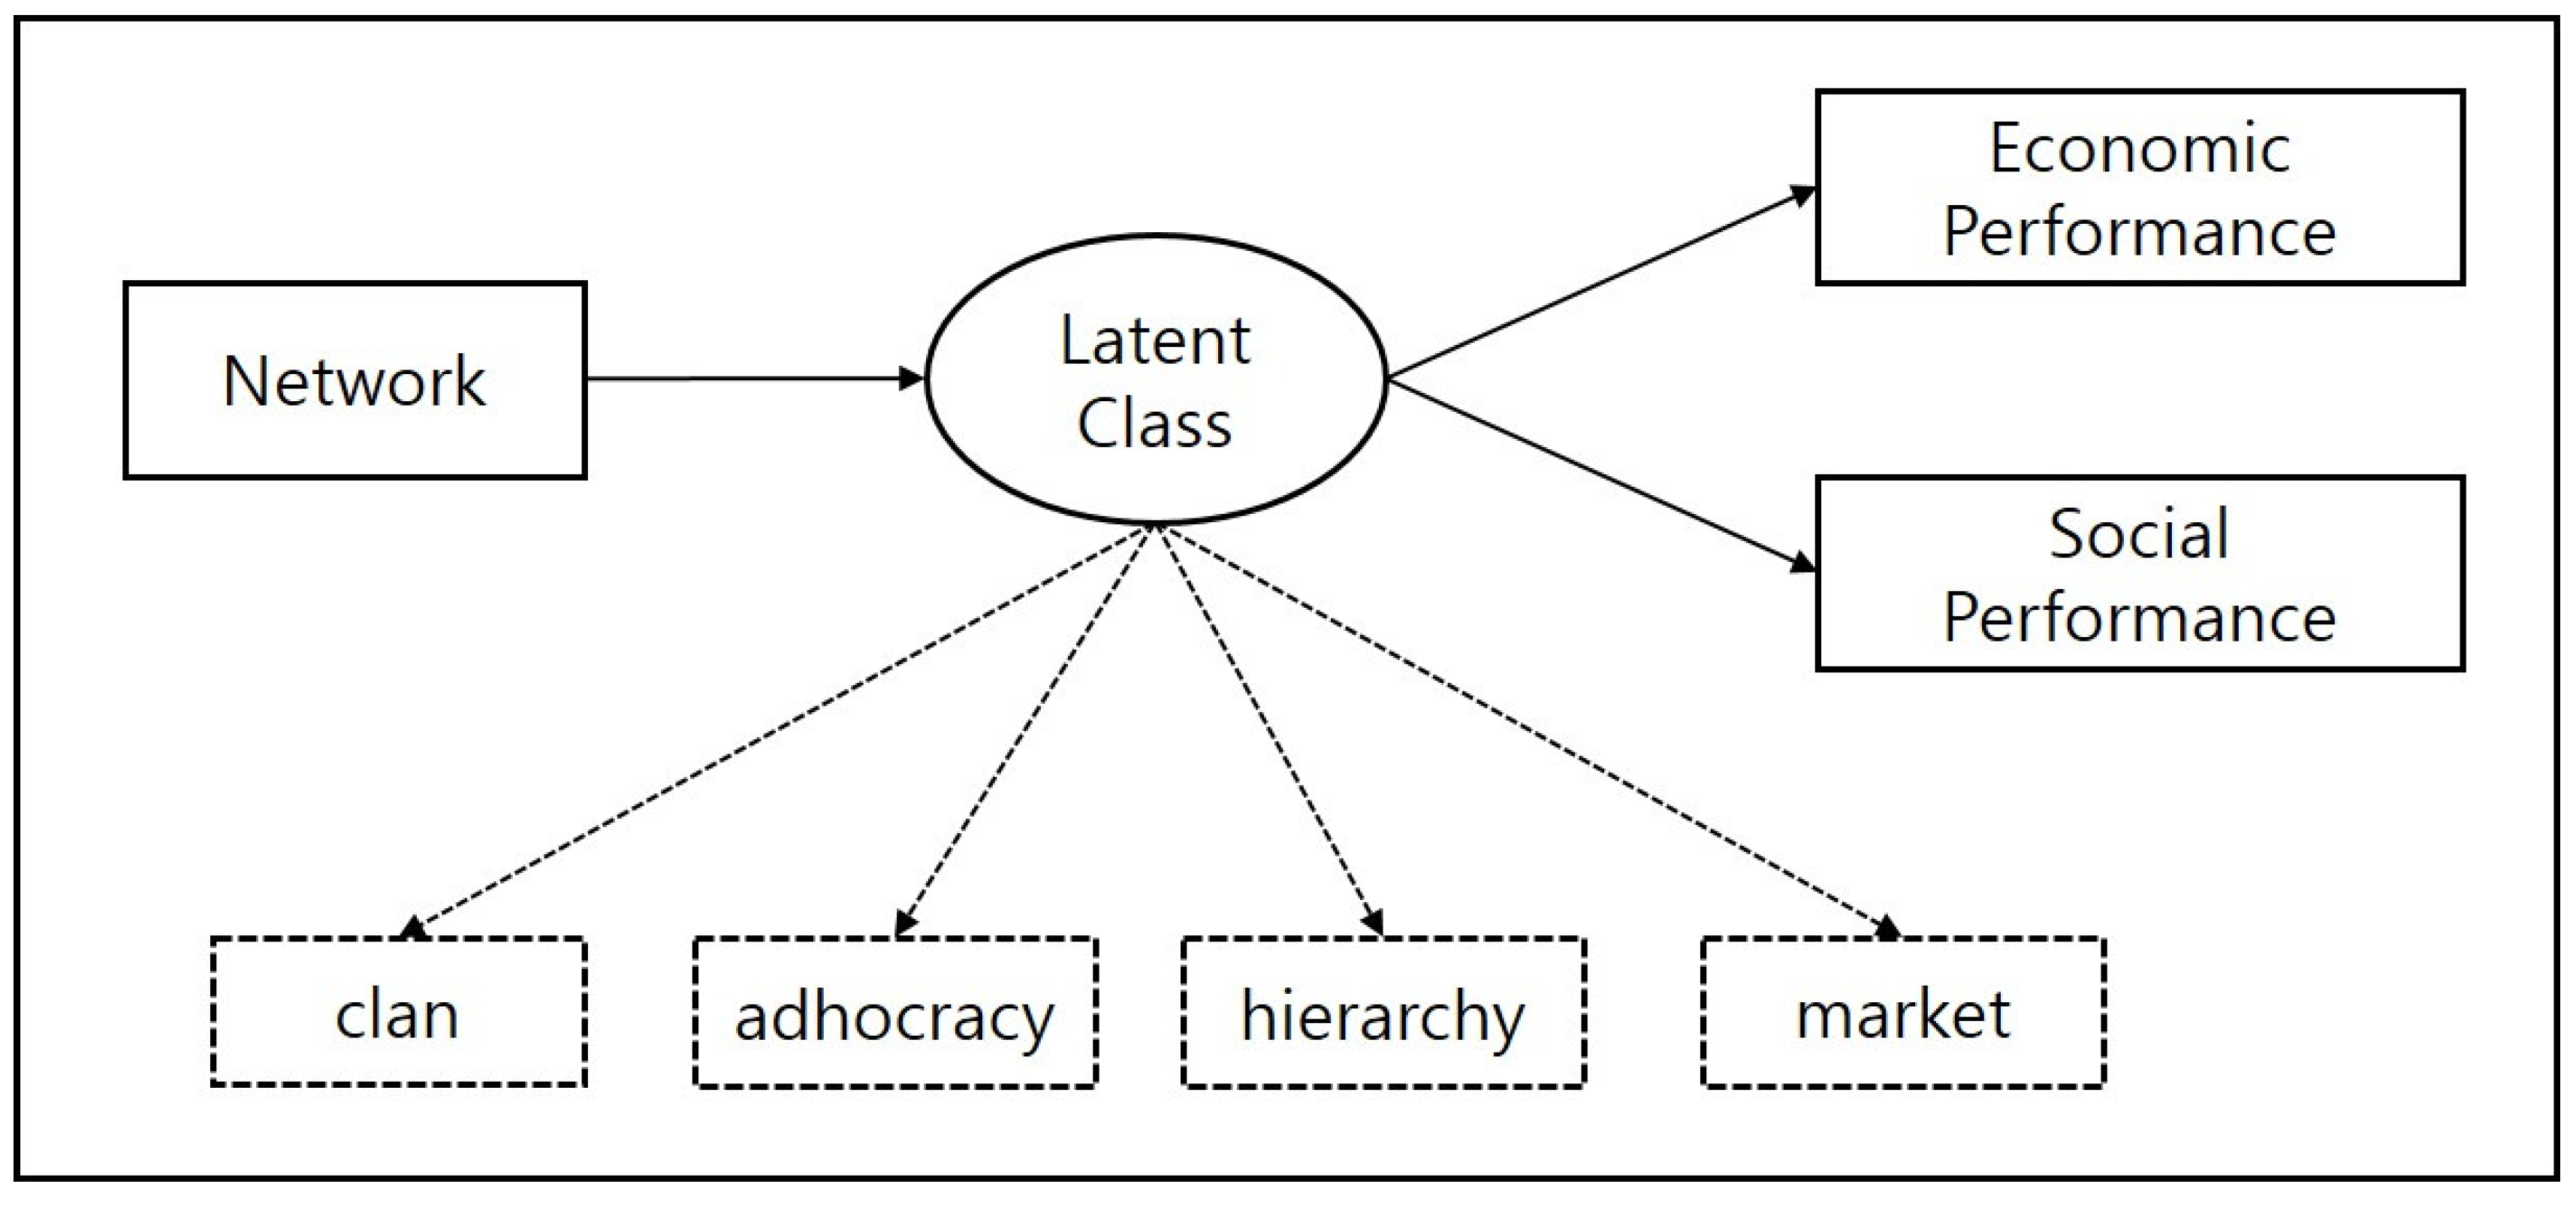
3.1. Statistical Method: LPA as a New Approach

We first built an LPA model of organizational cultures, based on the total scores pertaining to the four aforementioned organizational culture scales. (Recall that we used these scales as indicators.) A series of LPA models with between one and six latent profiles were compared, using the fitness statistics of the six models; the optimal model was then selected to derive the final interpretation of the results. Prior studies have suggested that likelihood-based information criteria (IC) (e.g., the Akaike information criteria [AIC] and the Bayesian information criteria [BIC]) are the most common means of determining the optimal model [42,43,44]. These strike a good balance between model fit and parsimony by maximizing the likelihood function and penalizing additional model complexity. Among the candidates, the model with the lowest IC values was considered the best-fitting model. The entropy and interpretability of the profiles were also considered during the model selection process.
After identifying the best-fitting model, the effects of covariates and distal outcomes were then estimated to identify the factors expected to relate to the respondents’ latent profile membership. The effects were modeled using multinomial logistic regression models. Figure 2 provides a path diagram of two models and specifies the hypothetical relationship between latent profile memberships and external variables.
In both models, network and environment were used as covariates to predict latent profile membership, and the economic performance and social performance of social enterprises were selected as distal outcomes to predict latent profile memberships. Because we wished to assess the two types of performance (i.e., economic and social) separately, they were examined in different models. Among the many approaches used to investigate the effects of covariates and distal outcomes in the context of LPA, we utilized the biased adjusted maximum likelihood three-step method (ML method) proposed by Vermunt [45]. The ML method is a procedure in which model selection and the evaluation of external variable effects are carried out sequentially, while taking into account the uncertainty of the assignment of individuals into latent profiles. Previous studies have shown that the ML method not only produces unbiased parameter and standard error estimates of the external variables, but also controls for uncertainty in profile assignment under the initial profile structure chosen in the model selection stage [46,47,48]. All statistical analyses were carried out using the Latent GOLD 5.1 Syntax Module [49].

3.2. Data and Measures

The social enterprises analyzed in this study are those registered on the website of the Korea Social Enterprise Promotion Agency (www.socialenterprise.or.kr). As of March 2017, 435 companies had reported their 2016 social enterprise status information to the agency. A survey was mailed to the top managers of these companies between December 2017 and February 2018. Of the 435 questionnaires we disseminated, we collected a total of 100 completed questionnaires (response rate: 23%).
Network scale is mainly associated with organizational social networks, such as membership in social enterprise associations, the community, and local government. Social performance is defined as the degree to which a social enterprise creates value, such as community contributions, job creation, and social service provision. It was measured in terms of five items: favorable evaluation from local residents, internal investment of revenues for employee pay increases or service/product R&D, external investment of revenues for community returns, pride in the work of employees, and contributions to positive change in society. Economic performance was defined in terms of financial sustainability—that is, whether sales and net profits show upward trends in the long term—and was measured by the degree of continuous increase in sales and net profit in three recent years. The Cronbach’s α of social performance is 0.893, and that of economic performance is 0.855; thus, we can be assured of the reliability of these two variables.
We measured organizational culture by using the organizational culture assessment instrument (OCAI) scale of Cameron and Quinn [6]. OCAI scales are used to measure organizational culture, and it is both valid and reliable. In this study, a total 20 organizational culture items were assessed, using Likert-scale scoring.

4. Results

Table 1 provides the descriptive statistics of the study sample. The data in Table 2 were fit to six different models, each of which had one to six latent profiles. Table 2 summarizes the log-likelihood values and fit statistics of the estimated models. According to the AIC3, BIC, and consistent AIC (CAIC) values, the best-fitting model was the four-profile model; according to the AIC, the five-profile model was considered optimal. In general, researchers prefer a parsimonious model when it captures a sufficient latent structure. Moreover, previous model selection studies have shown that the AIC tends to overestimate the number of latent profiles in LPA models [32,39]. For these reasons, we selected the four-profile model as the final model.
We presented the latent profiles of the selected four-profile model, and named each latent profile based on the pattern of mean scores on the organizational culture scale. Table 3 presents the latent profile probabilities (i.e., profile sizes) and the mean scores of each profile. The results show that Profile 1 consists of approximately 75% of the respondents (n = 74), and their overall mean scores on the four organizational cultures (25.623) were lower those of Profile 2 (33.406), but higher than those of Profiles 3 and 4 (17.658 and 12.206, respectively). Profile 1 is characterized by scores relatively higher than those in Profiles 3 and 4, but scores slightly lower than those in Profile 2; therefore, it was labeled the weak-balanced profile. Profile 2, which includes 11.5% of the respondents (n = 11), is distinct from the other three profiles, in that it does not have one dominant culture; it showed balanced scores across four organizational cultures, with the highest average scores among the profiles. Hence, we called it the strong-balanced profile. Profile 3—which consists of 9.7% (n = 10) of the participants—had the highest mean hierarchical culture score. In contrast, Profile 4—which consists of 4.2% (n = 4) of the participants—showed the highest mean clan culture score. Thus, with respect to organizational culture, Profile 3 was labeled the hierarchy-dominant profile, and Profile 4 the clan-dominant profile.
Table 4 shows the multinomial regression of the first model in Figure 2. Regarding the effect of the covariate, respondents with a medium network score (11–13) were likely to belong to the weak-balanced profile, whereas those with the highest network scores (17–21) had a strong chance of being in the strong-balanced profile. The respondents with the lowest network scores (1–8) had a high likelihood of belonging to the hierarchical-dominant profile, while those with slightly higher network scores (9–10) were mostly classified as having the clan-dominant profile. Meanwhile, the effect of the environment was not significant. The results of the distal outcome (economic performance) revealed that among the four latent profiles, respondents with the strong-balanced profile were likely to show the best economic performance (31–45), whereas the performance of respondents grouped into the weak-balanced profile tended to be slightly lower than those with the strong-balanced profile (29–30). Among the four profiles, the respondents with the hierarchy-dominant and clan-dominant profiles showed the lowest economic performance (5–20).
Table 5 presents the results of the model while including social performance as a distal outcome (Figure 2). The pattern of mean scores on organizational cultures was quite similar to that from the first model (economic performance)—that is, the respondents having the highest network scores (17–21) were likely to be assigned to the strong-balanced profile, and the respondents with the lowest network scores (1–8) were likely to belong to the hierarchy-dominant profile. Meanwhile, the respondents whose network scores ranged from 11 to 13 had a greater chance of being in the weak-balanced profile, whereas those whose network scores ranged from 9 to 10 were mostly assigned to the clan-dominant profile. Regarding social performance, the respondents classified as strong-balanced performed best (39–54). The hierarchy-dominant and clan-dominant profiles were associated with poor performance (6–29), whereas the weak-balanced profile showed medium-level performance (36–38).
The results indicated that derived latent profile memberships differed across social enterprises. Moreover, the relationship between network and socioeconomic performance varied across the different latent profiles, providing support for Hypotheses 1 through 5.

5. Discussion

Let us summarize the results of this study and present the theoretical and practical implications of this research. First, we found network activity to correlate positively with both economic and social performance, such that more active networking yielded better performance in both respects. This result is consistent with the results of prior research on the relationship between networking and performance [33,37]. Second, we identified four latent profiles: strong-balanced, weak-balanced, hierarchical, and group-dominant. Among the four profiles, we found the weak-balanced profile to contain the most respondents (74.7% of the sample), whereas the clan-dominant profile contained the smallest number of respondents (4.2% of the sample). Third, social enterprises with a well-balanced culture featuring four organizational cultures showed higher social and economic performance, whereas social enterprises with relatively single dominant culture scores showed low performance. Fourth, we also found that this relationship was mediated by latent profile memberships, with the strong-balanced profile having the strongest mediation relationship among the four profiles and the clan-dominant profile the weakest. The profiles with a single dominant organizational culture—namely, hierarchy-dominant and clan-dominant—engaged in relatively little networking and showed poor economic and social performance.
In terms of theory, this study confirms the suitability of the CVF in explaining organizational culture in social enterprises. In terms of stability and change, the CVF does not presuppose mutually exclusive logic among the four different cultures. Although the standards, values, and basic assumptions may seem to conflict, the CVF considers these factors complementary. As hybrid organizations, social enterprises are always in tension and have paradoxical competing values. Social enterprises featuring a single dominant culture and a strong culture did not perform well, compared to social enterprises with a weak-balanced culture ([25], pp. 40–41, [50,51]).
Quinn et al. emphasize that having only a single management approach or a single set of behaviors can be a failing factor in achieving organizational performance. According to Quinn et al., an organization in which a particular culture dominates is said to be in a “negative zone”—or, specifically, the irresponsible country club (clan culture-dominant), the frozen bureaucracy (hierarchy culture-dominant), the tumultuous anarchy (adhocracy culture-dominant), and the oppressive sweat shop (market culture-dominant) ([25], p. 317). This is a phenomenon in which the shortcomings of each culture are excessive. Hierarchy culture- and clan culture-dominant enterprises both focus on the inside of the organization and, in this study, they showed low performance levels. These results confirm that for social enterprises, management strategies that emphasize specific cultural elements among mutually exclusive and contradictory elements are no longer effective.
This study also shows the importance of organizational culture in improving the performance of social enterprises. Culture reflects the behavior of the members of an organization and digs deep into its values, standards, processes, and mission. If it can be well-managed, nurtured, coordinated, and linked to organizational performance [52].
Social entrepreneurs should focus on creating a healthy organizational culture. Social entrepreneurs should focus on creating a healthy organizational culture. From a practical viewpoint, there appears to be a need to establish education and training programs by which to improve social entrepreneurs’ leadership and organizational culture management skills. Social enterprise managers must lead hybrid organizations by developing within their enterprises the characteristics of both commercial enterprises and nonprofit organizations; indeed, the abilities of social entrepreneurs are critical to the development and survival of these social enterprises [38,39]. Schein, for example, underscores the role of leaders who promote and change organizational culture [5]. In an ever-changing environment, effective strategies in one situation may not be effective in others; therefore, competent social enterprise managers should develop within themselves the ability to mix and utilize all the different values found within a complex environment. In complex and unpredictable situations, social enterprise professionals should be able to intentionally execute multifaceted management strategies by performing multiple competitive and paradoxical roles in an integrated and complementary manner.
Jay stresses that the service paradox causes within social enterprises, as hybrid organizations, behavioral complexity [26]. As social entrepreneurs, leaders rely upon individual-level efforts to become good managers who can undertake systemic thinking and paradoxical thinking [25]. However, it appears to be very difficult to demonstrate behavioral complexity to organizational management based on an understanding of organizational culture and leadership, through the efforts of individual social entrepreneurs. To foster and develop social enterprises, the government and intermediary support organizations need to prepare diverse educational programs that relate to policy support.

6. Conclusions

This study analyzed the relationships among a social enterprise’s networks, performance, and organizational culture by applying the Competing Values Framework. As a hybrid organization, a social enterprise is characterized by mutually conflicting values that emerge in the course of operations; these values manifest in such areas as the enterprise’s mission, resource mobilization, and business processes. Compared to other organizational types, social enterprises are strong characterized by their acceptance of a variety of values and interests within their own organization, and by their drive to achieve the organization’s objectives. This study theoretically identifies the CVF’s applicability as an analytical framework and demonstrates those social enterprise characteristics that need to be managed, such as management tension(s), some of which are paradoxical in nature. Additionally, this study presents a practical implication with respect to the effective capability and leadership of social enterprise managers in integrating competing and complex management skills.
This study has some limitations. First, this study features a low number of responses, and self-reported questionnaires were used to capture data from South Korean social entrepreneurs operating officially certified social enterprises. Second, the organizational culture of those enterprises was measured as perceived by the enterprises’ own representatives; evaluations of an organization’s culture, however, can vary among its members. In interpreting the results of this study, one must consider these points. Notwithstanding these limitations, the findings provide some insights into the performance and organizational characteristics of social enterprises.

Author Contributions

C.S. designed the research and collected data; J.P. analyzed the data; C.S. and J.P. wrote the paper.

Funding

This research was not supported by any external funding.

Conflicts of Interest

The authors declare that they have no conflict of interest.

References

  1. Yun, J. How do we conquer the growth limits of capitalism? Schumpeterian dynamics of open innovation? JOItmC 2015, 1, 17. [Google Scholar] [CrossRef]
  2. Gupta, A.; Anamika, D.; Gurdeep, S. Connecting corporations and communities: Towards a theory of social inclusive open innovation. JOItmC 2017, 3, 17. [Google Scholar] [CrossRef]
  3. Yusr, M.M. Innovation capability and its role in enhancing the relationship between TQM practices and innovation performance. JOItmC 2016, 2, 6. [Google Scholar] [CrossRef]
  4. Kim, J.; Jung, S. Study on CEO characteristics for management of public art performance centers. JOItmC 2015, 1, 5. [Google Scholar] [CrossRef]
  5. Schein, E.H. Organizational Culture and Leadership; John Wiley & Sons: New York, NY, USA, 2010; Volume 2. [Google Scholar]
  6. Cameron, K.S.; Quinn, R.E. Diagnosing and Changing Organizational Culture; Addison Wesley Inc.: New York, NY, USA, 2006. [Google Scholar]
  7. Gordon, G.G.; DiTomasso, N. Predicting corporate performance from organizational culture. J. Manag. Stud. 1992, 29, 783–798. [Google Scholar] [CrossRef]
  8. Koster, J.P.; Heskett, J.L. Corporate Culture and Performance; The Free Press: New York, NY, USA, 1992. [Google Scholar]
  9. Deal, T.E.; Kennedy, A.A. Corporate Cultures: The Rites and Rituals of Corporate Life. Readings; Addison-Wesley: Boston, MA, USA, 1982. [Google Scholar]
  10. Hogan, S.J.; Coote, L.V. Organizational culture, innovation, and performance: A test of Schein’s model. J. Bus. Res. 2004, 67, 1609–1621. [Google Scholar] [CrossRef]
  11. Aarons, G.A.; Sawitzky, A.C. Organizational culture and climate and mental health provider attitudes toward evidence-based practice. Psychol. Serv. 2006, 3, 61–72. [Google Scholar] [CrossRef] [PubMed]
  12. O’Reilly, C. Corporations, culture and commitment: Motivation and social control in organizations. Calif. Manag. Rev. 1989, 31, 9–25. [Google Scholar] [CrossRef]
  13. Doherty, B.; Haugh, H.; Lyon, F. Social Enterprises as Hybrid Organizations: A Review and Research Agenda. Int. J. Manag. Rev. 2014, 16, 417–436. [Google Scholar] [CrossRef]
  14. Julie, B.; Mathew, L. Advancing Research on Hybrid Organizing—Insights from the Study of Social Enterprises. Acad. Manag. Ann. 2014, 8, 397–441. [Google Scholar]
  15. Hofstede, G. Cultural and Organizations: Intercultural Cooperation and Its Importance for Survival; HarperCollins Business: London, UK, 1991. [Google Scholar]
  16. Duncan, W.J. Organization Culture ‘Getting a Fix’ on an elusive concept. Acad. Manag. Perspect. 1989, 3, 229–236. [Google Scholar] [CrossRef]
  17. Quinn, R.E.; Rohrbaugh, J. A spatial model of effectiveness criteria: Toward a competing values approach to organizational analysis. Manag. Sci. 1983, 29, 363–377. [Google Scholar] [CrossRef]
  18. Cameron, K.S.; Quinn, R.E. Organizational paradox and transformation. In Paradox and Transformation; Quinn, R.E., Cameron, K.S., Eds.; Ballinger Publishing: Cambridge, MA, USA, 1988; pp. 1–18. [Google Scholar]
  19. Denison, D.R. Corporate Culture and Organizational Effectiveness; John Wiley & Sons: New York, NY, USA, 1990. [Google Scholar]
  20. Denison, D.R.; Mishra, A.K. Toward a theory of organizational culture and effectiveness. Org. Sci. 1995, 6, 204–223. [Google Scholar] [CrossRef]
  21. Sathe, V. Implications of corporate culture: A manager’s guide to action. Org. Dyn. 1983, 12, 5–23. [Google Scholar] [CrossRef]
  22. Givens, R. The study of the relationship between organizational culture and organizational performance in non-profit religious organizations. Int. J. Org. The. Behav. 2012, 15, 239–263. [Google Scholar] [CrossRef]
  23. Petty, M.M.; Beadles, N.A.; Chapman, D.F.; Lowery, C.M.; Connell, D.W. Relationships between organizational culture and organizational performance. Psychol. Rep. 1995, 76, 483–492. [Google Scholar] [CrossRef]
  24. Harrison, R. Understanding organization’s character. Harvard. Bus. Rev. 1972, 5, 119–128. [Google Scholar]
  25. Quinn, R.E.; Bright, D.; Faerman, S.R.; Thompson, M.P.; McGrath, M.R. Becoming A Master Manager: A Competing Values Approach; John Wiley & Sons: Hoboken, NJ, USA, 2014. [Google Scholar]
  26. Jay, J. Navigating paradox as a mechanism of change and innovation in hybrid organizations. Acad. Manag. 2013, 56, 137–159. [Google Scholar] [CrossRef]
  27. Ashforh, B.E.; Reingen, P.H. Functions of Dysfunction: Managing the Dynamics of an Organizational Duality in a Natural Food Cooperative. Adm. Sci. Q. 2014, 59, 474–516. [Google Scholar] [CrossRef]
  28. Smith, W.K.; Gonin, M.; Besharov, M.L. Managing Social-Business Tensions: A Review and Research Agenda for Social Enterprise. Bus. Ethics Q. 2013, 23, 407–442. [Google Scholar] [CrossRef]
  29. Anderson, J.C.; Narus, J.A. A model of distributor firm and manufacturer firm working partnerships. J. Mark. 1990, 54, 42–58. [Google Scholar] [CrossRef]
  30. Oliver, C. Determinants of interorganizational relationships: Integration and future directions. Acad. Manag. Rev. 1990, 15, 241–265. [Google Scholar] [CrossRef]
  31. Wickham, P. Strategic Entrepreneurship: A Decision-Making Approach to New Venture Creation; FT Prentice Hall: London, UK, 2004. [Google Scholar]
  32. Tani, M.; Papaluca, O.; Sasso, P. The system thinking perspective in the open-innovation research: A systematic review. JOItmC 2018, 4, 38. [Google Scholar] [CrossRef]
  33. Butler, J.E.; Hansen, G.S. Network evolution, entrepreneurial success, and regional development. Entrep. Region. Dev. 1991, 3, 1–16. [Google Scholar] [CrossRef]
  34. Forman, H.; Powell, T.A. Union-management cooperation. J. Nurs. Adm. 2003, 33, 621–623. [Google Scholar] [CrossRef]
  35. Hines, F. Viable social enterprise: An evaluation of business support to social enterprises. Soc. Enter. J. 2005, 1, 13–28. [Google Scholar] [CrossRef]
  36. Defourny, J.; Nyssens, M. Social enterprise in Europe: Recent trends and developments. Soc. Enter. J. 2008, 4, 202–228. [Google Scholar] [CrossRef]
  37. Watson, J. Modeling the relationship between networking and firm performance. J. Bus. Ventur. 2007, 22, 852–874. [Google Scholar] [CrossRef]
  38. Bornstein, D.; Davis, S. Social Entrepreneurship: What Everyone Needs to Know; Oxford University Press: Oxford, UK, 2010. [Google Scholar]
  39. Dacin, P.A.; Dacin, M.T.; Matear, M. Social entrepreneurship: Why we don’t need a new theory and how we move forward from here. Acad. Manag. Perspect. 2010, 24, 37–57. [Google Scholar]
  40. Peters, T.; Waterman, R.H. Search of Excellence: Lessons from America’s Best Run Companies; Harper & Row: New York, NY, USA, 1982. [Google Scholar]
  41. Safford, G.S. Culture traits, strength, and organizational performance: Moving beyond “strong” culture. Acad. Manag. Rev. 1988, 13, 546–558. [Google Scholar]
  42. Hagenaars, J.A.; McCutcheon, A.L. Applied Latent Class Analysis; Cambridge University Press: Cambridge, UK, 2002. [Google Scholar]
  43. Nylund, K.L.; Asparouhov, T.; Muthén, B.O. Deciding on the number of classes in latent class analysis and growth mixture modeling: A Monte Carlo simulation study. Struct. Equ. Model. 2007, 14, 535–569. [Google Scholar] [CrossRef]
  44. Yang, C.C. Evaluating latent class analysis models in qualitative phenotype identification. Comput. Stat. Data Anal. 2006, 50, 1090–1104. [Google Scholar] [CrossRef]
  45. Vermunt, J.K. Latent class modeling with covariates: Two improved three-step approaches. Political Anal. 2010, 18, 450–469. [Google Scholar] [CrossRef]
  46. Asparouhov, T.; Muthén, B.O. Auxiliary variables in mixture modeling: Three-step approaches using Mplus. Struct. Equ. Model. 2014, 21, 329–341. [Google Scholar] [CrossRef]
  47. Bolck, A.; Croon, M.; Hagenaars, J. Estimating latent structure models with categorical variables: One-step versus three-step estimators. Political Anal. 2004, 12, 3–27. [Google Scholar] [CrossRef]
  48. Lanza, S.T.; Tan, X.; Bray, B.C. Latent class analysis with distal outcomes: A flexible model-based approach. Struct. Equ. Model. 2013, 20, 1–26. [Google Scholar] [CrossRef]
  49. Vermunt, J.K.; Magidson, J. Latent GOLD 5.1; Statistical Innovations: Belmont, MA, USA, 2013. [Google Scholar]
  50. Hooijberg, R.; Quinn, R.E. Behavioral complexity and the development of effective managers. In Strategic Leadership: A Multiorganizational-Level Perspective; Phillips, R.L., Hunt, J.G., Eds.; Quorum Books/Greenwood Publishing Group: Westport, CT, USA, 1992. [Google Scholar]
  51. Hart, S.L.; Quinn, R.E. Roles executives play: CEOs, behavioral complexity, and firm performance. Hum. Relat. 1993, 46, 543–574. [Google Scholar] [CrossRef]
  52. Parker, R.; Bradley, L. Organizational culture in the public sector: Evidence from six organizations. Int. J. Public Sect. Manag. 2000, 13, 125–141. [Google Scholar] [CrossRef]
Figure 1. Competing Values Framework.
Joitmc 05 00017 g001
Figure 2. Path diagram of the model, specifying the relationship between latent class (profile) and external variables.
Joitmc 05 00017 g002
Table 1. Descriptive statistics of social enterprise sample (n = 100).
Characteristicsn (%)
Location
  large city56(57.7)
  middle city (>300,000)21(21.6)
  small city (>100,000–299,999)10(10.3)
  urban area10(10.3)
Company type
  job offer69(69.7)
  social service offer3(3.0)
  local community contribution7(7.1)
  combined5(5.1)
  others15(15.2)
Organization type
  corporation18(18.0)
  joint stock company61(61.0)
  nongovernmental organization5(5.0)
  social welfare corporation1(1.0)
  cooperative12(12.0)
  others3(3.0)
Type of business
  nursing/housework/childcare2(2.0)
  education/counseling/consulting12(12.2)
  environment4(4.1)
  culture/art/sports/leisure17(17.3)
  cleaning/security11(11.2)
  food8(8.2)
  construct5(5.1)
  manufacture23(23.5)
  others16(16.3)
Number of employees
  <527(27.6)
  5–1034(34.7)
  11–1512(12.2)
  16–2025(25.5)
Table 2. Fit statistics of six models for selecting the optimal number of latent profiles.
LLBICAICAIC3CAICNparEntropyClass. Err.
1-Cluster−1293.582624.0022603.1612611.1612632.002810
2-Cluster−1249.312540.0582516.6122525.6122549.05890.8530.019
3-Cluster−1222.432509.3372472.8642486.8642523.337140.8540.057
4-Cluster−1207.832503.1482453.652472.652522.148190.8860.055
5-Cluster−1202.262515.0412452.5172476.5172539.041240.8850.099
6-Cluster−1197.972529.4862453.9362482.9362558.486290.8800.113
Note: Npar and Class. Err represent several parameters and classification error, respectively. Bold values indicate the highest mean value within profiles.
Table 3. Relative profile sizes and the mean scores within each latent profile.
Profile 1Profile 2Profile 3Profile 4
Weak-BalancedStrong-BalancedHierarchy-DominantClan-Dominant
0.7470.1150.0970.042
(n = 74)(n = 12)(n = 10)(n = 4)
Clan25.60833.87715.56820.235
Rational25.91933.90817.68611.272
Development27.40233.75215.6369.519
Hierarchy22.56532.08721.7447.798
Note: Bold values indicate the highest mean value within the profiles.
Table 4. Multinomial regression presenting associations between latent profile membership and external variables (First model: economic performance).
TypeVariableScoresWeak-BalancedStrong-BalancedHierarchy-DominantClan-DominantWald
CovariateNetwork1–80.7700.0280.2020.00011.41 **
9–100.9240.0520.0230.001
11–130.9260.0630.0110.000
14–160.9060.0920.0020.000
17–210.8460.1540.0000.000
DistalEconomic5–200.7330.0740.1920.001636.79 **
OutcomePerformance21–260.9110.0750.0140.000
27–280.9050.0770.0190.000
29–300.9360.0600.0050.000
31–450.8920.1080.0010.000
Note: Bold values indicate the highest probability value within the profiles. ** p < 0.01 (two-tailed).
Table 5. Multinomial regression presenting associations between latent profile membership and external variables (Second model: social performance).
TypeVariableScoresWeak-BalancedStrong-BalancedHierarchy-DominantClan-DominantWald
CovariateNetwork1–80.7850.0260.1900.00011.41 **
9–100.9230.0510.0260.001
11–130.9340.0590.0070.000
14–160.9010.0970.0020.000
17–210.8280.1710.0000.000
DistalSocial6–290.7520.0510.1970.001852.50 **
OutcomePerformance30–330.9060.0790.0160.000
34–350.9160.0760.0080.000
36–380.9170.0700.0130.000
39–540.8750.1230.0020.000
Note: Bold values indicate the highest probability value within the profiles. **: p < 0.01 (two-tailed).

