Article

Operational Decision Model with Carbon Cap Allocation and Carbon Trading Price

College of Business Administration, Hongik University, Seoul 121-791, Korea
J. Open Innov. Technol. Mark. Complex. 2019, 5(1), 11; https://doi.org/10.3390/joitmc5010011
Submission received: 18 December 2018 / Revised: 18 February 2019 / Accepted: 18 February 2019 / Published: 20 February 2019
(This article belongs to the Special Issue Technology Driven Innovation, Research Management and Policy Making)

Abstract

:
This paper considers a carbon emission cap and trade market, where the carbon emission cap for each entity (either government or firm) is allocated first and then the carbon trading price is decided interdependently in the carbon trading market among the non-cooperative entities which make their production decision. We assume that there are n entities emitting carbon during the production process. After allocating the carbon (emission) cap for each participating entity in the carbon cap and trade market, each participant makes a production decision using the Newsvendor model given carbon trading price determined in the carbon trading market and trades some amount of its carbon emission, if its carbon emission is below or above its own carbon cap. Here, the carbon trading price depends on how carbon caps over the entities are allocated, since the carbon trading price is determined through the carbon (emission) trading market, which considers total amount of carbon emission being equal to total carbon caps over entities and some fraction of total carbon emission should be from each entity participating in the carbon cap and trade market. Thus, we can see the interdependency among the production decision, carbon cap and carbon trading price. We model this as a non-cooperative Stackelberg game in which carbon cap for each entity is allocated in the first stage and each entity’s production quantity is decided in the second stage considering the carbon trading price determined in the carbon trading market. First, we show the monotonic property of the carbon trading price and each entity’s production over the carbon cap allocation. In addition, we show that there exists an optimality condition for the carbon cap allocation. Using this optimality condition, we provide various results for carbon cap and trade market.

1. Introduction

Nowadays, entities, which might be either government or firm, actively make effort to reduce climate change due to global warming. The United Nations Intergovernmental Panel on Climate Change (IPCC) reported that the current global atmospheric concentration of greenhouse gases (GHG) is at the highest point in the Earth’s history and that the major cause of global warming is the accumulation of carbon dioxide generated by human activity [1]. International environmental treaty, such as the Kyoto Protocol in Japan in 1997 and the United Nations Conference on Environment and Development (UNCED) in Rio de Janeiro in 1992 were organized as a global effort to reduce greenhouse gas concentrations in the atmosphere [1]. Even though there were doubts regarding whether they would ultimately be adopted globally, they have definitely changed both public and private sectors’ attitudes and policies about reducing greenhouse gas concentrations and carbon emissions and the potential for trade of those reductions [2].
The basic idea of carbon emission control is theoretically simple to apply if the participants in the carbon emission control system reach an agreement. Thus, recently in the area of production and operations, many researchers have tried to integrate issues of the environmental sustainable methodology into the traditional research areas. As mentioned in [3], entities have increasing interests in managing the carbon emission control system as a part of their production and operations management. Thus, entities, especially in carbon emissions related businesses, have been enforced to address sustainability, especially for the reduction of carbon emission. This enforcement is triggered by the increasing concentration of carbon dioxide as the cause of global warming and climate change.
Carbon emission control is known as an effective method for reducing global warming and climate change. There are currently three types of carbon emission control [1]: (1) carbon tax; (2) carbon cap; and (3) carbon cap and trade. Carbon tax imposes a cost on the generation of carbon in the manufacturing and transportation entities. Carbon cap restricts the allowed amount of carbon emission during production and transportation process. Carbon (emission) cap and trade is defined as a policy for purchasing and selling carbon emission allowances. Since total carbon emission is generally limited, some participants with high level of emission-control technology can use the carbon cap and trade as an economic gain tool by selling their carbon permit. These profit taking participants can induce other participants to introduce the emission-control technology into their production and operation process and thus eventually reduce the carbon emission. In this study, a carbon (emission) cap and trade market (system) is called as a carbon emission control system, in which the carbon (emission) cap for each entity is allocated among the entities and then the carbon (trading) price is decided interdependently among the non-cooperative entities in the carbon trading market. Carbon cap and trade market (system) would improve welfare for all participating entities due to their differing marginal profits. In this study, there are multiple non-cooperative entities, each of which emits carbon dioxide during their production of product. After allocating each entity’s carbon cap, each entity’s production decision is made using the newsvendor model considering the carbon (trading) price determined in the carbon trading market. Here, the carbon (trading) price depends on total carbon caps allocated over entities since the carbon (trading) price is determined in the carbon trading market, which considers the total carbon emission equal to total carbon caps over entities and some fraction of total carbon emission is from each entity participating in the carbon cap and trade market. Thus, we can see the interdependency among the production decision, carbon cap and price. This non-cooperative game over the carbon emission among entities is modeled as a Stackelberg game in which carbon cap for each entity is decided in the first stage and then each entity’s production quantity are decided in the second stage considering the carbon price determined in the carbon trading market.
As mentioned above, each entity in this study makes a production decision under uncertain demand, carbon cap and carbon price through a newsvendor model, which is a simple but powerful method to address the production decision, and the carbon cap is allocated over entities and carbon price is interdependently determined among entities participated in the carbon cap and trade market. Moreover, as mentioned below in Section 2, the model in this study is the first one considering an uncertainty of demand, carbon emission trade and the entity’s production decisions simultaneously with interdependent decision on the carbon price and carbon cap.
The rest of this paper is organized as follows. Section 2 goes over a literature review related to this study. Section 3 describes the model for the non-cooperative decision model over entities as a Stackelberg game: (1) In the first stage, carbon cap is allocated over entities considering their decisions in the second stage. (2) In the second stage, entities make a production decision based on newsvendor model and interdependently decide carbon price considering the decision on the carbon cap in the first stage. Section 4 establishes some analytical results from the suggested model. Section 5 provides a numerical example. Section 6 concludes this paper.

2. Literature Review

2.1. Production and Operational Model

Most studies regarding the production or operations management model under the carbon emission consideration address the economic order quantity (EOQ) model and some studies address the newsvendor model.
Letmathe and Balakrishnan [4] presented both linear programming and mixed integer linear programming models for a entity to determine its optimal production planning subject to some environmental constraining condition. Hua et al. [5] derived the optimal order quantity using the Economic Ordering Quantity (EOQ) model and then examined the effects of carbon trading system on the operational decision, by assuming that carbon price and carbon cap are exogenously given. Chen et al. [6] addressed the EOQ model for entity’s operational decision with exogenous carbon cap, carbon tax, carbon offset and carbon reward to suggest a condition for the possible reduction of carbon emissions by modifying ordering planning. Caro et al. [7] modeled the multiple entities’ effort in a supply chain to abate their joint production of emissions and showed that the emissions over-allocated to each entity more than the total supply chain emissions necessarily induce the optimal emission-abatement efforts. Cachon [8] developed a simple density model for a retailer to help choose the operational decisions for covering a customers’ region and then concluded that improvement of fuel efficiency is better for the reduction of environmental externalities than taxing on a carbon emission. Granot et al. [9] formulated the greenhouse gas emission responsibility problem as a cooperative game and suggests a Shapley value rule. Du et al. [10] addressed the impact of carbon trading system on a supply chain using the newsvendor model with one emission-purchasing manufacturer and one emission permit-selling supplier. For their analysis, they assumed that carbon emission cap is imposed exogenously by the policy maker. Hovelaque and Bironneau [11] proposed an EOQ model for both exogenous and endogenous selling price under carbon tax system in which carbon tax is exogenously given by the policy maker. Kim et al. [12] introduced a stochastic dynamic programming model for the product pricing and inventory replenishment decision to maximize the entity’s profit assuming that the entity is risk averse and customers are loss averse. Lee et al. [13] considered a carbon emission cap and trade system in which the carbon cap and pricing decision is exogenously regulated to minimize total carbon emissions and multiple entities emitting the carbon during the production process use newsvendor model with quick response for their production planning. For each case of the carbon capacity, the carbon tax, and the cap and trade, Song and Leng [14] provided an optimal production decision and operational insights into the exogenous carbon cap and price. Rosič and Jammernegg [15] provided a newsvendor model taking the environmental impact of transport into account given the exogenous carbon cap and price, and showed that a carbon trading scheme is better performed than a carbon taxing scheme in transport. Under the carbon cap and trade for warehouse management and technology investment, Chen et al. [16] provided the trade-off thresholds between the economic and environmental objectives.

2.2. Carbon Cap and Trade

Cramton and Kerr [17] described how carbon trading permits should be auctioned and then suggested an auction instead of grandfathering for the domestic carbon caps for reducing global climate change. Böhringer and Lange [18] suggested emissions-based allocation rules, which update the basis of allocation over time and derive optimal structure for the carbon cap. Benjaafar et al. [19] presented a method for the operational management subject to the restricting situation for carbon emission. Hong et al. [20] developed a regression model for predicting the movement of carbon price. An and Lee [21] suggested methods for allocating the carbon emissions to each entity and then reduced total carbon emission using a newsvendor model among non-cooperative entities under a Stackelberg game scheme. They assumed that the carbon trading price and the carbon cap for each entity is exogenously given. Yun et al. [22] introduced conceptual model that can be applied to see the dynamic effects of open innovation, especially in the IT sector through a model-based analysis approach, and refered to user/customer/crowdsourcing/open-source innovation and collective intelligence as an open innovation, which is defined as one transferring knowledge, technology and resources across the boundaries among entities and new policies. Yun et al. [23] suggested a way to minimize the growth limitation of capitalism from Schumpeter’s view by combining various business models merged with various dynamic capabilities. From the concepts of Yun et al. [22] and Yun et al. [23], the introduction of carbon cap and trade in the production and operations management is an open innovation, since entities can transfer unused carbon cap to be utilized or vice versa among entities participating in the carbon cap and trade market, and also combine business models, which are carbon trading model and operational model (newsvendor model).
As shown in the literature review and Table 1, study on the production and operations management together with carbon emission trading system is noteworthy, and some studies provide quantitative models to address this issue. However, there are no models that comprehensively consider multiple issues in production and operation, especially such as endogenous decision on the carbon price and cap. Thus, to the best of our knowledge, no study is yet done for a model that considers the issues of uncertain demand, carbon trading system and the entity’s production decisions considering endogenous decision on the carbon price and cap. Thus, this model is fairly original, and we think that it will bridge the research gap in the production and operations decision model under the carbon cap and trade system.

3. Model

We consider n entities participated in the carbon cap and trade market. In the first stage, carbon cap is allocated over each entity in the carbon cap and trade market. Then, in the second stage, each entity makes decision on the production quantity considering the carbon price determined interdependently over the non-cooperative entities in the carbon cap trading market. This non-cooperative game between entities is modeled using a Stackelberg game:
  • In the second stage, each entity makes its own production decision considering the carbon cap allocated for each entity from the first stage. Moreover, the carbon price for purchasing and selling carbon permit are determined interdependently by the carbon supply and demand mechanism through the carbon market.
  • In the first stage, each entity’s carbon cap is allocated at the cost c w per unit carbon cap.
More details for entities’ decision are addressed in the backward direction in the following subsections.

3.1. The Second Stage

Given the carbon emission cap w i for entity i, under a carbon cap and trade market, entity i, which uses newsvendor model for its production decision, tries to maximize its profit as follows.
max q i 0 ( p i c i ) q i ( p i s i ) 0 q i F i ( x ) d x + c e w i e i q i
where q i is the quantity of production, p i is the selling price per product, c i is the production cost per product, s i is the salvage price per product, e i is the carbon emission rate, f ( · ) and F i ( · ) are the probability density function and cumulative distribution function for entity i’s demand and c e is a carbon trading price for all entities which is less than c w . For carbon market clearing, the trading of carbon emission among entities under a cap and trade market should lead to
i = i n e i q i w = 0
where w = i = 1 n w i is the sum of each entity’s carbon cap and q i is the optimal quantity of entity i’s production. Given the carbon emission cap w i for entity i decided in the first stage of Stackelberg Game, entity i’s optimality condition is as follows
  q i ( p i c i ) q i ( p i s i ) 0 q i F i ( x ) d x + c e w i e i q i = ( p i c i ) ( p i s i ) F i ( q i ) c e e i = 0
and
i = i n e i q i i = 1 n w i = 0
Given the carbon emission cap w i for entity i = 1 , , n , the equilibrium of production quantity q i for entity i and the carbon price c e are interdependently determined. Thus, the optimal quantity of production q i for entity i is a function of the equilibrium of carbon price c e and w = i = 1 n w i , and the equilibrium of carbon price c e is a function of the sum of the carbon emission cap w = i = 1 n w i .
Lemma 1.
The carbon price decreases and each entity’s production quantity increases, as total amount of carbon emission cap increases.
Proof. 
First, by differentiating Equations (1) and (2) with respect to c e and w, respectively, we have
c e ( p i c i ) ( p i s i ) F i ( q i ) c e e i = ( p i s i ) f i ( q i ) q i ( c e ) c e e i = 0 w i = i n e i q i i = 1 n w i = i = i n e i q i ( c e ) w 1 = i = i n e i q i ( c e ) c e c e ( w ) w 1 = 0
Thus, we have
c e ( w ) w = i = i n e i q i ( c e ) c e 1 = i = i n e i 2 ( p i s i ) f i ( q i ) 1
which should be strictly negative due to p i > s i . Thus, c e ( w ) decreases as w increases. Second, by differentiating Equation (1) with respect to w, we have
w ( p i c i ) ( p i s i ) F i ( q i ) c e e i = ( p i s i ) f i ( q i ) q i ( w ) w e i c e ( w ) w = 0
Then, we have
q i ( w ) w = e i c e ( w ) w ( p i s i ) f i ( q i ) = e i ( p i s i ) f i ( q i ) j = i n e j 2 ( p j s j ) f j ( q j )
which should be positive. q i ( w ) increases as w increases. Thus, the result holds. □
Lemma 1 is fairly intuitive since, as total sum of carbon caps from all entities increases, the entities’ demand for the carbon emission permit decreases and thus the carbon price in the carbon trading market tends to decrease. In addition, as the total sum of carbon caps increases, the feasible region for each entity’s production quantity increase and thus it can produce its own product as much as it can maximize its profit.
As seen in the following section, each entity’s cap w i can be purchased at the cost of c w per unit carbon emission cap. Thus, as c w decreases, the purchased carbon cap would increase and total amount of carbon emission would increase so that each entity can improve its profit objective through almost discretionary production and carbon trading market since the carbon price decreases. Thus, from Lemma 1, we can see the practical implication that the policy maker can control the overall carbon emission through properly pricing the cost per unit carbon emission cap.

3.2. The First Stage

In the first stage, the carbon cap needs to be allocated over each entity. There are two basic approaches to allocating initial carbon emission cap. It may be granted for free or sold so that surplus or deficit of carbon emission permit can be traded in the (secondary) carbon trading market [26]. Thus, in this paper, carbon emission cap is assumed to be purchased at the cost of c w per unit carbon emission cap. To balance the supply and demand of carbon emission among entities in the carbon trading market, the set of caps ( w 1 , w 2 , , w n ) for each entity is allocated by making each entity purchase the carbon cap. Thus, each entity will make the carbon cap purchasing decision by solving its own problem given by
max w i 0 ( p i c i ) q i ( w ) ( p i s i ) 0 q i ( w ) F i ( x ) d x + c e ( w ) w i e i q i ( w ) c w w i
where q i ( w ) and c e ( w ) are entity i’s optimal production quantity and carbon price, respectively, in the second stage when the sum of each entity’s carbon cap is w = i = 1 n w i , and c w is allocation cost per unit carbon cap. In addition, c w is the unit cost per unit carbon emission enforced by the regulator if there is no carbon trading market. As mentioned, w is equal to total amount of carbon emission, which should be equal to i = i n e i q i ( w ) . Simply, we can verify that the carbon cap and trade market system would improve welfare for all participating entities the most compared with other carbon emission controlling systems, as shown in following Lemma.
Lemma 2.
Among three types of carbon emission control, which are carbon tax, carbon cap, and carbon cap and trade, the carbon cap and trade improves all participating entities’ profit more than the other types of carbon control.
Proof. 
For the carbon tax, the objective function is given by
( p i c i ) q i ( w ) ( p i s i ) 0 q i ( w ) F i ( x ) d x c w e i q i ( w )
which is less than the objective function for carbon cap and trade given by
( p i c i ) q i ( w ) ( p i s i ) 0 q i ( w ) F i ( x ) d x + c e ( w ) w i e i q i ( w ) c w w i
due to c e ( w ) c w . The optimization problem for the carbon cap is given by
max w i 0 , e i q i ( w ) w i 0 ( p i c i ) q i ( w ) ( p i s i ) 0 q i ( w ) F i ( x ) d x c w w i
which is less than Equation (4) due to the compelling cap constraint e i q i ( w ) w i 0 . Thus, the result holds. □
Now, we need to characterize the optimal set of allocated carbon (emission) caps.
Lemma 3.
The optimal set of each entity’s carbon (emission) cap in the carbon cap and trade market is the one satisfying the system of equations
1 e i ( p i c i ) ( p i s i ) F i q i i = 1 n w i c w e i + c e i = 1 n w i w w i e i q i i = 1 n w i = 0
for all i = 1 , 2 , n and
i = 1 n w i = i = i n e i q i i = 1 n w i
which is for the carbon market clearing.
Proof. 
The first order derivative of the objective function in Equation (4) with respect to w i for each entity i should be equal to zero at w = i = 1 n w i as follows,
  w i ( p i c i ) q i ( w ) ( p i s i ) 0 q i ( w ) F i ( x ) d x + c e ( w ) w i e i q i ( w ) c w w i = ( p i c i ) q i ( w ) w i ( p i s i ) q i ( w ) w i F i ( q i ( w ) ) + c e ( w i ) w i w i e i q i ( w ) + c e ( w ) 1 e i q i ( w ) w i c w = ( p i c i ) q i ( w ) w ( p i s i ) q i ( w ) w F i ( q i ( w ) ) + c e ( w ) w w i e i q i ( w ) + c e ( w ) 1 e i q i ( w ) w c w = 0
where q i ( w ) w i = q i ( w ) w w w i = q i ( w ) w w i j = 1 n w j = q i ( w ) w and c e ( w ) w i = c e ( w ) w w w i = c e ( w ) w w i j = 1 n w j = c e ( w ) w . Moreover, using the optimality condition in Equation (1) in the second stage and the fact that q i ( w ) is the optimal production quantity when the sum of the carbon caps among entities is w,
0 = ( p i c i ) q i ( w ) w ( p i s i ) q i ( w ) w F i ( q i ( w ) ) + c e ( w ) w w i e i q i ( w ) + c e ( w ) 1 e i q i ( w ) w c w   = q i ( w ) w ( p i c i ) ( p i s i ) F i ( q i ( w ) ) c e ( w ) e i + c e ( w ) + c e ( w ) w w i e i q i ( w ) c w   = q i ( w ) w × 0 + c e ( w ) + c e ( w ) w w i e i q i ( w ) c w   = 1 e i ( p i c i ) ( p i s i ) F i ( q i ( w ) ) c w e i + c e ( w ) w w i e i q i ( w )
Thus, the result holds with the carbon market balancing condition
i = 1 n w i = i = i n e i q i i = 1 n w i
Lemma 3 gives us how the carbon emission cap for each entity can be optimally allocated. Using the result of Lemma 3, we can expect each entity’s operational behavior and decisions with the carbon cap and trade as follows
  • Each entity would purchase/sell the carbon permit with the carbon cap and trade comparing the operational decision without the carbon cap and trade.
  • Each entity would emit more/less carbon than without the carbon cap and trade.
  • Each entity’s cap can be higher/lower with the carbon cap and trade than its carbon emission without the carbon cap and trade.
These operational behaviors and decisions for each entity are addressed in the next section.

4. Analytical Results

In this section, we provides some analytical results for each entity’s operational behavior and decisions with the carbon cap and trade. First, we suggest a simple rule for each entity by which it will recognize when it purchases or sells the carbon permit in the carbon cap and trade market.
Proposition 1.
Suppose that q i N C is entity i’s optimal production quantity when there is no carbon cap and trade market and ( w 1 N , w 2 N , , w n N ) is the optimal set of carbon emission cap for each entity when there is carbon cap and trade market. If entity i produces more product with the carbon trading market than without the carbon cap and trade market, then entity i with the carbon cap and trade market should purchase the carbon emission permit. Otherwise, entity i with the carbon trading market could sell the carbon emission permit.
Proof. 
Suppose that there is no carbon cap and trade market. Then, entity i’s optimality condition is as follows
( p i c i ) ( p i s i ) F i ( q i N C ) c w e i = 0
Thus, if entity i produces more product with the carbon cap and trade market than without the carbon cap and trade market, which means that q i ( w N ) > q i N C where w N = i = 1 n w i N , then the first order derivative of entity i’s objective function is negative as follows
( p i c i ) ( p i s i ) F i ( q i ( w N ) ) c w e i 0
Therefore, in Lemma 3
c e ( w N ) w w i N e i q i ( w N ) = 1 e i ( p i c i ) ( p i s i ) F i ( q i ( w N ) ) c w e i
Furthermore, due to c e ( w N ) w < 0 from the proof in Lemma 1 and e i 0 ,
w i N e i q i ( w N ) < 0
Thus, entity i under the carbon cap and trade market should purchase the carbon emission permit. Using the same procedure, when q i ( w N ) < q i N C , entity i under the carbon cap and trade market could sell the carbon emission permit. The result holds. □
Since every entity’s operational parameters, which are p i , c s , s i and F i , are different, their marginal profits should also be different. Thus, if some entity’s marginal profit is less than marginal cap procuring cost c w e i due to producing more product with carbon cap and trade market than without carbon cap and trade market, it can make up the marginal profit by purchasing the carbon permit in the carbon trading market. In addition, if an entity’s marginal profit is larger than marginal cap procuring cost c w e i due to producing less product with carbon cap and trade market than without carbon cap and trade market, it can make up the marginal profit by selling the carbon permit in the carbon trading market. Thus, Proposition 1 shows that the existence of the carbon cap and trade market gives each entity chance to make more profit by exchanging their surplus and deficit of carbon permit among them through carbon trading market.
Proposition 2.
Suppose that q i N C is the entity i’s optimal production quantity when there is no carbon cap and trade market, which is given by
( p i c i ) ( p i s i ) F i ( q i N C ) c w e i = 0 f o r i = 1 , n
Then,
1.
The total amount of carbon emission with the carbon cap and trade market is less than without carbon cap and trade market, if
i = 1 n 1 e i ( p i c i ) ( p i s i ) F i q i ( i = 1 n e i q i N C ) c w e i 0
2.
Otherwise, the total amount of carbon emission with the carbon cap and trade market is larger than without carbon cap and trade market.
Proof. 
Let w N = i = 1 n w i N . From Lemma 3, we have
0 = i = 1 n 1 e i ( p i c i ) ( p i s i ) F i ( q i ( w N ) ) c w e i + c e ( w N ) w w i N e i q i ( w N )   = i = 1 n 1 e i ( p i c i ) ( p i s i ) F i ( q i ( w N ) ) c w e i + i = 1 N c e ( w N ) w w i N e i q i ( w N )   = i = 1 n 1 e i ( p i c i ) ( p i s i ) F i ( q i ( w N ) ) c w e i + c e ( w N ) w i = 1 n w i N i = 1 n e i q i ( w N )   = i = 1 n 1 e i ( p i c i ) ( p i s i ) F i ( q i ( w N ) ) c w e i
Thus, we have
i = 1 n 1 e i ( p i c i ) ( p i s i ) F i ( q i ( w N ) ) c w e i = 0
However,
i = 1 n 1 e i ( p i c i ) ( p i s i ) F i ( q i ( w ) ) c w e i
is a decreasing function in w since
w 1 e i ( p i c i ) ( p i s i ) F i ( q i ( w ) ) c w e i = p i c i e i f i ( q i ( w ) ) q i ( w ) w 0 i { 1 , 2 , , n }
where q i ( w ) w 0 from Lemma 1 and p i c i 0 . Thus, if
i = 1 n 1 e i ( p i c i ) ( p i s i ) F i q i ( i = 1 N e i q i N C ) c w e i 0
then w N = i = 1 n e i q i N i = 1 N e i q i N C , which implies that total amount of carbon emission with the carbon cap and trade market is less than without carbon cap and trade market. Otherwise, w N = i = 1 n e i q i N i = 1 n e i q i N C , which implies that total amount of carbon emission with the carbon cap and trade market is larger than without carbon cap and trade market. Thus, the result holds. □
Proposition 2 shows that, if, at the sum of the carbon emission cap i = 1 n e i q i N C , which is the optimal carbon emission without the carbon cap and trade market system, the marginal profit summed from entities whose marginal profit is positive is larger than the others, then total amount of carbon emission is higher under carbon and trade market than under no carbon cap and trade market system. This result implies that, if the sum of all entities’ profit margin is positive when total carbon cap is equal to the sum of the carbon emission without carbon cap and trade market, then the entities participating in the carbon cap and trade market could make more profit through carbon trading system. Otherwise, the entities participating in the carbon cap and trade market could make more profit through emitting less carbon.
Proposition 3.
Suppose that the carbon cap and trade market is open and the carbon trading price is determined to be less than c w . Then, there does not exist the set of carbon cap ( w 1 , , w n ) at which the amount of carbon emission traded in the carbon cap and trade market becomes zero.
Proof. 
By contradiction, suppose that there exists the set of cap cap ( w 1 , , w n ) at which the amount of carbon emission traded in the carbon cap and trade market becomes zero. This implies that w i e i q i i = 1 n w i = 0 for all i = 1 , 2 , , n . Then, Equation (5) from Lemma 3 should be written as follows
1 e i ( p i c i ) ( p i s i ) F i ( q i ( w ) ) c w e i = 0 for all i = 1 , 2 , n
where w = i = 1 n w i . Thus, we have
w i = e i q i ( w ) = e i F i 1 p i c i c w e i p i s i for all i = 1 , 2 , n
However, the sum of carbon caps among entities in the cap and trade market should be equal to the total amount of carbon emission from all the entities, which is
i = i n e i q i i = 1 n w i = 0
and from Equation (1)
q = F i 1 p i c i c e e i p i s i
Thus, the following equation should hold.
0 = i = i n e i q i i = 1 n w i = i = i n e i F i 1 p i c i c e e i p i s i i = 1 n e i F i 1 p i c i c w e i p i s i   = i = i n e i F i 1 p i c i c e e i p i s i F i 1 p i c i c w e i p i s i
Thus, since F i 1 p i c i c e e i p i s i F i 1 p i c i c e e i p i s i for all i { 1 , 2 , , n } due to c e < c w , the only case for the equation to hold is when F i 1 p i c i c e e i p i s i = F i 1 p i c i c w e i p i s i . However, the only case for this being true is that c e = c w or e i = 0 for all i = 1 , 2 , , n . However, e i for all i = 1 , 2 , , n cannot be zero and thus c e should be equal to c w , which implies that the carbon cap and trade market is not open. Thus, the result should hold. □
Proposition 3 indicates that in the carbon cap and trade market there is no a carbon cap at which the traded amount of carbon emission becomes zero if the carbon cap and price are determined interdependently. This is a quite different but intuitively acceptable result from the case in which carbon cap and price are determined exogenously. As shown in [13], if the carbon price is not determined interdependently by market participants but exogenously by the policy maker, there exists a carbon cap for each entity at which the traded amount of carbon emission becomes zero, which implies that the carbon trading market is not active.
Lemma 4.
Suppose that w N = i = 1 n e i q i N where q i N is the optimal production quantity under the carbon cap and trade market. Entity i’s carbon cap under the carbon cap and trade market is allocated to be higher than entity i’s amount of carbon emission without the carbon cap and trade market if and only if
1 e i ( p i c i ) ( p i s i ) F i ( q i ( w N ) ) i = i n e i 1 e i ( p i s i ) f i ( q i ) 1 e i ( p i c i ) ( p i s i ) F i q i ( i = 1 n e i q i N C ) q i N C q i ( w N ) 1 e i ( p i c i ) f i ( q ) d q e i q i ( w N ) e i q i N C
Proof. 
From Lemma 3, we have
1 e i ( p i c i ) ( p i s i ) F i ( q i ( w N ) ) c w e i + c e ( w N ) w w i N e i q i ( w N ) = 0
This can be written as follows
w i N e i q i ( w N ) = 1 e i ( p i c i ) ( p i s i ) F i ( q i ( w N ) ) c w e i c e ( w N ) w   = 1 e i ( p i c i ) ( p i s i ) F i ( q i ( w N ) ) c w e i i = i n e i 2 ( p i s i ) f i ( q i )   = 1 e i ( p i c i ) ( p i s i ) F i ( q i ( w N ) ) c w e i i = i n e i 1 e i ( p i s i ) f i ( q i )
where c e ( w N ) w = i = i n e i 2 ( p i s i ) f i ( q i ) , and
  1 e i ( p i c i ) ( p i s i ) F i ( q i ( w N ) c w e i = 1 e i ( p i c i ) ( p i s i ) F i ( q i ( w N ) c w e i 1 e i ( p i c i ) ( p i s i ) F i ( q i N C ) c w e i = q i N C q i ( w N ) q 1 e i ( p i c i ) ( p i s i ) F i ( q ) c w e i d q = q i N C q i ( w N ) 1 e i ( p i c i ) f i ( q ) d q = ( e i q i ( w N ) e i q i N C ) q i N C q i ( w N ) 1 e i ( p i c i ) f i ( q ) d q e i q i ( w N ) e i q i N C
Thus,
e i q i N C e i q i ( w N ) = 1 e i ( p i c i ) ( p i s i ) F i q i ( i = 1 n e i q i N C ) c w e i q i N C q i ( w N ) 1 e i ( p i c i ) f i ( q ) d q e i q i ( w N ) e i q i N C
Now, by comparing Equations (6) and (7), w i N e i q I N C if and only if w i N e i q i ( w N ) e i q i N C e i q i ( w N ) . Thus, the result holds. □
Lee et al. [13] showed that, when each entity participates in the carbon cap and trade market and the carbon price c e is not determined interdependently in the system but regulated exogenously by the policy maker, each entity reduces carbon emissions through the reduced production for any condition. However, Lemma 4 shows that, if the carbon price is determined interdependently in the carbon cap and trade market considering each entity’s decision, the comparative amount between each entity’s carbon cap with the carbon cap and trade market and each entity’s carbon emission without carbon cap and trade market depends on the entity’s profit.

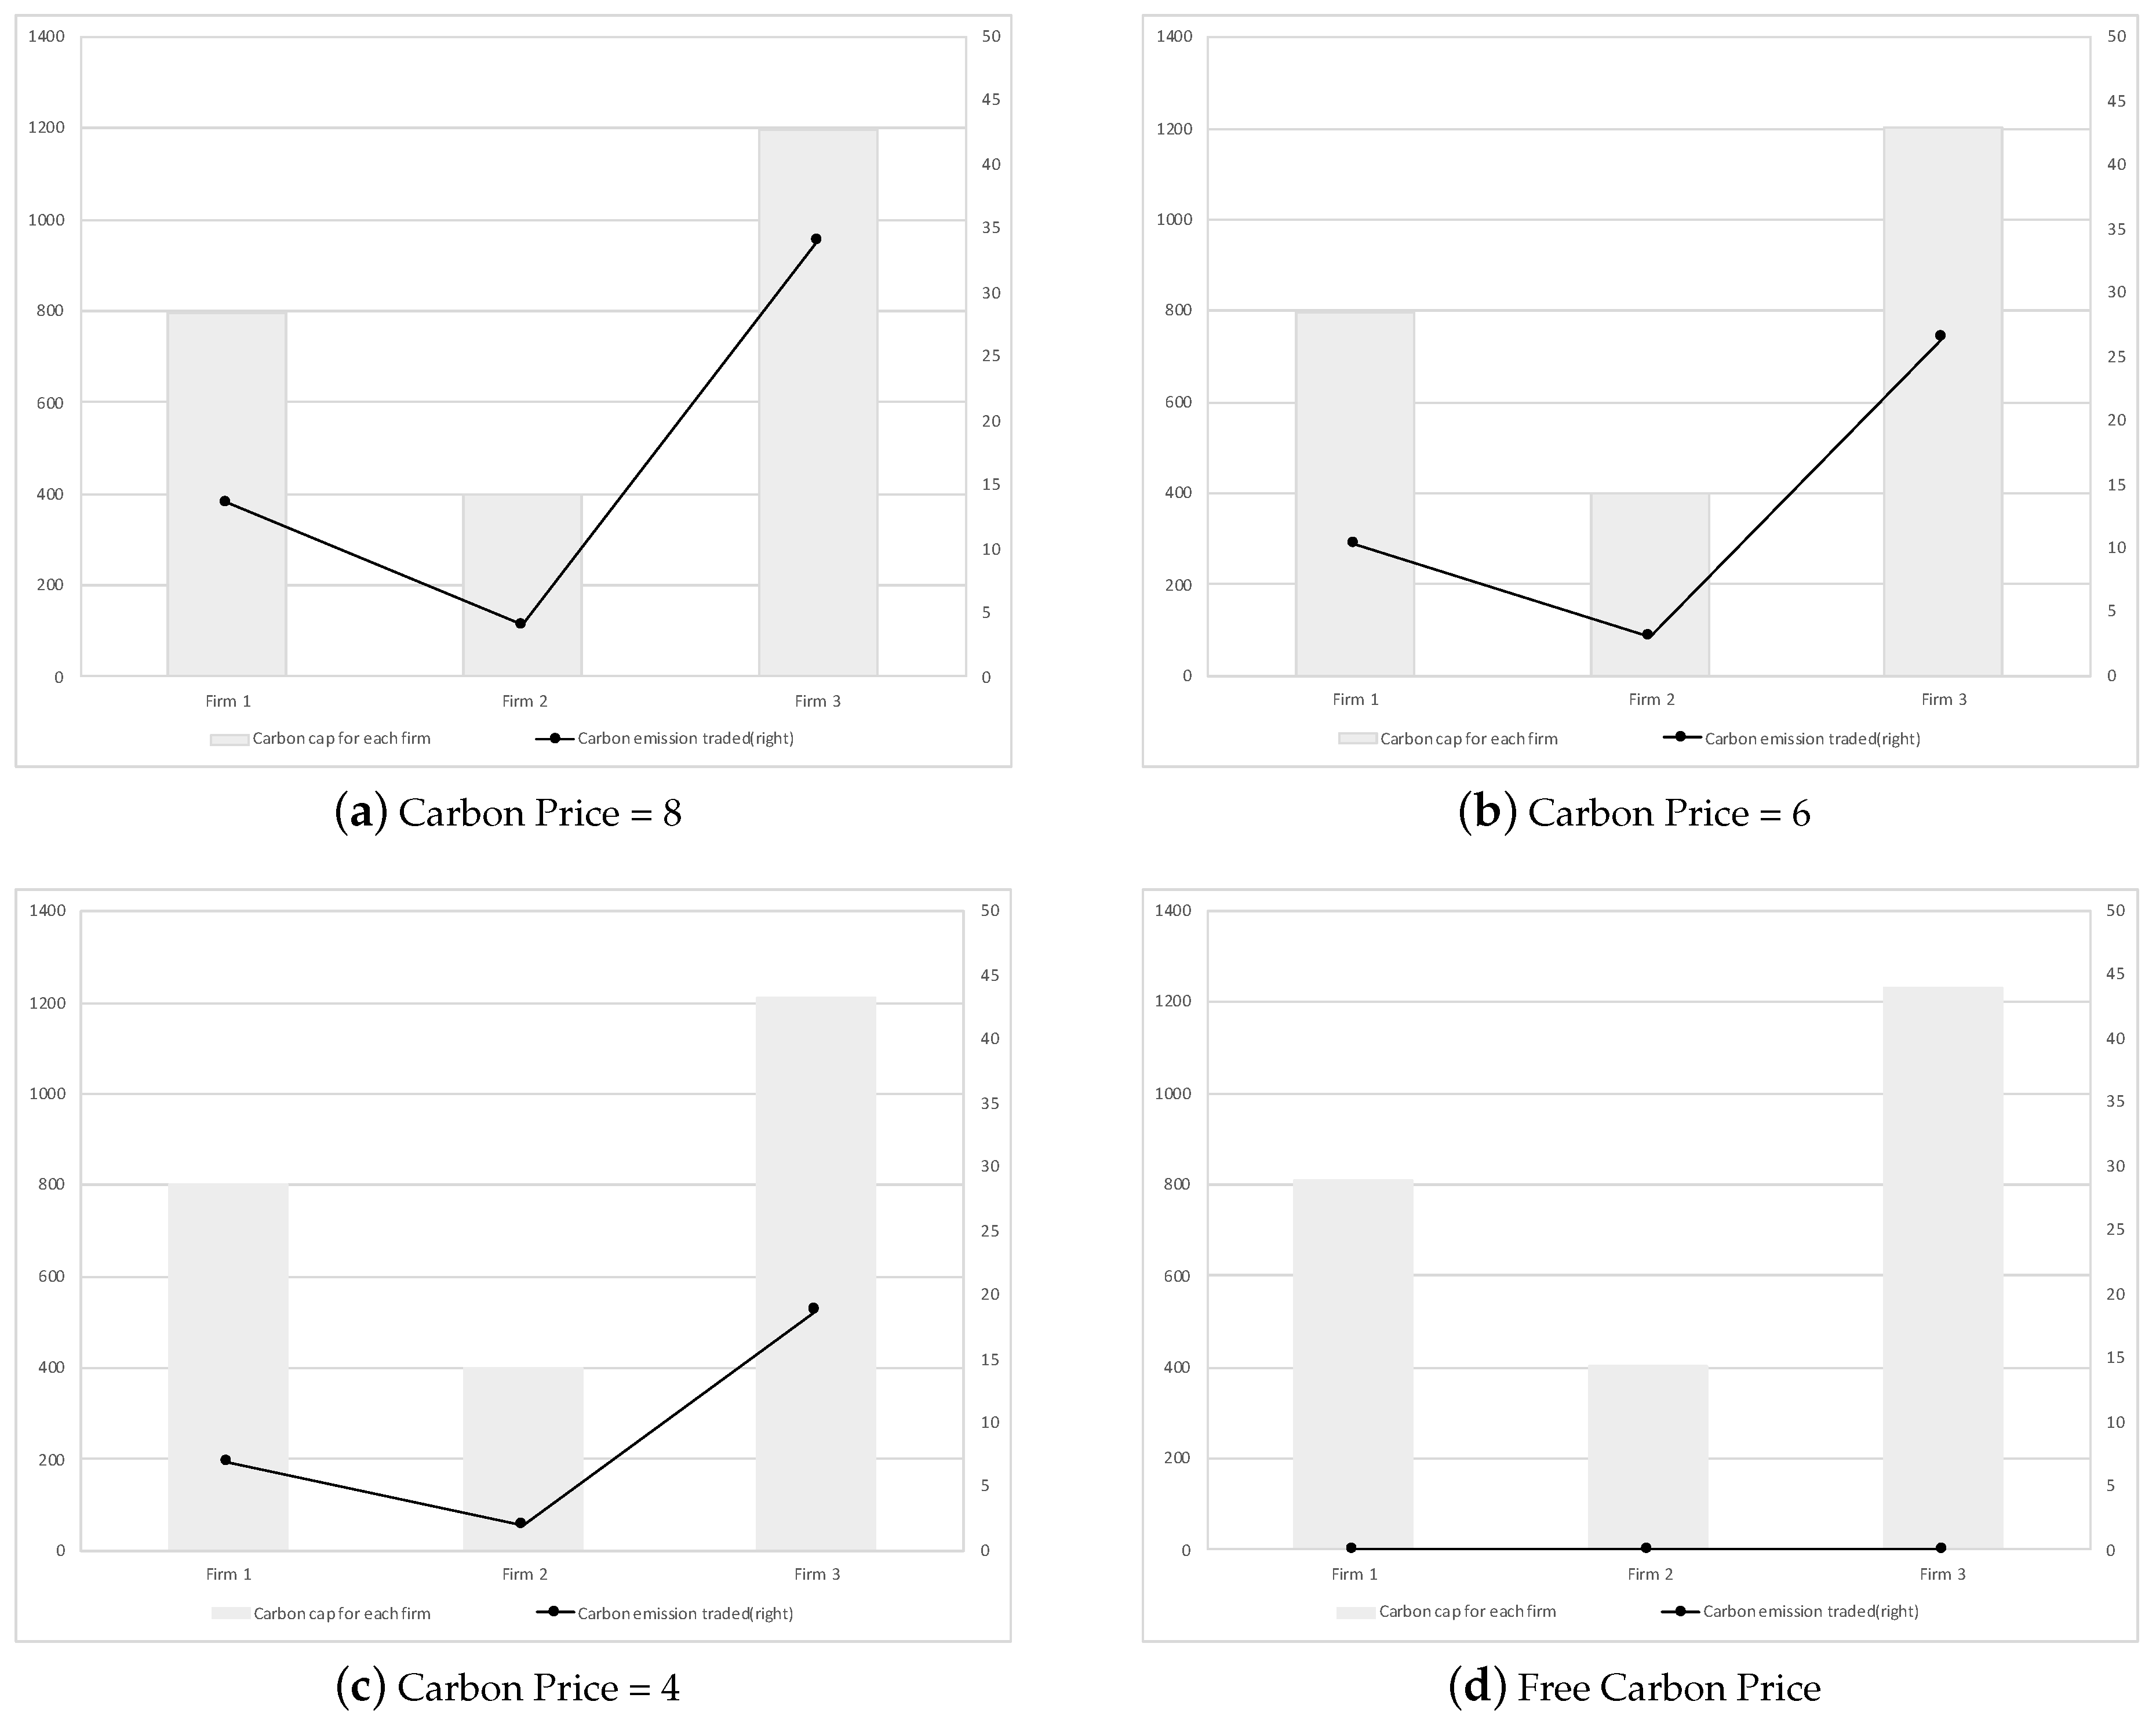
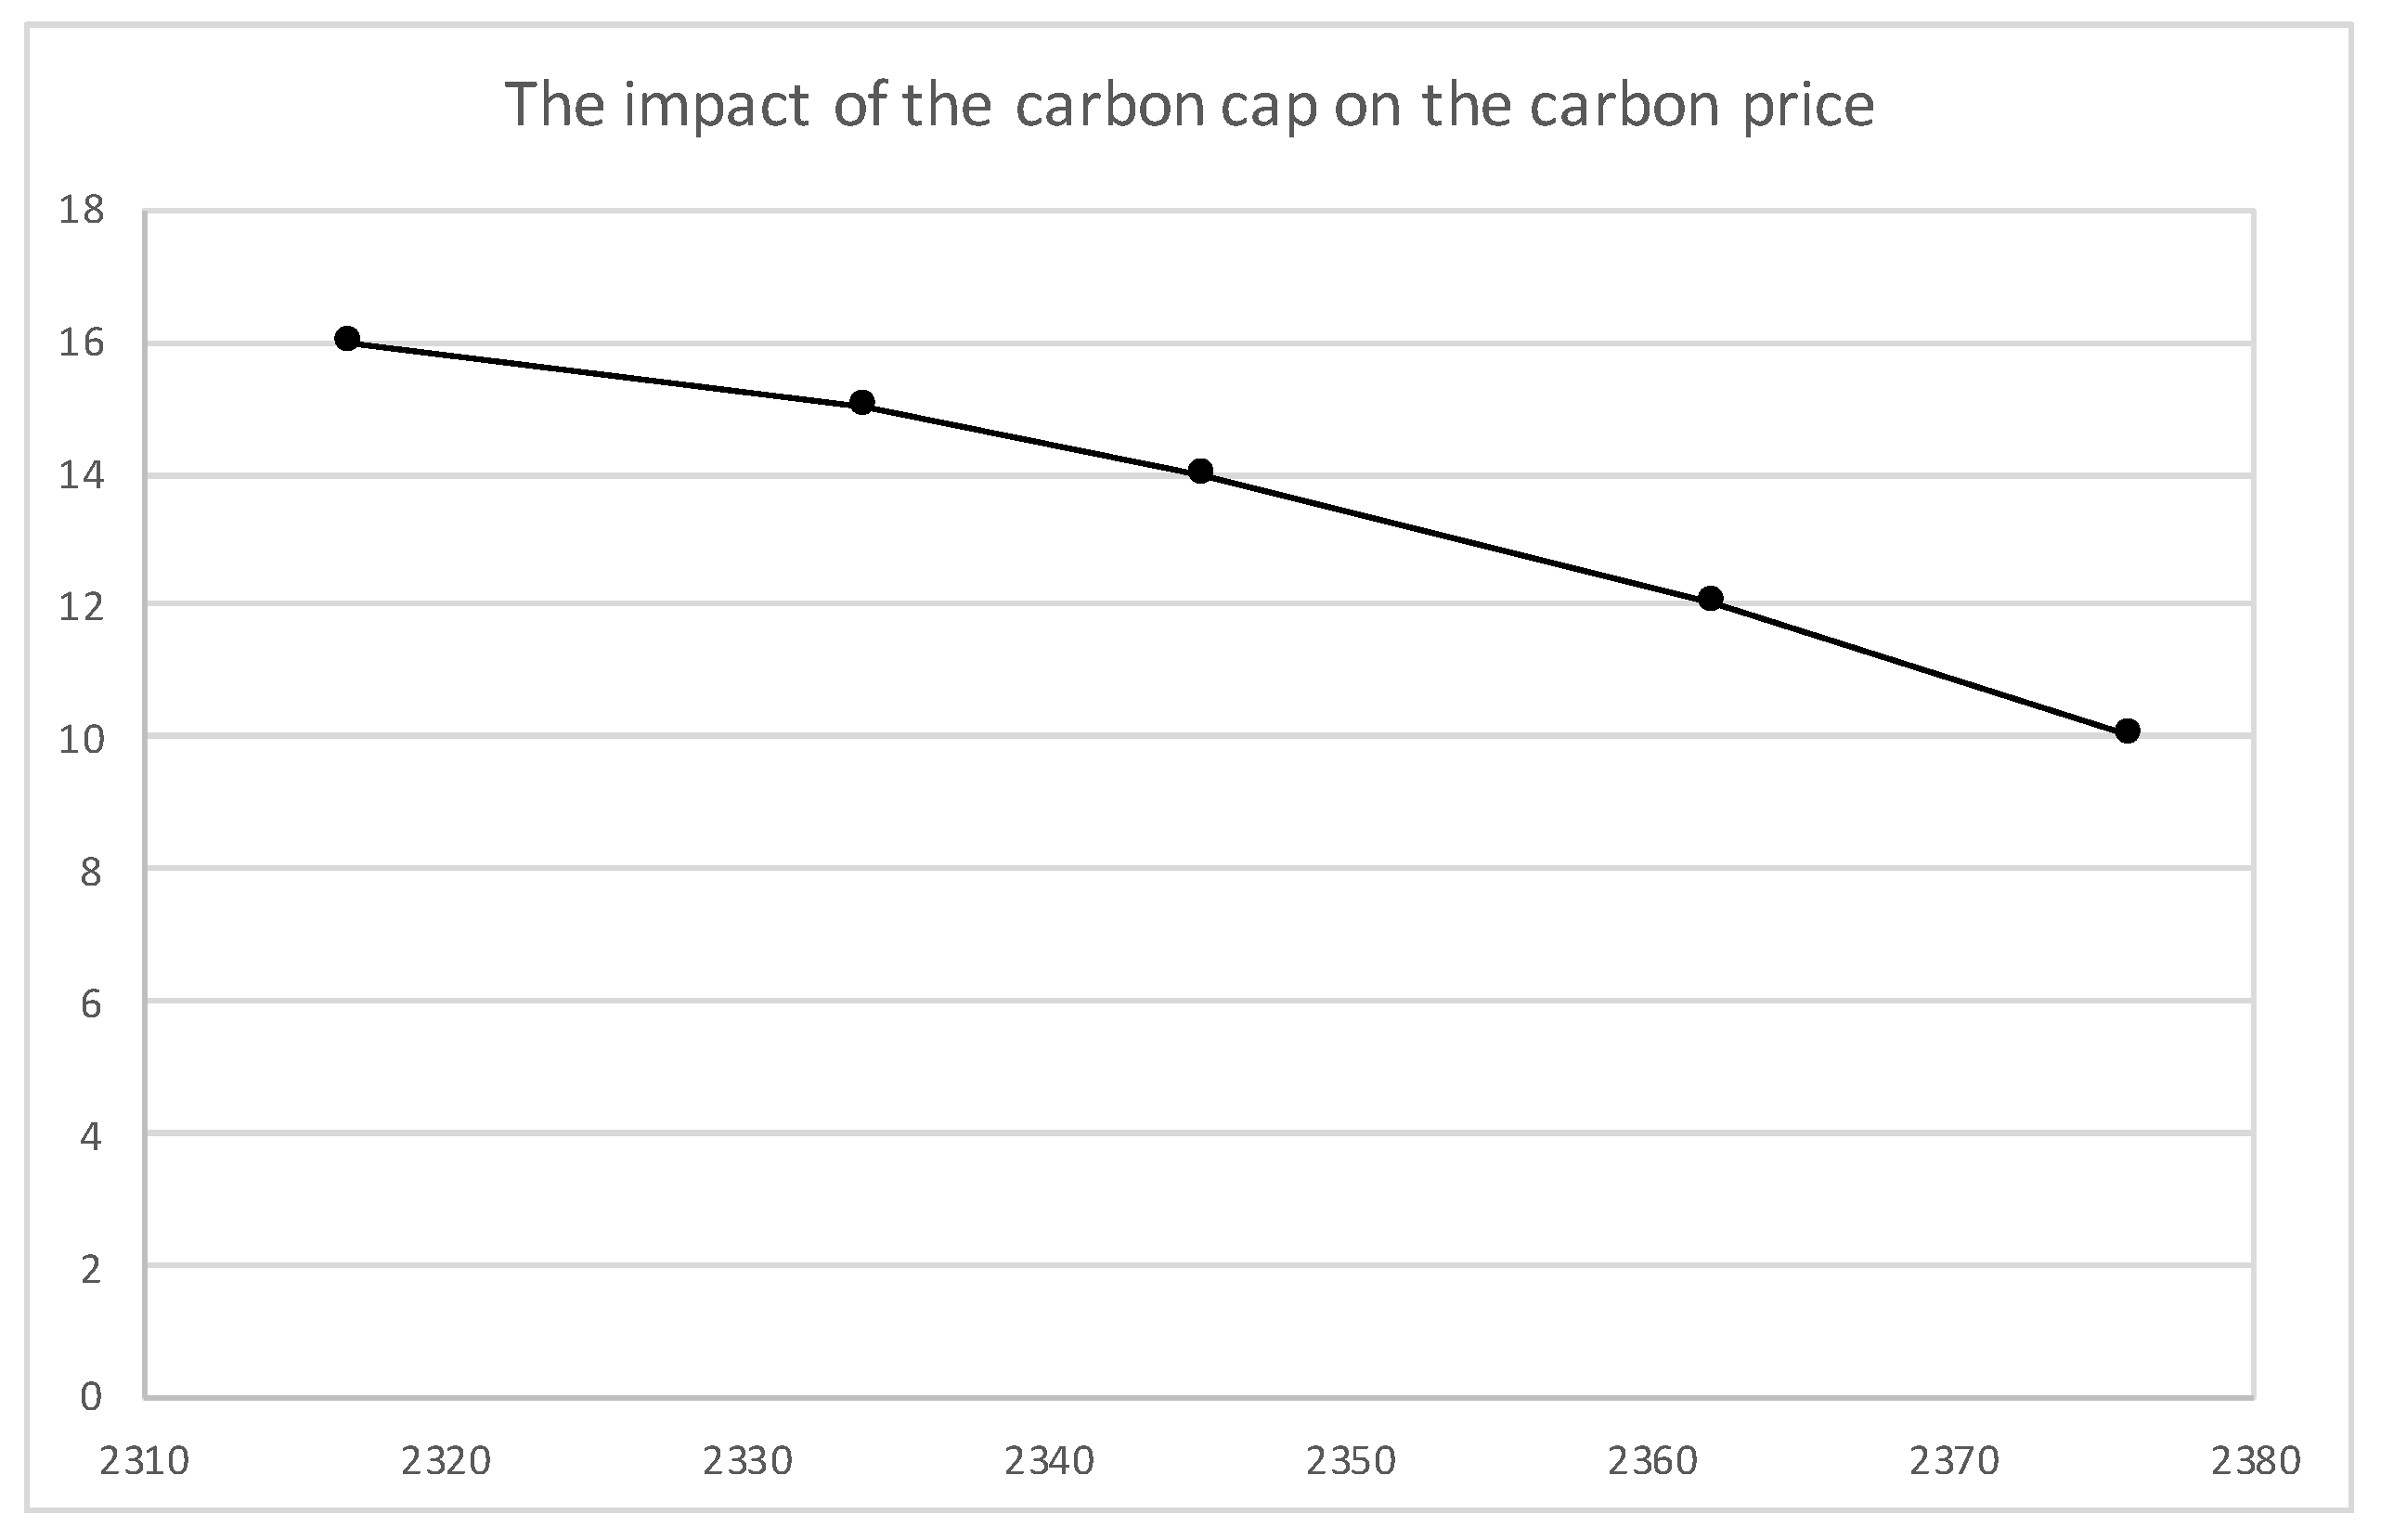
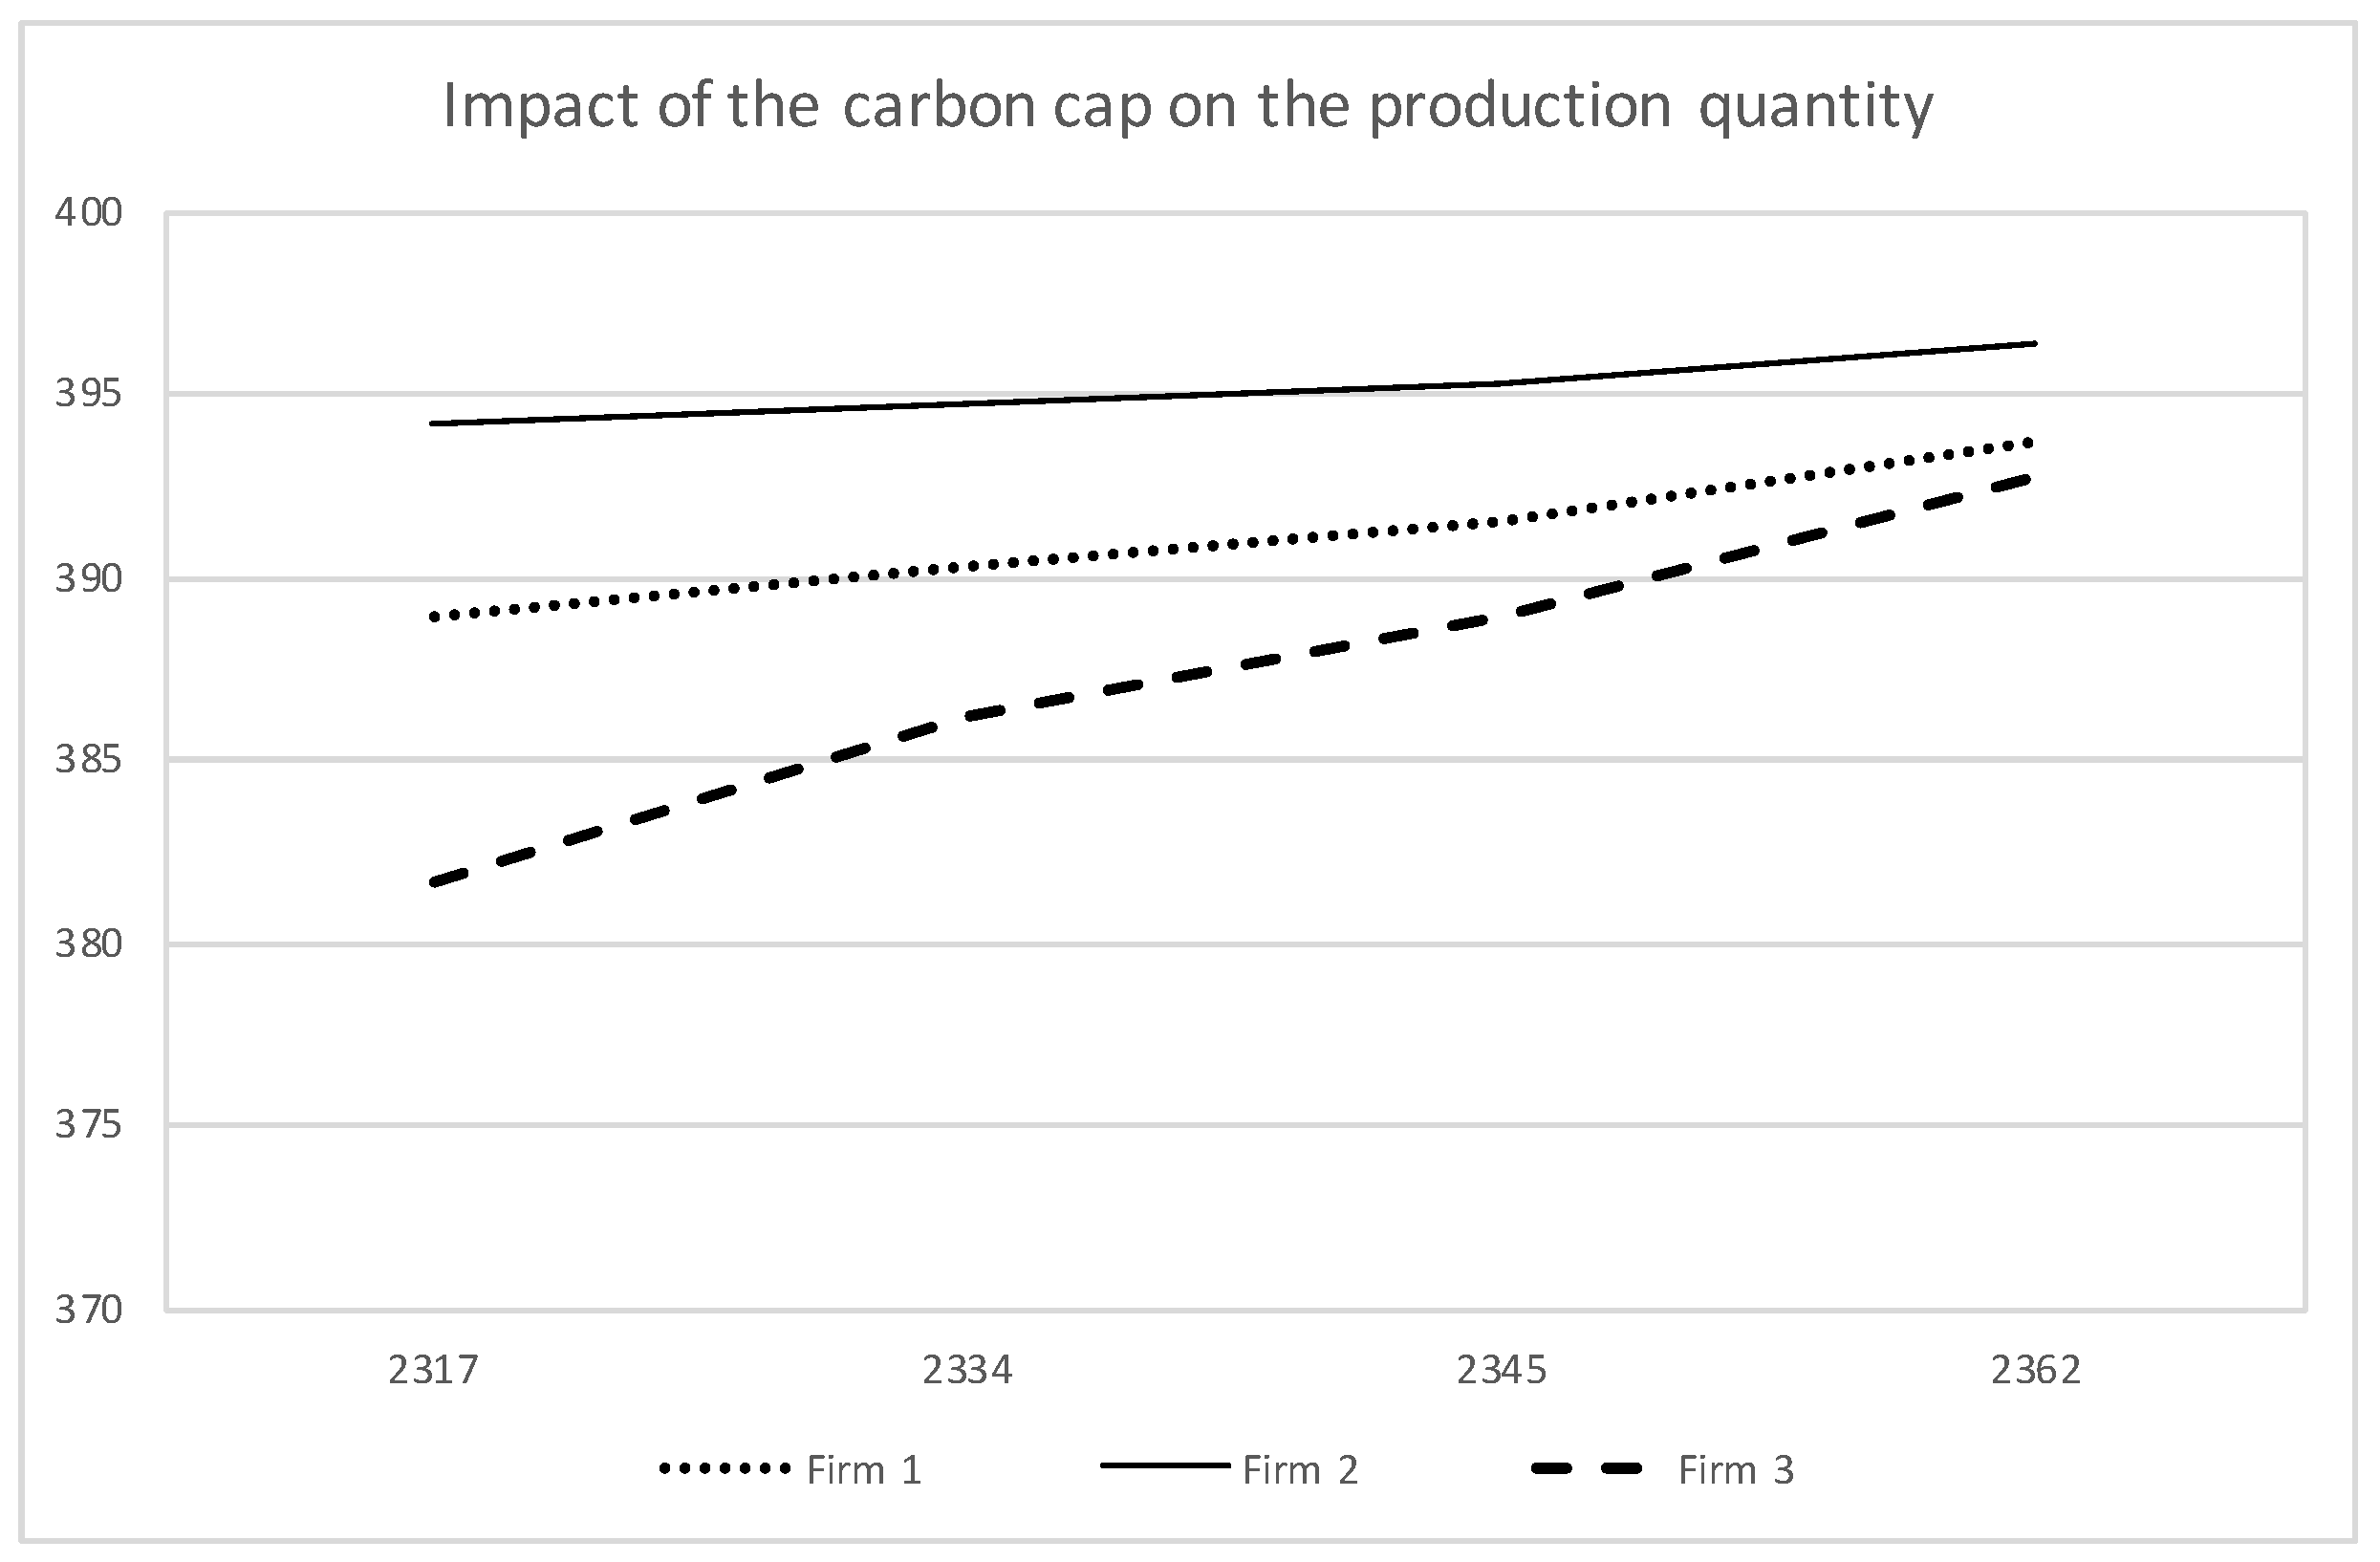
5. Numerical Example

In this section, we provide a simple numerical example with three entities to show how our model actually works and how the endogenous variables change. The entities’ parameters are shown in Table 2 and entity i’s probability for demand is assumed to be normally distributed with mean 400 and standard deviation 10.
In Figure 1, we can see that the carbon credit price decreases as total amount of carbon emission cap under the cap and trade market increases.
In Figure 2, we can see that each entity’s production quantity increases as total amount of carbon emission cap under the cap and trade market increases.
In Figure 3, as the carbon price decreases, the amount of carbon emission traded in the carbon cap and trade market decreases. From this numerical example, we can see that there exists the set of cap at which the amount of carbon emission traded in the carbon cap and trade market becomes zero only when the carbon price is free.

6. Conclusions

In this paper, we consider a model for non-cooperative game among entities as a Stackelberg game as follows:
  • In the first stage, each entity’s carbon cap is allocated by considering its profit objective together with its production decisions and the interdependently determined carbon price.
  • In the second stage, each entity makes its own production decision with the carbon cap decided in the first stage and the carbon trading price are determined interdependently by the carbon supply and demand mechanism through the carbon market.
Each entity’s objective function for its production decision is made using the newsvendor model. First, we provide an optimal set of the allocated carbon caps among non-cooperative entities. Second, we find the monotonic properties for the carbon price and production decision with respect to carbon cap. The property implies that the carbon price in the carbon trading market decreases and each entity’s production quantity increases, as total carbon emission cap allocated over entities increases. This implies that, as total amount of entities’ carbon emission allowance permitted by the carbon cap increases, the entities’ demand for the carbon emission permit decrease and thus the carbon price in the carbon trading market tends to decrease. Third, we show that, if the marginal profit summed over entities having positive marginal profit is larger than the one summed over the others, then the total amount of carbon emission is higher with carbon cap and trade market than without carbon cap and trade market. This implies that, when the unit profit margin summed over all entities is positive, entities participating in the carbon cap and trade market have room for squeezing out more profit through emitting more carbon through carbon trading market. Fourth, we show that, in the carbon cap and trade market, there does not exist a set of carbon caps at which the traded amount of carbon emission in the carbon trading market becomes zero if the carbon price is determined interdependently among entities in the cap and trade market. This is an intuitive result but different from the case in which carbon cap and price are exogenously given by the policy regulator. Finally, we show that, if the carbon price is interdependently determined among the entities in the carbon cap and trade market, the comparative amount between each entity’s carbon cap with carbon cap and trade market and the carbon emission without carbon cap and trade market depends on the entity’s profit. This is also quite a different result from the case where carbon cap and price are determined exogenously.
In this study, we consider a risk-neutral entity over the final wealth and take the carbon cap as given. However, for the future direction of the study, it is possible to study an entity with a different behavior over its final profit or the carbon cap such as risk-aversion or risk-loving.

Funding

Jinpyo Lee’s work was supported by 2019 Hongik University Research Fund.

Acknowledgments

The author thanks the anonymous reviewers for their insightful comments and constructive suggestions.

Conflicts of Interest

The author declares that there is no conflict of interests regarding the publication of this paper.

References

  1. Tsao, Y.C.; Lee, P.L.; Chen, C.H.; Liao, Z.W. Sustainable newsvendor models under trade credit. J. Clean. Prod. 2017, 141, 1478–1491. [Google Scholar] [CrossRef]
  2. Gottlieb, J.W. International emissions trading. Strateg. Plan. Energy Environ. 2001, 20, 15–25. [Google Scholar] [CrossRef]
  3. Walker, H.; Seuring, S.; Sarkis, J.; Klassen, R. Sustainable operations management: Recent trends and future directions. Int. J. Oper. Prod. Manag. 2014, 34. [Google Scholar] [CrossRef]
  4. Letmathe, P.; Balakrishnan, N. Environmental considerations on the optimal product mix. Eur. J. Oper. Res. 2005, 167, 398–412. [Google Scholar] [CrossRef]
  5. Hua, G.; Cheng, T.; Wang, S. Managing carbon footprints in inventory management. Int. J. Prod. Econ. 2011, 132, 178–185. [Google Scholar] [CrossRef]
  6. Chen, X.; Benjaafar, S.; Elomri, A. The carbon-constrained EOQ. Oper. Res. Lett. 2013, 41, 172–179. [Google Scholar] [CrossRef]
  7. Caro, F.; Corbett, C.J.; Tan, T.; Zuidwijk, R. Double counting in supply chain carbon footprinting. Manuf. Serv. Oper. Manag. 2013, 15, 545–558. [Google Scholar] [CrossRef]
  8. Cachon, G.P. Retail store density and the cost of greenhouse gas emissions. Manag. Sci. 2014, 60, 1907–1925. [Google Scholar] [CrossRef]
  9. Granot, D.; Granot, F.; Sosic, G. Allocation of Greenhouse Gas Emissions in Supply Chains. Available online: https://pdfs.semanticscholar.org/2c1c/90268ae4288f3b7cdf1d614c16744a1da1d6.pdf (accessed on 20 February 2019).
  10. Du, S.; Ma, F.; Fu, Z.; Zhu, L.; Zhang, J. Game-theoretic analysis for an emission-dependent supply chain in a ‘cap-and-trade’system. Ann. Oper. Res. 2015, 228, 135–149. [Google Scholar] [CrossRef]
  11. Hovelaque, V.; Bironneau, L. The carbon-constrained EOQ model with carbon emission dependent demand. Int. J. Prod. Econ. 2015, 164, 285–291. [Google Scholar] [CrossRef]
  12. Kim, S.; Lee, J.; Park, M. Mathematical Modeling for Risk Averse Firm Facing Loss Averse Customer’s Stochastic Uncertaintya. Math. Probl. Eng. 2017, 2017, 6810415. [Google Scholar] [CrossRef]
  13. Lee, J.; Lee, M.L.; Park, M. A Newsboy Model with Quick Response under Sustainable Carbon Cap-N-Trade. Sustainability 2018, 10, 1410. [Google Scholar] [CrossRef]
  14. Song, J.; Leng, M. Analysis of the single-period problem under carbon emissions policies. In Handbook of Newsvendor Problems; Springer Publishing: New York, NY, USA, 2012; pp. 297–313. [Google Scholar]
  15. Rosič, H.; Jammernegg, W. The economic and environmental performance of dual sourcing: A newsvendor approach. Int. J. Prod. Econ. 2013, 143, 109–119. [Google Scholar] [CrossRef]
  16. Chen, X.; Wang, X.; Kumar, V.; Kumar, N. Low carbon warehouse management under cap-and-trade policy. J. Clean. Prod. 2016, 139, 894–904. [Google Scholar] [CrossRef]
  17. Cramton, P.; Kerr, S. Tradeable carbon permit auctions: How and why to auction not grandfather. Energy Policy 2002, 30, 333–345. [Google Scholar] [CrossRef]
  18. Böhringer, C.; Lange, A. On the design of optimal grandfathering schemes for emission allowances. Eur. Econ. Rev. 2005, 49, 2041–2055. [Google Scholar] [CrossRef]
  19. Benjaafar, S.; Li, Y.; Daskin, M. Carbon footprint and the management of supply chains: Insights from simple models. IEEE Trans. Autom. Sci. Eng. 2013, 10, 99–116. [Google Scholar] [CrossRef]
  20. Hong, K.; Jung, H.; Park, M. Predicting European carbon emission price movements. Carbon Manag. 2017, 8, 33–44. [Google Scholar] [CrossRef]
  21. An, J.; Lee, J. A Newsvendor Non-Cooperative Game for Efficient Allocation of Carbon Emissions. Sustainability 2018, 10, 154. [Google Scholar] [CrossRef]
  22. Yun, J.; Won, D.; Park, K. Dynamics from open innovation to evolutionary change. J. Open Innov. Technol. Mark. Complex. 2016, 2, 7. [Google Scholar] [CrossRef]
  23. Yun, J.J.; Won, D.; Park, K. Entrepreneurial cyclical dynamics of open innovation. J. Evol. Econ. 2018, 28, 1151–1174. [Google Scholar] [CrossRef]
  24. Chaabane, A.; Ramudhin, A.; Paquet, M. Design of sustainable supply chains under the emission trading scheme. Int. J. Prod. Econ. 2012, 135, 37–49. [Google Scholar] [CrossRef]
  25. Zhou, P.; Wang, M. Carbon dioxide emissions allocation: A review. Ecol. Econ. 2016, 125, 47–59. [Google Scholar] [CrossRef]
  26. Tang, L.; Wu, J.; Yu, L.; Bao, Q. Carbon allowance auction design of China’s emissions trading scheme: A multi-agent-based approach. Energy Policy 2017, 102, 30–40. [Google Scholar] [CrossRef]
Figure 1. Impact of the carbon cap on the carbon price ($).
Joitmc 05 00011 g001
Figure 2. Impact of the carbon cap on the production quantity (unit).
Joitmc 05 00011 g002
Figure 3. Carbon emission traded in cap and trade market at the different level of carbon price.
Joitmc 05 00011 g003
Table 1. Comparison with other studies.
Conditions[10,11][4,5,6,7,8,13,21][5,6,9,18,19,24][17,19,20,25]Our Study
Uncertain Demand
Production/Operation Decision
Interdependency of Operational decision, Carbon Cap and Price
Carbon Trade
Table 2. Parameters for the three entities considered.
Entity p i c i s i e i
1$100$60$402
2$120$90$701
3$110$60$503

