
Convenient Sampling of Xylem Sap from Adult Tree Trunks and Analysis of Its Components

National Institute for Environmental Studies, Tsukuba 305-8506, Japan
*
Author to whom correspondence should be addressed.
Forests 2023, 14(2), 389; https://doi.org/10.3390/f14020389
Submission received: 8 December 2022
/
Revised: 3 February 2023
/
Accepted: 9 February 2023
/
Published: 14 February 2023
(This article belongs to the Section Forest Ecophysiology and Biology)
Abstract
:Sampling xylem sap, especially from adult tree trunks, is a major challenge. In this study, we developed a new sampling method and tested its efficacy for sampling xylem sap from deciduous Quercus serrata and evergreen Cryptomeria japonica. The water-absorbing resin was placed in cylindrical holes in the tree trunks, and the xylem sap that was collected in the resin was analyzed for 15 metals, 4 nonmetals, total sugars, and the chemical forms of nitrogen, phosphorus, and sulfur. The volume of the collected xylem sap increased with increases in the mean monthly air temperature and the monthly precipitation when it was less than ca. 200 mm. The concentrations of sap components were higher in Q. serrata than in C. japonica. In Q. serrata, the concentrations of most sap components (e.g., K) began to increase in early spring, remained high in spring–summer, decreased in late summer–early autumn, and remained low in winter. This seasonal variation was likely associated with tree phenology. Relationships between the concentrations of elements in the sap and those in the leaves and soil solution were observed. This sampling method is appropriate for characterizing weekly and monthly mean concentrations of xylem sap components.
1. Introduction
The xylem sap of trees contains various chemical signals that indicate not only the tree’s physiological state but also local environmental conditions. Sap in plants is analogous to blood in animals in that it mediates the transport of nutrients and physiologically active substances to all parts of the plant; however, the challenges of sampling sap greatly limit its use and study.
To date, various methods to collect xylem sap have been used [1,2], including spontaneous exudation by root pressure [3,4,5,6,7,8,9], the pressure chamber method [10,11,12,13,14,15], the root pressure chamber method [16,17,18], vacuum extraction [19,20,21,22], the centrifugation method [23,24], and extraction via sap-feeding insects [25,26]. Root pressure exudates seep out spontaneously from the cut surface of a stump shortly after the decapitation of stems or from a hole bored in a tree trunk. In the pressure chamber method, one side of the twig sampled from a tree is sealed in the chamber, the interior of which is pressurized pneumatically. The xylem sap then seeps out from another open end of the twig. In the root pressure chamber method, a hydroponically grown plant is used. The root system is sealed in a chamber with a pneumatically pressurized interior. A stem or a lateral shoot is then disconnected to obtain sap from the cut surface. The vacuum extraction method is the opposite of the pressure chamber method (extrusion method). Sap is extracted from one end of a twig sample using a vacuum pump. In an alternative version of this method, the twig is not cut off [27,28,29]. A rubber hose is mounted on the twig with a tip that was exsected in advance, and sap is extracted through the hose using a vacuum pump. In the centrifugation method, a twig sample with the bark stripped off is cut into short pieces and subjected to centrifugation to extract xylem sap. In addition, sap-feeding insects, such as aphids, spittlebugs, and leafhoppers, can sometimes be used as an alternative to sap sampling because most of the components in the sap ingested by the insects are excreted rapidly without being altered. These ingenious methods have been applied to many plant species to elucidate the chemical characteristics of xylem sap and the factors affecting the diversity in sap properties.
In most of the above methods, xylem sap is sampled from twigs, seedlings, and herbaceous plants; these methods are thus ineffective for collecting sap from adult tree trunks. Although root pressure exudates can be obtained from tree trunks, this method can only be used in specific seasons, such as early spring, and for specific tree species, including Acer spp., Betula spp., and Salix spp. Some methods for sampling sap from tree trunks have been proposed, including the water displacement method [30,31] and the xylem-core centrifugation method [32], but the efficacy of these methods is relatively untested. In the water displacement method, the trunk of a cut tree is cut into ca. 1-m segments, and a segment is placed vertically upside down. The upper bark of the trunk segment is then stripped, and a rubber collar is fixed to the trunk. The inside of the collar is filled with water, and the sap that is extruded from the bottom of the segment is collected. In the xylem-core centrifugation method, the bark and phloem of a tree trunk are partially removed to expose the sapwood, and a xylem core is collected from the sapwood using an increment borer. The obtained core is cut into small pieces and centrifuged to extract xylem sap. However, the former method is laborious and highly destructive. By contrast, the latter method is convenient and non-destructive, but the amount of sap that is obtained (<1 mL) is generally insufficient for analyses of trace components or multiple components in the same sample. Thus, there is a need to develop alternative non-destructive sampling methods that permit the collection of large amounts of xylem sap from adult tree trunks regardless of the season and tree species.
The objective of this study was to develop an effective non-destructive sampling method to collect sufficient amounts of xylem sap in all seasons and from all tree species. Xylem sap was collected in water-absorbing resin placed in cylindrical holes bored in tree trunks. This method was applied to adult Konara oak (Quercus serrata) and Japanese cedar (Cryptomeria japonica) trees. In Japan, Q. serrata (deciduous broadleaf tree) and C. japonica (evergreen conifer) are dominant tree species, with the total area of the forests comprising these species representing 13% and 21% of the entire forested area in Japan, respectively [33]. The composition of the collected xylem sap was determined (metallic and nonmetallic elements, N compounds, and sugars). We also herein describe and interpret our results in the context of the previously reported results. The findings of this study provide important insights into the characteristics of xylem sap components and the seasonal variation in their concentrations.
2. Materials and Methods
2.1. Study Trees, Study Site, and Sampling Periods
Xylem sap was collected from Q. serrata and C. japonica adult trees with trunk diameters (DBH) of ca. 30 cm at breast height. Both tree species were from the same location (within a few hundred meters) at an altitude of ca. 350 m on the northern slope of Mount Tsukuba in the Kanto district of Japan. Sap was sampled over three experimental periods: April 2015–March 2016 (Experiment 1), June 2016–May 2017 (Experiment 2), and June 2018–May 2019 (Experiment 3). Three trees each of Q. serrata and C. japonica were sampled in each experiment. The individual trees sampled in Experiment 1 differed from those in Experiment 2; however, the trees sampled in Experiment 2 and Experiment 3 were the same (i.e., a total of six trees each of Q. serrata and C. japonica were sampled). The soil at the study site is classified as brown forest soil (Cambisol), and the surface is granite [34]. The annual mean air temperature, total precipitation, and mean relative humidity during the study period were 15.0 °C, 1440 mm, and 76.0% in Experiment 1; 14.6 °C, 1297 mm, and 72.4% in Experiment 2; and 15.2 °C, 982 mm, and 74.2% in Experiment 3 (in Tsukuba, which is a city adjacent to the study site [35]), respectively.
2.2. Xylem Sap Sampling
A schematic diagram of the method used to sample xylem sap is shown in Figure 1. Sampling holes were made in the trunks of the study trees at a height of ca. 1 m above the ground (2 holes/tree; the direction was arbitrary). After the outer bark was peeled, a shallow hole with a diameter of 3 cm was bored in the trunk with a countersink drill to expose the sapwood. Next, a cylindrical hole with a diameter of 1.5 cm was bored to a depth of 7 cm with a wood drill at the center of the shallow hole. The hole was made so that the back was slightly higher than the front to prevent the intrusion of stemflow. After removing the woodchips, the inside of the hole was washed and sterilized thoroughly with 3% H2O2 and ethanol. After wiping the inner wall of the hole with clean tissue paper, water-absorbing resin (250 mg) containing germicide (details are described later) was divided into three portions and placed separately at three spots (front, midpoint, and back) in the hole. Finally, the hole was closed tightly with a silicon rubber stopper, and the gap between the wood and the stopper was filled with silicon sealant. A total of 500 mg of water-absorbing resin was placed in a single tree. Although the absorption capacity of the water-absorbing resin differs depending on chemical species and concentrations of sap components, 500 mg of resin can usually absorb more than 100 mL of sap [36]. A small amount of sap that exuded into the sampling hole was collected quickly and stored in the water-absorbing resin because the resin can absorb ca. 50% of the capacity within 2 min [37]. After a month, the resin was removed from the two holes, pooled, and stored in the laboratory. The sampling holes were washed again with 3% H2O2 and ethanol, and new water-absorbing resin was placed in the holes to initiate sampling for the following month.
2.3. Types of Water-Absorbing Resin and Xylem Sap Components
We used polyacrylates as the water-absorbing resin. Because the commercially available resin (sodium polyacrylate, Sun-Fresh SD-500D; San-Dia Polymers, Ltd., Tokyo, Japan) contained many impurities, it was purified thoroughly (described in Section 2.4) or transformed into a Li-type resin before use (described in Section 2.12). The Na-type resin was used in Experiments 1 and 2, whereas the Li-type resin was used in Experiment 3. Xylem sap collected by the Na-type resin was analyzed for inorganic anions (Cl−, NO3−, PO43−, and SO42−); total N, P, and S; NH4+; total free amino acids; and total sugars. Xylem sap collected by the Li-type resin was analyzed for metallic elements.
2.4. Purification of Na-Type Water-Absorbing Resin
The Na-type water-absorbing resin purchased contained a large amount of SO42−, which stemmed from the use of H2SO5 in the production process as a polymerization promoter. This resin was purified using the following procedure. First, the crude resin (100 g) was swelled with water (500 mL). Next, 500 mL ethanol was added, and the discharged solution was discarded by decantation. This procedure was repeated more than 10 times until the concentration of SO42− in the discharged solution was low. The resultant SO4-free resin was washed several times with ethanol to remove water and then dried in an electric oven (60 °C).
2.5. Recovery of Inorganic Anions from the Resin
The Na-type water-absorbing resin (200 mg) was impregnated with a multi-anion standard solution (5 mL). After several days, the solution in the resin was extracted by shrinking the resin through the addition of ethanol (5 mL), and the solution was analyzed using an ion chromatography (IC) system (761 Compact IC, Column: Shodex IC SI-90G + IC SI-90 4E, Sample loop: 20 µL; Metrohm Co., Herisau, Switzerland) to evaluate the recovery rates of the anions. When water was mixed with ethanol, the combined volume decreased slightly, but we did not correct for this volume change. The concentrations of anions in the standard solution were as follows: 0.4 and 1 ppm for Cl−, 2 and 5 ppm for NO3− and SO42−, and 4 and 10 ppm for PO43−. As a result, we obtained the following recovery rates (n = 5): Cl− (106 ± 7%), NO3− (101 ± 4%), PO43− (86.3 ± 9.0%), and SO42− (104 ± 4%). Chloride ions, NO3−, and SO42− were recovered quantitatively. Although the PO43− recovery rates decreased slightly at the lower concentration, they were generally satisfactory.
2.6. Preservative Quality of Inorganic Anions in Xylem Sap Collected in the Resin
Xylem sap may contain endophytic microbes as well as physiologically active substances such as enzymes. Thus, the concentrations of anions in the sap collected in Na-type water-absorbing resin may have changed during the sampling period. In fact, when a multi-anion standard solution (2 mL) containing Cl− (1 ppm), NO3− and SO42− (5 ppm), and PO43− (10 ppm) was added to the resin impregnated with sap (2 g) and left to stand for a week, the concentrations of NO3− and to a lesser extent SO42− decreased. Therefore, we added N- and S-free germicides, such as formalin or some phenols (phenol, o-phenylphenol, o-cresol, thymol, and 4-tert-amylphenol), to the resin and examined their ability to preserve anions. Although many of them were effective, 4-tert-amylphenol was the most effective. Therefore, we collected the sap for a month (October 2014 and April 2015) using the resin containing 25% germicide solution (50% 4-tert-amylphenol in 2-propanol), and the retrieved resin with sap was spiked with the multi-anion standard solution. After a week, the concentrations of anions preserved in the sap were analyzed to verify the effectiveness of the germicide. The recovery rates of NO3− were 102 ± 3% (n = 3) in the sap sample from October 2014 and 108 ± 9% (n = 3) in the sap sample from April 2015. Sulfate ions were also recovered quantitatively. Therefore, we used the resin containing 25% germicide solution (50% 4-tert-amylphenol in 2-propanol) to collect xylem sap in Experiments 1–3.
2.7. Analysis of Inorganic Anions
We measured the weight of the retrieved water-absorbing resin and then subtracted the initial weight of the resin (500 mg) to determine the volume of sap collected. The sap was then extracted from the resin by adding an equal volume of ethanol. The extracted sap (a mixture of sap and ethanol; hereafter called “ethanolic sap”) was filtered (GL Chromatodisc Syringe Filter, 25AI; GL Sciences Inc., Tokyo, Japan) for an analysis of its anions by IC. However, the ethanolic sap contained a large amount of an unknown substance (probably an organic acid) with a retention time similar to that of SO42−. This interference could not be excluded by the selection of eluents (Na2CO3/NaHCO3, Na2B4O7/H3BO3, or Na2CO3/NaOH in an aqueous or 5% acetone solution). Therefore, Cl−, NO3−, and PO43− (without any interference) were analyzed first using 1.5 mM Na2CO3/3 mM NaOH as an eluent. Next, SO42− was quantified indirectly from the difference in IC peak intensities obtained with the ethanolic sap in which SO42− was precipitated by the addition of Ba2+ and the ethanolic sap in which SO42− was not precipitated. However, if the unknown substance is an organic acid, it may partly precipitate with Ba2+, leading to an overestimation of SO42−. Therefore, we prepared two solutions: a mixture of the ethanolic sap (0.5 mL), water (0.4 mL), and 0.5 M Ba(CH3COO)2 or Ca(CH3COO)2 (0.1 mL). After ultrasonic treatment, the solutions were left to stand for several days to complete the precipitation of BaSO4. Both solutions were filtered (GL Chromatodisc Syringe Filter, 13AI) and analyzed using an IC system. The SO42− concentrations in the ethanolic sap were determined by calculating the difference in the peak intensities at the SO42− retention time. Sulfate ions are somewhat soluble in 0.05 M Ca2+ solution (theoretical solubility: 48 ppm) but insoluble in 0.05 M Ba2+ solution (0.21 ppb) [38]. The organic acid binding capacities for Ca2+ and Ba2+ are almost the same (e.g., the solubility product of Ca oxalate is 10−8.7 and that of Ba oxalate is 10−7.0, and the stability constant of tartaric acid with Ca2+ is 10−1.8 and that with Ba2+ is 10−1.6) [38,39]. Therefore, even if some of the unknown substance precipitates with Ca2+ and Ba2+, the precipitation rates of the unknown substance with both cations will be almost the same, and the effect on the SO42− measurement will be negligible. SO42− was recovered quantitatively (101 ± 1%, n = 5) from the standard solution (2.5 ppm as SO42−) using the above indirect method. The recovery rates of SO42− from the ethanolic sap spiked with SO42− (2.5 ppm) were also quantitative (98.5 ± 3.2%, n = 5).
2.8. Analysis of Total N, P, and S
N, P, and S in xylem sap are present not only in their inorganic forms but also in their organic forms, such as amino acids, peptides, proteins, and nucleic acids. Therefore, the total N, P, and S contents in xylem sap were analyzed using samples with organic components that had been mineralized by UV irradiation. The ethanolic sap (1 mL; same as the sample in Section 2.7) was dried on a hotplate to remove ethanol, and then the residue was dissolved in water (1.8 mL). The solution was transferred to a quartz reaction tube (2 cm in diameter and 14 cm in length), to which 0.06 M NaOH (0.1 mL) and 30% H2O2 (0.1 mL) were added. The mouth of the tube was covered tightly with a piece of DuraSeal (Diversified Biotech, Inc., Dedham, MA, USA) with a pinhole at the center to prevent the loss of solution and then loosely covered with a shallow quartz lid. After wrapping the empty part of the tube with aluminum foil to prevent increases in temperature, the tube was placed 1 cm from a 400 W low-pressure Hg vapor lamp (SUV400UH-3, 600 mm in length; SEN LIGHTS Corporation, Osaka, Japan) and irradiated with UV light for 7 h under a fan. The resultant solution was analyzed by IC for NO2−, NO3−, PO43−, and SO42−. The optimum concentrations of NaOH and H2O2 in the reaction mixture and the UV irradiation time were determined in advance. To verify the mineralization efficiency, methionine (C5H11NO2S), cystine (C6H12N2O4S2), and nicotinic acid (C6H5NO2) (2–12 ppm as N or S) were mineralized using the above conditions. N and S of methionine were recovered as NO2− + NO3− and SO42−, with recovery rates of 93.1 ± 2.4% (n = 5) and 92.1 ± 0.4% (n = 5), respectively. In addition, the recovery rates of N and S from cystine were 91.2 ± 0.4% (n = 5) and 101 ± 3% (n = 5), respectively. N contained in the pyridine ring of nicotinic acid was also recovered as NO2− + NO3−, with a recovery rate of 95.0 ± 0.3% (n = 5). Although we did not conduct the recovery test for organic P, it was likely hydrolyzed rapidly to release PO43− because the organic P in biomaterials (xylem sap) mostly exists as ester phosphates. The concentrations of organic N, P, and S were calculated by subtracting the concentrations of the corresponding inorganic forms from the total concentrations obtained here.
2.9. Analysis of Total Free Amino Acids
The total free amino acid concentrations were analyzed using the ninhydrin colorimetric method [40]. Amino acids are similarly sensitive to the ninhydrin coloring solution used in this method, with the exception of proline, cysteine, and a few others [40,41,42]. Specifically, the ethanolic sap (0.5 mL; same as the sample in Section 2.7), water (0.5 mL), and ninhydrin coloring solution (2.5 mL) were mixed and heated in boiling water for 15 min. After cooling rapidly, the solution was diluted via the addition of water (5 mL), and then the absorbance at 570 nm was measured within 30 min. The ninhydrin coloring solution is a mixture of the A (20 mL) and B (0.5 mL) solutions. The A solution was prepared by dissolving ninhydrin (300 mg) in a mixture of ethylene glycol (15 mL) and 4 M sodium acetate buffer at pH 5.5 (5 mL). The B solution was prepared by dissolving SnCl2∙2H2O (5.9 g) in ethylene glycol (50 mL). Both solutions were reprepared on the day of the experiment. A calibration curve was prepared using glycine as a standard amino acid. The recovery rate of glycine N (3.7 ppm) added to the ethanolic sap was 106 ± 3% (n = 3). Ninhydrin reacts with not only free amino acids but also with the N-terminal amino acid residues of peptides and proteins, as well as NH4+. The former is considered relatively small, but the latter is not negligible. Therefore, we estimated the net concentrations of free amino acids by subtracting the NH4+ concentration, which was determined as described in the next section, from the tentative concentrations obtained here.
2.10. Analysis of Ammonium Ions
Ammonium ions were analyzed using the indophenol blue colorimetric method. Conventionally [43,44], amino acids with a low coloring sensitivity develop color and interfere with the analysis of NH4+. Therefore, we used 2-hydroxybiphenyl as a reactive reagent [45,46] because it was less susceptible to the effect of amino acids. However, because some slight interference was observed, we adjusted the alkalinity of the reaction solution to minimize the effect of amino acids. As a result, the coloring sensitivities of glycine and cysteine N decreased to 0.88 ± 0.44% (n = 4) and 1.1 ± 0.4% (n = 5) of that of NH4-N, respectively, in the modified method. The procedure was as follows: the ethanolic sap (0.5 mL; same as the sample in Section 2.7) was mixed with 1 M KCl (0.5 mL) and 5% trisodium citrate solution at pH 7 (2.5 mL). Next, a 2-hydroxybiphenyl/nitroprusside solution (2.5 mL) and carbonate buffer solution containing hypochlorite ions (1.5 mL) were added to the mixed solution. After 15 min, the resultant solution was filtered (GL Chromatodisc Syringe Filter, 25P), and its absorbance was measured at 660 nm. The 2-hydroxybiphenyl/nitroprusside solution was prepared by dissolving sodium 2-hydroxybiphenyl tetrahydrate (1.5 g) and sodium nitroprusside dihydrate (8 mg) in a 1:1 mixture of water and ethanol and diluting to 50 mL. The carbonate buffer solution containing hypochlorite ions was prepared by dissolving Na2CO3 (500 mg), NaHCO3 (400 mg), and 5% NaClO solution (5 mL) in water and diluting to 50 mL. The recovery rate of NH4-N (2–8 ppm as N) added to the ethanolic sap was 91.5 ± 1.7% (n = 5), which was generally satisfactory.
2.11. Analysis of Total Sugars
The total soluble sugar concentrations were determined using the phenol-sulfuric acid colorimetric method [47,48]. This method, in which pyranose and furanose rings are analyzed, is applicable for the quantitative analysis of many sugars, including monosaccharides, disaccharides, and polysaccharides, with almost equal sensitivities [49]. Although Cu2+ and some organic acids interfere with color development [50], they do not significantly affect the analysis because their concentrations in xylem sap are low. Given that ethanol may also affect this method, the analysis was conducted as follows: the ethanolic sap (0.25 mL; the same as the sample in Section 2.7) was dried on a hotplate (≤150 °C), and the residue was dissolved in water (5 mL). The solution was filtered (GL Chromatodisc Syringe Filter, 13P), and then 5% phenol solution (1 mL) and concentrated H2SO4 (5 mL) were added to a 1-mL aliquot of the filtrate. After 10 min, the mixed solution was cooled with running water, and its absorbance was measured at 490 nm. A calibration curve was prepared using glucose as a standard sugar. The recovery rate of glucose (70–2000 ppm) added to the ethanolic sap was 95.4 ± 1.9% (n = 5).
2.12. Preparation of Li-Type Water-Absorbing Resin
The Na-type water-absorbing resin contained some K, Mg, and Ca in addition to Na. Therefore, we converted this resin to a Li-type resin to remove these elements and purify the resin. The crude resin (70 g) was swelled via the addition of 0.5 M LiCl (500 mL). The resin then decreased in size through the addition of acetone (500 mL), and the discharged solution was discarded by decantation. A 1:1 mixture of 0.5 M LiCl and acetone (500 mL) was added to the semi-swollen resin, and the mixture was stirred well. The supernatant was then discarded. This procedure was repeated six times. The washes were conducted 10 more times after the washing solution was changed to a 1:1 mixture of 0.3 M trilithium citrate/1 mM CyDTA and acetone (500 mL). Finally, the resin was washed well with a 1:1 mixture of water and acetone and then acetone, followed by drying in an electric oven (60 °C).
2.13. Analysis of Metallic Elements
Xylem sap was collected using the Li-type water-absorbing resin containing 25% germicide solution (50% 4-tert-amylphenol in 2-propanol). The composite resin retrieved from the two sampling holes was weighed to obtain the volume of sap collected after correcting for the initial resin weight. Ethanol with a volume equal to or twice (if the sap volume was less than 10 mL) the volume of sap and 3 M HNO3/0.1 M citric acid (1 or 1.2 mL; the amount was selected to keep the pH of the solution lower than 3) were added to the resin to extract the sap under acidic conditions (the mixture was left to stand for a day with occasional stirring). The extracted sap was filtered (GL Chromatodisc Syringe Filter, 25AI), and then a 3-mL aliquot of the filtrate was dried on a hotplate to remove ethanol. The residue was dissolved in 0.01 M HNO3 (6 mL), filtered again (GL Chromatodisc Syringe Filter, 13AI), and analyzed using the inductively coupled plasma atomic emission spectrometry (ICP-AES) (ICPE-9820; Shimadzu Corporation, Kyoto, Japan) and inductively coupled plasma mass spectrometry (ICP-MS) (Agilent 8800; Agilent Technologies, Santa Clara, CA, USA) systems. Sodium, K, Mg, and Ca were analyzed by ICP-AES, whereas Rb, Cs, Sr, Ba, Al, Cr, Mn, Fe, Ni, Cu, Zn, and Cd were analyzed by ICP-MS. However, the purified Li-type resin still contained trace amounts of the major elements to be analyzed. When the extracts from water (5 mL)-impregnated resin were analyzed according to the above procedure, Na (11.8 ± 0.8 ppm), K (0.388 ± 0.09 ppm), Mg (0.045 ± 0.014 ppm), and Ca (0.031 ± 0.004 ppm) were detected (n = 5). Therefore, the blank correction was performed in these analyses. In the recovery tests using the resin impregnated with a multi-cation standard solution (Na: 30 ppm, K: 100 ppm, Mg: 6 ppm, and Ca: 10 ppm), Na (104 ± 18%, n = 3), K (115 ± 1%, n = 3), Mg (98.1 ± 3.4%, n = 6), and Ca (100 ± 3%, n = 6) were recovered quantitatively. Although the recovery rates of Na were satisfactory, its concentrations in xylem sap were lower than the blank values from the resin. Thus, Na was excluded from the objective elements. We did not examine the recovery rates of heavy metals, but they were likely recovered quantitatively because the extraction procedure was conducted under acidic conditions.
2.14. Statistical Analysis
All statistical calculations (linear and quadratic regressions) were carried out using the R software (R version 4.2.2).
3. Results and Discussion
3.1. Volume of Xylem Sap Collected
The volume of xylem sap collected from the three conspecific trees (Q. serrata or C. japonica) was averaged monthly (Table 1). The volume of sap collected was almost the same in Experiments 1–3, and it was slightly higher for C. japonica than for Q. serrata. The maximum volume ranged between 12 and 16 mL, which was considerably smaller than the net sampling-hole volume (ca. 21.2 mL) corrected for the dead volume associated with the rubber stopper. The volume of sap collected from individual trees exceeded 20 mL (ca. 95% of the sampling-hole capacity) for only four (all were from C. japonica) of 216 sap samples collected in Experiments 1–3. When the sampling hole is full, the collectible volume of xylem sap will plateau because of a lack of spatial allowance, but this rarely occurred.
The volume of sap collected varied substantially among the three conspecific trees (MCV values), especially for C. japonica. Individual xylem conduits or tracheids of trees are connected to different branches and leaves, but also to the roots, which are distributed in areas with different soils [51,52]. Therefore, the distribution of the sap flow rate in the xylem is heterogeneous [53,54,55], and it can change readily in response to environmental conditions [56,57,58,59]. The regions with fast-flowing sap are sometimes scattered in the xylem system [60]. Accordingly, the very large differences in the volume of sap collected among the three conspecific trees likely stemmed from the heterogeneity in the sap flow rate in the xylem.
The seasonal variation in the volume of sap collected (Experiment 1 results) is shown in Figure 2 (plots lack error bars because the coefficients of variation among three conspecific trees were large). The results in Experiments 2 and 3 were almost the same as those in Experiment 1. The sap volume increased from early spring (March), peaked in summer (June–August), decreased gradually thereafter, and reached its lowest point in winter (January–February). The increase in the sap volume in early spring was slightly faster in C. japonica than in Q. serrata, but the overall patterns were similar in both tree species.
When the volume of sap collected began to increase in March, the transpiration rates were low in Q. serrata and C. japonica [61], and foliation had not yet begun. Therefore, the early spring increase in the volume of sap collected appears to reflect the activation of internal sap flow [62] for trunk thickening growth (cell division in the cambium) [63,64,65], which begins in early spring prior to budbreak. Additionally, a small amount of xylem sap was collected in winter, suggesting that there is still some sap flow during the dormant season because of the transpiration through the bark and the cuticular transpiration of the old leaves (in the case of C. japonica) [55,62,66,67]. The seasonal variation in the volume of sap collected was consistent with the variations in the sap flow and transpiration [61,68,69,70,71,72,73], suggesting that they are the main factors affecting how much sap is collected.
Sap flow and transpiration are affected by various environmental factors [72,73,74], including air temperature, and they both often change simultaneously [55,72,75,76,77,78,79]. Sufficiently low soil moisture levels also lead to decreased sap flow and transpiration. For example, the sap flow rates in Q. serrata were almost constant when the soil moisture content was sufficient (≥35%) but decreased when the soil moisture content was below 35% [80]. In C. japonica, transpiration rates reportedly decrease when the soil moisture content is below 0.32 m3/m3 [81].
The relationship between the volume of xylem sap collected in Q. serrata and the mean monthly air temperature shown in Figure 3 was determined on the basis of the results obtained in Experiments 1–3. The volume of xylem sap increased linearly as the air temperature increased. In addition, the relationship between the sap volume collected in Q. serrata and the monthly precipitation as a proxy of soil moisture shown in Figure 4 was determined on the basis of the results obtained in Experiments 1–3. The regression analysis indicated that the sap volume increased as the monthly precipitation increased but seemed to plateau when the precipitation exceeded 200 mm. Considering the soil and geological conditions of the study site, monthly precipitation of ca. 200 mm appears to be the threshold value that determines whether soil moisture affects the sap volume. Similar relationships were also observed in C. japonica. The volume of xylem sap collected changed depending on the air temperature and soil moisture (precipitation) in a manner similar to the rate of sap flow and transpiration.
The above results suggested that the volume of xylem sap collected was associated with the sap flow. Although the volume of sap collected was considerably smaller than that expected from the actual sap flow rates in trunks (Q. serrata: 85–518 mL/cm2/d [82]; C. japonica: 27–69 mL/cm2/d [54]), probably because of the discontinuity of sap flow in the sampling holes [83], the changes in the volume of sap collected appeared to have synchronized with those in the sap flow rates. Additionally, even when only a few conduits or tracheids were disconnected, the sap flow system remained functional because xylem sap can flow upward by bypassing damaged areas [84]. Xylem sap can flow slowly in a radial direction through the pits of conduits or tracheids and/or the xylem ray parenchyma [85,86,87,88,89,90,91]. Therefore, the xylem sap collected was considered as the exudate from the healthy sap flow system. Moreover, the original solute concentrations and compositions may have been maintained.
The acid fuchsin dye, which was injected into the xylem as a 0.1% solution (1000 mL) at ca. 50 cm below the sampling hole, was detected in the resin placed in the sampling hole. This may support the collection of the intact xylem sap. Notably, the collected sap was the exudate when the continuous sap flow was disrupted.
3.2. Characteristics of the Concentrations of Xylem Sap Components
3.2.1. Metallic Elements
The concentrations of metallic elements in the xylem sap of Q. serrata and C. japonica and those in the xylem sap of various tree species reported in previous studies are summarized in Table 2.
The concentrations of K in the xylem sap of Q. serrata and C. japonica were very high and slightly exceeded the maximum value reported in the literature. Concentrations of K increase in sap samples that are contaminated with the intracellular fluid of living cells [32]. However, such contamination was unlikely in this study because we discarded the first sap samples obtained in the month immediately after the creation of the sampling holes. We also thoroughly washed the sampling holes each time the resin was replaced. In C. japonica, the concentrations of K in sap were very high and exceeded 1000 ppm in the xylem adjacent to the heartwood; the exudates of heartwood had even higher concentrations of K (ca. 2000 ppm) [93]. Because the thickness of the sapwoods of Q. serrata and C. japonica with a DBH of ca. 30 cm are both ca. 4 cm [59,97,98], the ends of the sampling holes reached the heartwood. Therefore, the xylem sap collected may have been affected by the exudates from the heartwood. In addition, the abundance of K-rich granite at the study site [99] might also affect the K concentrations in xylem sap. Additional studies are needed to clarify the possible effects of these factors. To the best of our knowledge, our study is the first to determine the concentrations of Rb and Cs in xylem sap. The ratios of Rb and Cs to K in the xylem sap are close to those in the soil solution (Appendix A, Table A1). Because some K transporters can also transport Rb and Cs [100], these elements must have been absorbed with K on the basis of their chemical similarity. However, given that the concentrations of Cs in the sap of C. japonica were lower (ca. 30%) than those in Q. serrata, the absorption of Cs was possibly suppressed in C. japonica.
The concentrations of Mg and Ca in the xylem sap of Q. serrata and C. japonica were within the range of the values reported in the literature, and their mean concentrations were also close to the mean and median values reported in the literature. The concentrations of Sr and Ba in xylem sap have not been reported. Both Sr and Ba were detected in the xylem sap of Q. serrata and C. japonica at low (sub-ppm) concentrations. Because Sr and Ba are chemically similar to Mg and Ca, they must have been absorbed along with the essential elements Mg and Ca. However, Ba concentrations were extremely high in the sap of Q. serrata, and the Ba/Ca ratio was ca. two times that in the soil solution (Appendix A, Table A1). The amount of Ba in the leaves of Q. serrata is several times that of C. japonica (Appendix A, Table A2), suggesting the high Ba concentration in the sap of Q. serrata might have been due to the specific elemental requirements of this tree species.
The concentrations of Al are usually low (sub-ppm) in the sap of non-accumulator trees because Al is toxic to plants [101]. Therefore, the Al concentrations in the sap of Q. serrata and C. japonica were also low and similar to the values reported in the literature. The Mn concentrations in the sap of Q. serrata were similar to those reported in the literature, but those in C. japonica and the concentrations of Cr and Cd in both tree species were much lower than the values reported in the literature. Additionally, the Q. serrata xylem sap contained ca. 400 times more Mn than the C. japonica xylem sap. This likely stems from the specific elemental requirements of Q. serrata because the Q. serrata leaves contained ca. 10 times more Mn than the C. japonica leaves (Appendix A, Table A2).
3.2.2. Nonmetallic Elements
The concentrations of nonmetallic elements in the xylem sap of Q. serrata and C. japonica and those in the xylem sap of various tree species reported in the literature are summarized in Table 3.
The Cl concentrations in the xylem sap of Q. serrata and C. japonica were at the low end of the values in the published literature, and the mean concentrations were considerably lower than the mean and median values in published reports.
The main form of S in xylem sap is considered to be SO42−, and the concentration of organic S is usually low [105,108]. For example, organic S (thiol compounds) comprises only 3.8% of all S in the xylem sap of Norway spruce [105]. Additionally, the reported concentrations of glutathione and cysteine, which are the typical forms of organic S in xylem sap, are considerably low (<0.5 ppm). However, our findings for Q. serrata and C. japonica differed from those of previous studies. Although the concentrations of total S in the xylem sap were within the range of the values in earlier studies, the relative abundances of SO42− and organic S differed, and most (96.5 ± 2.0%) of the total S was organic S. However, the S species that did not precipitate with Ba2+ and were mineralized easily to SO42− by UV irradiation were assumed to be organic S, but we did not identify these substances. The importance of sulfated glucosinolates and flavonoids for transporting S has been confirmed [109]; additional studies are needed to clarify the effects of glucosinolates and flavonoids on the concentrations of different forms of S in xylem sap.
The concentrations of PO4-P in the xylem sap of Q. serrata and C. japonica were at the low end of the ranges reported in the literature, and those of total P were slightly lower than the minimum value reported in the literature. Moreover, 20%–35% of the total P in the sap of both tree species was organic P. This differs from the results of previous studies showing that organic P is almost absent in xylem sap but present in phloem sap [110]. However, given that P circulates actively within the body of the tree [92,110], organic P possibly exists in the xylem sap of Q. serrata and C. japonica because of phloem–xylem exchange.
3.2.3. N compounds
The concentrations of N compounds in the xylem sap of Q. serrata and C. japonica and those in the xylem sap of various tree species reported in the literature are summarized in Table 4.
Nitrate ions were not detected (≤0.02 ppm as N) in the xylem sap of Q. serrata and C. japonica, which is consistent with the results of previous studies on Betula pendula [13] and Picea abies [92]. Some tree species can reduce NO3− in the roots immediately after absorption [117,118,119]. Furthermore, Q. serrata and C. japonica have symbiotic associations with ectomycorrhizal fungi [120,121] and arbuscular mycorrhizal fungi [120,122], respectively. Thus, these trees receive a substantial amount of N via mycorrhizal fungi. The N compounds that are acquired by the external hyphae of mycorrhizal fungi are transported to the internal hyphae after they are converted to arginine; they finally are acquired by the trees as NH4+ [123,124,125]. Our findings that the xylem sap of Q. serrata and C. japonica contained NH4+ but not NO3− are consistent with these reported observations.
The concentrations of NH4+ in xylem sap are generally low because NH4+ is toxic at high concentrations and is often assimilated rapidly to amino acids, amides, and/or ureides in the roots [12,118,119]. The NH4+ concentrations in the xylem sap of Q. serrata are at the low end of the range of values reported in the literature, and those of C. japonica are close to the minimum value reported in the literature.
Amino acids are the most abundant N compounds in xylem sap [12,118,119]. According to the total amino acid N and total N values in the literature, amino acids comprise the largest N fraction in sap. However, the concentrations of total amino acids are low in the xylem sap of Q. serrata and C. japonica; this was especially the case for C. japonica, in which the concentration of total amino acids was approximately one-tenth of the minimum value in the literature.
Xylem sap contains peptides and proteins as well as inorganic N and amino acids [7,8,29,115,126]. Organic N other than amino acids are also abundant in the xylem sap of Q. serrata and C. japonica; the amount of organic N was three times the amount of amino acid N (71% of the total N) in Q. serrata and more than seven times the amount of amino acid N (86% of the total N) in C. japonica. Although a portion of organic N comprises proteins, organic N other than amino acids and proteins (e.g., peptides and alkaloids) is likely present in large quantities in xylem sap because the content of proteins is generally less than that of amino acids ([7,126]; Table 4). Although the concentrations of each N compound (NH4+, amino acids, organic N other than amino acids, and total N) were low and close to the minimum values reported in the literature, organic N other than amino acids was relatively abundant in the sap of Q. serrata and C. japonica.
3.2.4. Total Sugars
The concentrations of total sugars in the xylem sap of Q. serrata and C. japonica and those in the xylem sap of various tree species reported in the literature are summarized in Table 5.
The concentrations of total sugars in both tree species were lower than the minimum values reported in the literature. However, the sugar concentrations determined in earlier studies might have been overestimated because they were mostly estimated from spring root-pressure exudates and the sap of orchard trees. The sugar concentrations in Q. serrata and C. japonica appear to be representative of tree species that do not show significant increases in root and branch pressure in early spring [62].
3.3. Estimation of the Amounts of Specific Components Transported by Xylem Sap
The amounts of macro-essential elements and total sugars transported via sap flow were tentatively estimated according to the product of the mean concentrations in sap (Table 2, Table 3, Table 4 and Table 5) and the sap flow rate reported in the literature. The flow rate in C. japonica (average: 34 mL/cm2/day) was calculated after observing 15 adult trees (DBH: ca. 40 cm) for 125 days [129]. Unfortunately, appropriate data for Q. serrata were not found. As a result, material fluxes (µg/cm2/day) in the trunk of C. japonica were estimated to be 63,200 (K), 442 (Mg), 476 (Ca), 99 (total N), 22 (total P), 44 (total S), and 6730 (total sugars). When the sapwood width was assumed to be 4 cm [98], the whole-tree transport (mg/day) in C. japonica with a DBH of 30 cm was 20,700 (K), 145 (Mg), 156 (Ca), 32 (total N), 7 (total P), 14 (total S), and 2200 (total sugars). The amount of K may have been overestimated, as described previously (in Section 3.2.1). In addition to the sap component analysis using our resin sampling method, measuring the sap flow rate of the same tree will likely lead to more precise estimations of the material fluxes in the tree trunks.
3.4. Seasonal Variation in the Concentrations of K in Xylem Sap
The concentrations of xylem sap components in Q. serrata and C. japonica showed seasonal variations. For example, the variation in the K concentrations is shown in Figure 5. Because the variation among the three conspecific trees was large (see the MCV values in Table 2), the plots are shown without error bars. The large variations in elemental concentrations among conspecific trees may be explained by the same factors responsible for the variations in the volume of sap collected (see Section 3.1).
The K concentration in both tree species increased from early spring (March), peaked at the beginning of June, remained high until September, and then decreased gradually to its lowest value in winter (December–February). In Q. serrata and C. japonica, K is required for trunk thickening growth, which begins in early spring [63,64,65], and concentrations of K increase in the cambium with actively dividing cells [130,131]. The increase in the K concentrations in sap in early spring before the activation of photosynthesis appears to stem from increases in the demand for K in the trunk cambium. Trunk thickening growth continues until the end of October [63,64,65].
Photosynthesis occurs from April to October. The photosynthetic activity of Q. serrata peaks by the end of May when foliation is complete, remains high during the growing season (June–late September), sometimes decreases slightly in summer, and then decreases towards winter [132]. New leaves develop ca. 1 month later in C. japonica than in Q. serrata, but the changes in photosynthetic activity are similar between C. japonica and Q. serrata [133]. This seasonal variation in photosynthetic activity is similar to that of the concentrations of K in xylem sap. Because K is essential in the photochemical reaction (Hill reaction) of photosynthesis [134,135], the seasonal variation (especially after May) in the concentrations of K in sap appears to mainly reflect changes in photosynthetic activity.
Photosynthetic activity is controlled by temperature, and photosynthetic activity and temperature are often positively correlated at temperatures below 25 °C [136]. The relationship between the concentrations of K in sap and the air temperature is shown in Figure 6. Linear and quadratic functions revealed strong relationships in Q. serrata and C. japonica, respectively. The similarity in the responses of the K concentrations in sap and photosynthetic activity to the temperature indirectly supports the dependency of the former on the latter. Although photosynthetic activity is also affected by the photosynthetic photon flux density [137,138], it is sufficiently high and generally saturated in the Kanto district, with the exception of several weeks before and after the winter solstice [139]. Therefore, the effect of the variation in the photon flux density is likely negligible at the study site.
The annual maximum variation rate (%) [i.e., 100 × (max. conc. − mean conc.)/mean conc.] in the K concentrations in sap was 46% in Q. serrata and 27% in C. japonica, and the magnitude of the increase in the K concentrations from winter to summer in C. japonica was ca. 70% of that in Q. serrata. Evergreen C. japonica trees contain a considerable amount of mobile K in their old leaves. Additionally, the photosynthetic activity in a growing season is generally lower in evergreen conifers than in deciduous broadleaf trees [70]. Moreover, photosynthesis in conifers sometimes occurs on warm days in winter [140]. This appears to be the cause of the observed differences in the range of variation between the two tree species.
The seasonal variation in the K concentrations in the xylem sap of Q. serrata and C. japonica is similar to that observed in Platanus orientalis and two other tree species [141]. Although the annual profiles are not shown, the K concentrations were 1.6–5.2 times higher in summer than in spring. However, seasonal variation patterns vary among tree species. For example, the K concentrations in xylem sap are high in December–March in Populus nigra [29] and in September–October in Fagus sylvatica [30]. The K concentrations are also high in May–June and September–October in Picea abies and two other tree species [142]. Additional studies are needed to clarify the cause of the differences among tree species.
3.5. Comparison of the Elemental Concentrations in the Xylem Sap with Those in Tree Leaves and the Soil Solution
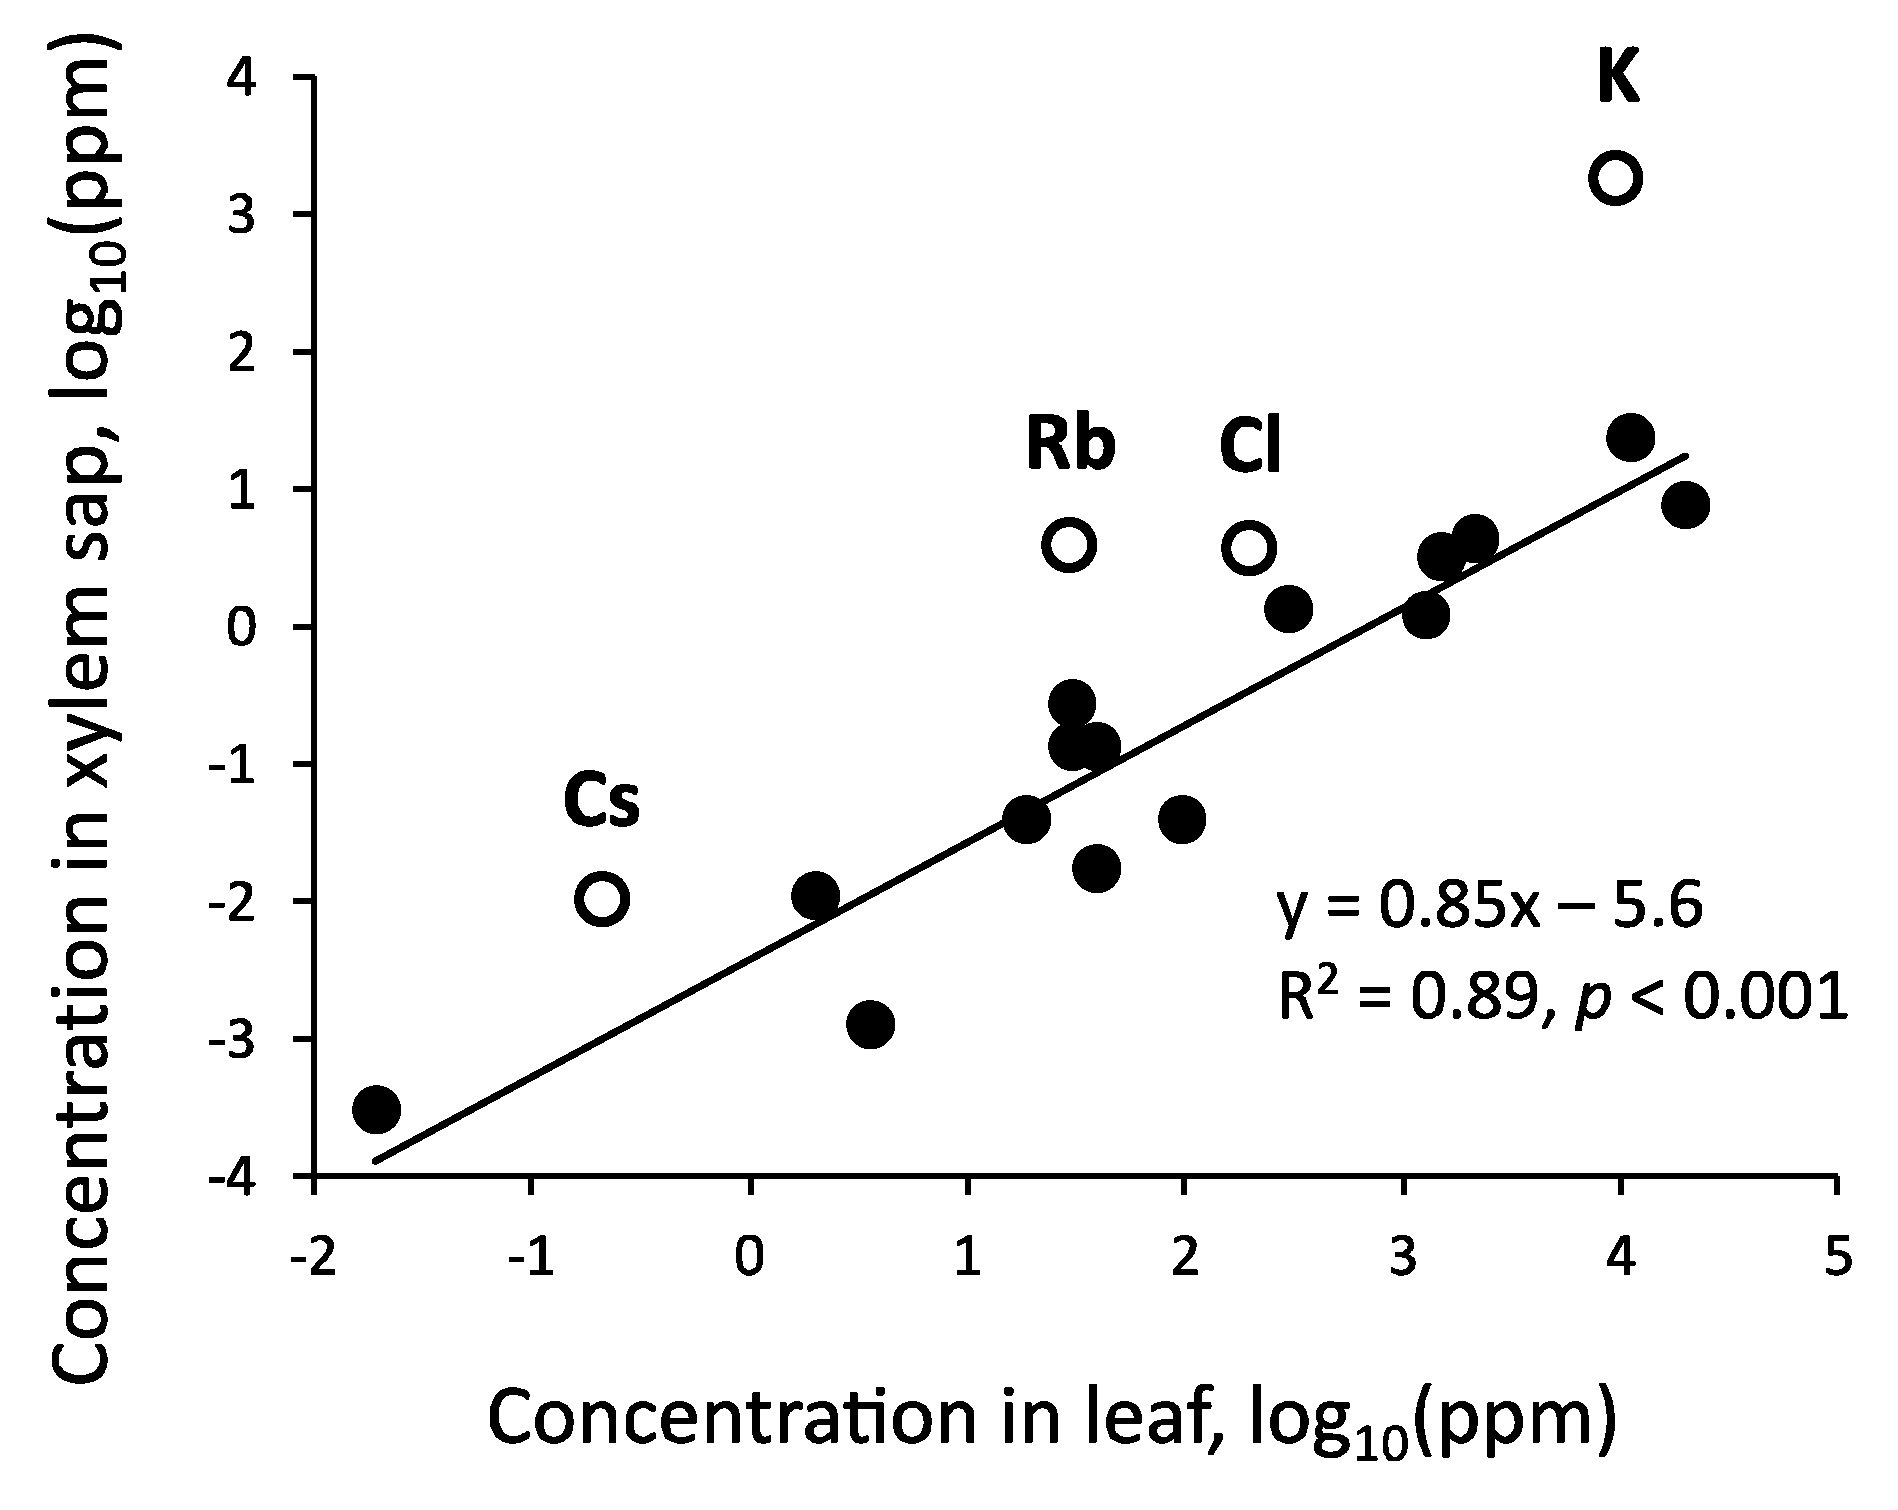
Because the xylem sap of tree trunks contains the substances absorbed by roots that are required by the various organs of trees, their concentrations are expected to be related to those in tree tissues. The relationships between the mean concentrations of 19 elements in the xylem sap (Table 2, Table 3 and Table 4) and those in the tree leaves (Appendix A, Table A2), which were determined using data for Q. serrata, are presented on two log scales in Figure 7. A linear relationship was observed for all elements, with the exception of alkali metals and Cl. The concentrations of alkali metals and Cl were higher than those expected from the regression line. Earlier research indicated K (and incidentally Rb and Cs) is absorbed selectively by trees [100,143], but it also circulates within the tree body via phloem–xylem exchange [92,144]. Additionally, Cl often accompanies alkali metals as a counter anion. Alkali metals and Cl can be easily leached in the tree canopy [145], and the loss of these elements can be partially compensated for by their increased concentrations in sap. These factors jointly contribute to increases in the concentrations of alkali metals and Cl in xylem sap.
The ratios of the concentrations in xylem sap to those in leaves were related to the atomic numbers of the alkali metals in Q. serrata and the atomic numbers of the alkali and alkaline-earth metals in C. japonica (Appendix A, Table A2). This might be explained by the combined effect of the selective absorption of elements by trees, the mobility of elements within tree bodies, and the leachability of elements in tree canopies. Furthermore, the ratios of the concentrations of Ca, Sr, Ba, Mn, and Cd in the xylem sap to those in the leaves were lower in C. japonica than in Q. serrata. The secondary phloem tissues of C. japonica accumulate the precipitate of calcium oxalate [146,147]. In addition to the congeneric Sr and Ba [148], Mn and Cd with ionic radii similar to that of Ca [149,150] are incorporated by co-precipitation. Although there are several theories on the function of the Ca precipitate [151], its formation may be related to the low concentrations of these elements in the xylem sap of C. japonica.
The concentration ranges of the 19 elements contained in the xylem sap of the two tree species and the soil solution (Appendix A, Table A1) are presented in Figure 8. The essential macro-elements of plants other than N, especially K, were present in larger quantities in the xylem sap than in the soil solution, suggesting that these elements are actively absorbed by the trees. The concentrations of Fe and Cr were also relatively high in the xylem sap. Plant roots and rhizospheric microbes secrete siderophores, and their concentrations are often 10–50 times higher in the rhizosphere than in the bulk soil [152]. Because siderophores enhance the dissolution of Fe [153] and Cr [154], the effective concentrations of both elements might have been higher in the tree rhizospheric solution than in the soil solution. Moreover, the concentrations of Ba and Mn in the sap of Q. serrata were higher than those in the soil solution. As described previously, this likely stems from the elemental requirements of Q. serrata; however, the soluble concentration of Mn in the rhizosphere might have been increased by the root exudates [155]. The Al concentrations in the xylem sap were slightly lower than those in the soil solution. Because Al is toxic to trees [156], its absorption may have been suppressed by the barrier function of the trees [157]. The concentration ranges of the other elements were almost the same in the xylem sap and the soil solution, implying they may have been acquired by the trees through the absorption of moisture.
4. Conclusions
Water-absorbing resin is useful for the non-destructive and convenient sampling of xylem sap. Repeated sampling from the same trees is also possible because the trees are not damaged and continue to grow healthily after sampling. This method is appropriate for characterizing weekly or monthly mean concentrations of xylem sap components. Because the amount of xylem sap collected by this sampling method is relatively large (5–15 mL), multiple components in the same sap sample, including proteins, enzymes, hormones, alkaloids, and radioactive substances, can be analyzed in addition to the components analyzed in this study. This sampling method may be applicable for trees in various environments, including arid regions because adequate amounts of xylem sap can be sampled even in winter when the sap flow rate is very low.
The concentrations of major elements in the xylem sap of Q. serrata and C. japonica were mostly within the range of or slightly lower than those in other tree species examined in previous studies. Thus, our findings were generally consistent with the results of earlier studies, but the K concentrations were much higher. Furthermore, the abundance ratios of SO4-S and organic S differed from those reported in previous studies. The utility of the sampling and analytical methods may need to be re-examined in future studies. The seasonal variation in the concentrations of the xylem sap components (e.g., K) of Q. serrata and C. japonica seemed to be associated with the physiological activities, such as growth and photosynthesis, of the trees, but the seasonal variation patterns differed from those reported for many other tree species. The causes of such differences remain to be explored, especially the effects of various factors, such as leaf type (needle leaves vs. broad leaves), tree type (evergreen vs. deciduous), root and branch pressure, and taxonomic background (families and genera).
Author Contributions
Conceptualization, T.T.; methodology, T.T.; validation, M.W. and M.K.K.; investigation, T.T. and M.W.; resources, M.W. and M.K.K.; data curation, T.T., M.W. and M.K.K.; writing—original draft preparation, T.T.; writing—review and editing, T.T., M.W. and M.K.K. All authors have read and agreed to the published version of the manuscript.
Funding
This study was supported by the ordinary research fund provided by the National Institute for Environmental Studies, Japan (2125AV007 and 2125AA109), as well as JSPS KAKENHI Grant Number 19K06132.
Data Availability Statement
Not applicable.
Acknowledgments
We performed the ICP-AES and ICP-MS analyses using the Fundamental Instruments for Measurement and Analysis (FIMA), National Institute for Environmental Studies, Japan. We thank the operators for their valuable assistance in the analyses. We also thank S.S. Matsuzaki and A. Takahashi for help with the statistical analysis and experiments and the pretreatment of the samples, respectively. We thank Edanz (https://jp.edanz.com/ac, accessed on 30 November 2022 and 1 February 2023) for editing a draft of this manuscript. We thank anonymous reviewers for their valuable remarks regarding an earlier version of this manuscript.
Conflicts of Interest
The authors have no conflicts of interest to declare.
Appendix A

Table A1.
Concentrations of elements in the soil solutions from the granite areas of Mt. Tsukuba.
| Element | Conc. Unit | Median (or Mean *) | Q1 (or Min **) | Q3 (or Max ***) | n |
|---|---|---|---|---|---|
| K | ppm | 0.6 | 0.2 | 2.4 | 906 |
| Rb | ppb | 4.3 * | 2.8 ** | 6.6 *** | 5 |
| Cs | ppb | 0.010 * | 0.008 ** | 0.013 *** | 5 |
| Mg | ppm | 1.2 | 0.7 | 1.8 | 906 |
| Ca | ppm | 5.4 | 2.9 | 9.7 | 906 |
| Sr | ppb | 42 | 22 | 66 | 817 |
| Ba | ppb | 30 | 10 | 79 | 701 |
| Al | ppm | 0.34 | 0.02 | 1.0 | 906 |
| Cr | ppb | 0.09 | 0.06 | 0.29 | 63 |
| Mn | ppm | 0.07 | 0.01 | 0.15 | 906 |
| Fe | ppb | 3.0 | 1.3 | 6.9 | 906 |
| Ni | ppb | 4 | 1 | 14 | 63 |
| Cu | ppb | 6 | 3 | 14 | 763 |
| Zn | ppb | 24 | 10 | 54 | 817 |
| Cd | ppb | 0.34 | 0.14 | 0.46 | 63 |
| N (as NO3−) | ppm | 4.8 | 2.4 | 8.6 | 906 |
| P (1) | ppm | – | 0.001 ** | 0.4 *** | – |
| S | ppm | 1.0 | 0.6 | 2.0 | 701 |
| Cl (as Cl−) | ppm | 3.2 | 1.8 | 4.9 | 906 |
The soil solution samples were collected at different soil depths (10–175 cm) in the three granite areas of Mt. Tsukuba using ceramic or glass-fiber porous cup samplers under reduced pressure. The sampling period was November 2003–February 2013. The three areas were all artificial C. japonica forests. The samples collected were filtered and subjected to elemental analyses by ICP-AES/MS and ion chromatography. Q1 and Q3: First and third quartiles. n: number of samples. Missing values were cited from the literature: (1) [158].
Table A2.
Concentrations (ppm) of elements in the leaves of Q. serrata and C. japonica.
| Element | Q. serrata (n = 5) | R * | C. japonica (n = 47) | R ** |
|---|---|---|---|---|
| K | 9610 ± 410 | 185 | 4200 ± 950 | 443 |
| Rb | 29.8 ± 0.7 | 131 | 10.5 ± 2.1 | 343 |
| Cs | 0.21± 0.01 | 47.1 | 0.030 ± 0.005 | 90.0 |
| Mg | 2130 ± 20 | 2.1 | 1180 ±160 | 11.0 |
| Ca | 10,950 ± 130 | 2.2 | 12,290 ± 1840 | 1.1 |
| Sr | 30.3 ± 0.3 | 4.5 | 62.8 ± 13.4 | 0.81 |
| Ba | 30.0 ± 0.4 | 9.3 | 13.2 ± 3.5 | 0.34 |
| Al | 39.1 ± 2.1 | 3.4 | 115 ± 41 | 0.84 |
| Cr | 3.6 ± 0.6 | 0.36 | 0.37 (3) | 3.0 |
| Mn | 301 ± 5 | 4.5 | 28.8 ± 6.5 | 0.12 |
| Fe | 95.0 ± 4.4 | 0.42 | 110 ± 33 | 0.14 |
| Ni | 2.0 ± 0.3 | 5.5 | 0.22 ± 0.06 | 6.8 |
| Cu | 38.4 ± 1.3 | 0.44 | 3.1 ± 0.7 | 9.4 |
| Zn | 18.8 ± 0.2 | 2.1 | 6.8 ± 1.4 | 4.0 |
| Cd | 0.019 ± 0.002 | 15.8 | 0.079 ± 0.016 | 1.3 |
| N | 19,500 (1) | 0.40 | 11,160 ± 1560 | 0.27 |
| P | 1280 ± 20 | 1.0 | 765 ± 157 | 1.7 |
| S | 1510 ± 30 | 2.1 | 890 ± 120 | 1.4 |
| Cl | 200 (2) | 18.4 | 270 (4) | 13.0 |
The Q. serrata leaves were collected randomly from three adult trees at the study site of Mt. Tsukuba (in August 2019) and combined. The C. japonica leaves (47 samples) were collected randomly from three adult trees harvested in the granite (with metamorphic rock) areas of Mt. Tsukuba (in February 2013). The leaf samples were washed with water (only for Q. serrata); dried at 80 °C; pulverized; digested with HNO3 or a mixture of HNO3, HClO4, and HF (for C. japonica); and subjected to an analysis by ICP-AES/MS (analyses were repeated five times for Q. serrata and once for C. japonica). N was analyzed using an NC analyzer. R * and R **: ratios of the concentrations of elements in the xylem sap (ppb) to those in leaves (ppm) for Q. serrata and C. japonica, respectively. Missing values were cited from the literature: (1) [159], (2) [160], (3) [161], and (4) [162].
References
- Alexou, M.; Peuke, A.D. Methods for xylem sap collection. Methods Mol. Biol. 2013, 953, 195–207. [Google Scholar] [PubMed]
- Schurr, U. Xylem sap sampling—New approaches to an old topic. Trends Plant Sci. 1998, 3, 293–298. [Google Scholar] [CrossRef]
- Schurr, U.; Schulze, E.D. The concentration of xylem sap constituents in root exudate, and in sap from intact, transpiring castor bean plants (Ricinus communis L.). Plant Cell Environ. 1995, 18, 409–420. [Google Scholar] [CrossRef]
- Siebrecht, S.; Tischner, R. Changes in the xylem exudate composition of poplar (Populus tremula x P. alba)—Dependent on the nitrogen and potassium supply. J. Exp. Bot. 1999, 50, 1797–1806. [Google Scholar] [CrossRef]
- Anetai, M.; Kojima, H.; Katoh, Y.; Uchino, E.; Izumi, T.; Hori, Y. Time course study of some constituents in sap of Japanese white birch. Rep. Hokkaido Inst. Pub. Health 2000, 50, 41–46, (In Japanese with English Abstract). [Google Scholar]
- Anetai, M.; Kojima, H.; Katoh, Y.; Uchino, E.; Izumi, T.; Hori, Y. A study of constituents in sap of painted maple, Japanese walnut and gloryvine grape. Rep. Hokkaido Inst. Pub. Health 2001, 51, 7–12, (In Japanese with English Abstract). [Google Scholar]
- Jiang, H.; Sakamoto, Y.; Tamai, Y.; Terazawa, M. Proteins in the exudation sap from birch trees, Betula platyphylla Sukatchev var. japonica Hara and Betula verrucosa Her. Eurasian J. For. Res. 2001, 2, 59–64. [Google Scholar]
- Buhtz, A.; Kolasa, A.; Arlt, K.; Walz, C.; Kehr, J. Xylem sap protein composition is conserved among different plant species. Planta 2004, 219, 610–618. [Google Scholar] [CrossRef]
- Bityutskii, N.; Yakkonen, K.; Petrova, A.; Nadporozhskaya, M. Xylem sap mineral analyses as a rapid method for estimation plant-availability of Fe, Zn and Mn in carbonate soils: A case study in cucumber. J. Soil Sci. Plant Nutr. 2017, 17, 279–290. [Google Scholar] [CrossRef]
- Scholander, P.F.; Hammel, H.T.; Bradstreet, E.D.; Hemmingsen, E.A. Sap pressure in vascular plants: Negative hydrostatic pressure can be measured in plants. Science 1965, 148, 339–346. [Google Scholar] [CrossRef]
- Stark, N.; Spitzner, C.; Essig, D. Xylem sap analysis for determining nutritional status of trees: Pseudotsuga menziesii. Can. J. Forest Res. 1985, 15, 429–437. [Google Scholar] [CrossRef]
- Weber, P.; Stoermer, H.; Gebler, A.; Schneider, S.; von Sengbusch, D.; Hanemann, U.; Rennenberg, H. Metabolic response of Norway spruce (Picea abies) trees to long-term forest management practices and acute (NH4)2SO4 fertilization: Transport of soluble non-protein nitrogen compounds in xylem and phloem. New Phytol. 1998, 140, 461–475. [Google Scholar] [CrossRef]
- Millard, P.; Wendler, R.; Hepburn, A.; Smith, A. Variations in the amino acid composition of xylem sap of Betula pendula Roth. trees due to remobilization of stored N in the spring. Plant Cell Environ. 1998, 21, 715–722. [Google Scholar] [CrossRef]
- Smith, K.T.; Shortle, W.C. Conservation of element concentration in xylem sap of red spruce. Trees 2001, 15, 148–153. [Google Scholar] [CrossRef]
- Guak, S.; Neilsen, D.; Millard, P.; Wendler, R.; Neilsen, G.H. Determining the role of N remobilization for growth of apple (Malus domestica Borkh.) trees by measuring xylem-sap N flux. J. Exp. Bot. 2003, 54, 2121–2131. [Google Scholar] [CrossRef]
- Passioura, J.B. The transport of water from soil to shoot in wheat seedlings. J. Exp. Bot. 1980, 31, 333–345. [Google Scholar] [CrossRef]
- Schurr, U.; Schulze, E.D. Effect of drought on nutrient transport and ABA transport in Ricinus communis. Plant Cell Environ. 1996, 19, 665–674. [Google Scholar] [CrossRef]
- Yong, J.W.H.; Wong, S.C.; Letham, D.S.; Hocart, C.H.; Farquhar, G.D. Effects of elevated [CO2] and nitrogen nutrition on cytokinins in the xylem sap and leaves of cotton. Plant Physiol. 2000, 124, 767–779. [Google Scholar] [CrossRef]
- Bollard, E.G. The use of tracheal sap in the study of apple-tree nutrition. J. Exp. Bot. 1953, 4, 363–368. [Google Scholar] [CrossRef]
- Milburn, J.A.; Ranasinghe, M.S. A comparison of methods for studying pressure and solute potentials in xylem and also in phloem laticifers of Hevea brasiliensis. J. Exp. Bot. 1996, 47, 135–143. [Google Scholar] [CrossRef]
- Nabais, C.; Hagemeyer, J.; Freitas, H. Nitrogen transport in the xylem of Quercus ilex: The role of ornithine. J. Plant Physiol. 2005, 162, 603–606. [Google Scholar] [CrossRef] [PubMed]
- Alves, S.; Gonçalves, M.L.S.; dos Santos, M.M.C. Determination of nickel, calcium and magnesium in xylem sap by flame atomic absorption spectrometry using a microsampling technique. Phytochem. Anal. 2009, 20, 365–371. [Google Scholar] [CrossRef] [PubMed]
- Ito, A.; Sugiura, T.; Sakamoto, D.; Moriguchi, T. Effects of dormancy progression and low-temperature response on changes in the sorbitol concentration in xylem sap of Japanese pear during winter season. Tree Physiol. 2013, 33, 398–408. [Google Scholar] [CrossRef] [PubMed] [Green Version]
- Killiny, N.; Hijaz, F. Chemical compositeon of xylem sap from Citrus sinensis L. Osbeck (sweet orange). Proc. Fla. State Hort. Soc. 2015, 128, 114–118. [Google Scholar]
- Newby, R.C. The use of insects for sampling xylem sap. Ann. Bot. 1980, 45, 213–215. [Google Scholar] [CrossRef]
- Malone, M.; Herron, M.; Morales, M.-A. Continuous measurement of macronutrient ions in the transpiration stream of intact plants using the meadow spittlebug coupled with ion chromatography. Plant Physiol. 2002, 130, 1436–1442. [Google Scholar] [CrossRef]
- Miller, S.M.; Hunt, L.C. Collection of xylem sap from apple trees by vacuum. Can. J. Plant Sci. 1971, 51, 438–439. [Google Scholar] [CrossRef]
- Mori, A.; Haibara, K.; Aiba, Y. Seasonal and diurnal variations of mineral concentrations in the branch xylem sap of Cornus contriversa. J. Jpn. For. Soc. 1991, 73, 466–470, (In Japanese with English Abstract). [Google Scholar]
- Furukawa, J.; Abe, Y.; Mizuno, H.; Matsuki, K.; Sagawa, K.; Kojima, M.; Sakakibara, H.; Iwai, H.; Satoh, S. Seasonal fluctuation of organic and inorganic components in xylem sap of Populus nigra. Plant Root 2011, 5, 56–62. [Google Scholar] [CrossRef]
- Glavac, V.; Koenies, H.; Ebben, U. Seasonal variations in mineral concentrations in the trunk xylem sap of beech (Fagus sylvatica L.) in a 42-year-old beech forest stand. New Phytol. 1990, 116, 47–54. [Google Scholar] [CrossRef]
- Rennenberg, H.; Schupp, R.; Glavac, V.; Jochheim, H. Xylem sap composition of beech (Fagus sylvatica L.) trees: Seasonal changes in the axial distribution of sulfur compounds. Tree Physiol. 1994, 14, 541–548. [Google Scholar] [CrossRef]
- Chen, L.; Cao, Y.; Zhang, Z.; Liu, X.; Teramage, M.T.; Zhang, X.; Sun, X. Characteristics of chemical components in the trunk xylem sap of pine trees by means of a centrifugation collection method. Plant Physiol. Biochem. 2019, 142, 482–489. [Google Scholar] [CrossRef]
- Forestry Agency. Types of forest ecosystem. (In Japanese). Available online: https://www.rinya.maff.go.jp/j/keikaku/tayouseichousa/taipu.html (accessed on 1 March 2022).
- Ministry of Land, Infrastructure, Transport and Tourism. Fundamental Land Classification Survey—Geomorphology, Subsurface Geology & Soil–, 1:50,000 (Makabe). (In Japanese). Available online: https://nlftp.mlit.go.jp/kokjo/inspect/landclassification/land/5-1/prefecture08.html#prefecture08-04 (accessed on 1 March 2022).
- Japan Meteorological Agency. Search for the Past Meteorological Data. (In Japanese). Available online: http://www.data.jma.go.jp/obd/stats/etrn/index.php (accessed on 1 March 2022).
- Masuda, F.; Tanaka, K. Super water-absorbing polymer and its use. J. Home Econ. Jpn. 1989, 40, 721–724. (In Japanese) [Google Scholar]
- Sakimoto, S.; Hosoda, K. Development of Concentration Technology. (In Japanese). Available online: https://agriknowledge.affrc.go.jp/RN/2039016818.pdf (accessed on 16 January 2023).
- Charlot, G. L’analyse Qualitative et les Réactions en Solution, 4th ed.; Masson et Cie: Paris, France, 1957; 365p. [Google Scholar]
- Martell, A.E. Stability Constants of Metal-Ion Complexes, Section II: Organic Ligands, Special Publication No. 17; Chemical Society: London, UK, 1964; 754p. [Google Scholar]
- Okamoto, K.; Matsushima, A.; Ota, T.; Akasaki, T. A comparative study on the amino nitrogen values determined by the Van Slyke method, Sorensen method, and ninhydrin colorimetric method. Rep. Central Customs Labo. 2013, 53, 11–17, (In Japanese with English Abstract). [Google Scholar]
- Moore, S.; Stein, W.H. Photometric ninhydrin method for use in the chromatography of amino acids. J. Biol. Chem. 1948, 176, 367–388. [Google Scholar] [CrossRef]
- Moore, S.; Stein, W.H. A modified ninhydrin reagent for the photometric determination of amino acids and related compounds. J. Biol. Chem. 1954, 211, 907–913. [Google Scholar] [CrossRef]
- Searle, P.L. The berthelot or indophenol reaction and its use in the analytical chemistry of nitrogen. A review. Analyst 1984, 109, 549–568. [Google Scholar] [CrossRef]
- Kempers, A.J.; Kok, C.J. Re-examination of the determination of ammonium as the indophenol blue complex using salicylate. Anal. Chim. Acta 1989, 221, 147–155. [Google Scholar] [CrossRef]
- Rhine, E.D.; Sims, G.K.; Mulvaney, R.L.; Pratt, E.J. Improving the Berthelot reaction for determining ammonium in soil extracts and water. Soil Sci. Soc. Am. J. 1998, 62, 473–480. [Google Scholar] [CrossRef]
- Arakawa, Y.; Akagi, I.; Yamamoto, K. Determination of ammonium nitrogen in KCl extracts of cropland soils by using 2-hydroxybiphenyl sodium salt. Jpn. J. Soil Sci. Plant Nutr. 2003, 74, 657–659. (In Japanese) [Google Scholar]
- DuBois, M.; Gilles, K.A.; Hamilton, J.K.; Rebers, P.A.; Smith, F. Colorimetric method for determination of sugars and related substances. Anal. Chem. 1956, 28, 350–356. [Google Scholar] [CrossRef]
- Kitamura, S.; Nakaya, M. Determination methods of sugars. Seibutu-Kogaku Kaishi 2012, 90, 790–793. (In Japanese) [Google Scholar]
- Hashimoto, K.; Isobe, N.; Takahashi, Z. Studies on the carbohydrates of plants, Fractional quantitative analysis of carbohydrate pattern in agricultural products. Rep. Toyo Inst. Food Tech. 1967, 8, 395–403, (In Japanese with English Abstract). [Google Scholar]
- Fujikawa, T.; Shiomi, M.; Mukai, S.; Wada, M. Investigation of the phenol-sulfuric acid method for the quantitative analysis of sugar, mainly on the influence of impurity. J. Agric. Chem. Soc. Jpn. 1974, 48, 483–491, (In Japanese with English Abstract). [Google Scholar]
- Fiora, A.; Cescatti, A. Vertical foliage distribution determines the radial pattern of sap flux density in Picea abies. Tree Physiol. 2008, 28, 1317–1323. [Google Scholar] [CrossRef]
- Čermák, J.; Nadezhdina, N.; Trcala, M.; Simon, J. Open field-applicable instrumental methods for structural and functional assessment of whole trees and stands. iForest 2015, 8, 226–278. [Google Scholar] [CrossRef]
- Nadezhdina, N.; Čermák, J.; Ceulemans, R. Radial patterns of sap flow in woody stems of dominant and understory species: Scaling errors associated with positioning of sensors. Tree Physiol. 2002, 22, 907–918. [Google Scholar] [CrossRef]
- Kumagai, T.; Aoki, S.; Nagasawa, H.; Mabuchi, T.; Kubota, K.; Inoue, S.; Utsumi, Y.; Otsuki, K. Effects of tree-to-tree and radial variations on sap flow estimates of transpiration in Japanese cedar. Agric. For. Meteorol. 2005, 135, 110–116. [Google Scholar] [CrossRef]
- Matisons, R.; Bardulis, A.; Kanberga-Silina, K.; Krisans, O.; Jansons, A. Sap flow in xylem of mature Norway spruce: A case study in Northwestern Latvia during the season of 2014–2015. Baltic Forestry 2017, 23, 477–481. [Google Scholar]
- Kubota, M.; Tenhunen, J.; Zimmermann, R.; Schmidt, M.; Kakubari, Y. Influence of environmental conditions on radial patterns of sap flux density of a 70-year Fagus crenata trees in the Naeba Mountains. Ann. For. Sci. 2005, 62, 289–296. [Google Scholar] [CrossRef]
- Sato, T.; Oda, T.; Igarashi, Y.; Suzuki, M.; Uchiyama, Y. Circumferential sap flow variation in the trunks of Japanese cedar and cypress trees growing on a steep slope. Hydrol. Res. Lett. 2012, 6, 104–108. [Google Scholar] [CrossRef]
- Annamalainathan, K.; Joseph, J.; Alam, B.; Satheesh, P.R.; Jacob, J. Seasonal changes in xylem sap flow rate in mature rubber plants. J. Plant. Crops 2013, 41, 343–349. [Google Scholar]
- Zhang, J.-G.; He, Q.-Y.; Shi, W.-Y.; Otsuki, K.; Yamanaka, N.; Du, S. Radial variations in xylem sap flow and their effect on whole-tree water use estimates. Hydrol. Process. 2015, 29, 4993–5002. [Google Scholar] [CrossRef]
- Sato, T.; Tanaka, N.; Inoue, M.; Sawada, H.; Watanabe, S.; Suzuki, M. Report on an experiment of dye injection into xylem sap of a Quercus serrata tree in University Forest in Aichi. Miscellaneous Info. Univ. Tokyo For. 2010, 49, 29–41, (In Japanese with English Abstract). [Google Scholar]
- Takeuchi, N. Measurement of evapotranspiration rate using a lysimeter method. Water Sci. 1989, 33, 70–84. (In Japanese) [Google Scholar]
- Kondo, T.; Ohga, S. Bud break and water movement of deciduous broad-leaved trees (review). Bull. Kyushu Univ. For. 2000, 81, 63–76, (In Japanese with English Abstract). [Google Scholar]
- Komiyama, A. Relationships between stem-diameter growth periods and leaf growth periods of deciduous broadleaved tree species with reference to environmental factors. J. Jpn. For. Soc. 1991, 73, 409–418, (In Japanese with English abs.tract). [Google Scholar]
- Yamashita, K.; Okada, N.; Kamo, K. Application of the wire dendrometer for monitoring the radial growth of trees, A comparison with the conventional band dendrometer and the pinning method. J. Japan Wood Res. Soc. 2006, 52, 8–18, (In Japanese with English Abstract). [Google Scholar] [CrossRef]
- Motoyanagi, Y.; Chiba, Y.; Kawasaki, T.; Migita, C.; Sato, A. Relationship between climate conditions and tree growths and canopy foliage dynamics in a Quercus serrata forest in Tsukuba, Japan. Kanto J. For. Res. 2014, 65, 319–322, (In Japanese with English Abstract). [Google Scholar]
- Sánchez-Costa, E.; Poyatos, R.; Sabaté, S. Contrasting growth and water use strategies in four co-occurring Mediterranean tree species revealed by concurrent measurements of sap flow and stem diameter variations. Agric. For. Meteorol. 2015, 207, 24–37. [Google Scholar] [CrossRef]
- Moore, D.B. Winter-dormant-season sap flow dynamics and the environmental conditions that drive them. Acta Hortic. 2020, 1300, 97–104. [Google Scholar] [CrossRef]
- Shibata, S.; Kobashi, S.; Hanayama, H. Influence of soil moisture and air temperature to photosynthetic activity of some ever-green broad-leaved trees. J. Jpn. Soc. Reveget. Tech. 1991, 17, 1–8, (In Japanese with English Abstract). [Google Scholar] [CrossRef]
- Kosugi, Y.; Shibata, S.; Matsui, K.; Kobashi, S. Differences between deciduous and evergreen broad-leaved trees in the pattern of seasonal change of leaf-scale photosynthetic net assimilation rate and transpiration rate. J. Jpn. Soc. Reveget. Tech. 1997, 22, 205–215. [Google Scholar] [CrossRef]
- Catovsky, S.; Holbrook, N.M.; Bazzaz, F.A. Coupling whole-tree transpiration and canopy photosynthesis in coniferous and broad-leaved tree species. Can. J. For. Res. 2002, 32, 295–309. [Google Scholar] [CrossRef]
- Komatsu, H.; Kume, T.; Yoshifuji, N.; Hotta, N.; Suzuki, M. Transpiration of a Cryptomeria japonica plantation in winter: Analysis based on one-year sap flow measurements. Bull. Tokyo Univ. For. 2007, 117, 1–9. [Google Scholar]
- Liu, X.; Zhang, B.; Zhuang, J.-Y.; Han, C.; Zhai, L.; Zhao, W.-R.; Zhang, J.-C. The relationship between sap flow density and environmental factors in the Yangtze River delta region of China. Forests 2017, 8, 74. [Google Scholar] [CrossRef]
- Zhao, X.-w.; Ouyang, L.; Zhao, P.; Zhang, C.-f. Effects of size and microclimate on whole-tree water use and hydraulic regulation in Schima superba trees. PeerJ 2018, 6, e5164. [Google Scholar] [CrossRef]
- Xu, S.; Yu, Z. Environmental control on transpiration: A case study of a desert ecosystem in northwest China. Water 2020, 12, 1211. [Google Scholar] [CrossRef]
- Morikawa, Y. Seasonal variation in transpiration of Chamaecyparis obtusa on clear days. J. Jpn. For. Soc. 1970, 52, 259–262. [Google Scholar]
- Ortuño, M.F.; Garcia-Orellana, Y.; Conejero, W.; Ruiz-Sánchez, M.C.; Mounzer, O.; Alarcón, J.J.; Torrecillas, A. Relationship between climatic variables and sap flow, stem water potential and maximum daily trunk shrinkage in lemon trees. Plant Soil 2006, 279, 229–242. [Google Scholar] [CrossRef]
- Pfautsch, S.; Bleby, T.M.; Rennenberg, H.; Adams, M.A. Phloem as capacitor: Radial transfer of water into xylem of tree stems occurs via symplastic transport in ray parenchyma. For. Ecol. Manag. 2010, 259, 1190–1199. [Google Scholar] [CrossRef]
- Ma, C.; Luo, Y.; Shao, M.; Li, X.; Sun, L.; Jia, X. Environmental controls on sap flow in black locust forest in Loess Plateau, China. Sci. Rep. 2017, 7, 13160. [Google Scholar] [CrossRef]
- Gupta, S.K.; Ram, J.; Singh, H. Comparative study of transpiration in cooling effect of tree species in the atmosphere. J. Geosci. Environ. Protect. 2018, 6, 151–166. [Google Scholar] [CrossRef]
- Laiju, N.; Otieno, D.; Jung, E.-Y.; Lee, B.; Tenhunen, J.; Lim, J.-H.; Sung, J.-H.; Kang, S. Environmental controls on growing-season sap flow density of Quercus serrata Thunb in a temperate deciduous forest of Korea. J. Ecol. Field Biol. 2012, 35, 213–225. [Google Scholar] [CrossRef]
- Nagakura, J.; Shigenaga, H.; Akama, A.; Takahashi, M. Growth and transpiration of Japanese cedar (Cryptomeria japonica) and Hinoki cypress (Chamaecyparis obtusa) seedlings in response to soil water content. Tree Physiol. 2004, 24, 1203–1208. [Google Scholar] [CrossRef]
- Chiu, C.-W.; Tateishi, M.; Komatsu, H.; Otsuki, K. Comparison of transpiration for Quercus serrata estimated based on the sap-flux method and measured based on the cutting-tree experiment. Bull. Kyushu Univ. For. 2014, 95, 1–4. [Google Scholar]
- Utsumi, Y. Analytical methods for water distribution and water movement in secondary xylem of trees. J. Japan Wood Res. Soc. 2013, 59, 1–12, (In Japanese with English abstract). [Google Scholar] [CrossRef]
- Kuroda, K. Tree tissue and structures and its hydraulic conductance. Green Age 2008, 417, 36–39. (In Japanese) [Google Scholar]
- Van Bel, A.J.E. Xylem-phloem exchange via the rays: The undervalued route of transport. J. Exp. Bot. 1990, 41, 631–644. [Google Scholar] [CrossRef]
- Kitin, P.; Fujii, T.; Abe, H.; Takata, K. Anatomical features that facilitate radial flow across growth rings and from xylem to cambium in Cryptomeria japonica. Ann. Bot. 2009, 103, 1145–1157. [Google Scholar] [CrossRef]
- Sane, S.P.; Singh, A.K. Water movement in vascular plants: A primer. J. Indian Inst. Sci. 2011, 9, 233–242. [Google Scholar]
- Barnard, D.M.; Lachenbruch, B.; McCulloh, K.A.; Kitin, P.; Meinzer, F.C. Do ray cells provide a pathway for radial water movement in the stems of conifer trees. Amer. J. Bot. 2013, 100, 322–331. [Google Scholar] [CrossRef] [PubMed]
- Kuroda, K. Functions of parenchyma cells in wood; material transport and heartwood formation. J. Jpn. Wood Res. Soc. 2015, 61, 131–135, (In Japanese with English abstract). [Google Scholar] [CrossRef] [Green Version]
- Kuroda, K.; Yamane, K.; Itoh, Y. Radial movement of minerals in the trunks of standing Japanese cedar (Cryptomeria japonica D. Don) trees in summer by tracer analysis. Forests 2020, 11, 562. [Google Scholar] [CrossRef]
- Mahara, Y.; Ohta, T.; Ohshima, J.; Iizuka, K. Origin and hydrodynamics of xylem sap in tree stems, and relationship to root uptake of soil water. Sci. Rep. 2021, 11, 8404. [Google Scholar] [CrossRef]
- Dambrine, E.; Martin, F.; Carisey, N.; Granier, A.; Hällgren, J.-E.; Bishop, K. Xylem sap composition: A tool for investigating mineral uptake and cycling in adult spruce. Plant Soil 1995, 168/169, 233–241. [Google Scholar] [CrossRef]
- Minato, K.; Kojima, N.; Ishimaru, Y.; Katayama, Y. Mobility of trace elements in stem of Sugi (Cryptomeria japonica D. Don) by some simple extraction methods. Bull. Kyoto Univ. For. 1990, 62, 326–337, (In Japanese with English abstract). [Google Scholar]
- Bundt, M.; Kretzschmar, S.; Zech, W.; Wilcke, W. Seasonal dynamics of nutrients in leaves and xylem sap of coffee plants as related to different soil compartments. Plant Soil 1997, 197, 157–166. [Google Scholar] [CrossRef]
- Tunca, R.I.; Ozgul, O.; Yabanli, M.; Sener, I. Evaluation of heavy metal concentrations in the xylem sap of Turkish pine (Pinus brutia Ten.) and honeydew of Marchalina hellenica, Gennadius (Hemiptera: Marchalinidae) collected in western Anatolia, Turkey. Fresenius Environ. Bull. 2018, 27, 9812–9815. [Google Scholar]
- Bilek, M.; Szwerc, W.; Kużniar, P.; Stawarczyk, K.; Kocjan, R. Time-related variability of the mineral content in birch tree sap. J. Elem. 2017, 22, 497–515. [Google Scholar] [CrossRef]
- Katakura, M. Growth and thickness of heartwood, sapwood, and bark of Quercus serrata and Quercus acutissima in Nagano Prefecture. Rep. Nagano Pref. For. Res. Ctr. 1987, 3, 7–12. (In Japanese) [Google Scholar]
- Iida, S.; Noguchi, S.; Shimizu, T.; Kaneko, T. Relationships of sapwood area and width of bark to diameter at breast height of Japanese cedar planted in the Tohoku district, Japan. J. Jpn. Assoc. Hydrol. Sci. 2017, 47, 3–9, (in Japanese with English abstract). [Google Scholar]
- Uchida, E.; Osada, K.; Nakao, K. Major and trace element chemical compositional signatures of some granitic tocks related to metal mineralization in Japan. Open J. Geol. 2017, 7, 559–576. [Google Scholar] [CrossRef]
- Uozumi, N. Ion transporters. seibutsu-kogaku kaishi 2018, 96, 589–592. (In Japanese) [Google Scholar]
- Rout, G.; Samantaray, S.; Das, P. Aluminum toxicity in plants: A review. Agronomie 2001, 21, 3–21. [Google Scholar] [CrossRef]
- Raveh, E.; Levy, Y. Analysis of xylem water as an indicator of current chloride uptake status in citrus trees. Sci. Hortic. 2005, 103, 317–327. [Google Scholar] [CrossRef]
- Pate, J.S.; Jeschke, W.D. Mineral uptake and transport in xylem and phloem of the proteaceous tree, Banksia prionotes. Plant Soil 1993, 155/156, 273–276. [Google Scholar] [CrossRef]
- Anderssen, F.G. Some seasonal changes in the tracheal sap of pear and apricot trees. Plant Physiol. 1929, 4, 459–476. [Google Scholar] [CrossRef] [Green Version]
- Köstner, B.; Schupp, R.; Schulze, E.-D.; Rennenberg, H. Organic and inorganic sulfur transport in the xylem sap and the sulfur budget of Picea abies trees. Tree Physiol. 1998, 18, 1–9. [Google Scholar] [CrossRef]
- Schupp, R.; Glavac, V.; Rennenberg, H. Thiol composition of xylem sap of beech trees. Phytochemistry 1991, 30, 1415–1418. [Google Scholar] [CrossRef]
- Schneider, A.; Kreuzwieser, J.; Schupp, R.; Sauter, J.J.; Rennenberg, H. Thiol and amino acid composition of the xylem sap of poplar trees (Populus × canadensis ‘robusta’). Can. J. Bot. 1994, 72, 347–351. [Google Scholar] [CrossRef]
- Saito, K. Sulfur assimilatory metabolism. The long and smelling road. Plant Physiol. 2004, 136, 2443–2450. [Google Scholar] [CrossRef]
- Gigolashvili, T.; Kopriva, S. Transporters in plant sulfur metabolism. Front. Plant Sci. 2014, 5, 442. [Google Scholar] [CrossRef]
- Schachtman, D.P.; Reid, R.J.; Ayling, S.M. Phosphorous uptake by plants: From soil to cell. Plant Physiol. 1998, 116, 447–453. [Google Scholar] [CrossRef]
- Escher, P.; Eiblmeier, M.; Hetzger, I.; Rennenberg, H. Spatial and seasonal variation in amino compounds in the xylem sap of a mistletoe (Viscum album) and its hosts (Populus spp. and Abies alba). Tree Physiol. 2004, 24, 639–650. [Google Scholar] [CrossRef]
- Prima-Putra, D.; Botton, B. Organic and inorganic compounds of xylem exudates from five woody plants at the stage of bud breaking. J. Plant Physiol. 1998, 153, 670–676. [Google Scholar] [CrossRef]
- Suzuki, T.; Kohno, K. Changes in the nitrogen compounds of xylem sap of mulberry (Morus alba L.) during regrowth after pruning. Ann. Bot. 1983, 51, 441–448. [Google Scholar] [CrossRef]
- Grassi, G.; Millard, P.; Wendler, R.; Minotta, G.; Tagliavini, M. Measurement of xylem sap amino acid concentrations in conjugation with whole tree transpiration estimates spring N remobilization by cherry (Prunus avium L.) trees. Plant Cell Environ. 2002, 25, 1689–1699. [Google Scholar] [CrossRef]
- Biles, C.L.; Abeles, F.B. Xylem sap proteins. Plant Physiol. 1991, 96, 597–601. [Google Scholar] [CrossRef]
- Soper, F.M.; Richards, A.E.; Siddique, I.; Aidar, M.P.M.; Cook, G.D.; Hutley, L.B.; Robinson, N.; Schmidt, S. Natural abundance (δ15N) indicates shifts in nitrogen relations of woody taxa along a savanna-woodland continental rainfall gradient. Oecologia 2015, 178, 297–308. [Google Scholar] [CrossRef]
- Stewart, G.R.; Pearson, J.; Kershaw, J.L.; Clough, E.C.M. Biochemical aspects of inorganic nitrogen assimilation by woody plants. Ann. Sci. For. 1989, 46, 648s–653s. [Google Scholar] [CrossRef]
- Suzuki, T. Physiology and ecology of forest trees, focusing on nutrition and metabolism (assimilation) of nitrogen. Kagaku To Seibutsu 1993, 31, 621–626. (In Japanese) [Google Scholar] [CrossRef]
- Miller, A.J.; Cramer, M.D. Root nitrogen acquisition and assimilation. Plant Soil 2004, 274, 1–36. [Google Scholar] [CrossRef]
- Fukasawa, Y.; Kuishi, T.; Seiwa, K. Underground of forest edges–role of mycorrhizal communities on seedling establishment. Japanese J. Ecol. 2013, 63, 239–249. (In Japanese) [Google Scholar]
- Toju, H.; Yamamoto, S.; Sato, H.; Tanabe, A.S.; Gilbert, G.S.; Kadowaki, K. Community composition of root-associated fungi in a Quercus-dominated temperate forest: “codominance” of mycorrhizal and root-endophytic fungi. Ecol. Evol. 2013, 3, 1281–1293. [Google Scholar] [CrossRef]
- Kimoto, R.; Sone, K.; Hata, K. The infection of Japanese cedar by arbuscular mycorrhizal fungi in Takakuma Experimental Forest of Kagoshima University. Kyushu J. For. Res. 2013, 66, 17–20. (In Japanese) [Google Scholar]
- Govindarajulu, M.; Pfeffer, P.E.; Jin, H.; Abubaker, J.; Douds, D.D.; Allen, J.W.; Bücking, H.; Lammers, P.J.; Shachar-Hill, Y. Nitrogen transfer in the arbuscular mycorrhizal symbiosis. Nature 2005, 435, 819–823. [Google Scholar] [CrossRef]
- Castro-Rodriguez, V.; Cañas, R.A.; de la Torre, F.N.; Pascual, M.B.; Avila, C.; Cánovas, F.M. Molecular fundamentals of nitrogen uptake and transport in trees. J. Exp. Bot. 2017, 68, 2489–2500. [Google Scholar] [CrossRef]
- Makarov, M.I. The role of mycorrhiza in transformation of nitrogen compounds in soil and nitrogen nutrition of plants: A review. Eurasian Soil Sci. 2019, 52, 193–205. [Google Scholar] [CrossRef]
- Kato, T.; Yamagata, M.; Tsukahara, S. Seasonal variations in nitrogenous compounds in xylem sap of Satsuma mandarin trees. J. Japan. Soc. Hort. Sci. 1984, 53, 13–16. [Google Scholar] [CrossRef] [Green Version]
- Loescher, W.H.; McCamant, T.; Keller, J.D. Carbohydrate reserves, translocation, and storage in woody plant roots. HortScience 1990, 25, 274–281. [Google Scholar] [CrossRef]
- Ketchie, D.O.; Lopushinsky, W. Composition of Root Pressure Exudate from Conifers; Department of Agriculture, Forest Service, Pacific Northwest Forest and Range Experiment Station: Portland, OR, USA, 1981; pp. 1–7. [Google Scholar]
- Kumagai, T.; Aoki, S.; Shimizu, T.; Otsuki, K. Sap flow estimates of stand transpiration at two slope positions in a Japanese ceder forest watershed. Tree Physiol. 2007, 27, 161–168. [Google Scholar] [CrossRef]
- Wind, C.; Arend, A.; Fromm, J. Potassium-dependent cambial growth in poplar. Plant Biol. 2004, 6, 30–37. [Google Scholar]
- Fromm, J. Wood formation of trees in relation of potassium and calcium nutrition. Tree Physiol. 2010, 30, 1140–1147. [Google Scholar] [CrossRef]
- Hamada, S.; Kumagai, T.; Kochi, K.; Kobayashi, N.; Hiyama, T.; Miyazawa, Y. Spatial and temporal variations in photosynthetic capacity of a temperate deciduous-evergreen forest. Trees 2016, 30, 1083–1093. [Google Scholar] [CrossRef]
- Yasue, K. Clarification of the mechanisms of variations in radial growth and wood properties of Cryptomeria japonica and Chamaecyparis obtusa due to climate change. In Research Report on Grants-in-Aid for Scientific Research (B); Ministry of Education, Culture, Sports, Science and Technology: Tokyo, Japan, 2018; (In Japanese with English abstract); Available online: https://kaken.nii.ac.jp/file/KAKENHI-PROJECT-26292092/26292092seika.pdf (accessed on 1 March 2022).
- Tighe-Neira, R.; Alberdi, M.; Arce-Johnson, P.; Romero, J.; Reyes, M.; Rengel, Z.; Inostroza-Blancheteau, C. Role of potassium in governing photosynthetic processes and plant yield. In Plant Nutrients and Abiotic Stress Tolerance; Hasanuzzaman, M., Fujita, M., Oku, H., Nahar, K., Hawrylak-Nowak, B., Eds.; Springer: Singapore, 2018; pp. 191–203. [Google Scholar]
- Tränkner, M.; Tavakol, E.; Jákli, B. Functioning of potassium and magnesium in photosynthesis, photosynthate translocation and photoprotection. Physiol. Plant. 2018, 163, 414–431. [Google Scholar] [CrossRef]
- Yamori, W.; Hikosaka, K.; Way, D.A. Temperature response of photosynthesis in C3, C4, and CAM plants: Temperature acclimation and temperature adaptation. Photosynth. Res. 2014, 119, 101–117. [Google Scholar] [CrossRef]
- Dalmolin, A.C.; Dalmagro, H.J.; De A. Lobo, F.; Antunes Jr., M.Z.; Ortiz, C.E.R.; Vourlitís, G.L. Photosynthetic light and carbon dioxide response of the invasive tree, Vochysia divergens Pohl, to experimental flooding and shading. Photosynthetica 2013, 51, 379–386. [Google Scholar] [CrossRef]
- Pereira, S.; Frosi, G.; de Oliveira, M.T.; Lustosa, B.M.; Arruda, E.P.; Santos, M.G. Changes in phenotypic variability of two tropical woody species due to short and long-term exposure to different irradiances. Bragantia 2018, 77, 429–439. [Google Scholar] [CrossRef]
- Tohyama, T.; Ishii, Y.; Kamuro, Y.; Okabe, K. Seasonal light quality for plant growth. Reg. Plant Growth Develop. 2001, 36, 202–207. (In Japanese) [Google Scholar]
- Schaberg, P.G.; Snyder, M.C.; Shane, J.B.; Donnelly, J.R. Seasonal patterns of carbohydrate reserves in red spruce seedlings. Tree Physiol. 2000, 20, 549–555. [Google Scholar] [CrossRef] [PubMed]
- Trifilò, P.; Lo Gullo, M.A.; Salleo, S.; Callea, K.; Nardini, A. Xylem embolism alleviated by ion-mediated increase in hydraulic conductivity of functional xylem: Insights from field measurements. Tree Physiol. 2008, 28, 1505–1512. [Google Scholar] [CrossRef] [PubMed] [Green Version]
- Losso, A.; Nardini, A.; Dämon, B.; Mayr, S. Xylem sap chemistry: Seasonal changes in timberline conifers Pinus cembra, Picea abies, and Larix decidua. Biol. Plant. 2018, 62, 157–165. [Google Scholar] [CrossRef]
- Reid, R.; Hayes, J. Mechanisms and control of nutrient uptake in plants. Int. Rev. Cytol. 2003, 229, 73–114. [Google Scholar] [PubMed]
- Weatherall, A.; Proe, M.F.; Craig, J.; Cameron, A.D.; Midwood, A.J. Internal cycling of nitrogen, potassium and magnesium in young Sitka spruce. Tree Physiol. 2006, 26, 673–680. [Google Scholar] [CrossRef]
- Yoshida, S.; Ichikuni, M. Migration of elements through forests with special emphasis on the role of canopy. Environ. Sci. 1988, 1, 31–38, (In Japanese with English abstract). [Google Scholar]
- Hudgins, J.W.; Krekling, T.; Franceschi, V.R. Distribution of calcium oxalate crystals in the secondary phloem of conifers: A constitutive defense mechanisms? New Phytol. 2003, 159, 677–690. [Google Scholar] [CrossRef]
- Lautner, S.; Ehlting, B.; Windeisen, E.; Rennenberg, H.; Matyssek, R.; Fromm, J. Calcium nutrition has a significant influence on wood formation in poplar. New Phytol. 2007, 173, 743–752. [Google Scholar] [CrossRef]
- He, H.; Bleby, T.M.; Veneklaas, E.J.; Lambers, H.; Kuo, J. Precipitation of calcium, magnesium, strontium and barium in tissues of four Acacia species (Leguminosae: Mimosoideae). PLoS ONE 2012, 7, e41563. [Google Scholar] [CrossRef]
- Nozaki, T.; Kurihara, H. Metal coprecipitation on calcium oxalate precipitated from homogeneous solution. Japan Analyst 1960, 9, 930–933, (in Japanese with English abstract). [Google Scholar] [CrossRef]
- Pongrac, P.; Serra, T.S.; Castillo-Michel, H.; Vogel-Mikuš, K.; Arčon, I.; Kelemen, M.; Jenčič, B.; Kavčič, A.; Carvalhoc, M.T.V.; Aarts, M.G.M. Cadmium associates with oxalate in calcium oxalate crystals and competes with calcium for translocation to stems in the cadmium bioindicator Gomphrena claussenii. Metallomics 2018, 10, 1576–1584. [Google Scholar] [CrossRef]
- Paiva, E.A.S. Are calcium oxalate crystals a dynamic calcium store in plants? New Phytol. 2019, 223, 1707–1711. [Google Scholar] [CrossRef]
- Cline, G.R.; Powell, P.E.; Szaniszlo, P.J.; Reid, C.P.P. Comparison of the abilities of hydroxamic and other natural organic acids to chelate iron and other ions in soil. Soil Sci. 1983, 136, 145–157. [Google Scholar] [CrossRef]
- Holmen, B.A.; Casey, W.H. Hydroxamate ligands, surface chemistry, and the mechanism of ligand-promoted dissolution of goethite [α-FeOOH(s)]. Geochim. Cosmochim. Acta 1996, 60, 4403–4416. [Google Scholar] [CrossRef]
- Duckworth, O.W.; Akafia, M.M.; Andrews, M.Y.; Bargar, J.R. Siderophore-promoted dissolution of chromium from hydroxide minerals. Environ. Sci. Process Impacts 2014, 16, 1348–1359. [Google Scholar] [CrossRef]
- Godo, G.H.; Reisenauer, H.M. Plant effects on soil manganese availability. Soil Sci. Soc. Am. J. 1980, 44, 993–995. [Google Scholar] [CrossRef]
- Gupta, N.; Gaurav, S.S.; Kumar, A. Molecular basis of aluminium toxicity in plants: A review. Am. J. Plant Sci. 2013, 4, 21–37. [Google Scholar] [CrossRef]
- De-Jesús-García, R.; Rosas, U.; Dubrovsky, J.G. The barrier function of plant roots: Biological bases for selective uptake and avoidance of soil compounds. Funct. Plant Biol. 2020, 47, 383–397. [Google Scholar] [CrossRef]
- Bol, R.; Julich, D.; Brödlin, D.; Siemens, J.; Kaiser, K.; Dippold, M.A.; Spielvogel, S.; Zilla, T.; Mewes, D.; von Blanckenburg, F.; et al. Dissolved and colloidal phosphorus fluxes in forest ecosystems–an almost blind spot in ecosystem research. J. Plant Nutr. Soil Sci. 2016, 179, 425–438. [Google Scholar] [CrossRef]
- Katagiri, S.; Miyake, N.; Sakagoshi, H. Studies on mineral cycling in a deciduous broad-leaved forest at Sanbe forest of Shimane University (XIII) The concentration and amount of nutrient elements in dominant trees. Bull. Fa. Agr. Shimane Univ. 1986, 20, 67–74, (In Japanese with English abstract). [Google Scholar]
- Sera, K.; Goto, S.; Takahashi, C.; Saitoh, Y. Movement of light elements in living plants measured by means of a standard-free method in in-air PIXE. NMCC Annual Repot 2013, 20, 52–63, (In Japanese with English abstract). [Google Scholar] [CrossRef]
- Takada, J.; Takamatsu, T.; Satake, K.; Sase, H. Data on Elemental Concentration in Land Plants by Neutron Activation Analysis (No. 1); National Institute for Environmental Studies: Tsukuba-City, Japan, 1993; 260p. (In Japanese) [Google Scholar]
- Sasaki, Y.; Nishihagi, K.; Kuroki, Y. Elemental analysis of leaves on polyploids in Japanese cedar (Cryptomeria japonica) and Japanese cypress (Chamaecyparis obtusa). In Research Report of the Oita Prefectural Forest Experiment Station; Oita Prefectural Forest Experiment Station: Oita, Japan, 1996; Volume 22, pp. 1–7, (In Japanese with English Abstract). [Google Scholar]
Figure 1.
Method used to sample xylem sap from adult tree trunks.

Figure 2.
Seasonal variation in the volume of xylem sap collected in water-absorbing resin (Experiment 1). The data represent the mean values of three conspecific trees. ●: Q. serrata, ×: C. japonica.
Figure 2.
Seasonal variation in the volume of xylem sap collected in water-absorbing resin (Experiment 1). The data represent the mean values of three conspecific trees. ●: Q. serrata, ×: C. japonica.

Figure 3.
Relationship between the monthly volume of xylem sap collected in Q. serrata and the mean monthly air temperature. The presented data were from Experiments 1–3.
Figure 3.
Relationship between the monthly volume of xylem sap collected in Q. serrata and the mean monthly air temperature. The presented data were from Experiments 1–3.

Figure 4.
Relationship between the monthly volume of xylem sap collected in Q. serrata and the monthly precipitation. The presented data were from Experiments 1–3.
Figure 4.
Relationship between the monthly volume of xylem sap collected in Q. serrata and the monthly precipitation. The presented data were from Experiments 1–3.

Figure 5.
Seasonal variation in the concentrations of K in the xylem sap obtained in Experiment 3. The data represent the mean values of three conspecific trees. ●: Q. serrata, ×: C. japonica.
Figure 5.
Seasonal variation in the concentrations of K in the xylem sap obtained in Experiment 3. The data represent the mean values of three conspecific trees. ●: Q. serrata, ×: C. japonica.

Figure 6.
Relationship between monthly concentrations of K in the xylem sap obtained in Experiment 3 and the mean monthly air temperature. ●: Q. serrata, ×: C. japonica.
Figure 6.
Relationship between monthly concentrations of K in the xylem sap obtained in Experiment 3 and the mean monthly air temperature. ●: Q. serrata, ×: C. japonica.

Figure 7.
Relationships between the elemental concentrations in the leaves and xylem sap of Q. serrata. The data for K, Rb, Cs, and Cl are not included in the regression line.
Figure 7.
Relationships between the elemental concentrations in the leaves and xylem sap of Q. serrata. The data for K, Rb, Cs, and Cl are not included in the regression line.

Figure 8.
Concentration ranges of elements in the xylem sap and soil solution. Green bars: xylem sap, brown bars: soil solution.
Figure 8.
Concentration ranges of elements in the xylem sap and soil solution. Green bars: xylem sap, brown bars: soil solution.

Table 1.
Volume (ml) of xylem sap collected in water-absorbing resin for 1 month.
| Tree Species | Experiment 1 | Experiment 2 | Experiment 3 | |
|---|---|---|---|---|
| Q. serrata | Mean | 9.6 | 8.9 | 8.9 |
| SD | 2.8 | 2.7 | 1.9 | |
| Min | 5.4 | 4.9 | 6.5 | |
| Max | 14.0 | 12.6 | 11.9 | |
| MCV | 0.18 | 0.14 | 0.08 | |
| C. japonica | Mean | 10.4 | 11.5 | 10.4 |
| SD | 2.3 | 2.4 | 2.6 | |
| Min | 6.9 | 7.8 | 6.2 | |
| Max | 14.0 | 13.6 | 15.5 | |
| MCV | 0.52 | 0.52 | 0.50 |
Experiment 1: April 2015–March 2016, Experiment 2: June 2016–May 2017, Experiment 3: June 2018–May 2019. SD: standard deviations. MCV: annual mean values of the coefficients of variation among three conspecific trees.
Table 2.
Concentrations of metallic elements in the xylem sap obtained in Experiment 3 and those reported in the literature.
Table 2.
Concentrations of metallic elements in the xylem sap obtained in Experiment 3 and those reported in the literature.
| Element /Conc. Unit | Q. serrata | C. japonica | Literature | |||||||
|---|---|---|---|---|---|---|---|---|---|---|
| Mean/SD | Min–Max | MCV | Mean/SD | Min–Max | MCV | Mean | Median | Min–Max | n | |
| K/ppm | 1780/620 | 917–2590 | 0.26 | 1860/430 | 1080–2360 | 0.36 | 155 | 80 1,2 | 8.3 3–1500 4 | 30 |
| Rb/ppm | 3.9/1.3 | 2.0–5.6 | 0.36 | 3.6/0.9 | 2.0–4.7 | 0.44 | – | – | – | – |
| Cs/ppb | 9.9/3.7 | 4.5–15 | 0.58 | 2.7/0.8 | 1.4–3.8 | 0.44 | – | – | – | – |
| Mg/ppm | 4.4/6.0 | 0.5–21 | 0.46 | 13/5 | 5.7–20 | 0.26 | 11 | 13 1,5 | 0.6 2–53 6 | 24 |
| Ca/ppm | 24/25 | 3.9–83 | 0.29 | 14/6 | 6.0–24 | 0.30 | 38 | 30 4,7 | 2.1 2–270 5 | 24 |
| Sr/ppb | 136/140 | 22–460 | 0.34 | 51/24 | 22–94 | 0.36 | – | – | – | – |
| Ba/ppb | 280/296 | 40–959 | 0.42 | 4.5/3.1 | 0.8–9.9 | 0.54 | – | – | – | – |
| Al/ppb | 134/45 | 60–226 | 0.26 | 97/53 | 23–206 | 0.45 | 140 | 73 8,9 | 12 8–900 9 | 6 |
| Cr/ppb | 1.3/0.8 | 0.4–3.3 | 0.65 | 1.1/1.0 | <LQ–3.3 | 1.0 | 48 | 48 | 48 10 | 1 |
| Mn/ppb | 1340/1520 | 212–5290 | 0.38 | 3.4/1.1 | 1.6–5.6 | 0.58 | 3300 | 1000 9 | 20 3–21,400 11 | 11 |
| Fe/ppb | 40/39 | 4.2–143 | 0.31 | 15/6 | 4.5–24 | 0.40 | 150 | 90 9,12 | 2.5 13–600 7 | 8 |
| Ni/ppb | 11/8 | 2.3–27 | 0.27 | 1.5/0.9 | 0.4–3.1 | 0.66 | 51 | 51 | 21 14–110 3 | 2 |
| Cu/ppb | 17/8 | 2.2–29 | 1.0 | 29/16 | <LQ–56 | 0.92 | 150 | 37 8 | 0.39 15–2050 13 | 7 |
| Zn/ppb | 39/16 | 14–62 | 0.44 | 27/13 | 10–47 | 0.66 | 740 | 500 9 | 10 13–5800 8 | 8 |
| Cd/ppb | 0.3/0.3 | <LQ–0.9 | 0.42 | 0.1/0.1 | <LQ–0.3 | 0.46 | 1 | 1 | 1 10 | 1 |
LQ (limit of quantification): 0.1 ppb. In calculating the means, values less than the LQ were assumed to be half of the LQ (i.e., 0.05 ppb). SD: standard deviations; MCV: annual mean values of the coefficients of variation among three conspecific trees. Tree species (references): 1 Pinus tabuliformis [32], 2 Picea abies [92], 3 Populus nigra [29], 4 Cryptomeria japonica [93], 5 Cornus controversa [28], 6 Acer mono [6], 7 Coffea arabica [94], 8 Betula platyphylla [5], 9 Pseudotsuga menziesii [11], 10 Pinus brutia [95], 11 Fagus sylvatica [30], 12 Picea rubens [14], 13 Juglans ailanthifolia [6], 14 Quercus ilex [22], and 15 Betula pendula [96]. n: number of tree species studied. The tree species listed do not include metal accumulators.
Table 3.
Concentrations of nonmetallic elements in the xylem sap obtained in Experiment 1 and those reported in the literature.
Table 3.
Concentrations of nonmetallic elements in the xylem sap obtained in Experiment 1 and those reported in the literature.
| Element /Conc. Unit | Q. serrata | C. japonica | Literature | ||||||||
|---|---|---|---|---|---|---|---|---|---|---|---|
| Mean/SD | Min–Max | MCV | Mean/SD | Min–Max | MCV | Mean | Median | Min–Max | n | ||
| Cl/ppm | 4.5/2.8 | 1.7–11 | 0.43 | 2.4/0.5 | 1.4–3.1 | 1.1 | 100 | 26 1 | 0.08 2–1200 3 | 7 | |
| PO4-P/ppm | 0.69/0.56 | 0.15–1.7 | 0.84 | 0.42/0.27 | 0.08–0.96 | 0.83 | 12 | 4.8 4,5 | 0.02 2–62 6 | 6 | |
| Org. P/ppm | 0.17/0.15 | <LQ–0.41 | 1.2 | 0.23/0.15 | 0.03–0.50 | 1.2 | – | – | – | – | |
| Total P/ppm | 0.86/0.60 | 0.15–1.9 | 0.71 | 0.65/0.30 | 0.26–1.3 | 0.84 | 9.6 | 6.4 7 | 2.1 7–29 8 | 4 | |
| SO4-S/ppm | 0.07/0.10 | <LQ–0.31 | 1.4 | 0.05/0.01 | 0.03–0.08 | 1.3 | 13 | 9.3 4,9 | 0.25 2–90 6 | 8 | |
| Org. S/ppm | 3.2/1.8 | 1.2–6.0 | 0.40 | 1.2/0.1 | 1.1–1.5 | 0.38 | – | – | – | – | |
| Total S/ppm | 3.2/1.8 | 1.3–6.2 | 0.38 | 1.3/0.1 | 1.1–1.6 | 0.33 | 2.8 | – | 2.1 10–3.6 10 | 1 | |
| Cys-S/ppb | – | – | – | – | – | – | 33 | 28 11,12 | 0.20 11–130 13 | 3 | |
| GSH-S/ppb | – | – | – | – | – | – | 70 | 34 10,12 | 0.06 12–417 13 | 3 | |
LQ (limit of quantification): 0.02 ppm for P and S. In calculating the means, values less than the LQ were assumed to be half of the LQ (i.e., 0.01 ppm). SD: standard deviations. MCV: annual mean values of the coefficients of variation among three conspecific trees. Tree species (references): 1 Cornus controversa [28], 2 Populus nigra [29], 3 Citrus × paradisi [102], 4 Banksia prionotes [103], 5 Pinus tabuliformis [32], 6 Populus tremula × P. alba [4], 7 Picea rubens [14], 8 Pseudotsuga menziesii [11], 9 Pyrus communis [104], 10 Picea abies [105], 11 Fagus sylvatica [31], 12 Fagus sylvatica [106], and 13 Populus × canadensis [107]. Cys: cysteine, GSH: glutathione. n: number of tree species studied.
Table 4.
Concentrations of N compounds in the xylem sap obtained in Experiment 1 and those reported in the literature.
Table 4.
Concentrations of N compounds in the xylem sap obtained in Experiment 1 and those reported in the literature.
| Q. serrata | C. japonica | Literature | ||||||||
|---|---|---|---|---|---|---|---|---|---|---|
| N-Forms | Mean/SD | Min–Max | MCV | Mean/SD | Min–Max | MCV | Mean | Median | Min–Max | n |
| Conc./ppm NH4-N | 0.55/0.60 | <LQ–1.9 | 0.69 | 0.07/0.02 | <LQ–0.13 | 0.63 | 2.0 | 1.3 1,2 | 0.01 3–7.7 4 | 9 |
| Amino N | 1.8/1.3 | 0.68–4.9 | 0.50 | 0.33/0.09 | 0.18–0.49 | 0.20 | 300 | 106 5 | 2.9 6–2150 5 | 15 |
| Others N | 5.5/3.1 | 1.8–11 | 0.53 | 2.5/0.4 | 1.9–3.1 | 0.34 | – | – | – | – |
| Protein N | – | – | – | – | – | – | 9.3 | 3.7 7,8 | 0.12 9–45 10 | 8 |
| Total N | 7.8/4.7 | 2.5–17 | 0.53 | 2.9/0.4 | 2.2–3.6 | 0.34 | 48 | 36 11 | 3.5 12–280 13 | 18 |
| R/% NH4-N | 5.4/3.5 | 2.0–12.3 | – | 2.5/1.0 | 1.7–5.0 | – | ||||
| Amino N | 23.6/5.1 | 15.5–29.4 | – | 11.5/2.2 | 8.2–15.9 | – | ||||
| Others N | 71.0/6.5 | 58.4–79.3 | – | 86.0/2.3 | 81.5–89.3 | – | ||||
Amino: total free amino acids. Others: organic N compounds other than free amino acids. LQ (limit of quantification): 0.12 ppm. In calculating the means, values less than the LQ were assumed to be half of the LQ (i.e., 0.06 ppm). SD: standard deviations. MCV: annual mean values of the coefficients of variation among three conspecific trees. R: relative abundances of N compounds. The content of N in proteins was assumed to be 15%. Tree species with N-fixing bacteria were not included. Tree species (references): 1 Abies alba [111], 2 Sorbus aucuparia [112], 3 Populus nigra [29], 4 Morus alba [113], 5 Prunus avium [114], 6 Betula verrucosa [7], 7 Betula platyphylla [5], 8 Betula platyphylla [7], 9 Acer mono [6], 10 Malus domestica [115], 11 Eucalyptus/Corymbia [116], 12 Picea abies [92], and 13 Populus tremula × P. alba [4]. n: number of tree species studied.
Table 5.
Concentrations (ppm) of total sugars in the xylem sap obtained in Experiment 1 and those reported in the literature.
Table 5.
Concentrations (ppm) of total sugars in the xylem sap obtained in Experiment 1 and those reported in the literature.
| Q. serrata | C. japonica | Literature | |||||||
|---|---|---|---|---|---|---|---|---|---|
| Mean/SD | Min–Max | MCV | Mean/SD | Min–Max | MCV | Mean | Median | Min–Max | n |
| 379/206 | 137–708 | 0.28 | 198/63 | 125–310 | 0.53 | 12,680 | 3850 1 | 800 1–50,000 2 | 8 |
Disclaimer/Publisher’s Note: The statements, opinions and data contained in all publications are solely those of the individual author(s) and contributor(s) and not of MDPI and/or the editor(s). MDPI and/or the editor(s) disclaim responsibility for any injury to people or property resulting from any ideas, methods, instructions or products referred to in the content. |
© 2023 by the authors. Licensee MDPI, Basel, Switzerland. This article is an open access article distributed under the terms and conditions of the Creative Commons Attribution (CC BY) license (https://creativecommons.org/licenses/by/4.0/).
Share and Cite
MDPI and ACS Style
Takamatsu, T.; Watanabe, M.; Koshikawa, M.K. Convenient Sampling of Xylem Sap from Adult Tree Trunks and Analysis of Its Components. Forests 2023, 14, 389. https://doi.org/10.3390/f14020389
AMA Style
Takamatsu T, Watanabe M, Koshikawa MK. Convenient Sampling of Xylem Sap from Adult Tree Trunks and Analysis of Its Components. Forests. 2023; 14(2):389. https://doi.org/10.3390/f14020389
Chicago/Turabian StyleTakamatsu, Takejiro, Mirai Watanabe, and Masami Kanao Koshikawa. 2023. "Convenient Sampling of Xylem Sap from Adult Tree Trunks and Analysis of Its Components" Forests 14, no. 2: 389. https://doi.org/10.3390/f14020389
Note that from the first issue of 2016, this journal uses article numbers instead of page numbers. See further details here.