


An Open-Source Modelling Methodology for Multimodal and Intermodal Accessibility Analysis of Workplace Locations


Abstract
1. Introduction
- All relevant modes of transport need to be included (multimodal perspective): In Germany, these are walking, public transport, cycling, and driving [40].
- For results that better reflect the real-world travel choices of commuters, combinations of these modes (intermodal perspective) should be included as well. Especially the bicycle, as an emission-free, space-efficient mode to access or egress rail-based public transport, is of particular interest for current policies in the region [41] and beyond [42].
- All analysis should be conducted using real timetable-based travel times in public transport so that the particular conditions of commuting are reflected in the model (e.g., higher frequencies during the morning peak hour).
- The methodology should be fully adjustable so that both changes in the land-use component as well as in the mobility supply can be included, e.g., in the form of scenarios. This includes new housing, new public transport lines, changes in timetables, and new cycling infrastructure, among others.
- To create a universally applicable and transferable methodology, it should be based on open-source tools. This avoids black boxes in the methodology and maximizes the potential impact, since no license fees are necessary to apply the method. Moreover, an open-source methodology makes the modelling process transparent and replicable.
- In order to make the methodology useful for practical applications, the calculation time for a grid-based analysis of a functional urban area should be below 12 h in order to allow relatively fast scenario comparisons.
- How can multimodal and intermodal accessibility measures for workplace locations be operationalized on the basis of open-source tools and open data?
- What do we learn from the application of a region-wide analysis of workplace accessibility?
2. Methodology
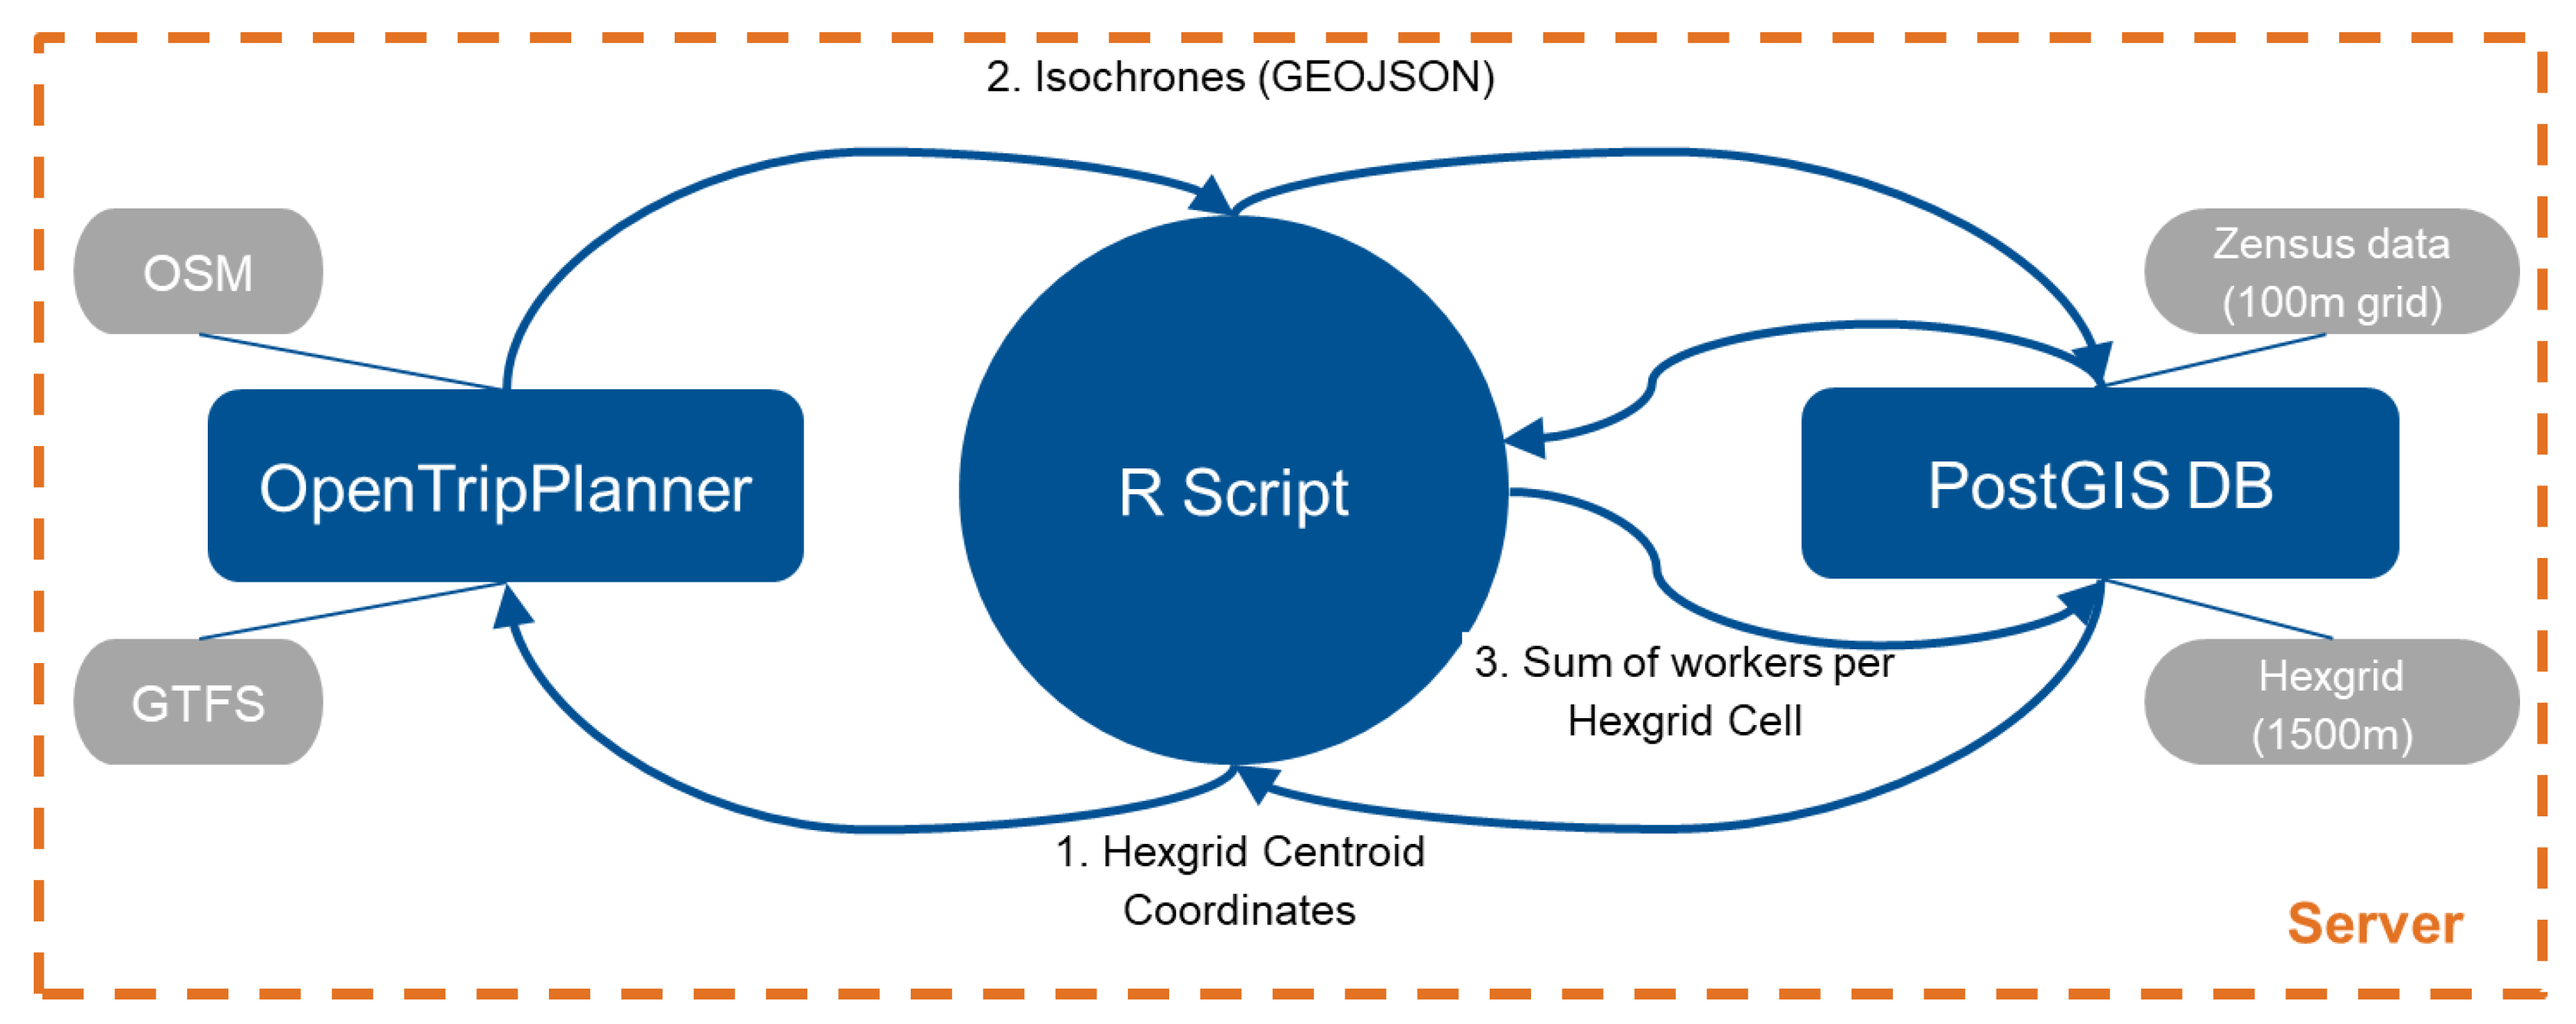
2.1. Modeling Concept
- OpenTripPlanner is used to calculate isochrones (see [33] for an introduction);
- A PostGIS database is used to store spatial data (permanently and temporarily) and perform spatial queries;
- A script (written in R) is used to steer and automate the process.
2.2. Data Sources
2.3. Software and Technical Setup
2.4. Assumptions and Parameters
2.4.1. Isochrone Generation
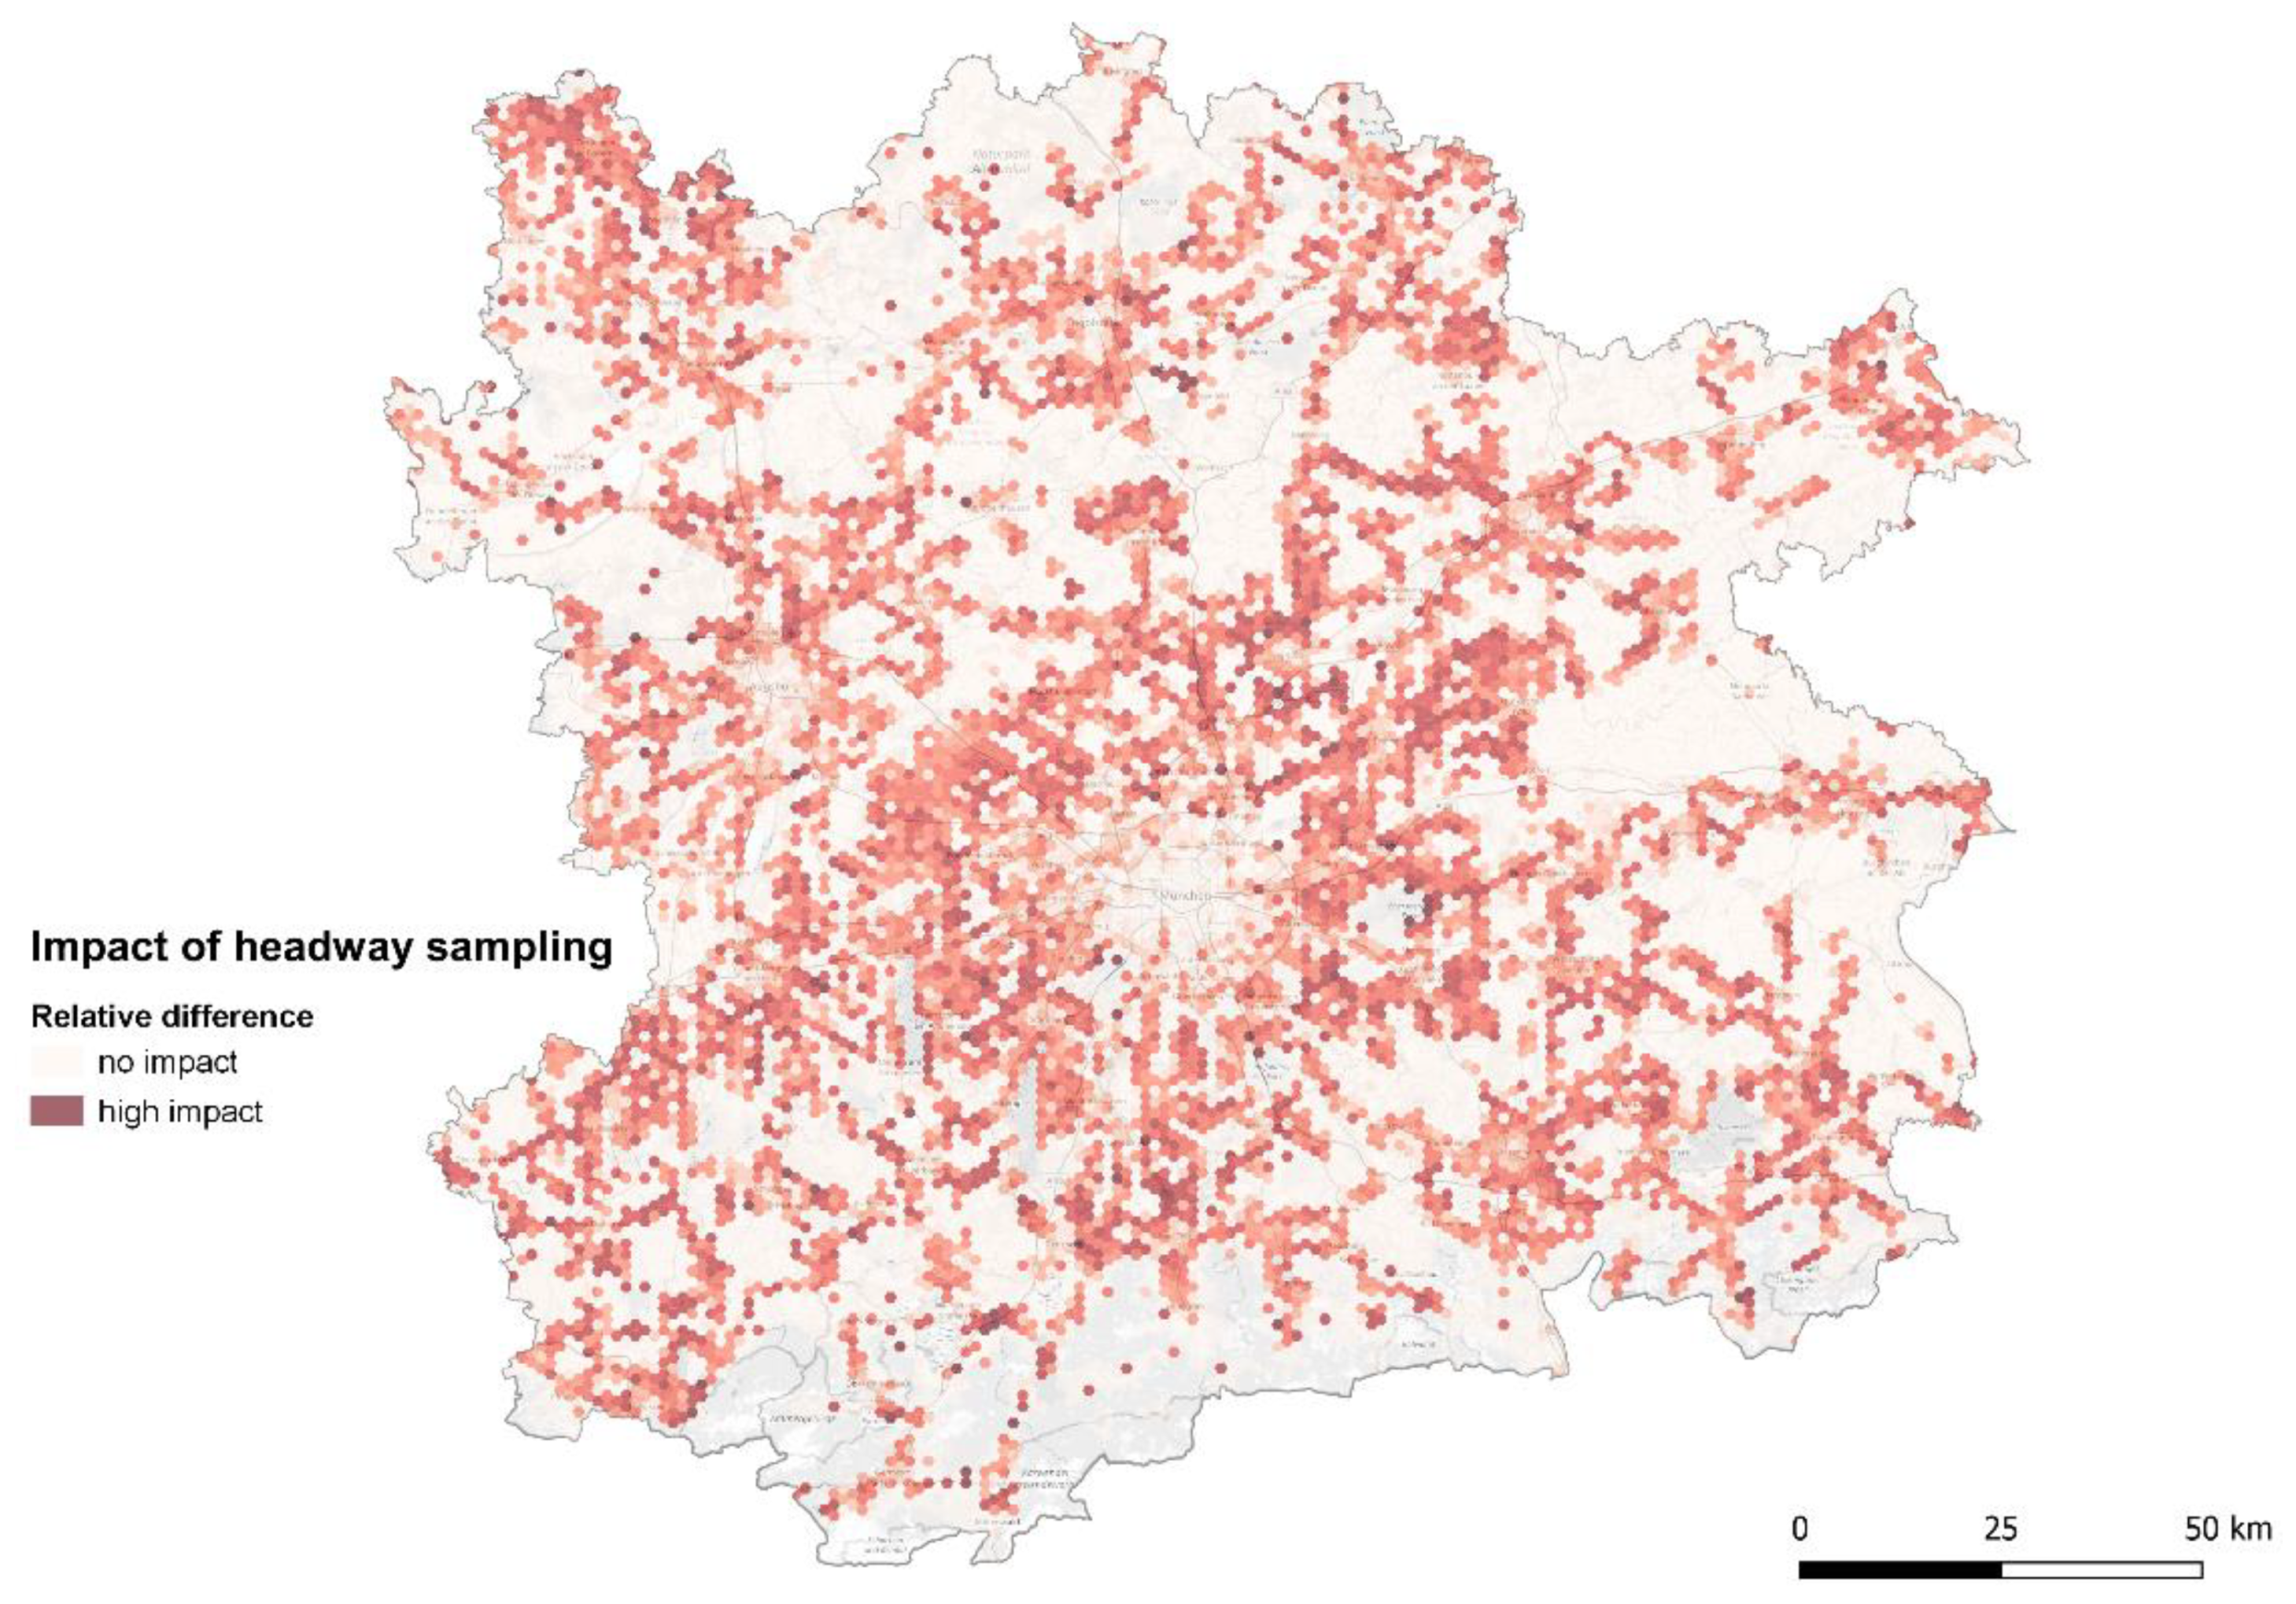
2.4.2. Temporal Parameters
2.4.3. Resulting Hexagon Grid
2.5. Comparison to Existing Approaches
- Perspective: Most accessibility models in the realm of job and workplace accessibility apply the place-based perspective for residential locations, calculating access to jobs for workers [22,51,52,53]. Our approach, however, focuses on access to workers from the perspective of (potential) workplace locations. To date, only few operational models have applied this approach—mostly, within the context of ‘jobs–housing–balance’ approaches [54,55].
- Calculation method: Usually, spatial accessibility is calculated using origin destination matrices that contain travel times (or generalized costs) between all zones in the study area [30,49]. One disadvantage of this approach is that the computational effort required is exponential with respect to the number of zones. While it offers many opportunities for more complex analyses and is a prerequisite for gravity-based measures, the high computational burden may be a limitation in practice. Thus, focusing on simplicity, we apply a calculation based on isochrones around the zone centroids (see Section 2.4.1) that only requires one operation per cell. Moreover, this approach allows us to use the resulting isochrones both for quality checks and for communication of the results, which is especially useful when comparing scenarios.
- Multimodality and intermodality: In contrast to approaches that allow only the analysis of one mode of transport (often either automobile or public transport) [22], our model is capable of calculating accessibility in a multimodal and even intermodal way, on the basis of the features of OpenTripPlanner [33,56].
- Open Source and Open Data: As outlined in Section 2.1 and Section 2.2, all software, tools, and data sources used in this proposed approach are openly available. This makes our approach, depending on data availability, replicable anywhere and without any license costs. This is a major difference to approaches relying on commercial tools like ArcGIS Pro [22,30].
3. Results
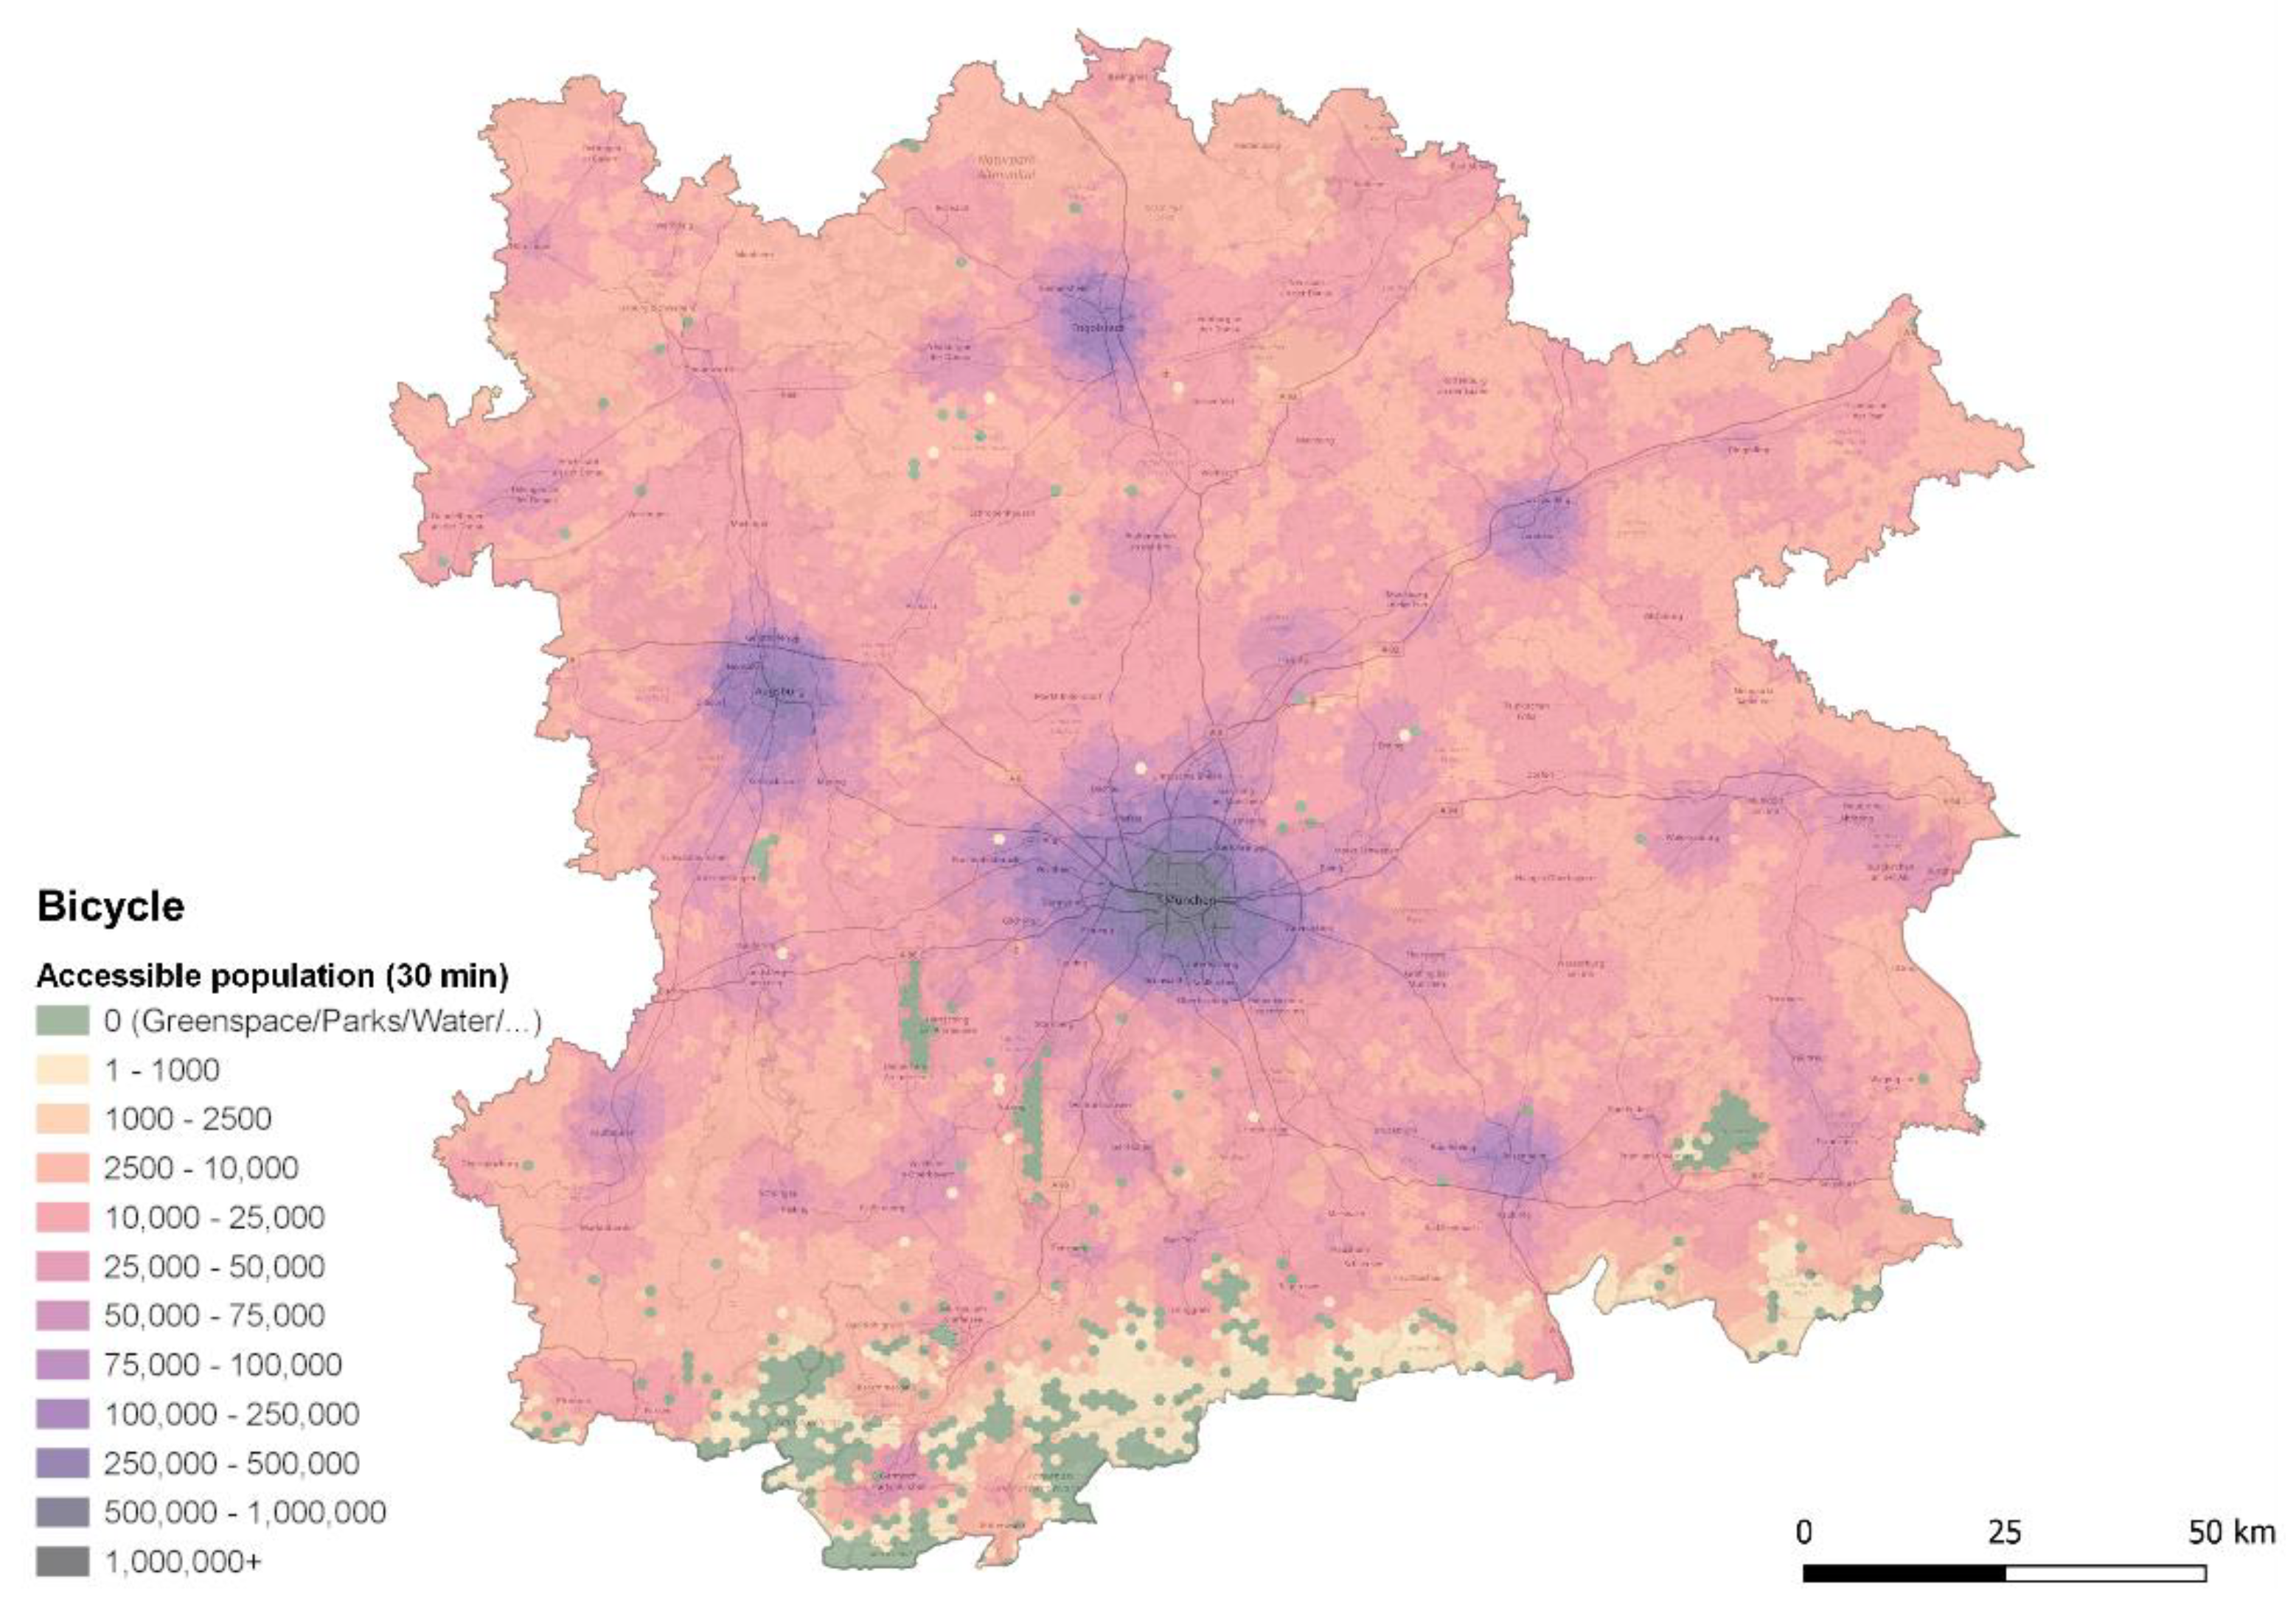
- Cycling;
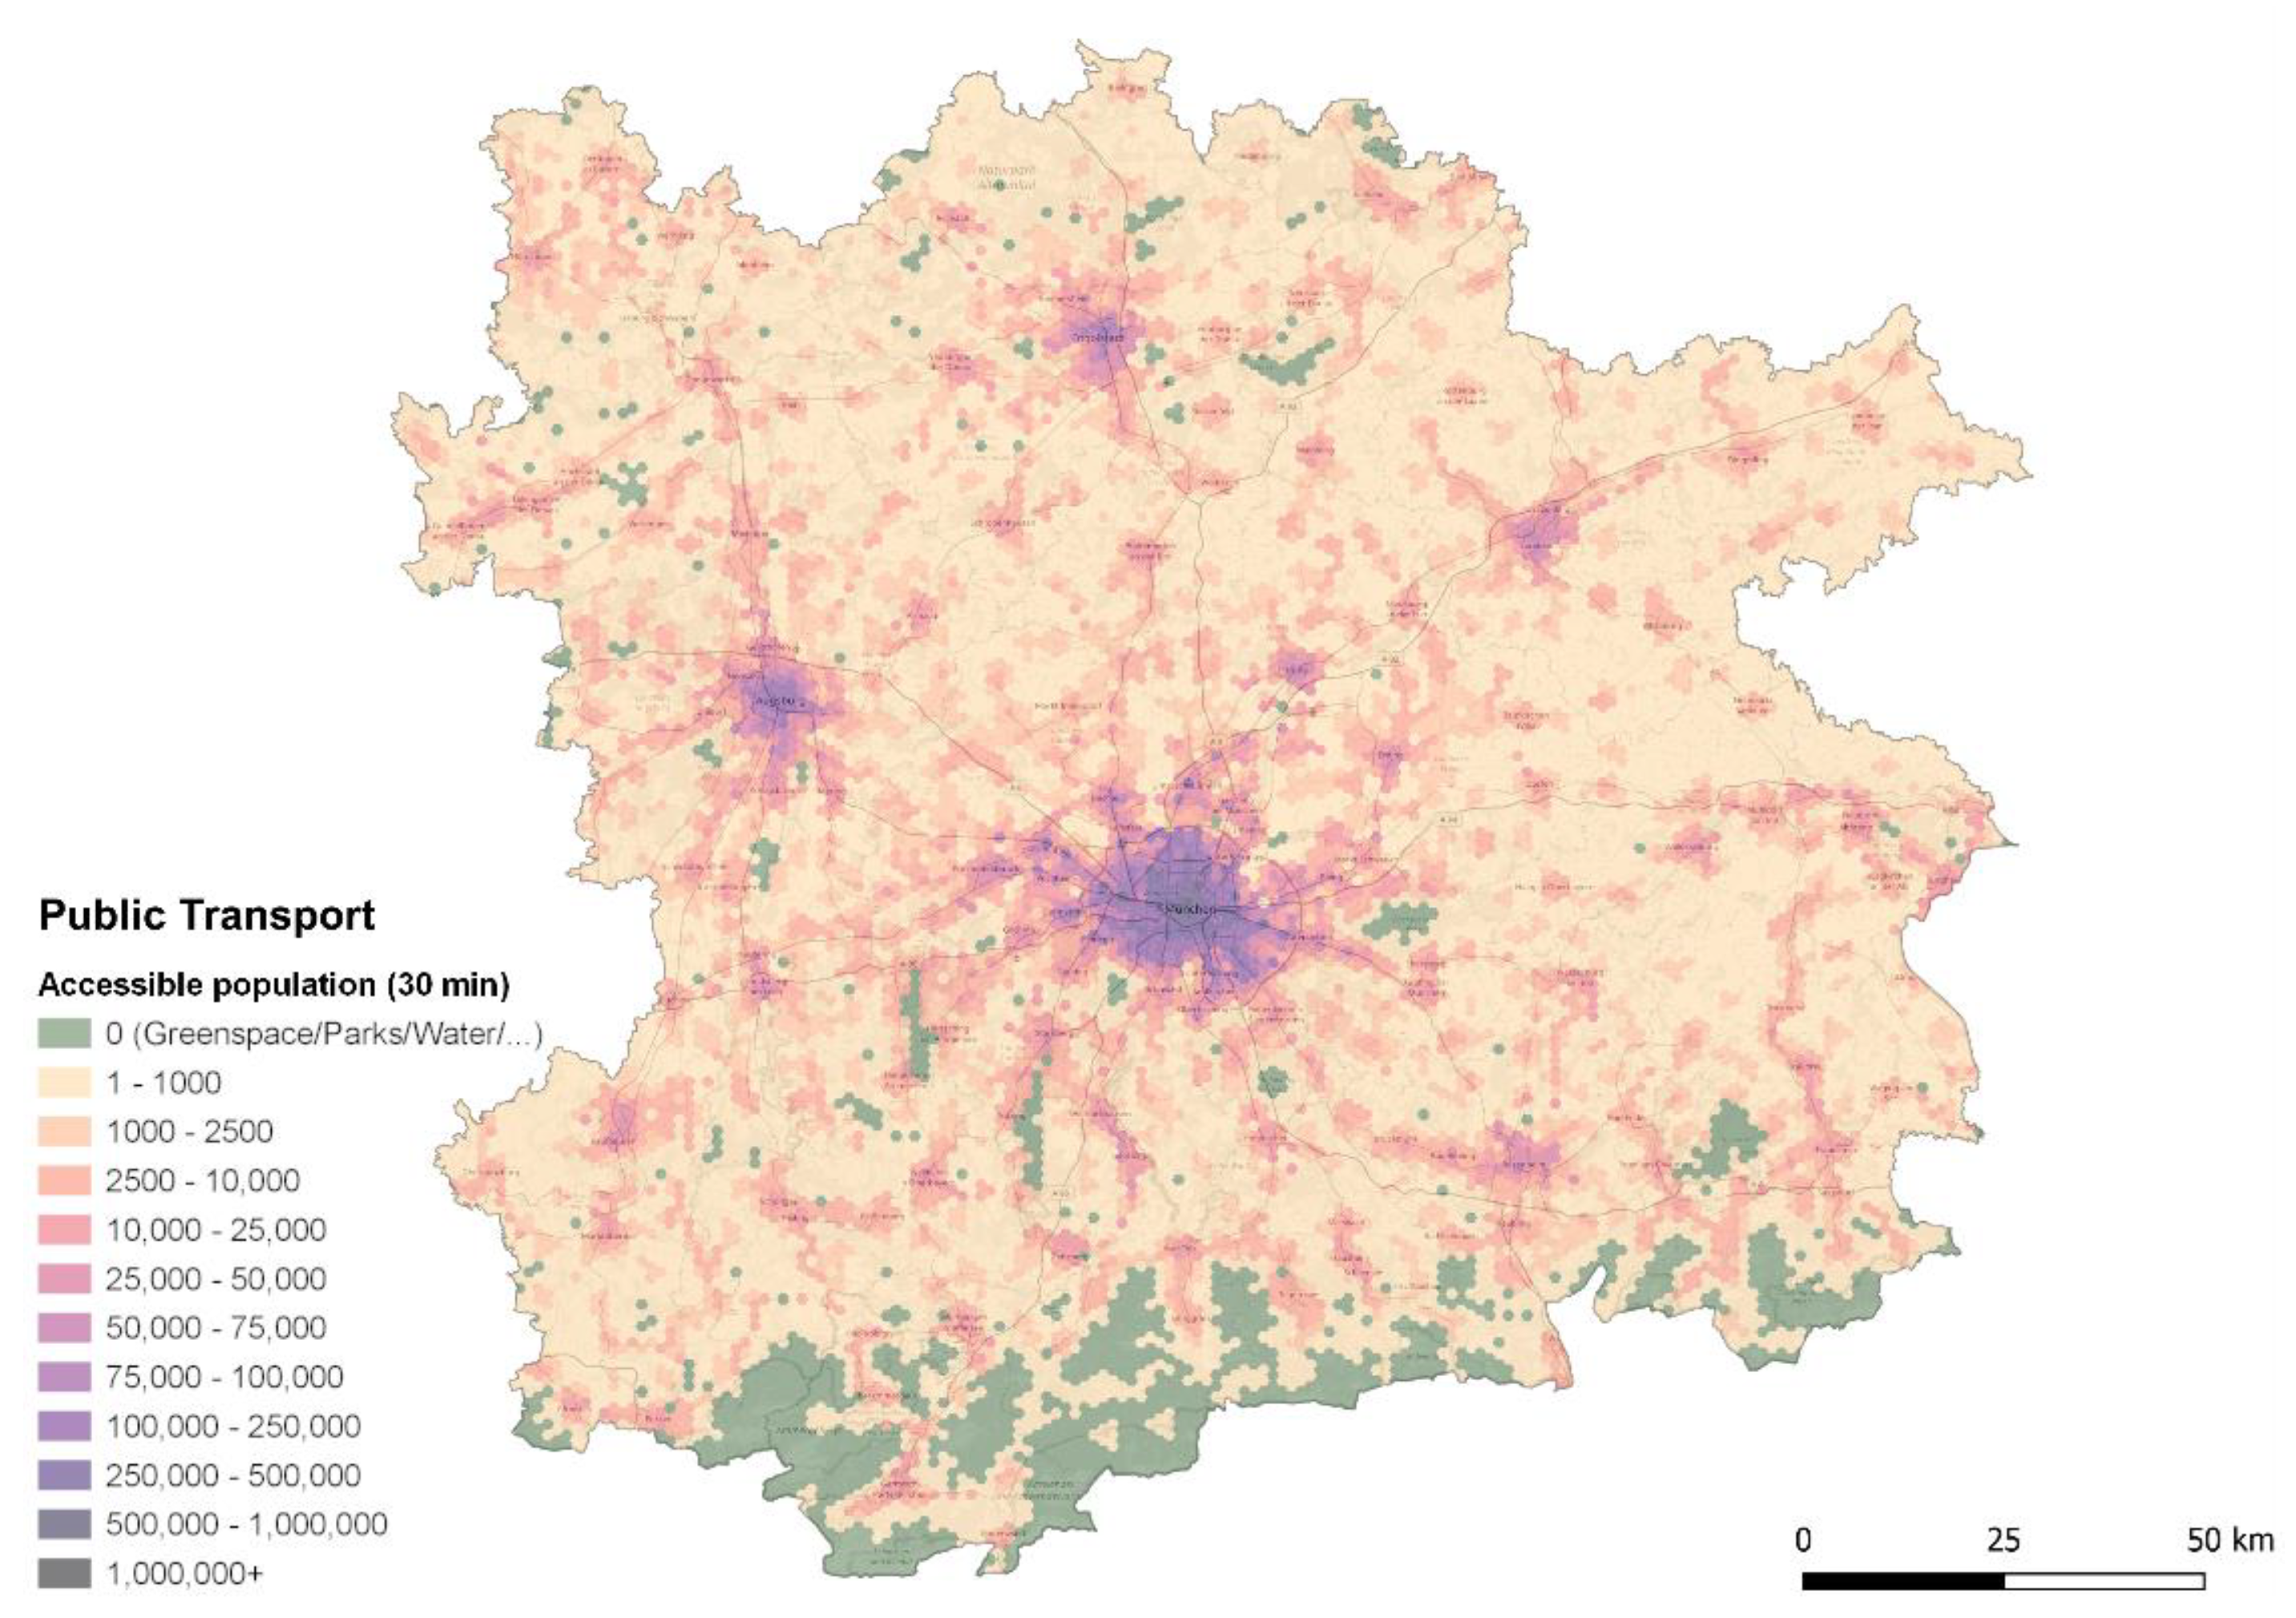
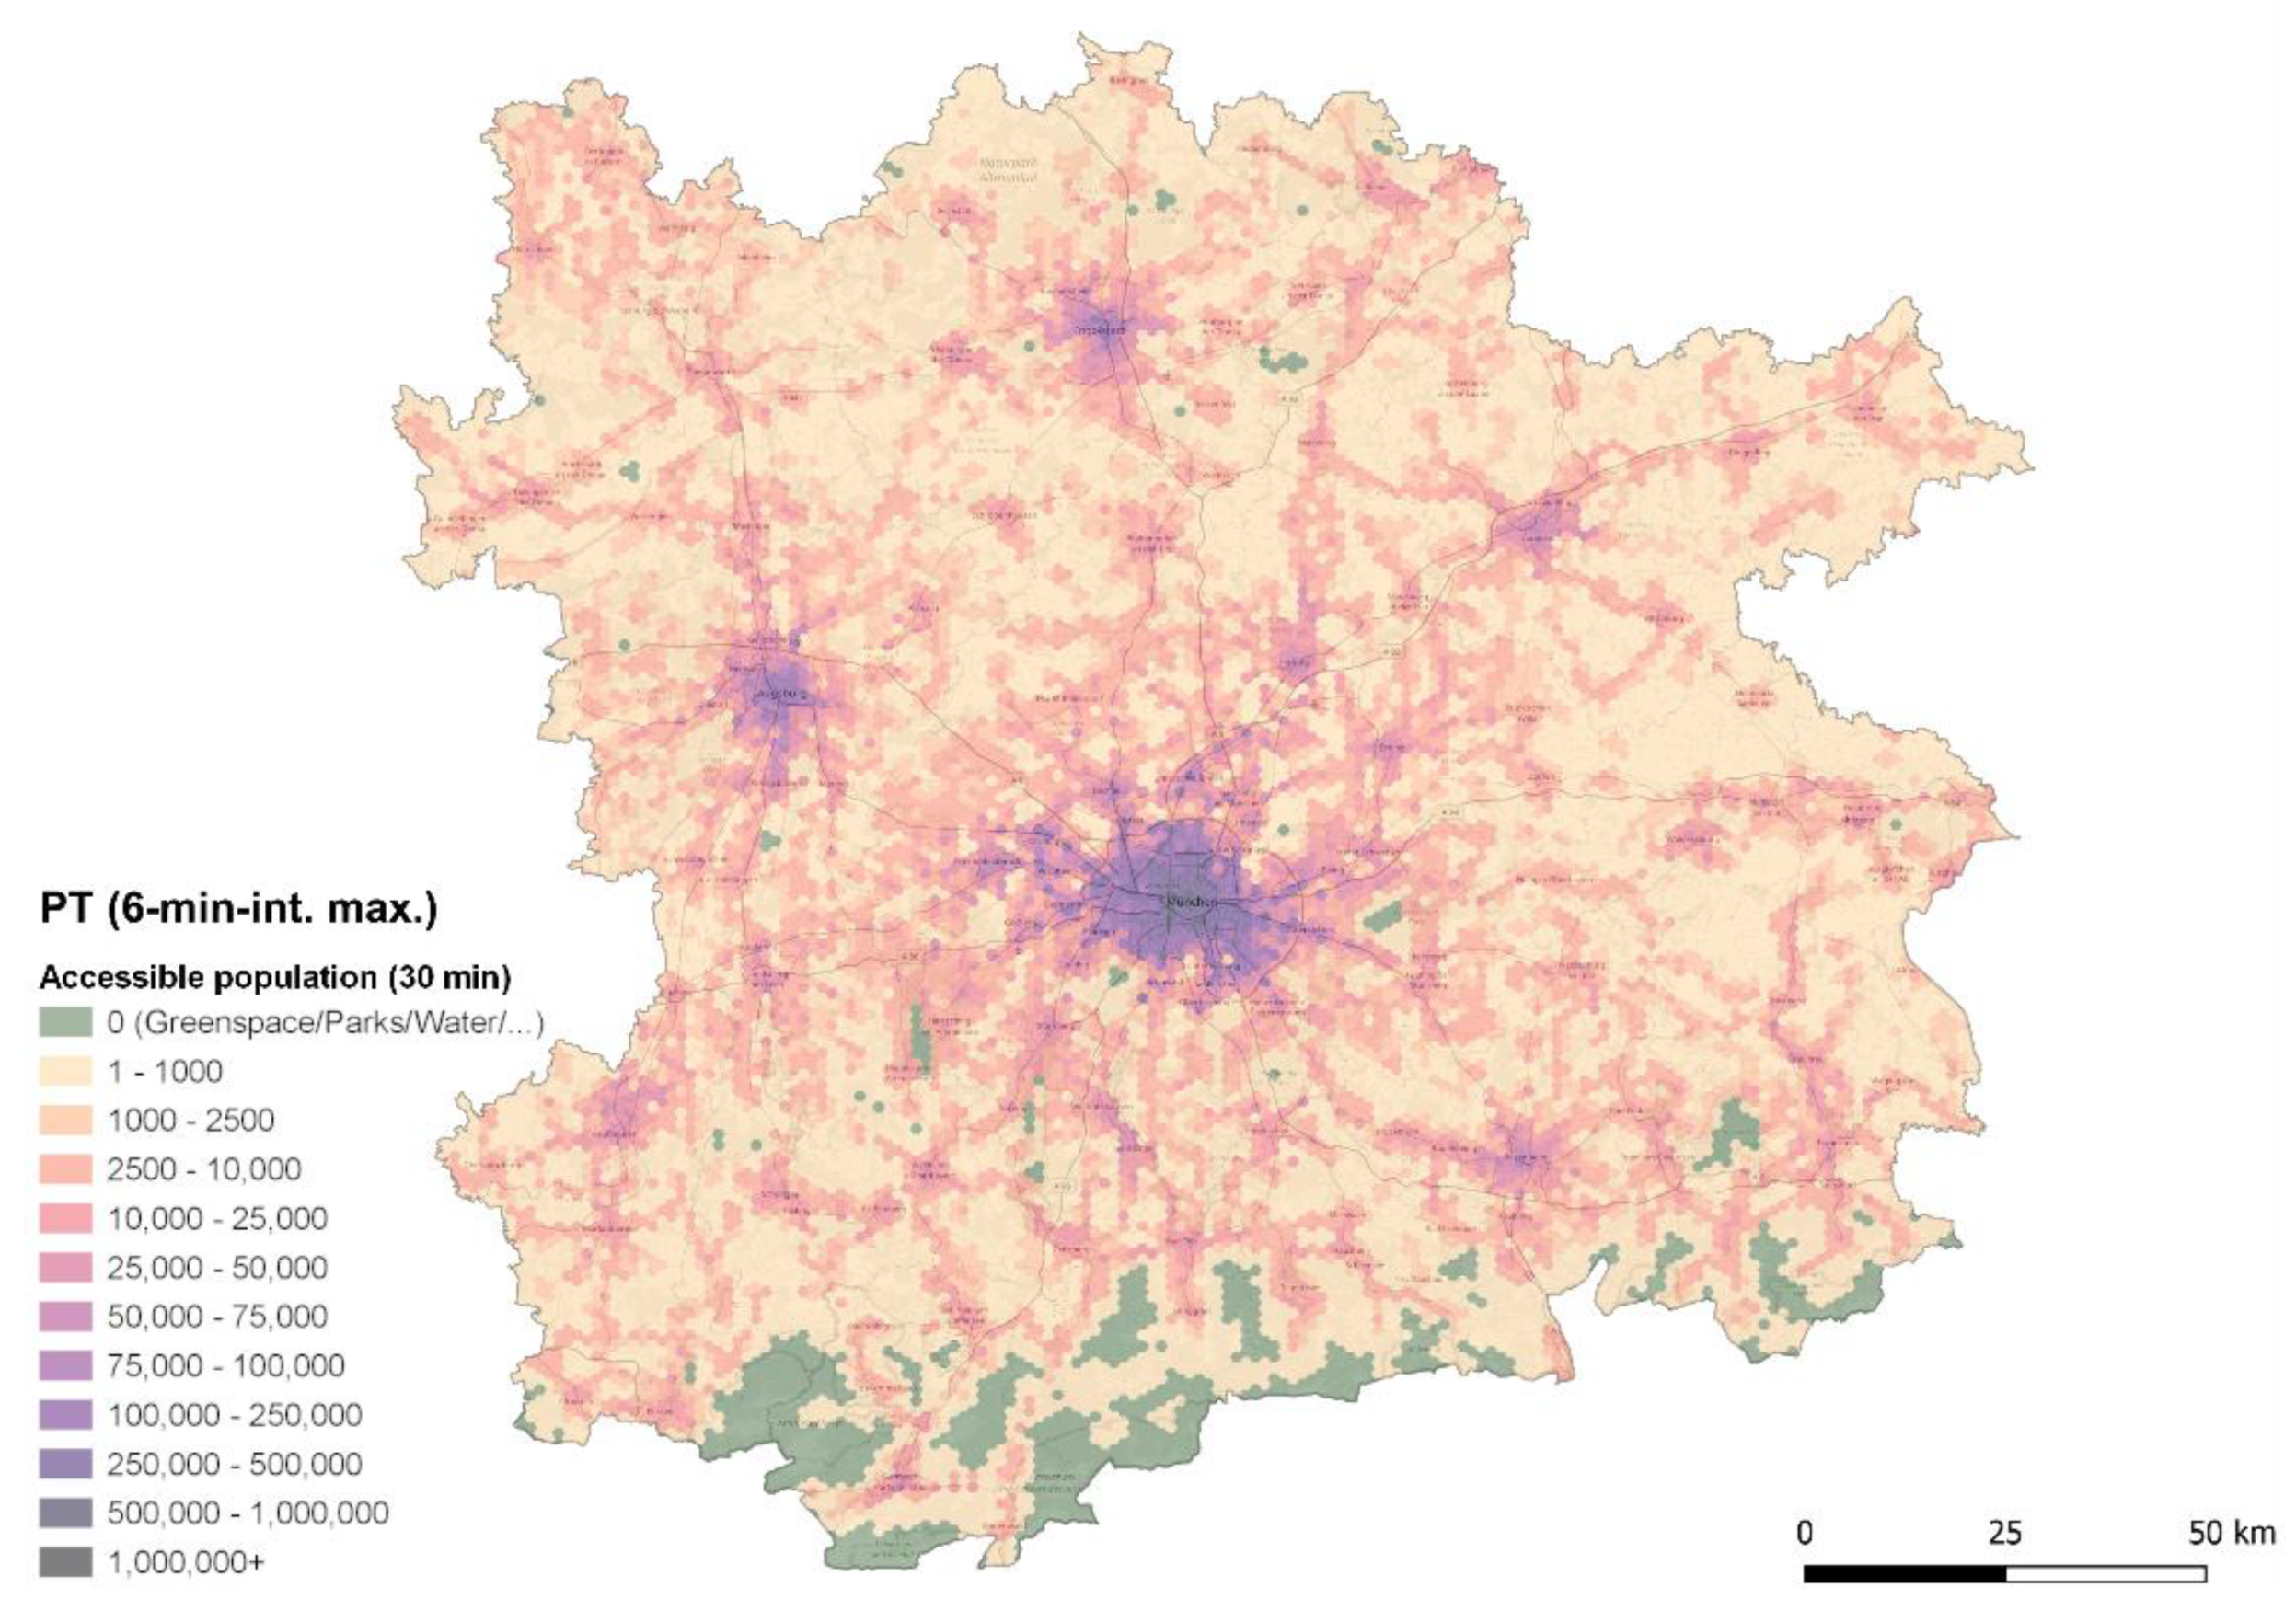
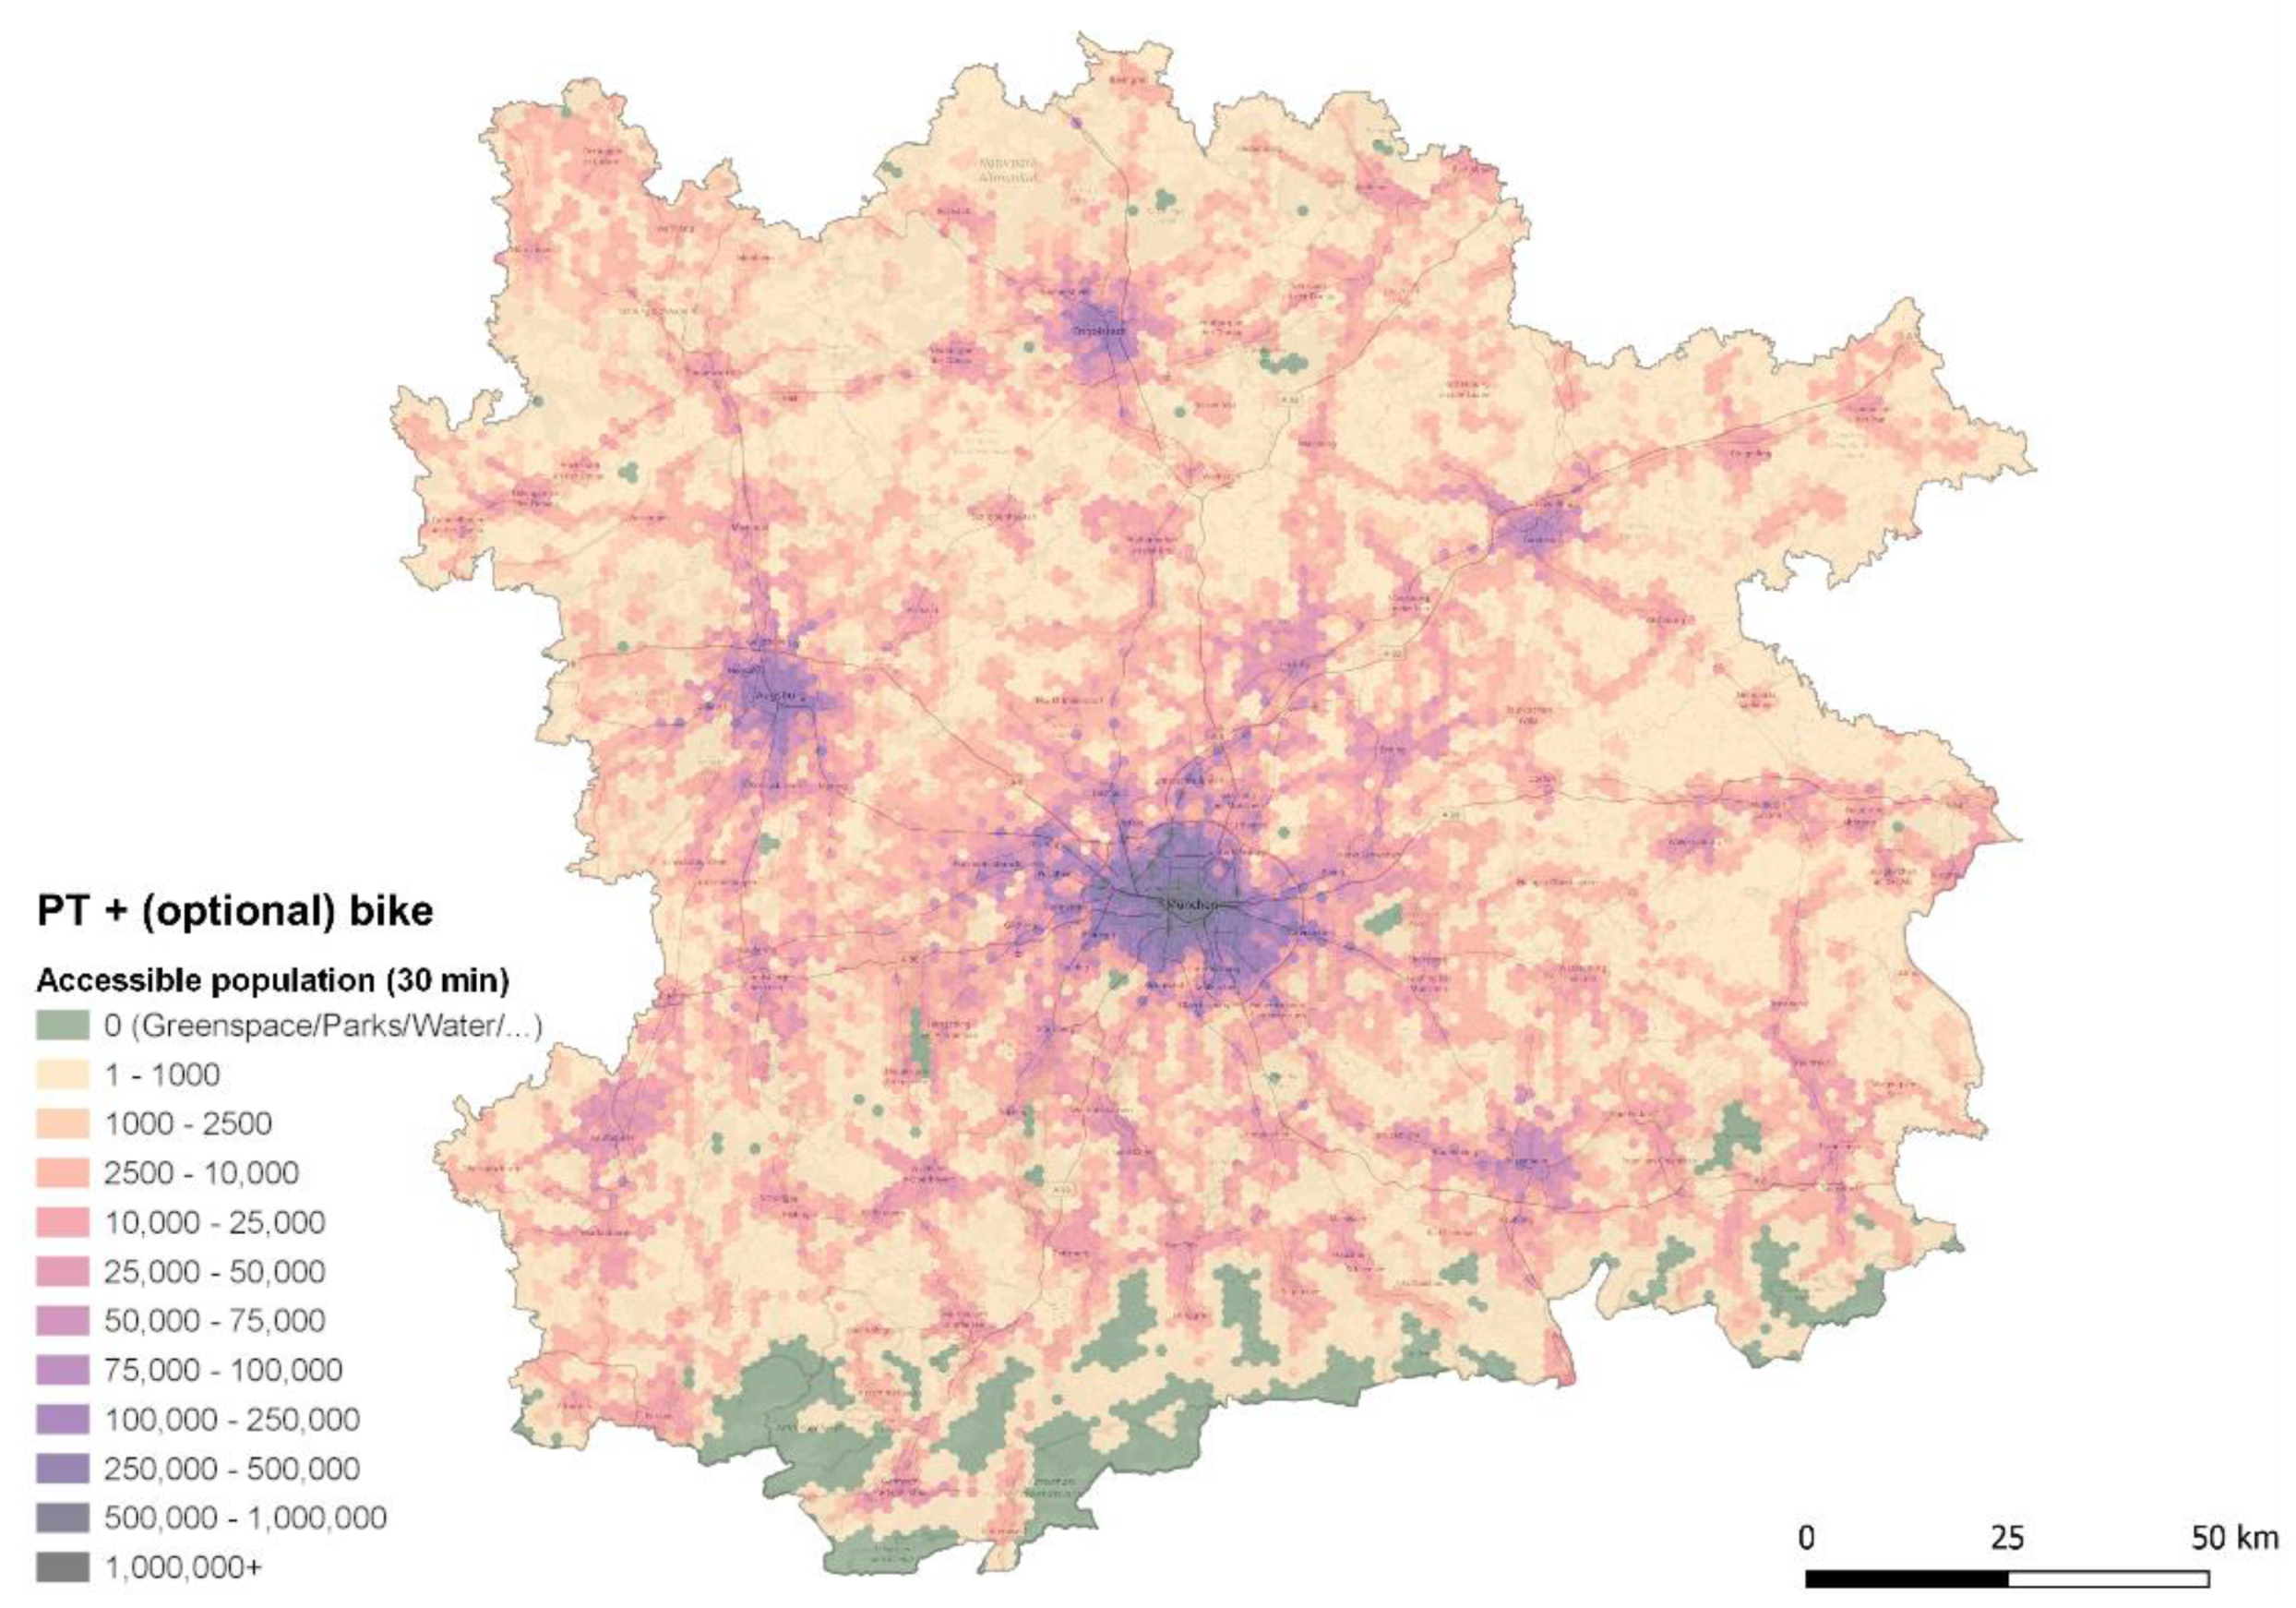
- Public transport;
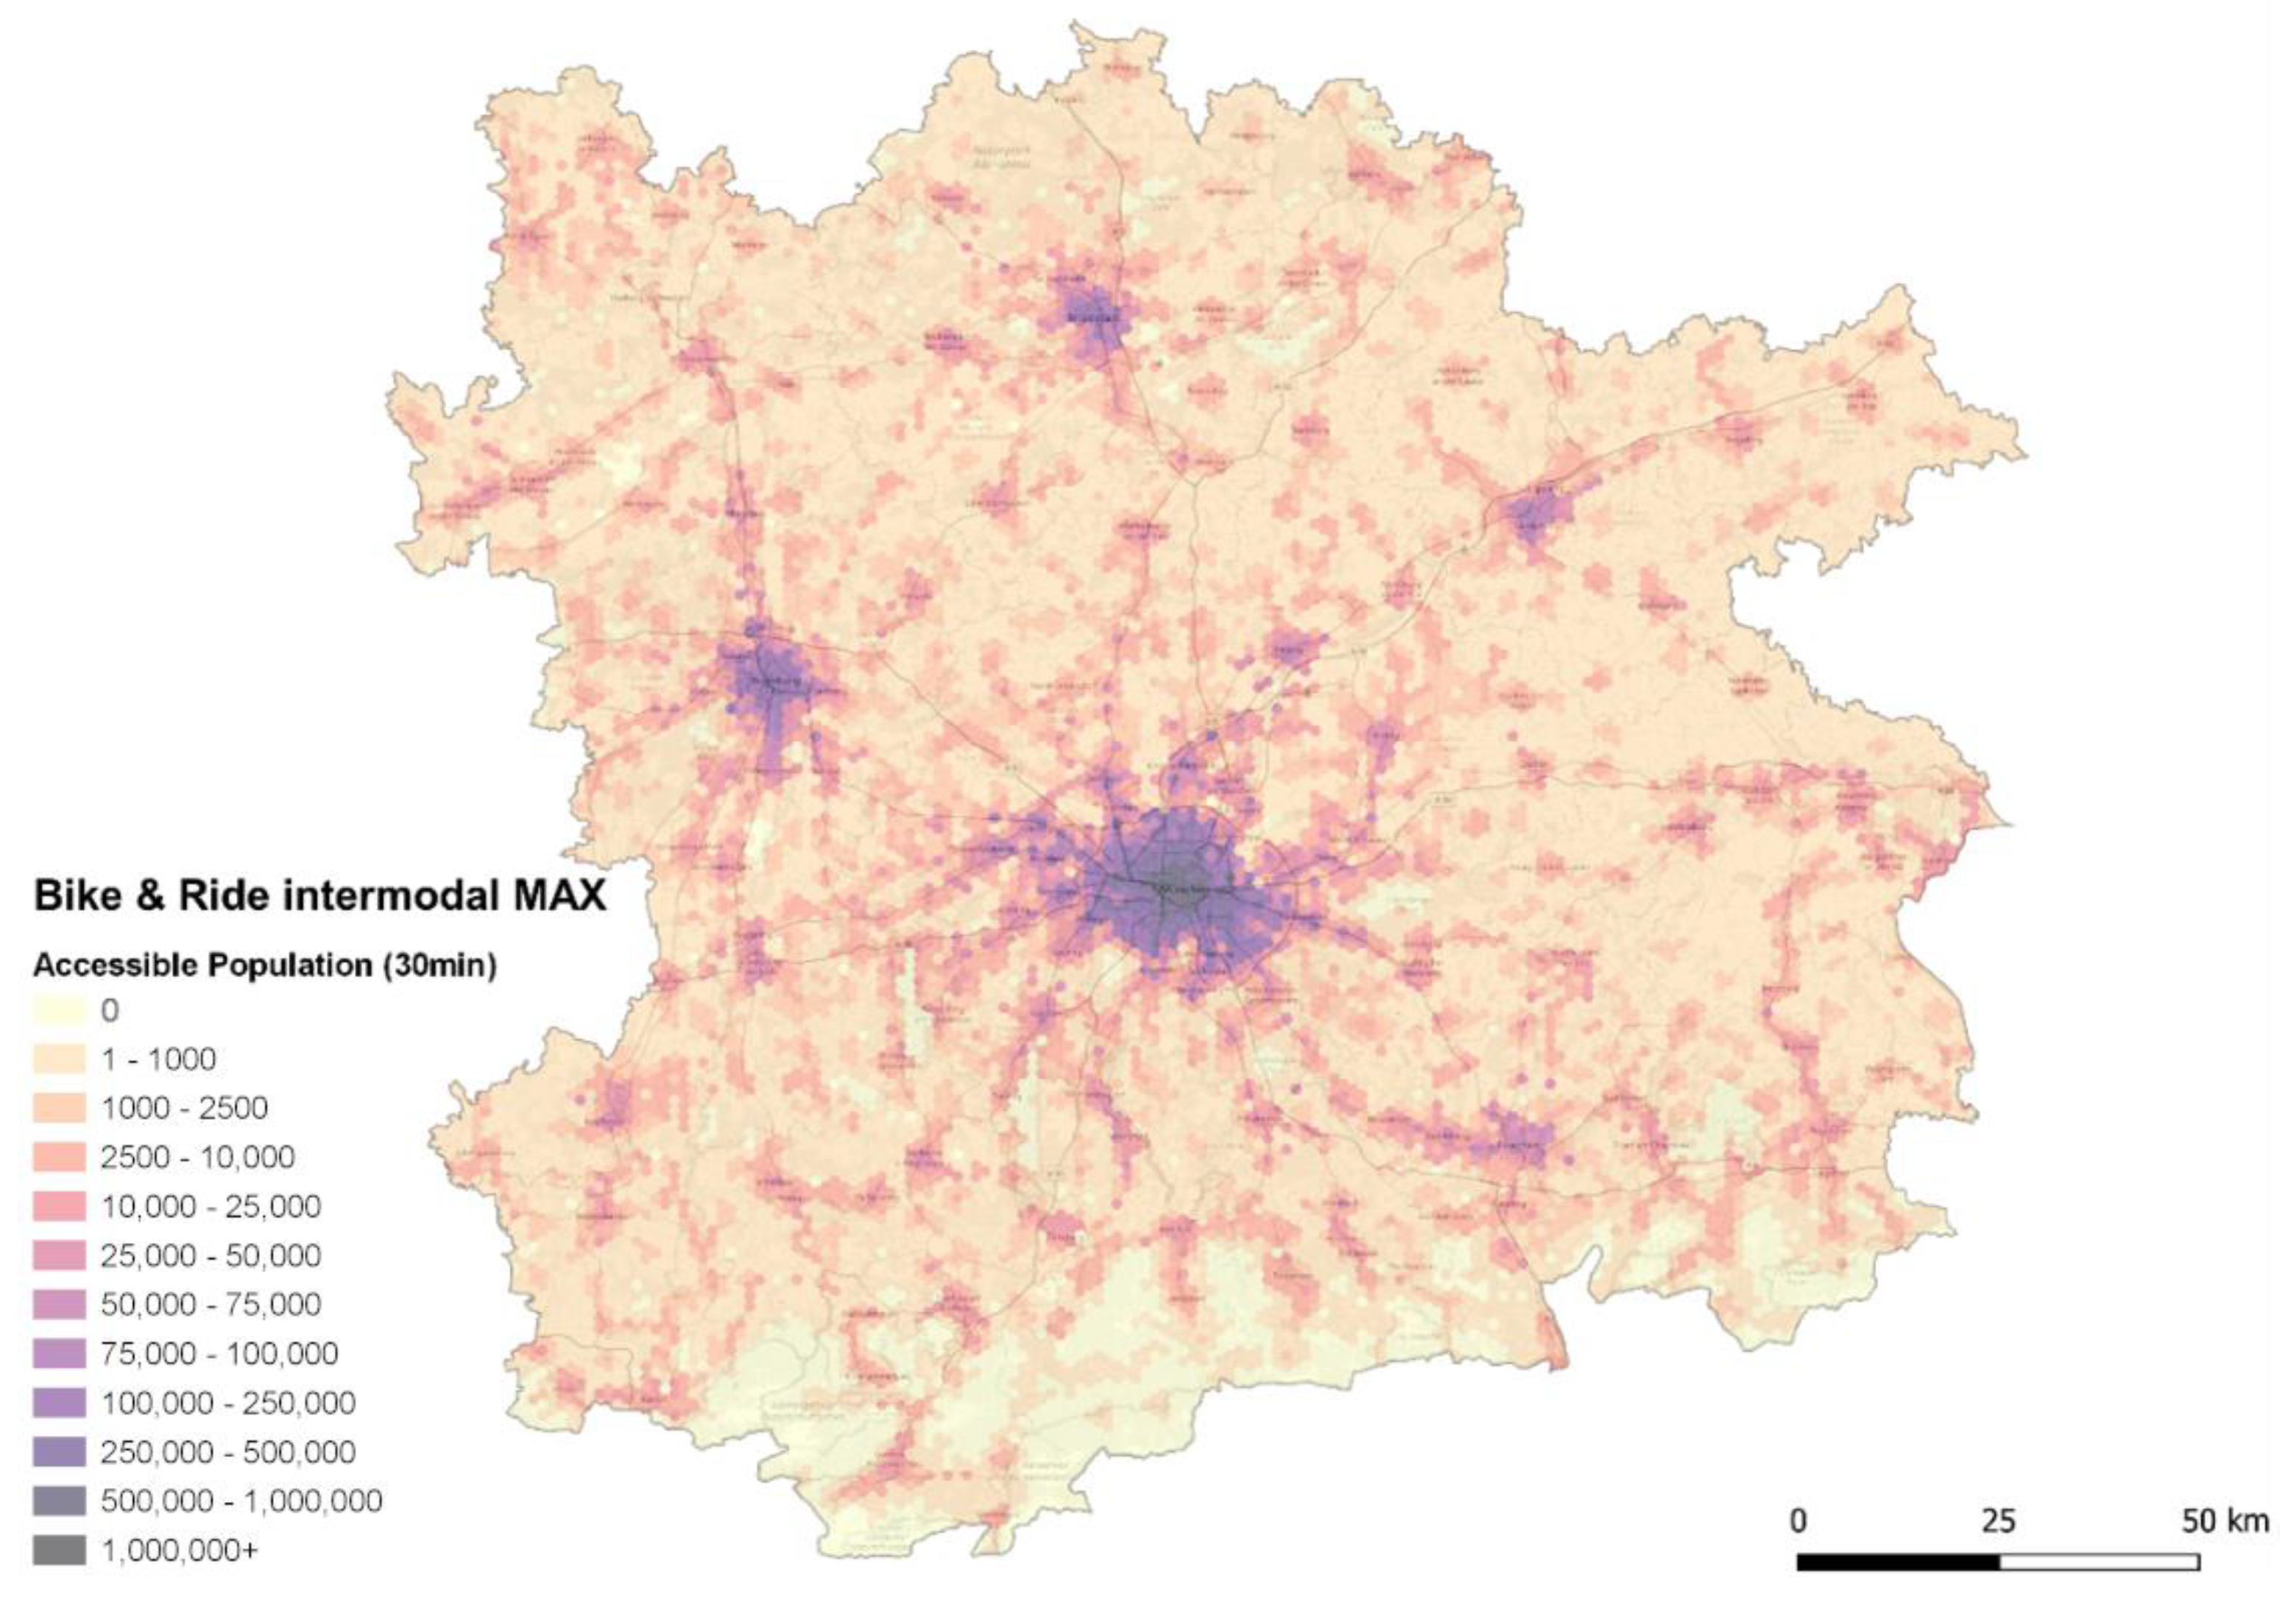
- Bike and ride;
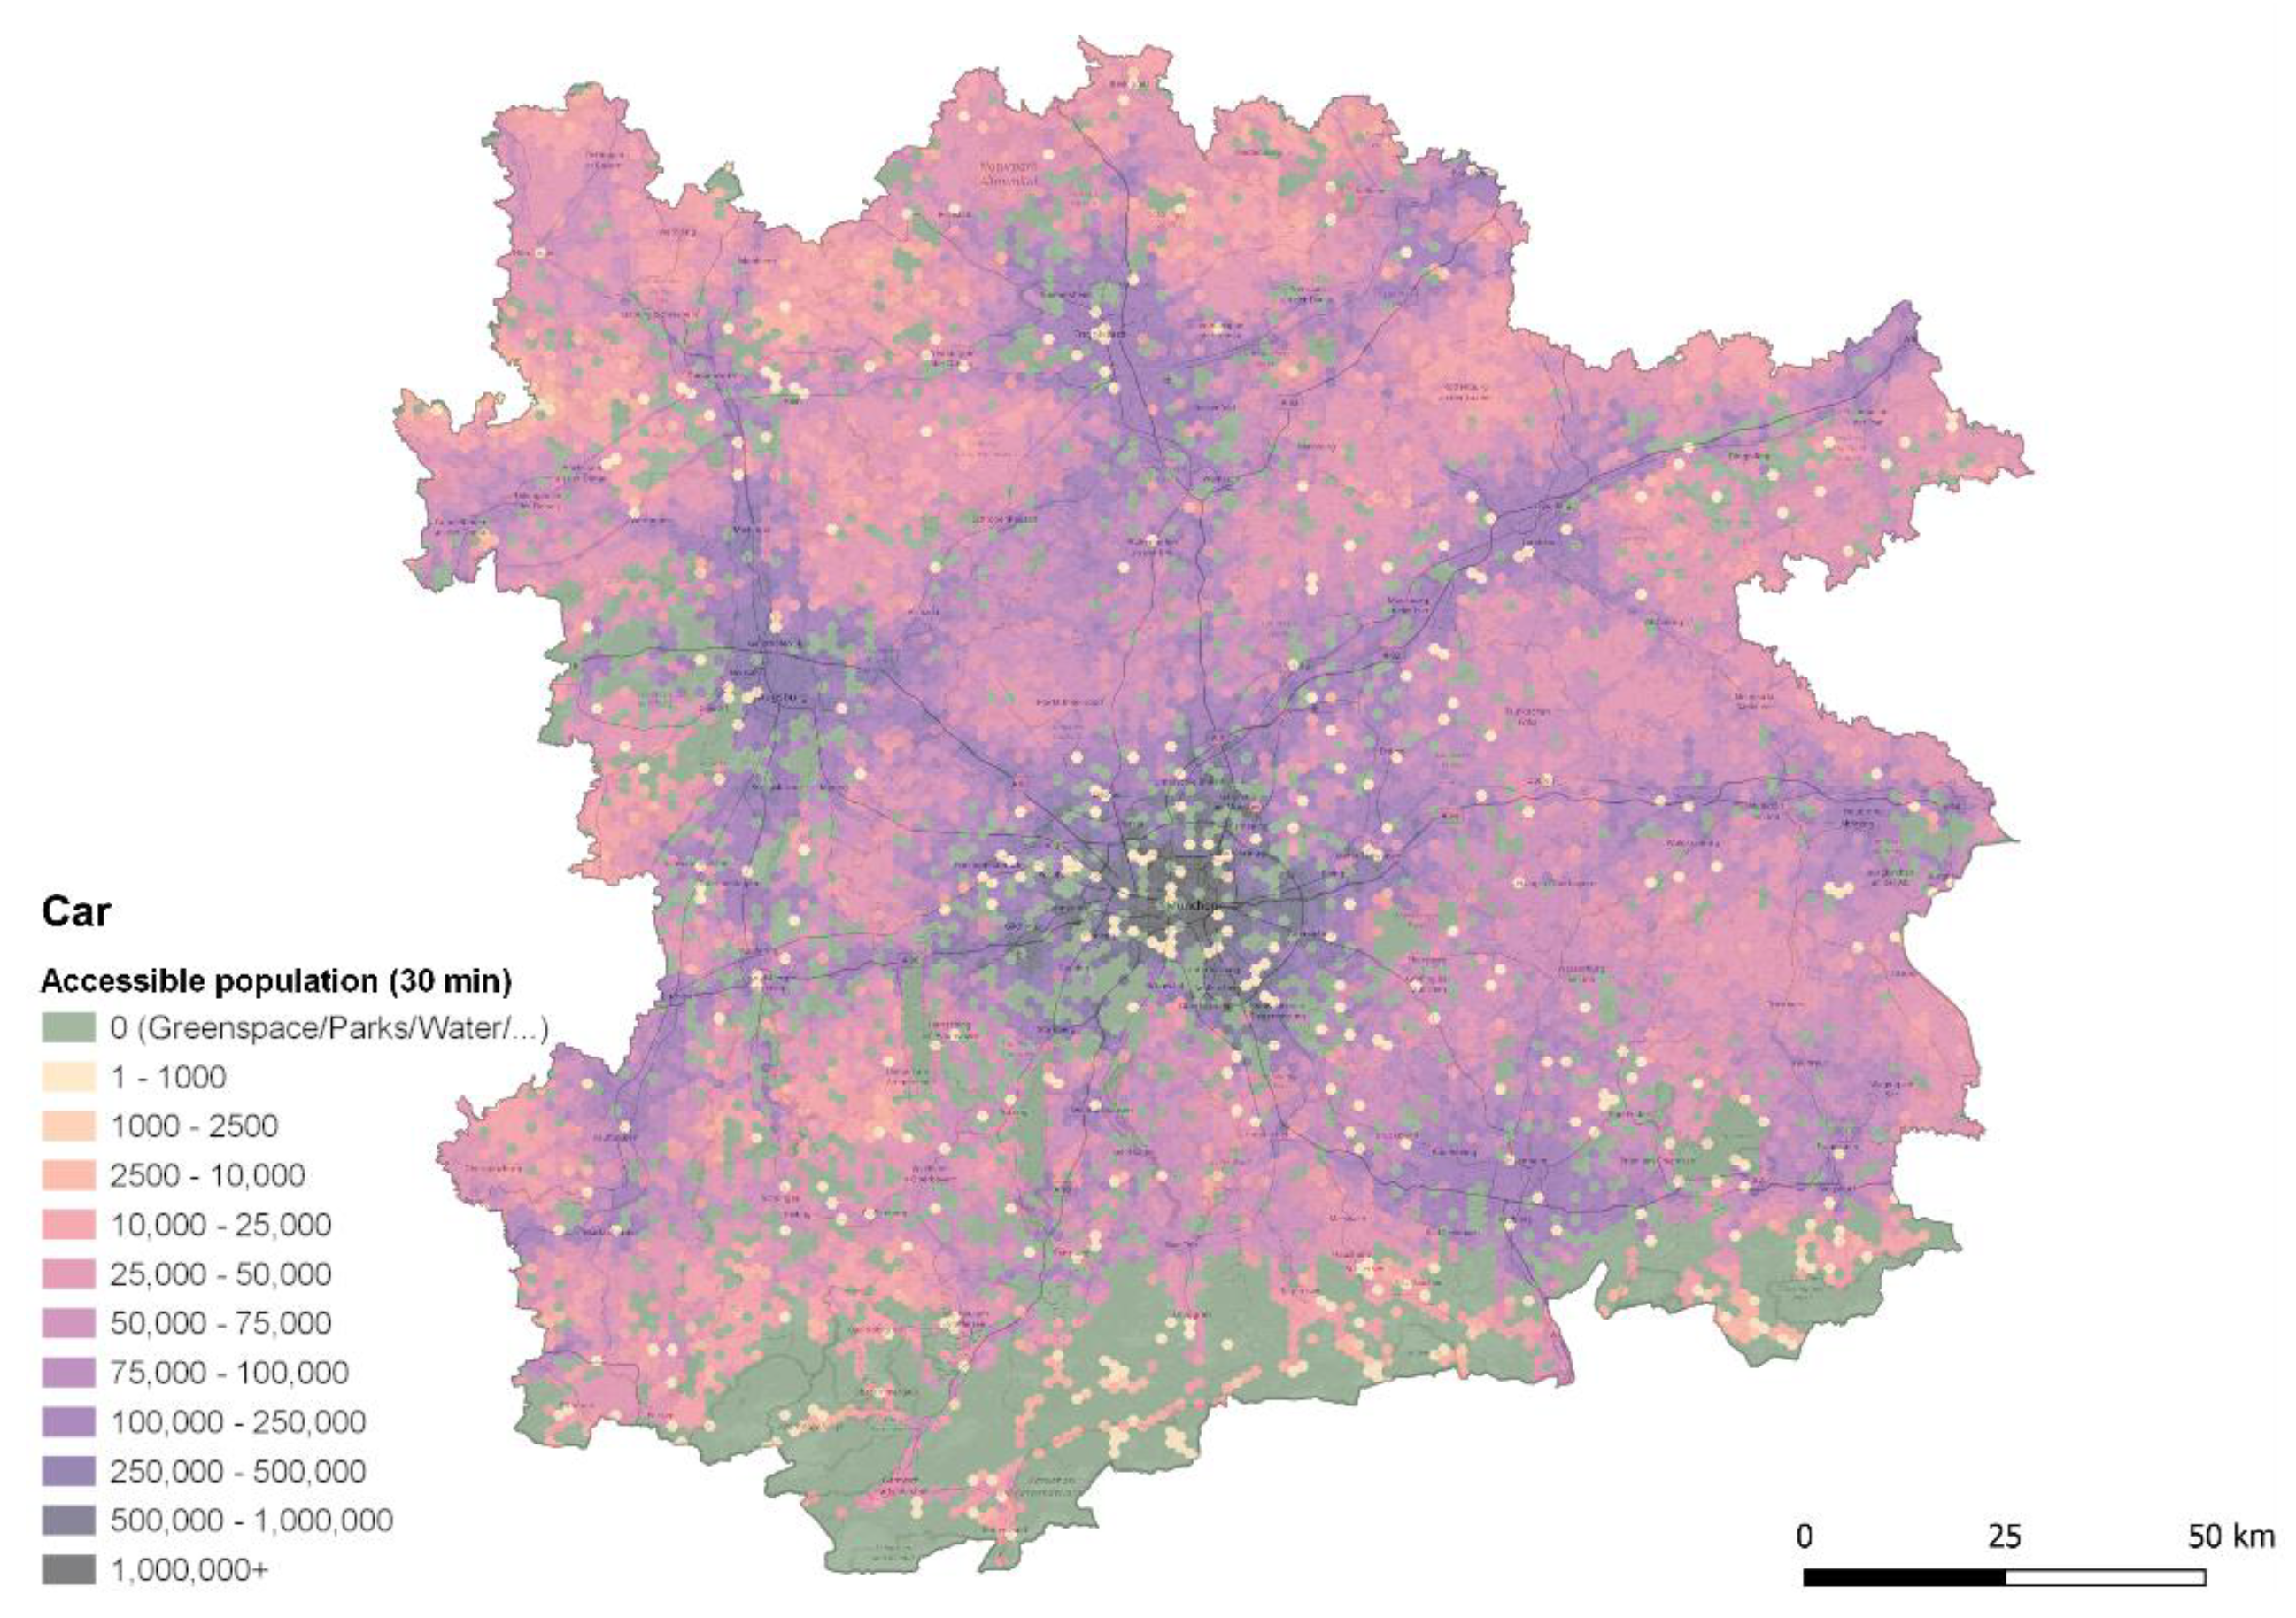
- Driving.
4. Model Interpretation and Discussion of Results
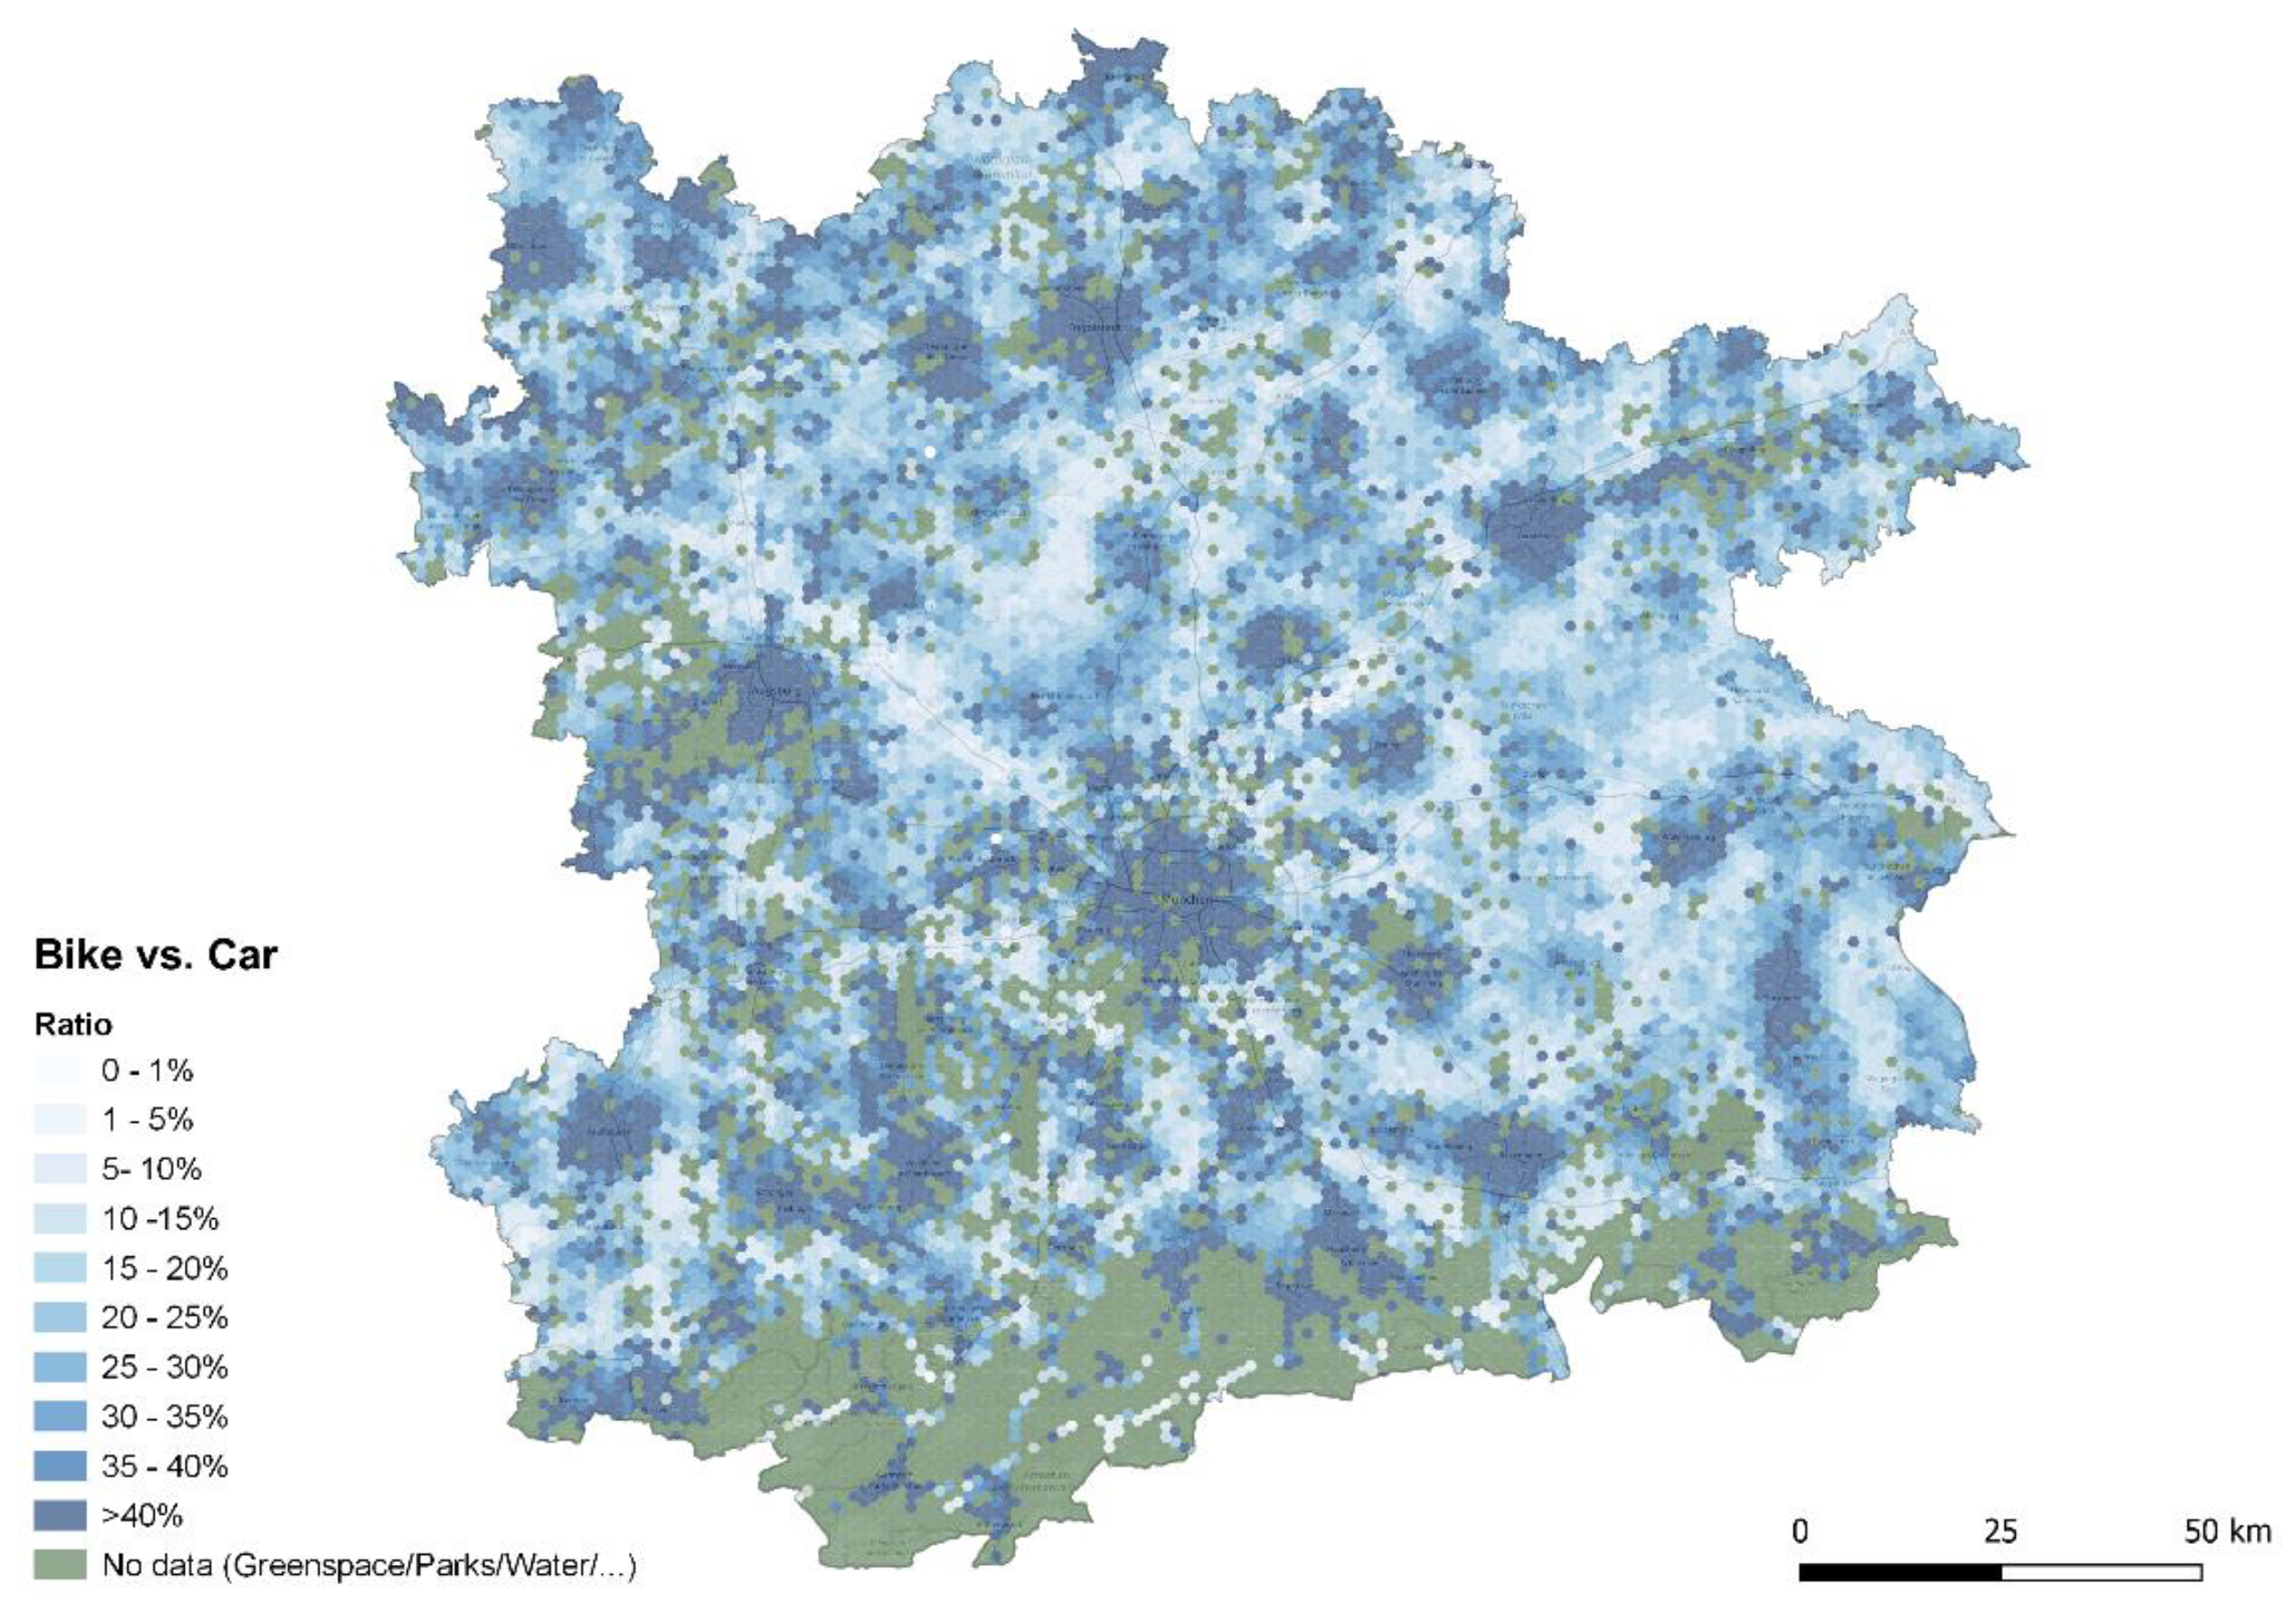
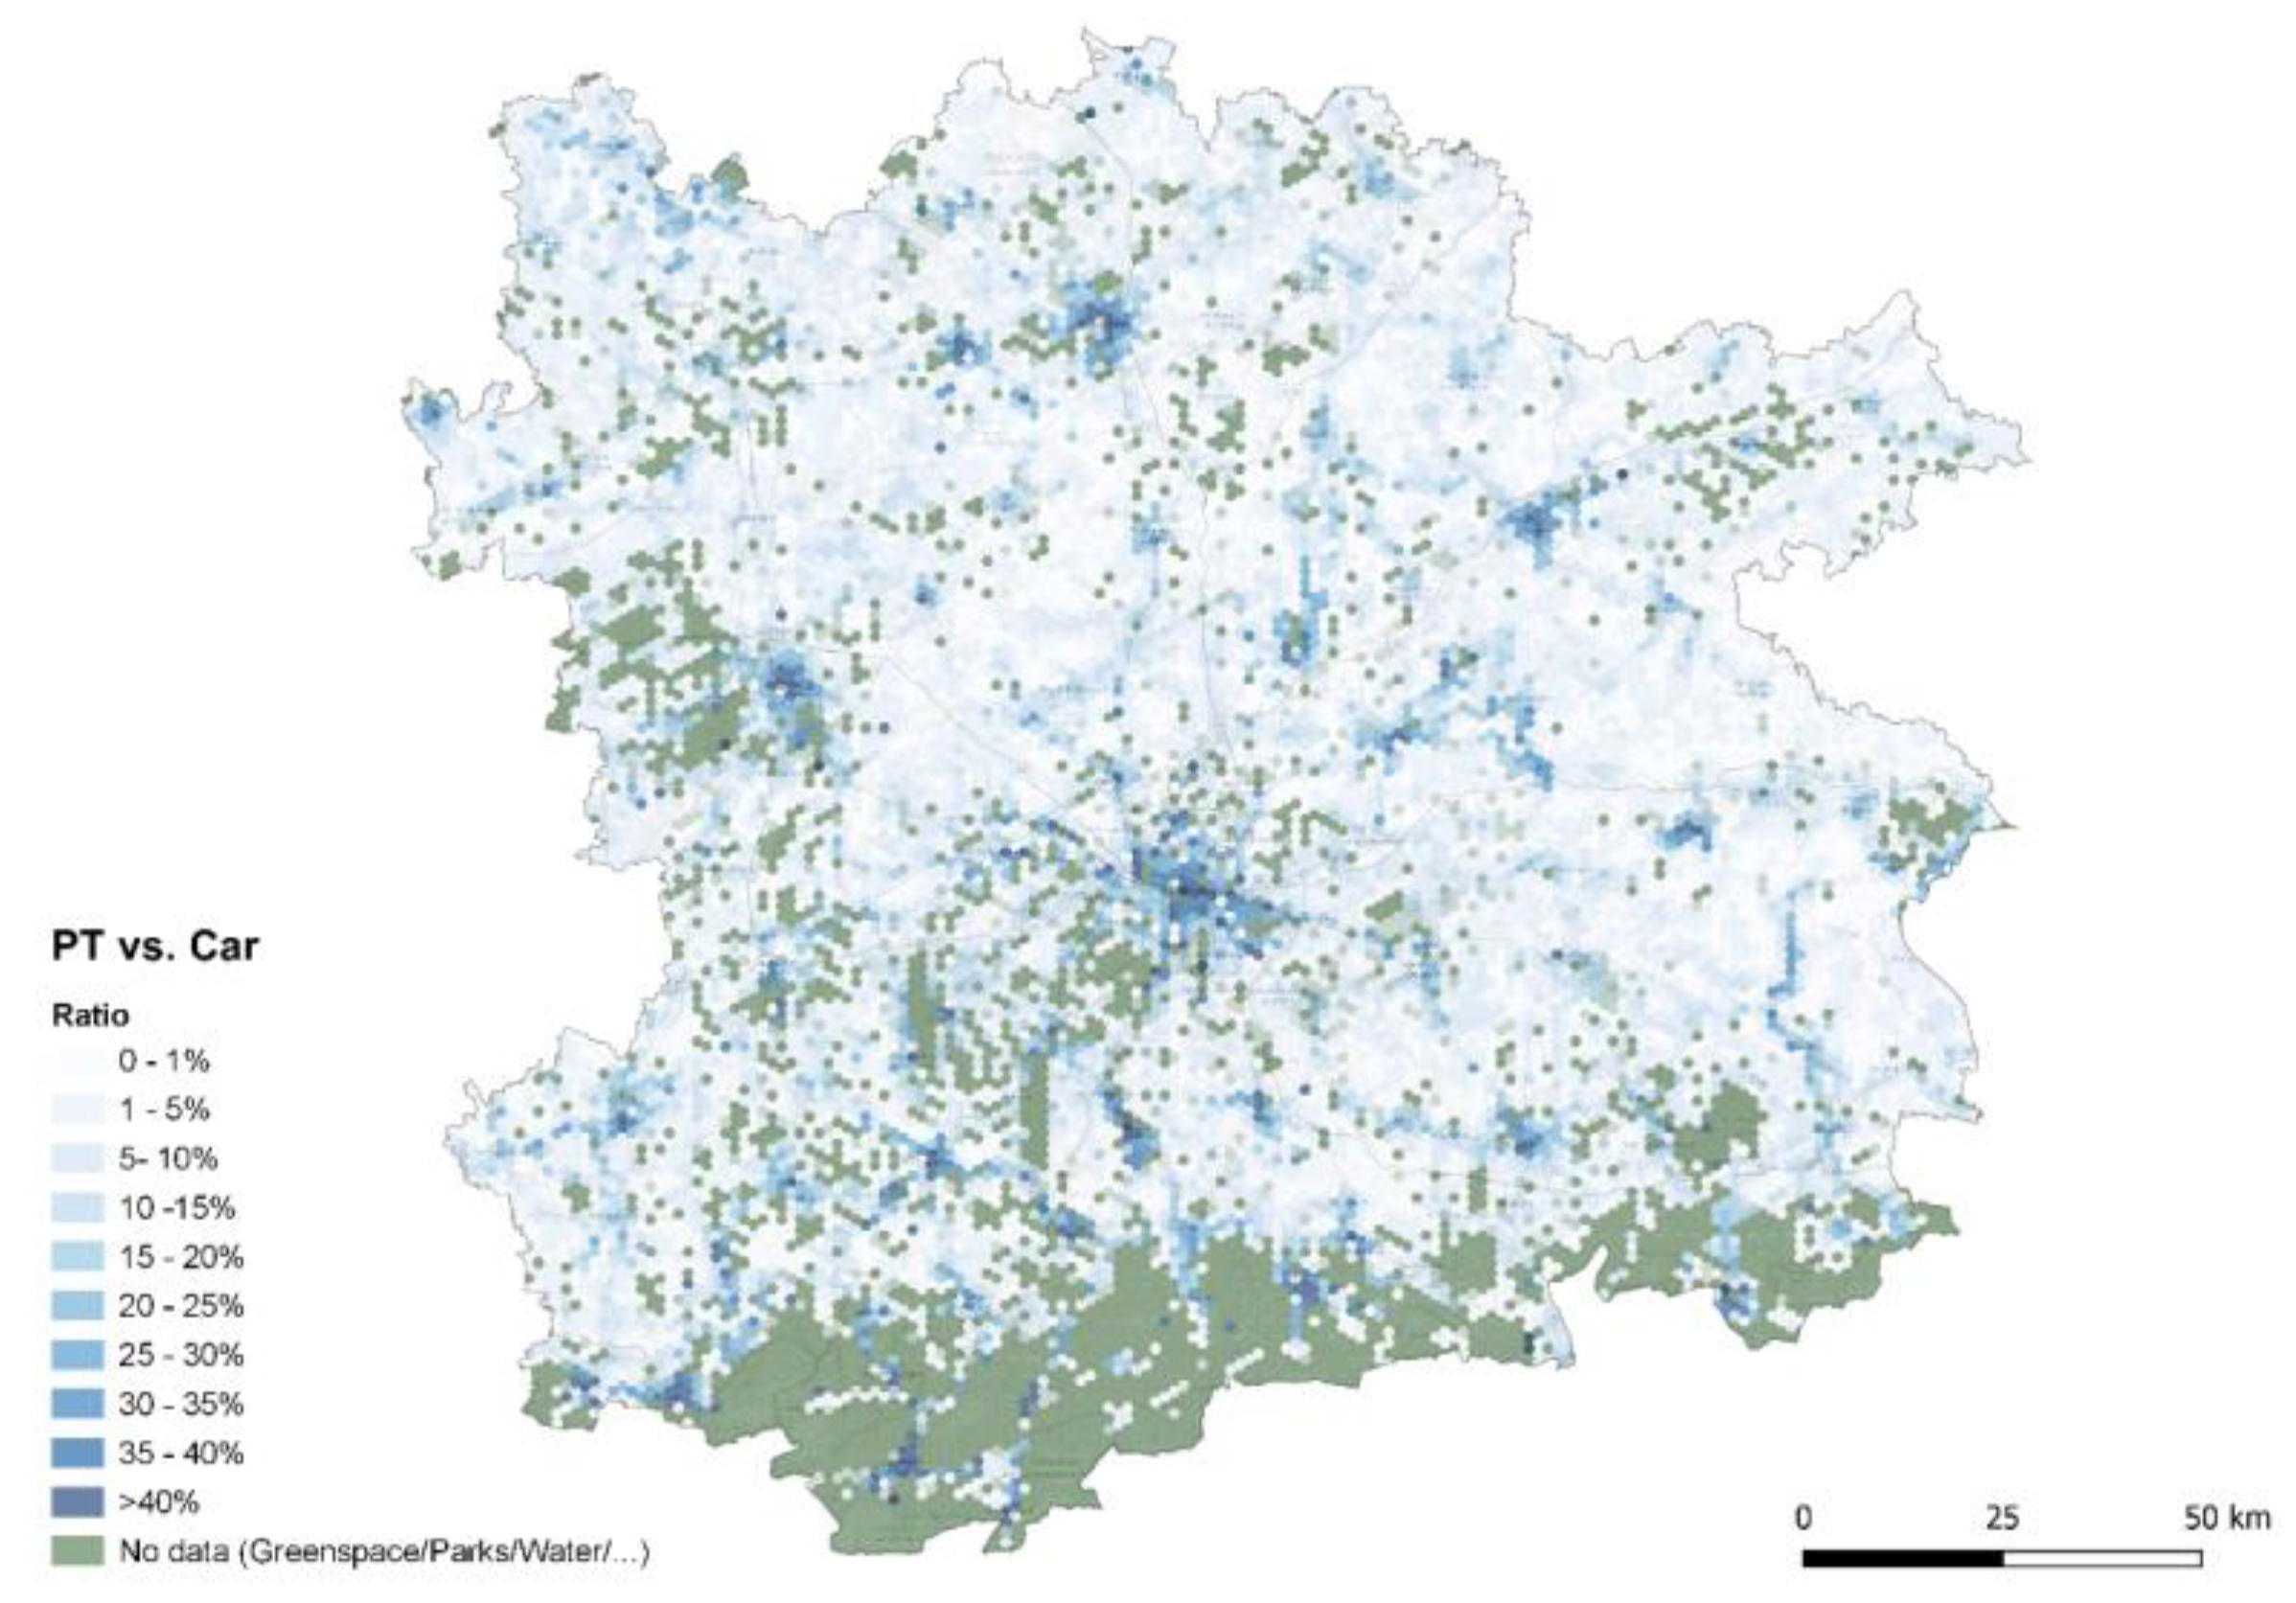
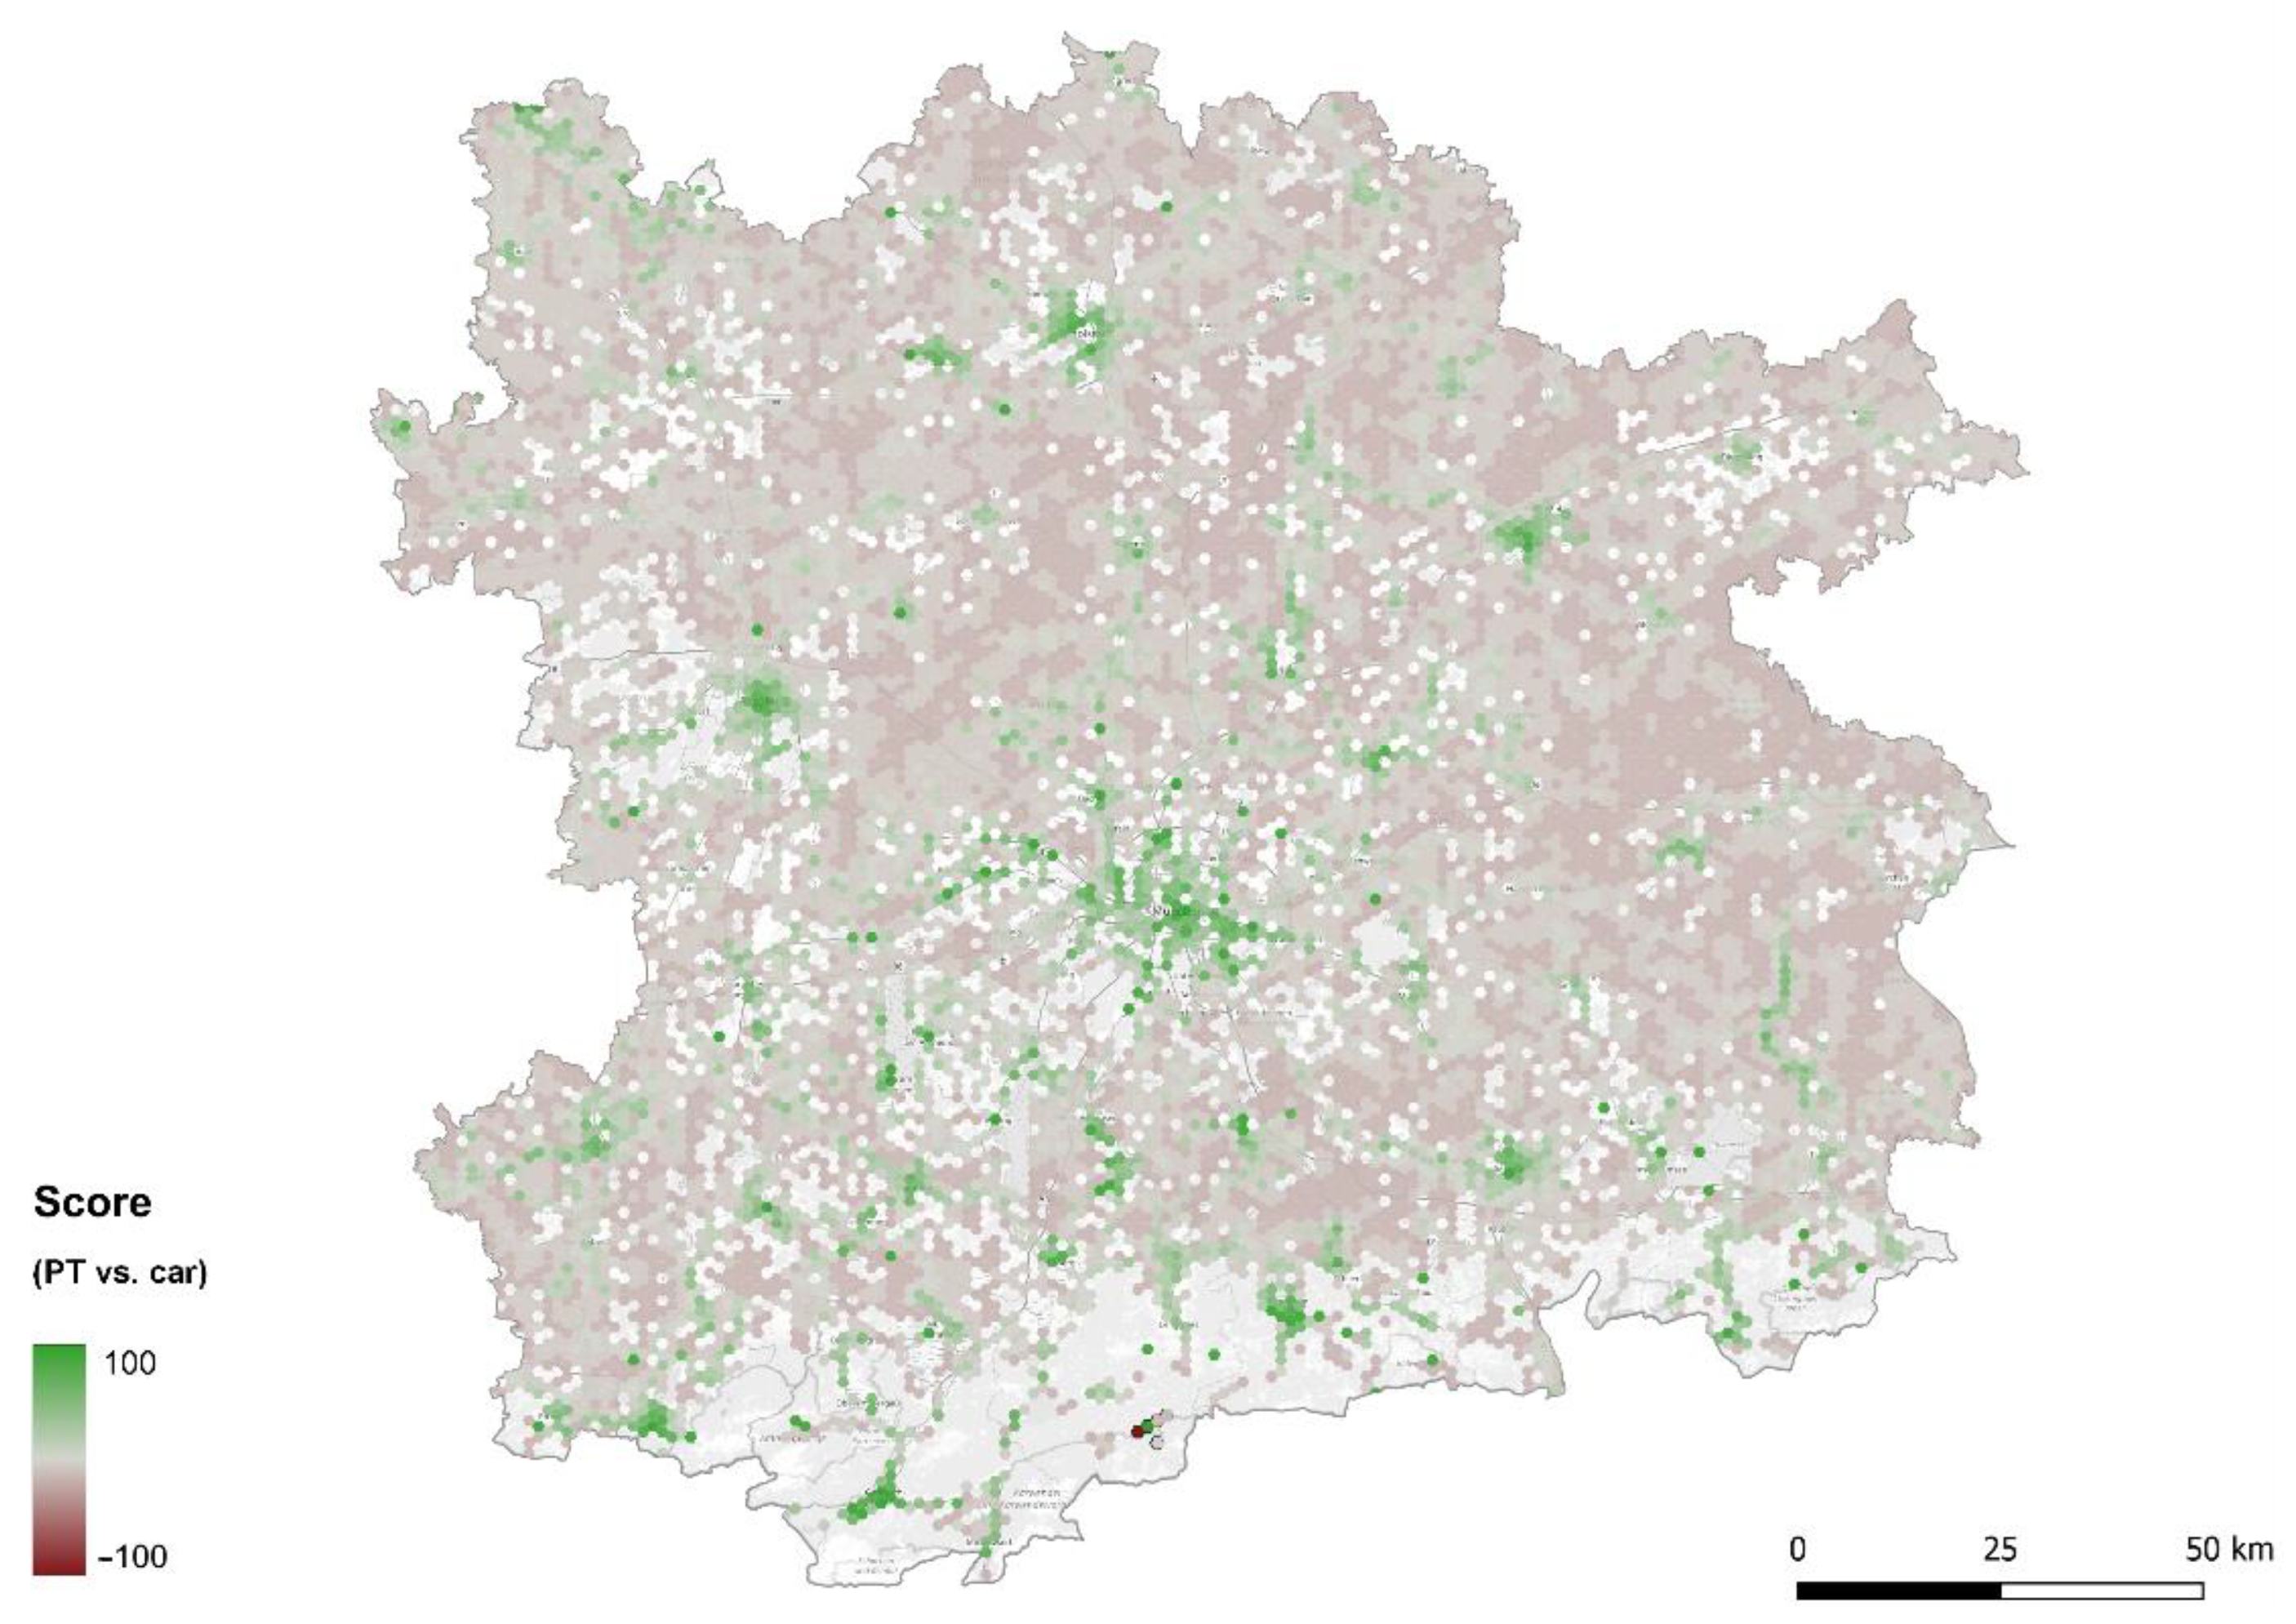
4.1. Relative Accessibility—How Well Do Public Transport and Cycling Compare to the Private Car?
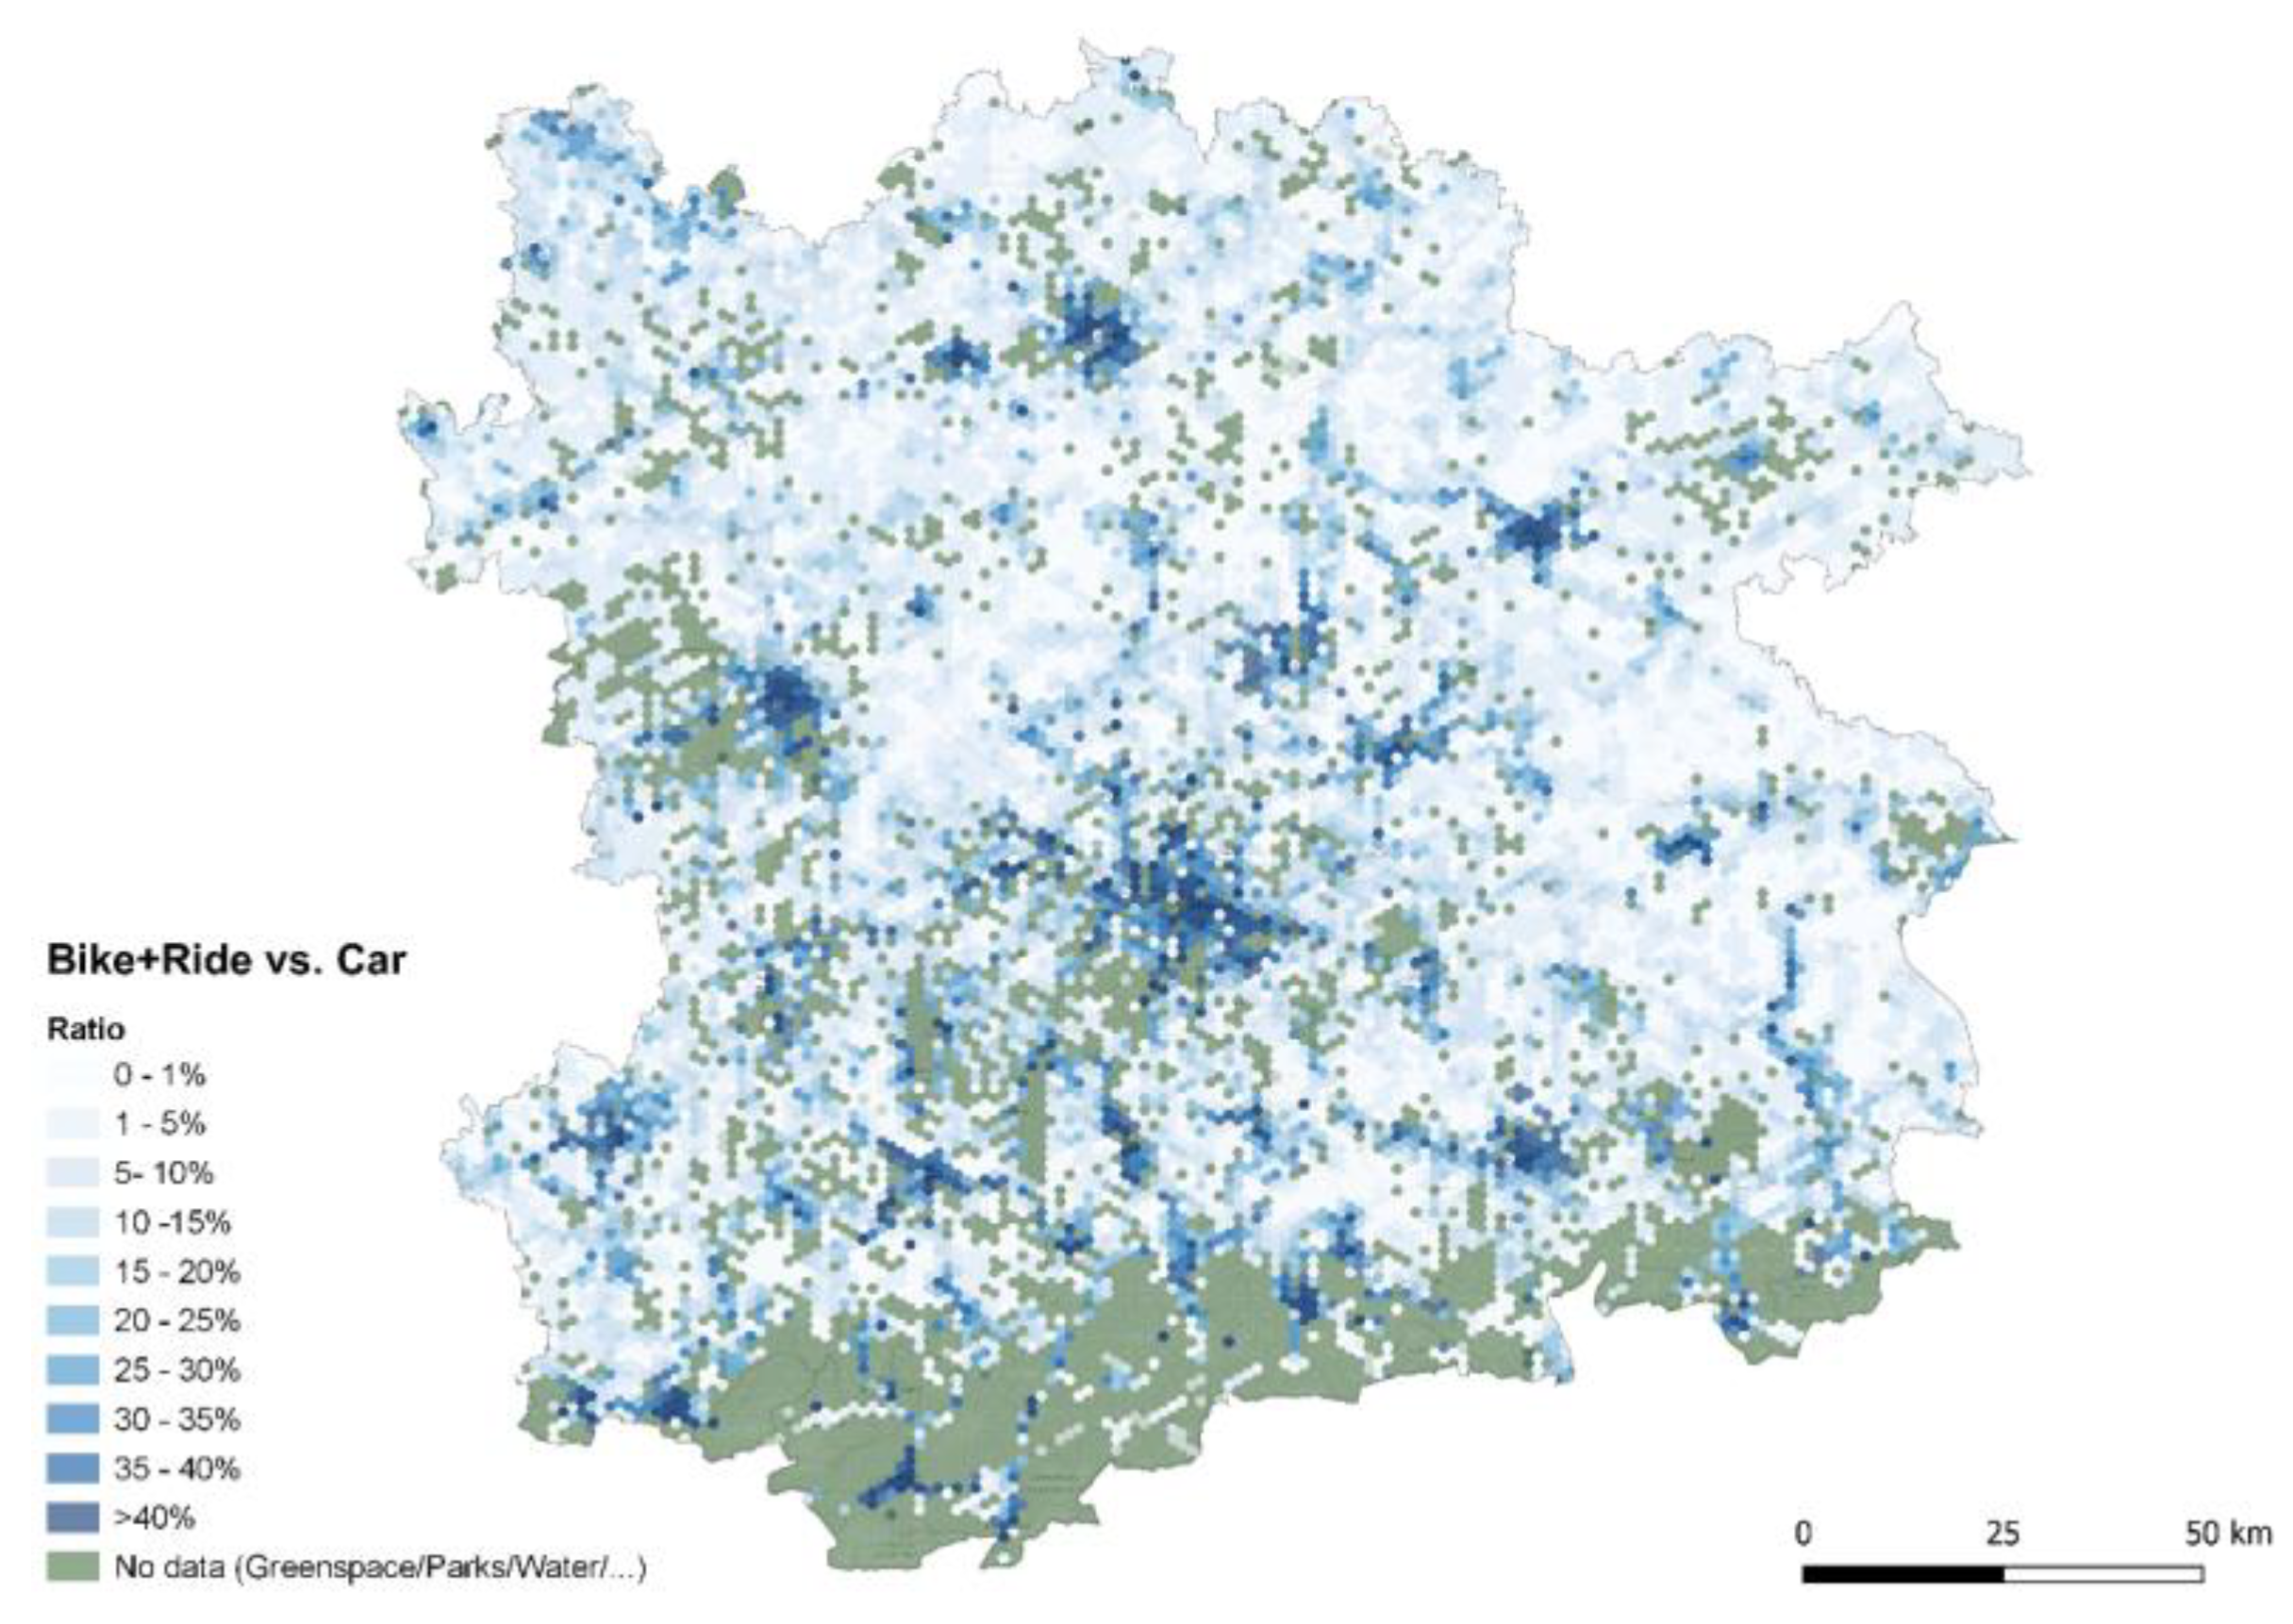
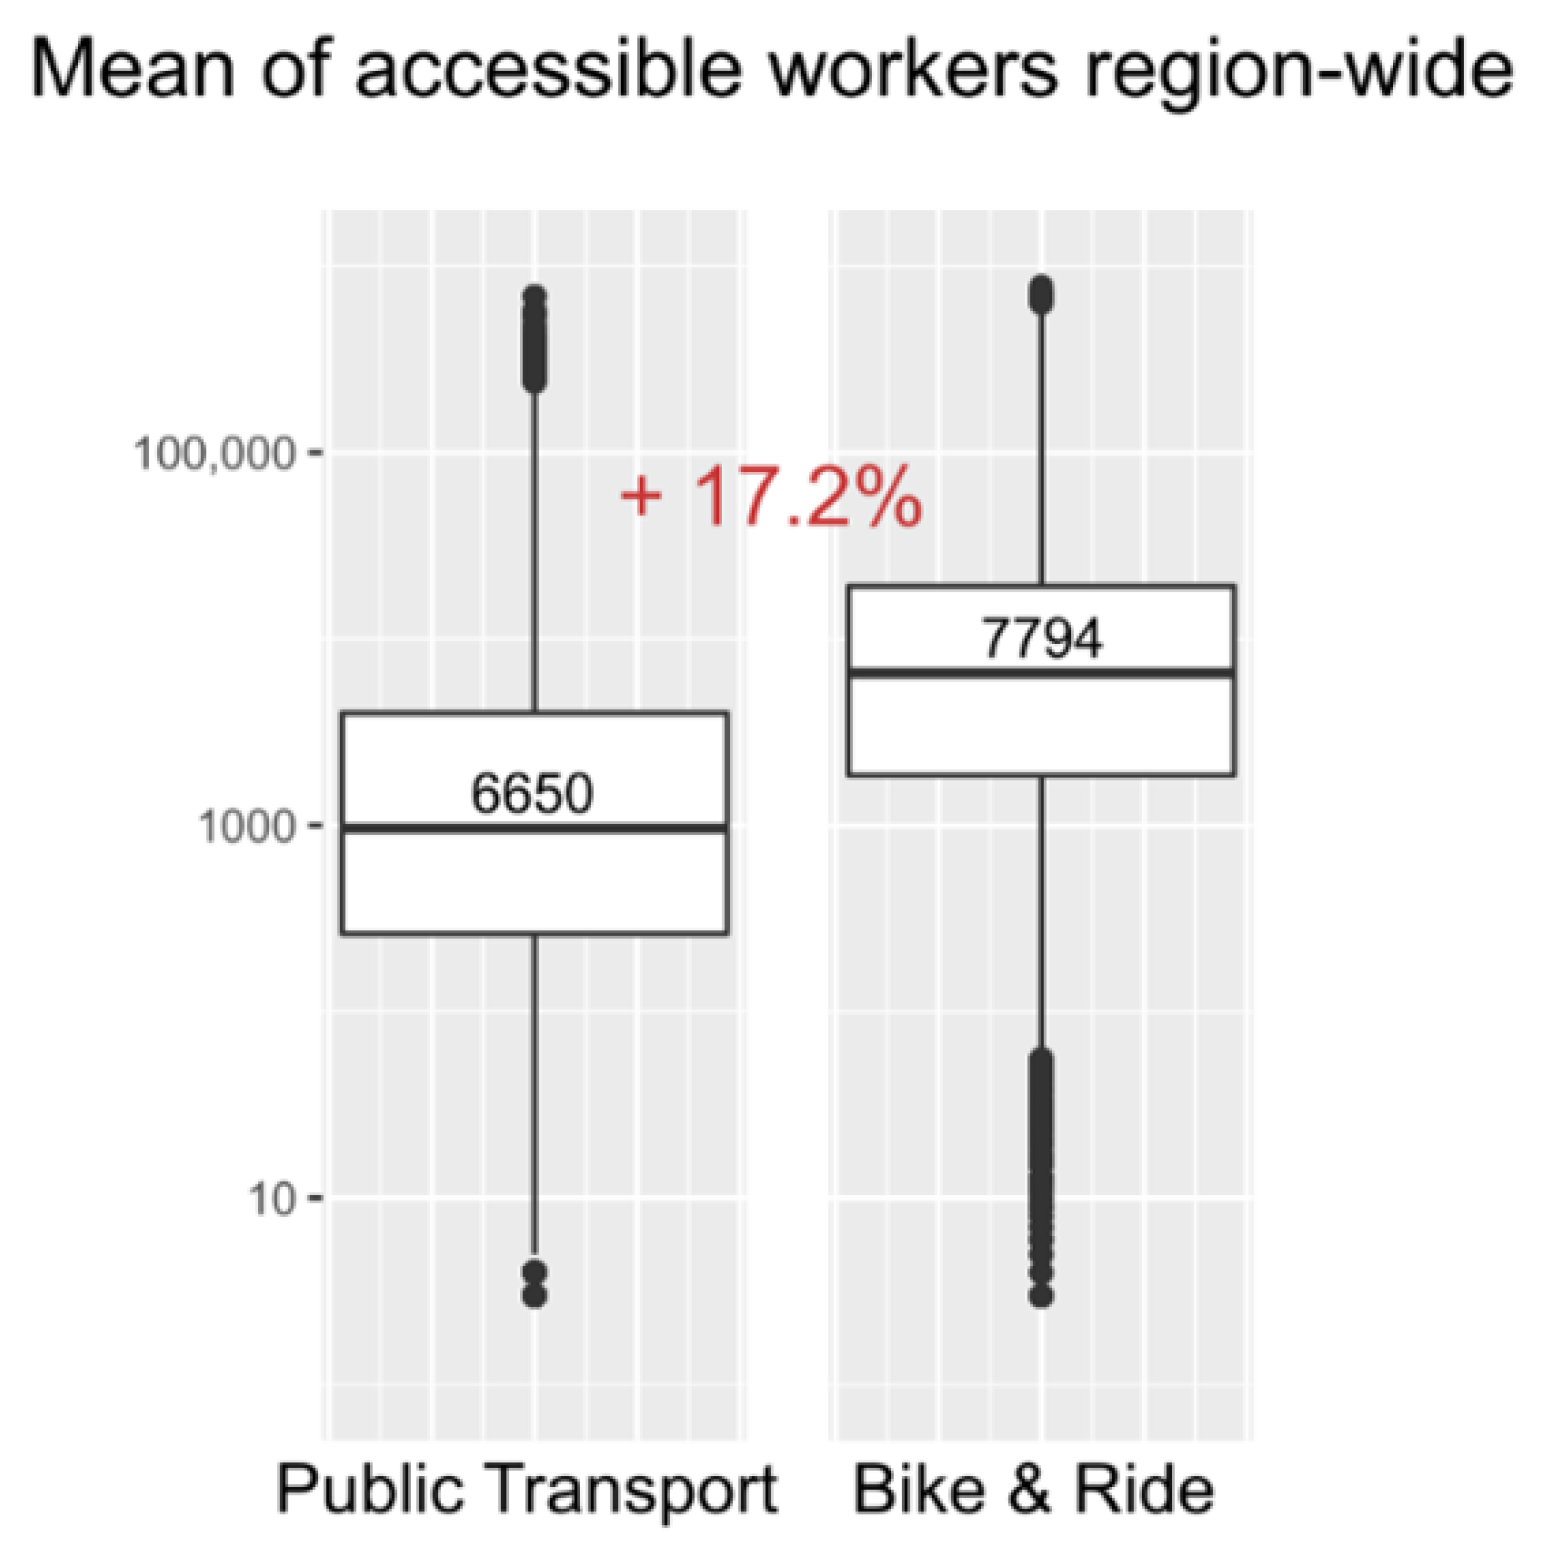
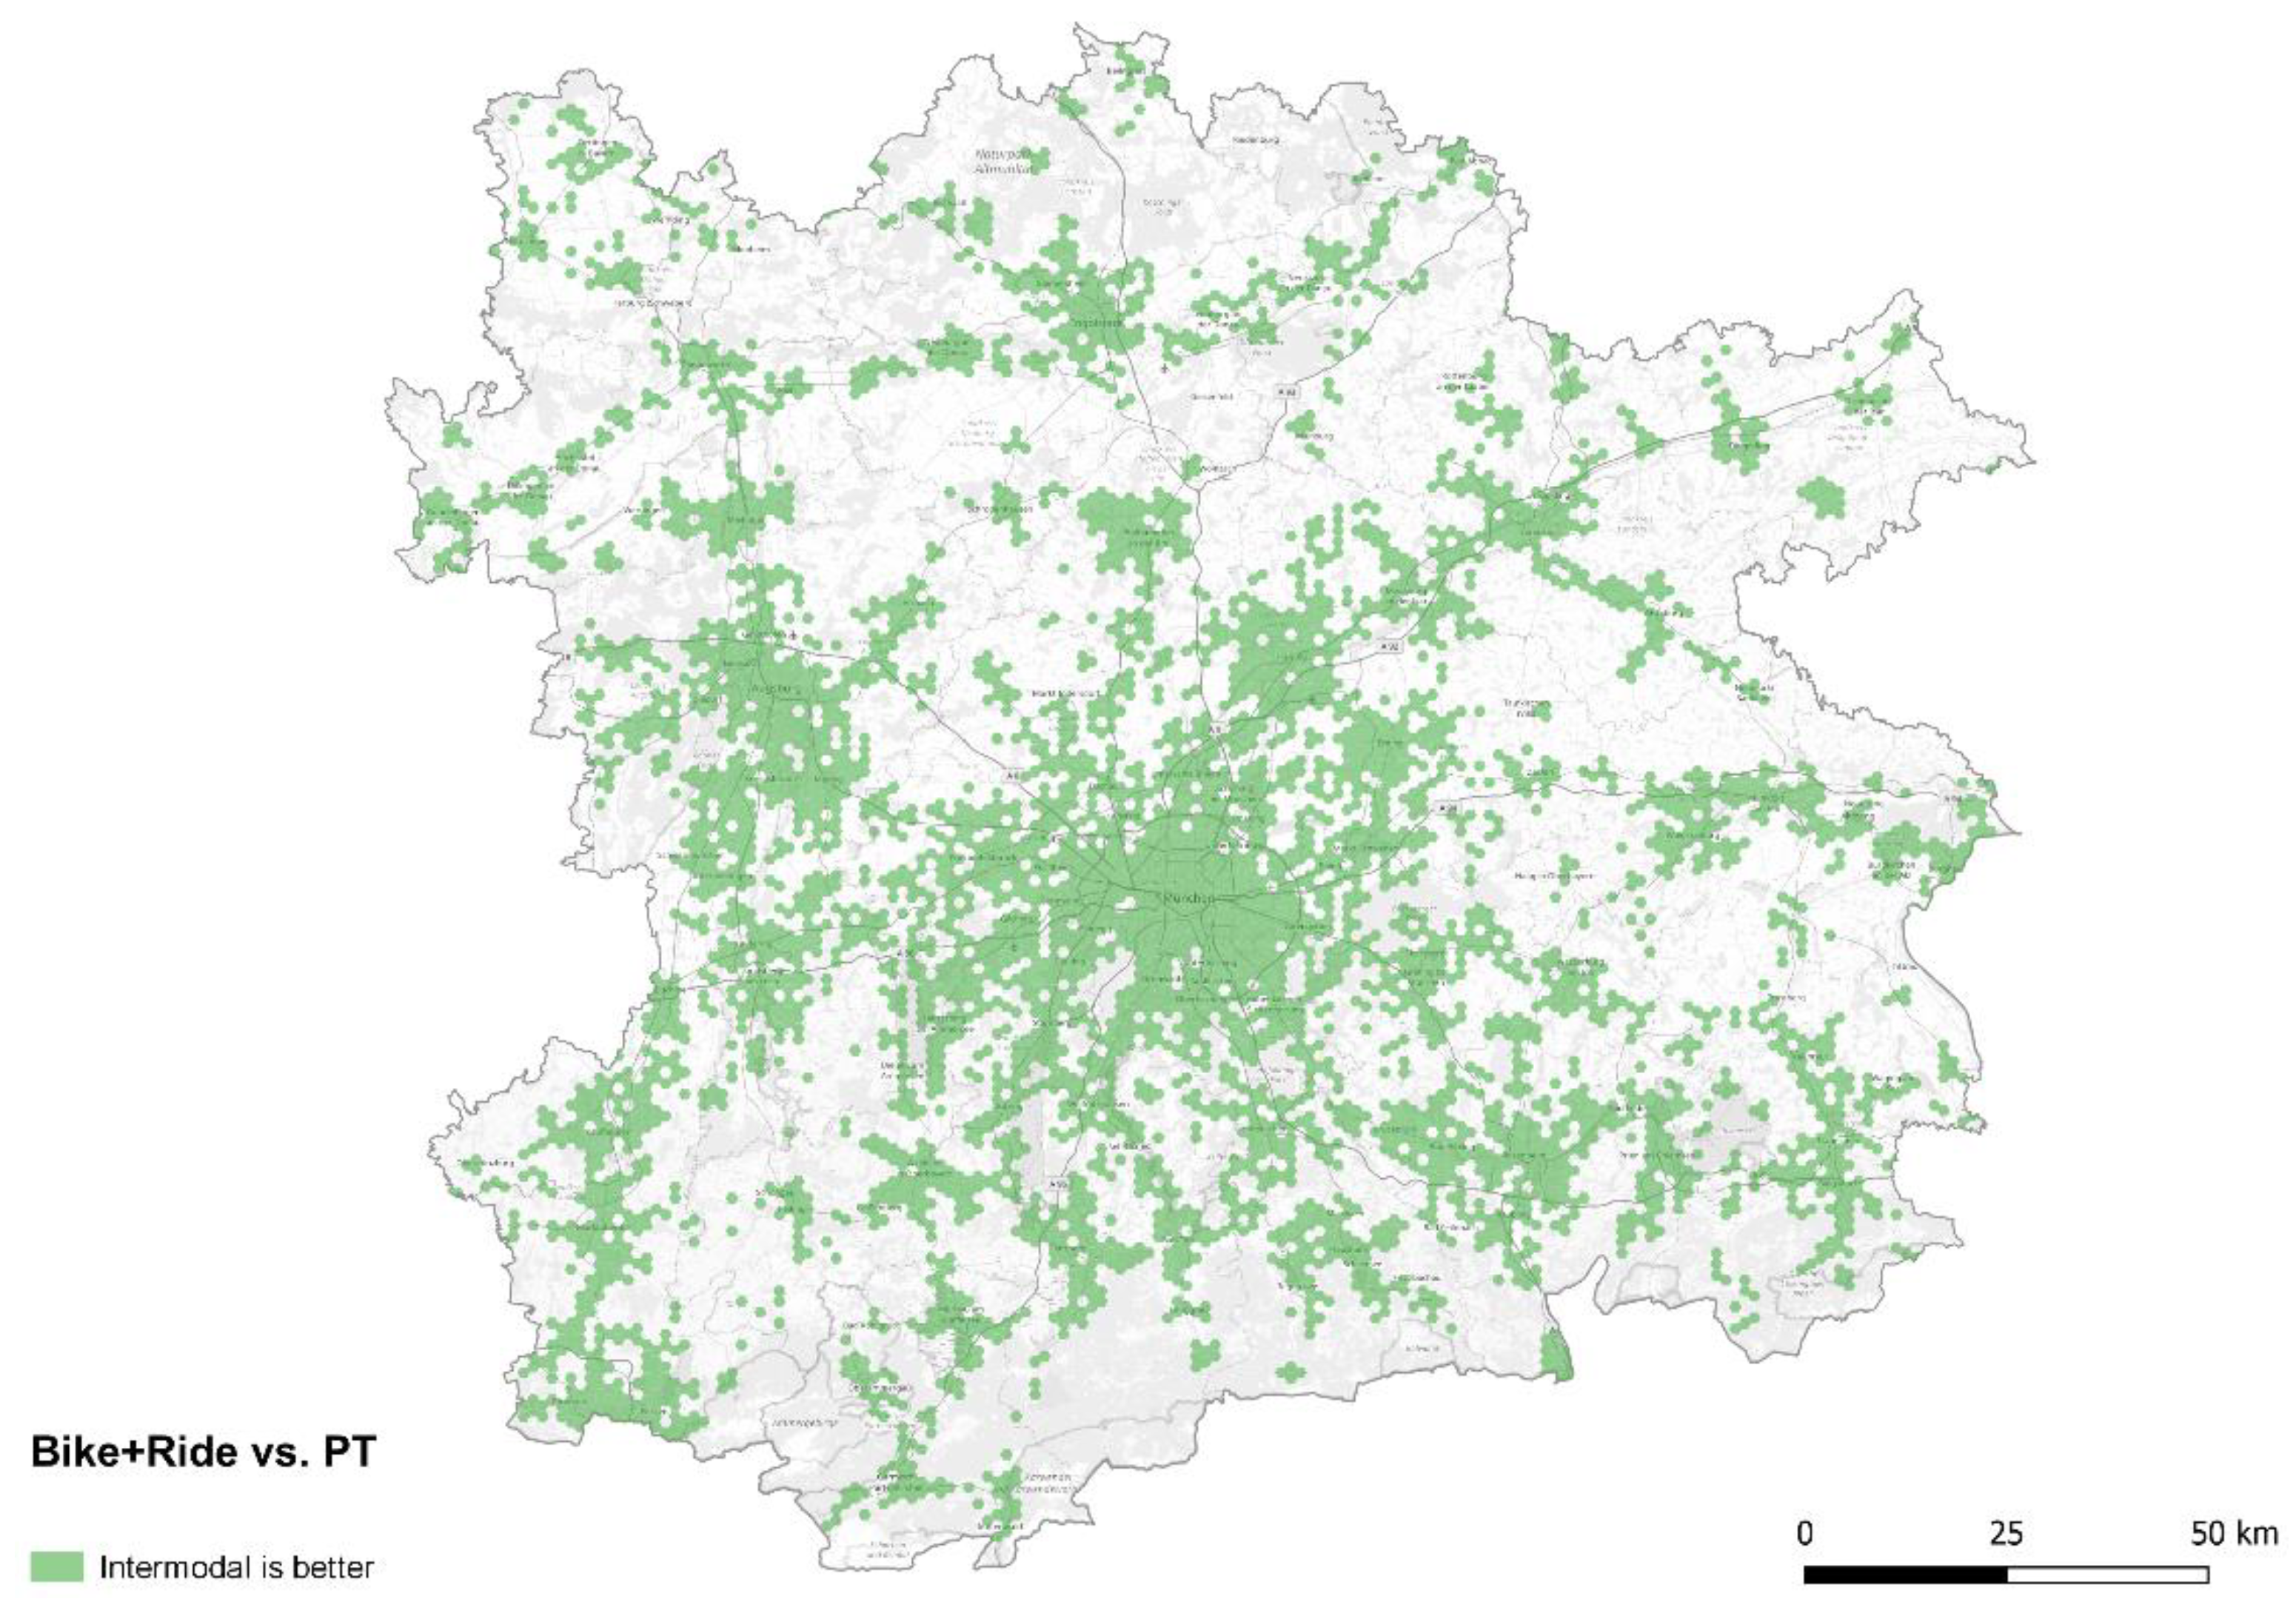
4.2. Intermodality—Where Do Workplaces Benefit from Combining Public Transport and Cycling?
- Increase in the accessible area (and thereby population) within a certain time threshold by faster first mile and/or last mile trip legs. This is the expected effect when walking is replaced by cycling, for example.
- Increase in the accessible area (and thereby population) within a certain time threshold by enabling new public transport routes that were not possible without the intermodal combination. For example, when stops can be reached by bike easily where the first public transport trip leg would be very slow.
4.3. Score Transformation
4.4. Role of Munich as the Most Accessible Area for Workplaces in the Region
4.5. Polycentricity in the Region? The Role of the Other Centers
5. Discussion
Author Contributions
Funding
Institutional Review Board Statement
Informed Consent Statement
Data Availability Statement
Acknowledgments
Conflicts of Interest
Appendix A. Data Preparation
Appendix A.1. Preparing GTFS Data
- stops.txt: filter only those stops that are located within the bounding box (by latitude /longitude).
- stop_times.txt: filter only those features whose stop_id is also found in the filtered stops.txt dataset.
- trips.txt: filter only those features whose trip_id is also found in the filtered stop_times.txt dataset.
- routes.txt: filter only those features whose route_id is also found in the filtered trips.txt dataset.
Appendix A.2. Preparing OSM Data
Appendix A.3. Preparing Census Data
References
- Brown, H.J. Changes in Workplace and Residential Locations. J. Am. Inst. Plan. 1975, 41, 32–39. [Google Scholar] [CrossRef]
- Naess, P.; Sandberg, S.L. Workplace Location, Modal Split and Energy Use for Commuting Trips. Urban Stud. 1996, 33, 557–580. [Google Scholar] [CrossRef]
- Simpson, W. Workplace Location, Residential Location, and Urban Commuting. Urban Stud. 1987, 24, 119–128. [Google Scholar] [CrossRef]
- Zhao, J. Knowledge Base Shapes Use of Space: Knowledge-Workers’ Interrelated Choices of Residence, Workplace and Commute in the Metropolitan Region of Munich. Ph.D. Thesis, Technische Universität München, München, Germany, 2017. [Google Scholar]
- Thierstein, A.; Wulfhorst, G.; Bentlage, M.; Klug, S.; Gilliard, L.; Ji, C.; Kinigadner, J.; Steiner, H.; Sterzer, L.; Wenner, F. WAM Wohnen Arbeiten Mobilität. Veränderungsdynamiken und Entwicklungsoptionen für die Metropolregion München; Project Report; Technische Universität München: München, Germany, 2016. [Google Scholar]
- Ding, C.; Wang, D.; Liu, C.; Zhang, Y.; Yang, J. Exploring the Influence of Built Environment on Travel Mode Choice Considering the Mediating Effects of Car Ownership and Travel Distance. Transp. Res. Part A Policy Pract. 2017, 100, 65–80. [Google Scholar] [CrossRef]
- Ding, C.; Cao, X. How Does the Built Environment at Residential and Work Locations Affect Car Ownership? An Application of Cross-Classified Multilevel Model. J. Transp. Geogr. 2019, 75, 37–45. [Google Scholar] [CrossRef]
- Pfertner, M.; Büttner, B.; Duran-Rodas, D.; Wulfhorst, G. Workplace Relocation and Its Association with Car Availability and Commuting Mode Choice. J. Transp. Geogr. 2022, 98, 103264. [Google Scholar] [CrossRef]
- Zarabi, Z.; Lord, S. Toward More Sustainable Behavior: A Systematic Review of the Impacts of Involuntary Workplace Relocation on Travel Mode Choice. J. Plan. Lit. 2019, 34, 38–58. [Google Scholar] [CrossRef]
- Vale, D.S.; Pereira, M.; Viana, C.M. Different Destination, Different Commuting Pattern? Analyzing the Influence of the Campus Location on Commuting. J. Transp. Land Use 2018, 11, 1–18. [Google Scholar] [CrossRef]
- Hansen, W.G. How Accessibility Shapes Land Use. J. Am. Inst. Plan. 1959, 25, 73–76. [Google Scholar] [CrossRef]
- Geurs, K.T.; van Wee, B. Accessibility Evaluation of Land-Use and Transport Strategies: Review and Research Directions. J. Transp. Geogr. 2004, 12, 127–140. [Google Scholar] [CrossRef]
- Bruinsma, F.R.; Rietveld, P. The Accessibility of European Cities: Theoretical Framework and Comparison Approaches. Env. Plann 1998, 30, 449–521. [Google Scholar] [CrossRef]
- Reggiani, A. Accessibility, Trade and Location Behaviour: An Introduction. In Accessibility, Trade and Location Behaviour. Ashgate, Aldershot; Reggiani, A., Ed.; Routledge: Abingdon-on-Thames, UK, 1998; pp. 1–16. [Google Scholar]
- Vickerman, R.W. The Regional Impacts of Trans-European Networks. Ann. Reg. Sci. 1995, 29, 237–254. [Google Scholar] [CrossRef]
- Morris, J.M.; Dumble, P.L.; Wigan, M.R. Accessibility indicators for transport planning. Transp. Res. A 1979, 13, 91–109. [Google Scholar] [CrossRef]
- Bertolini, L.; le Clercq, F.; Kapoen, L. Sustainable Accessibility: A Conceptual Framework to Integrate Transport and Land Use Plan-Making. Two Test-Applications in the Netherlands and a Reflection on the Way Forward. Transp. Policy 2005, 12, 207–220. [Google Scholar] [CrossRef]
- META-Accessibility. Available online: https://www.accessibilityplanning.eu// (accessed on 8 June 2022).
- Papa, E.; Silva, C.; Te Brömmelstroet, M.; Hull, A. Accessibility Instruments for Planning Practice: A Review of European Experiences. J. Transp. Land Use 2015, 9, 57–75. [Google Scholar] [CrossRef]
- Silva, C.; Bertolini, L.; te Brömmelstroet, M.; Milakis, D.; Papa, E. Accessibility Instruments in Planning Practice: Bridging the Implementation Gap. Transp. Policy 2017, 53, 135–145. [Google Scholar] [CrossRef]
- Silva, C.; Pinto, N.; Bertolini, L. Designing Accessibility Instruments: Lessons on Their Usability for Integrated Land Use and Transport Planning Practices; Routledge: Abingdon-on-Thames, UK, 2019. [Google Scholar]
- Siddiq, F.; Taylor, B.D. Tools of the Trade?: Assessing the Progress of Accessibility Measures for Planning Practice. J. Am. Plan. Assoc. 2021, 87, 497–511. [Google Scholar] [CrossRef]
- Malekzadeh, A.; Chung, E. A Review of Transit Accessibility Models: Challenges in Developing Transit Accessibility Models. Int. J. Sustain. Transp. 2020, 14, 733–748. [Google Scholar] [CrossRef]
- Bhat, C.; Handy, S.; Kockelman, K.; Mahmassani, H.; Chen, Q.; Weston, L. Development of an Urban Accessibility Index: Literature Review. 2000. Available online: https://rosap.ntl.bts.gov/view/dot/14882 (accessed on 3 August 2022).
- Wu, H.; Levinson, D. Unifying Access. Transp. Res. Part D Transp. Environ. 2020, 83, 102355. [Google Scholar] [CrossRef]
- Páez, A.; Scott, D.M.; Morency, C. Measuring Accessibility: Positive and Normative Implementations of Various Accessibility Indicators. J. Transp. Geogr. 2012, 25, 141–153. [Google Scholar] [CrossRef]
- Peter, M. Die Berechnung Kleinräumiger Und Multimodaler Erreichbarkeiten Auf Regionaler Ebene. Ph.D. Thesis, Technische Universität Hamburg, Hamburg, Germany, 2021. [Google Scholar]
- Reggiani, A.; Martín, J.C. Guest Editorial: New Frontiers in Accessibility Modelling: An Introduction. Netw. Spat. Econ. 2011, 11, 577–580. [Google Scholar] [CrossRef]
- Pajares, E.; Büttner, B.; Jehle, U.; Nichols, A.; Wulfhorst, G. Accessibility by Proximity: Addressing the Lack of Interactive Accessibility Instruments for Active Mobility. J. Transp. Geogr. 2021, 93, 103080. [Google Scholar] [CrossRef]
- Higgins, C.; Palm, M.; DeJohn, A.; Xi, L.; Vaughan, J.; Farber, S.; Widener, M.; Miller, E. Calculating Place-Based Transit Accessibility: Methods, Tools and Algorithmic Dependence. J. Transp. Land Use 2022, 15, 95–116. [Google Scholar] [CrossRef]
- Weiss, L.; Schwillinsky, S.; Castellazzi, B.; Prinz, T. Erreichbarkeitsmodell Österreich- Ein Werkzeug Zur Österreichweiten Analyse Der Versorgung Mit MIV Und ÖV. J. Angew. Geoinformatik 2018, 235–240. [Google Scholar]
- Stein, N. Accessibility as a Precondition for Sustainable Development. In Industry, Innovation and Infrastructure; Leal Filho, W., Azul, A.M., Brandli, L., Özuyar, P.G., Wall, T., Eds.; Encyclopedia of the UN Sustainable Development Goals; Springer International Publishing: Cham, Switzerland, 2019; pp. 1–10. ISBN 978-3-319-71059-4. [Google Scholar]
- Young, M. OpenTripPlanner-Creating and Querying Your Own Multi-Modal Route Planner. 2019. Available online: https://www.researchgate.net/profile/Marcus-Young-7/publication/321110774_OpenTripPlanner_-_creating_and_querying_your_own_multi-modal_route_planner/links/5c9bc34a299bf111694bbfdf/OpenTripPlanner-creating-and-querying-your-own-multi-modal-route-planner.pdf (accessed on 8 June 2022).
- Conveyal R5 Routing Engine 2022. Available online: https://github.com/conveyal/r5 (accessed on 8 June 2022).
- Conway, M.W.; Byrd, A.; van der Linden, M. Evidence-Based Transit and Land Use Sketch Planning Using Interactive Accessibility Methods on Combined Schedule and Headway-Based Networks. Transp. Res. Rec. 2017, 2653, 45–53. [Google Scholar] [CrossRef]
- Conway, M.W.; Byrd, A.; Eggermond, M. van Accounting for Uncertainty and Variation in Accessibility Metrics for Public Transport Sketch Planning. J. Transp. Land Use 2018, 11, 541–558. [Google Scholar] [CrossRef]
- Conway, M.W.; Stewart, A.F. Getting Charlie off the MTA: A Multiobjective Optimization Method to Account for Cost Constraints in Public Transit Accessibility Metrics. Int. J. Geogr. Inf. Sci. 2019, 33, 1759–1787. [Google Scholar] [CrossRef]
- Morgan, M.; Young, M.; Lovelace, R.; Hama, L. OpenTripPlanner for R. J. Open Source Softw. 2019, 4, 1926. [Google Scholar] [CrossRef]
- Pereira, R.H.; Saraiva, M.; Herszenhut, D.; Braga, C.K.V.; Conway, M.W. R5r: Rapid Realistic Routing on Multimodal Transport Networks with r 5 in r. Findings 2021, 21262. [Google Scholar] [CrossRef]
- Nobis, C.; Kuhnimhof, T. Mobilität in Deutschland-MiD: Ergebnisbericht. 2018. Available online: https://elib.dlr.de/125879/ (accessed on 8 June 2022).
- Drees & Sommer. Bericht zur Vernetzungsstudie Mobilität in der Metropolregion München; Drees & Sommer: Stuttgart, Germany, 2018. [Google Scholar]
- Chan, K.; Farber, S. Factors Underlying the Connections between Active Transportation and Public Transit at Commuter Rail in the Greater Toronto and Hamilton Area. Transportation 2020, 47, 2157–2178. [Google Scholar] [CrossRef]
- Silva, C. Structural Accessibility for Mobility Management. Prog. Plan. 2013, 81, 1–49. [Google Scholar] [CrossRef]
- ZENSUS 2011. Available online: https://www.zensus2011.de/DE/Home/home_node.html (accessed on 8 June 2022).
- Datensätze-OpenData ÖPNV. Available online: https://www.opendata-oepnv.de/ht/de/datensaetze?tx_vrrkit_dataset[action]=dataset&tx_vrrkit_dataset[controller]=View&tx_vrrkit_dataset[filter]=soll-fahrplandaten&tx_vrrkit_dataset[key]=group&cHash=af1647ddeaf44d25698589621b1f59f6 (accessed on 8 June 2022).
- ADAC Pendeln mit dem Auto ist oft Noch Alternativlos. Available online: https://www.adac.de/verkehr/verkehrssicherheit/unterwegs/pendler/ (accessed on 8 June 2022).
- Statista Pendeldauer in Deutschland 2022. Available online: https://de-statista-com/prognosen/999778/deutschland-dauer-des-taeglichen-pendelns (accessed on 8 June 2022).
- Statistisches Bundesamt Berufspendler. Available online: https://www.destatis.de/DE/Themen/Arbeit/Arbeitsmarkt/Erwerbstaetigkeit/Tabellen/pendler1.html (accessed on 8 June 2022).
- Burdziej, J. Using hexagonal grids and network analysis for spatial accessibility assessment in urban environments—A case study of public amenities in Toruń. Misc. Geogr. 2019, 23, 99–110. [Google Scholar] [CrossRef]
- Shoman, W.; Demirel, H. A Comparative Spatial Analysis on Land-Use Clusters for Accessibility; AGILE: Wageningen, The Netherlands, 2017. [Google Scholar]
- Pritchard, J.P.; Tomasiello, D.; Giannotti, M.; Geurs, K. An International Comparison of Equity in Accessibility to Jobs: London, São Paulo, and the Randstad. Transp. Find. 2019, 7942. [Google Scholar] [CrossRef] [PubMed]
- Grisé, E.; Boisjoly, G.; Maguire, M.; El-Geneidy, A. Elevating Access: Comparing Accessibility to Jobs by Public Transport for Individuals with and without a Physical Disability. Transp. Res. Part A Policy Pract. 2019, 125, 280–293. [Google Scholar] [CrossRef]
- Hu, Y.; Downs, J. Measuring and Visualizing Place-Based Space-Time Job Accessibility. J. Transp. Geogr. 2019, 74, 278–288. [Google Scholar] [CrossRef]
- Deboosere, R.; El-Geneidy, A.M.; Levinson, D. Accessibility-Oriented Development. J. Transp. Geogr. 2018, 70, 11–20. [Google Scholar] [CrossRef]
- Levinson, D.; Marion, B.; Owen, A.; Cui, M. The City Is Flatter: Changing Patterns of Job and Labor Access. Cities 2017, 60, 124–138. [Google Scholar] [CrossRef]
- OpenTripPlanner. Available online: https://www.opentripplanner.org/ (accessed on 7 January 2023).
- Forschungsgesellschaft für Straßen-und Verkehrswesen. Richtlinien für Integrierte Netzgestaltung RIN; Ausgabe 2008; FGSV-Verl.: Köln, Germany, 2009; ISBN 3-939715-79-4. [Google Scholar]
- McVey, E.; Noriega-Goodwin, D. Gtfsr: Working with GTFS (General Transit Feed Specification) Feeds in R; 2021. [Google Scholar]
- Geofabrik Geofabrik Download Server. Available online: https://download.geofabrik.de/ (accessed on 4 February 2022).
- Weber, M. Osmconvert. Available online: https://wiki.openstreetmap.org/wiki/Osmconvert (accessed on 8 June 2022).


Disclaimer/Publisher’s Note: The statements, opinions and data contained in all publications are solely those of the individual author(s) and contributor(s) and not of MDPI and/or the editor(s). MDPI and/or the editor(s) disclaim responsibility for any injury to people or property resulting from any ideas, methods, instructions or products referred to in the content. |
© 2023 by the authors. Licensee MDPI, Basel, Switzerland. This article is an open access article distributed under the terms and conditions of the Creative Commons Attribution (CC BY) license (https://creativecommons.org/licenses/by/4.0/).
Share and Cite
Pfertner, M.; Büttner, B.; Wulfhorst, G. An Open-Source Modelling Methodology for Multimodal and Intermodal Accessibility Analysis of Workplace Locations. Sustainability 2023, 15, 1947. https://doi.org/10.3390/su15031947
Pfertner M, Büttner B, Wulfhorst G. An Open-Source Modelling Methodology for Multimodal and Intermodal Accessibility Analysis of Workplace Locations. Sustainability. 2023; 15(3):1947. https://doi.org/10.3390/su15031947
Chicago/Turabian StylePfertner, Maximilian, Benjamin Büttner, and Gebhard Wulfhorst. 2023. "An Open-Source Modelling Methodology for Multimodal and Intermodal Accessibility Analysis of Workplace Locations" Sustainability 15, no. 3: 1947. https://doi.org/10.3390/su15031947
APA StylePfertner, M., Büttner, B., & Wulfhorst, G. (2023). An Open-Source Modelling Methodology for Multimodal and Intermodal Accessibility Analysis of Workplace Locations. Sustainability, 15(3), 1947. https://doi.org/10.3390/su15031947