Article

Assessment of Genetic Diversity of Local Coffee Populations in Southwestern Saudi Arabia Using SRAP Markers

1
Department of Botany and Microbiology, College of Science, King Saud University, Riyadh 11451, Saudi Arabia
2
Department of Plant Production, College of Food and Agricultural Sciences, King Saud University, Riyadh 11451, Saudi Arabia
3
Centre for Environmental Research and Studies, Jazan University, P.O. Box 114, Jazan 45142, Saudi Arabia
4
Laboratory of Biodiversity and Valorization of Bioresources in Arid Zones (LR18ES36), Faculty of Sciences of Gabes, University of Gabes, Gabes 6029, Tunisia
5
Department of Chemistry, College of Science, Jazan University, P.O. Box 114, Jazan 45142, Saudi Arabia
*
Author to whom correspondence should be addressed.
Agronomy 2023, 13(2), 302; https://doi.org/10.3390/agronomy13020302
Submission received: 13 December 2022 / Revised: 16 January 2023 / Accepted: 17 January 2023 / Published: 19 January 2023
(This article belongs to the Special Issue Coffee—from Plant to Cup)

Abstract

:
Coffea arabica, a member of the Rubiaceae family, is the most commercially important species of the genus Coffea. It has been grown on the mountain terraces of southwestern Saudi Arabia for centuries. At present, the species is subject to increased genetic erosion due to the abandonment of many gardens by their owners and the increasingly dry climate. The current study was carried out to determine the genetic diversity of 56 local coffee accessions collected from the southern regions of Saudi Arabia using 30 sequence-related amplified polymorphism (SRAP) markers. Six SRAP markers showed polymorphism among the 56 accessions. A total of 1125 bands, with an average of 187.5, was produced from all six SRAP primers. The polymorphic information content (PIC) ranged from 74.8 to 97.7, with an average of 91.4 for all studied SRAP markers. The high polymorphism percentage seen in this study, along with the high number of alleles produced and the high PIC values of the primers used, demonstrate that the SRAP approach was an effective molecular technique for assessing genetic diversity in the studied populations. The structural analysis showed a sharp peak, with no ambiguity, demonstrating the highest delta K value at K = 3 and K = 6, and the coffee accessions could be grouped into three and six main populations, respectively. The PCoA, cluster analysis, and structural population analysis results suggest considerable genetic diversity among coffee populations growing on the southwestern mountain terraces of Saudi Arabia. The 56 accessions were segregated into five groups, mostly according to geographic distribution. The accessions from the southern districts of Jazan region mostly clustered in groups 2 and 4, while the accessions from the northern districts of Al-Baha and Assir regions formed separate groups. Based on these analyses, accessions KSA1R, KSA6R, KSA21, KSA25, KSA37, KSA38, KSA42, KSA59, KSA60, KSA62, and KSA63 were the most divergent. The genotypes should be conserved for use in coffee-breeding programs to improve the agronomic value of the crop, broaden the genetic base of C. arabica in Saudi Arabia and increase environmental resilience. Additional molecular and functional genomics studies are necessary to further elucidate how this germplasm has evolved and enhance the value of local Arabica coffee diversity in the Kingdom.

1. Introduction

The genus Coffea, a member of the Rubiaceae family, has more than 70 species, but only two species, arabica (C. arabica L.) and robusta (C. canephora Pierre ex A. Froehner), have commercial value [1,2]. C. arabica originated in Ethiopia and was propagated and dispersed all over the world from a limited number of plants, a fact that, in addition to the autogamous reproduction of the species, led to a narrow genetic base within Arabica coffee cultivars [3,4,5]. In the southwestern region of the Arabian Peninsula, which encompasses southwestern Saudi Arabia and Yemen, C. arabica has been cultivated for at least four centuries on the terraced slopes and narrow valleys of the mountains, at different altitudes that mostly ranged from 1200 to 2000 m above sea level [6,7]. Trees of more than 150 years of age can still be found in old gardens in traditional coffee-growing areas in the Saudi regions of Jazan, Assir, and Al-Baha [8]. It is known that commercial and cultural exchanges between this region and the Horn of Africa across the narrow strait of Bab El-Mandeb have occurred since ancient times. Therefore, one would expect the transfer of coffee genetic material across the Red Sea to occur uninterruptedly over the centuries, from the moment that coffee attracted the attention of Yemeni traders and growers, possibly as early as the 5th century A.D [9]. Thus, one can assume that Yemen and southwestern Saudi Arabia contain the most genetic diversity of C. arabica outside the species’ center of origin in the Ethiopian highlands [10]. Therefore, studying the diversity of this germplasm could reveal agronomically interesting genotypes. In addition, this part of the world, on the border of the Sahara Desert, is particularly exposed to a myriad of environmental stresses, such as drought, high temperature, excessive irradiance, and dry winds [11]. Coffee growers may increasingly encounter these challenges in more favorable growing regions as the climate shifts [12]. This germplasm may contain interesting genes that confer resistance to abiotic stresses, which could be used by breeders to render the crop more resilient to climate change [13].
To establish much-needed breeding programs for the country, genetic diversity must first be assessed [14], as the characterization of genotypes can enhance the breeding efficiency in response to direct selection based on characteristics and genes of interest. By utilizing molecular markers, crop improvement breeding efforts can be far more effective. Due to the molecular markers’ direct correlation with the genotype qualities, a new set of genotypes can emerge more quickly than when using conventional methods of crop selection, especially when it is difficult to evaluate traits. Due to their genome-wide coverage, high repeatability, and multi-allelic nature, sequence-related amplified polymorphism (SRAP) markers are valuable molecular tools [15]. SRAP markers do not require nucleotide information for primer construction [16], which makes them practical. Several previous reports dealt with the extent of the genetic diversity of Arabica coffee germplasm in Ethiopia [17], Yemen [18], Brazil [19], and Nicaragua [20]. However, no such systematic diversity analysis has been carried out in Saudi Arabia, except for one study on a limited number of genotypes using morphological attributes [8]. A good understanding of genetic variability is needed for the genetic improvement of the crop. The present study aimed to assess the magnitude and structure of the genetic diversity of local coffee populations in Saudi Arabia using SRAP markers.

2. Materials and Methods
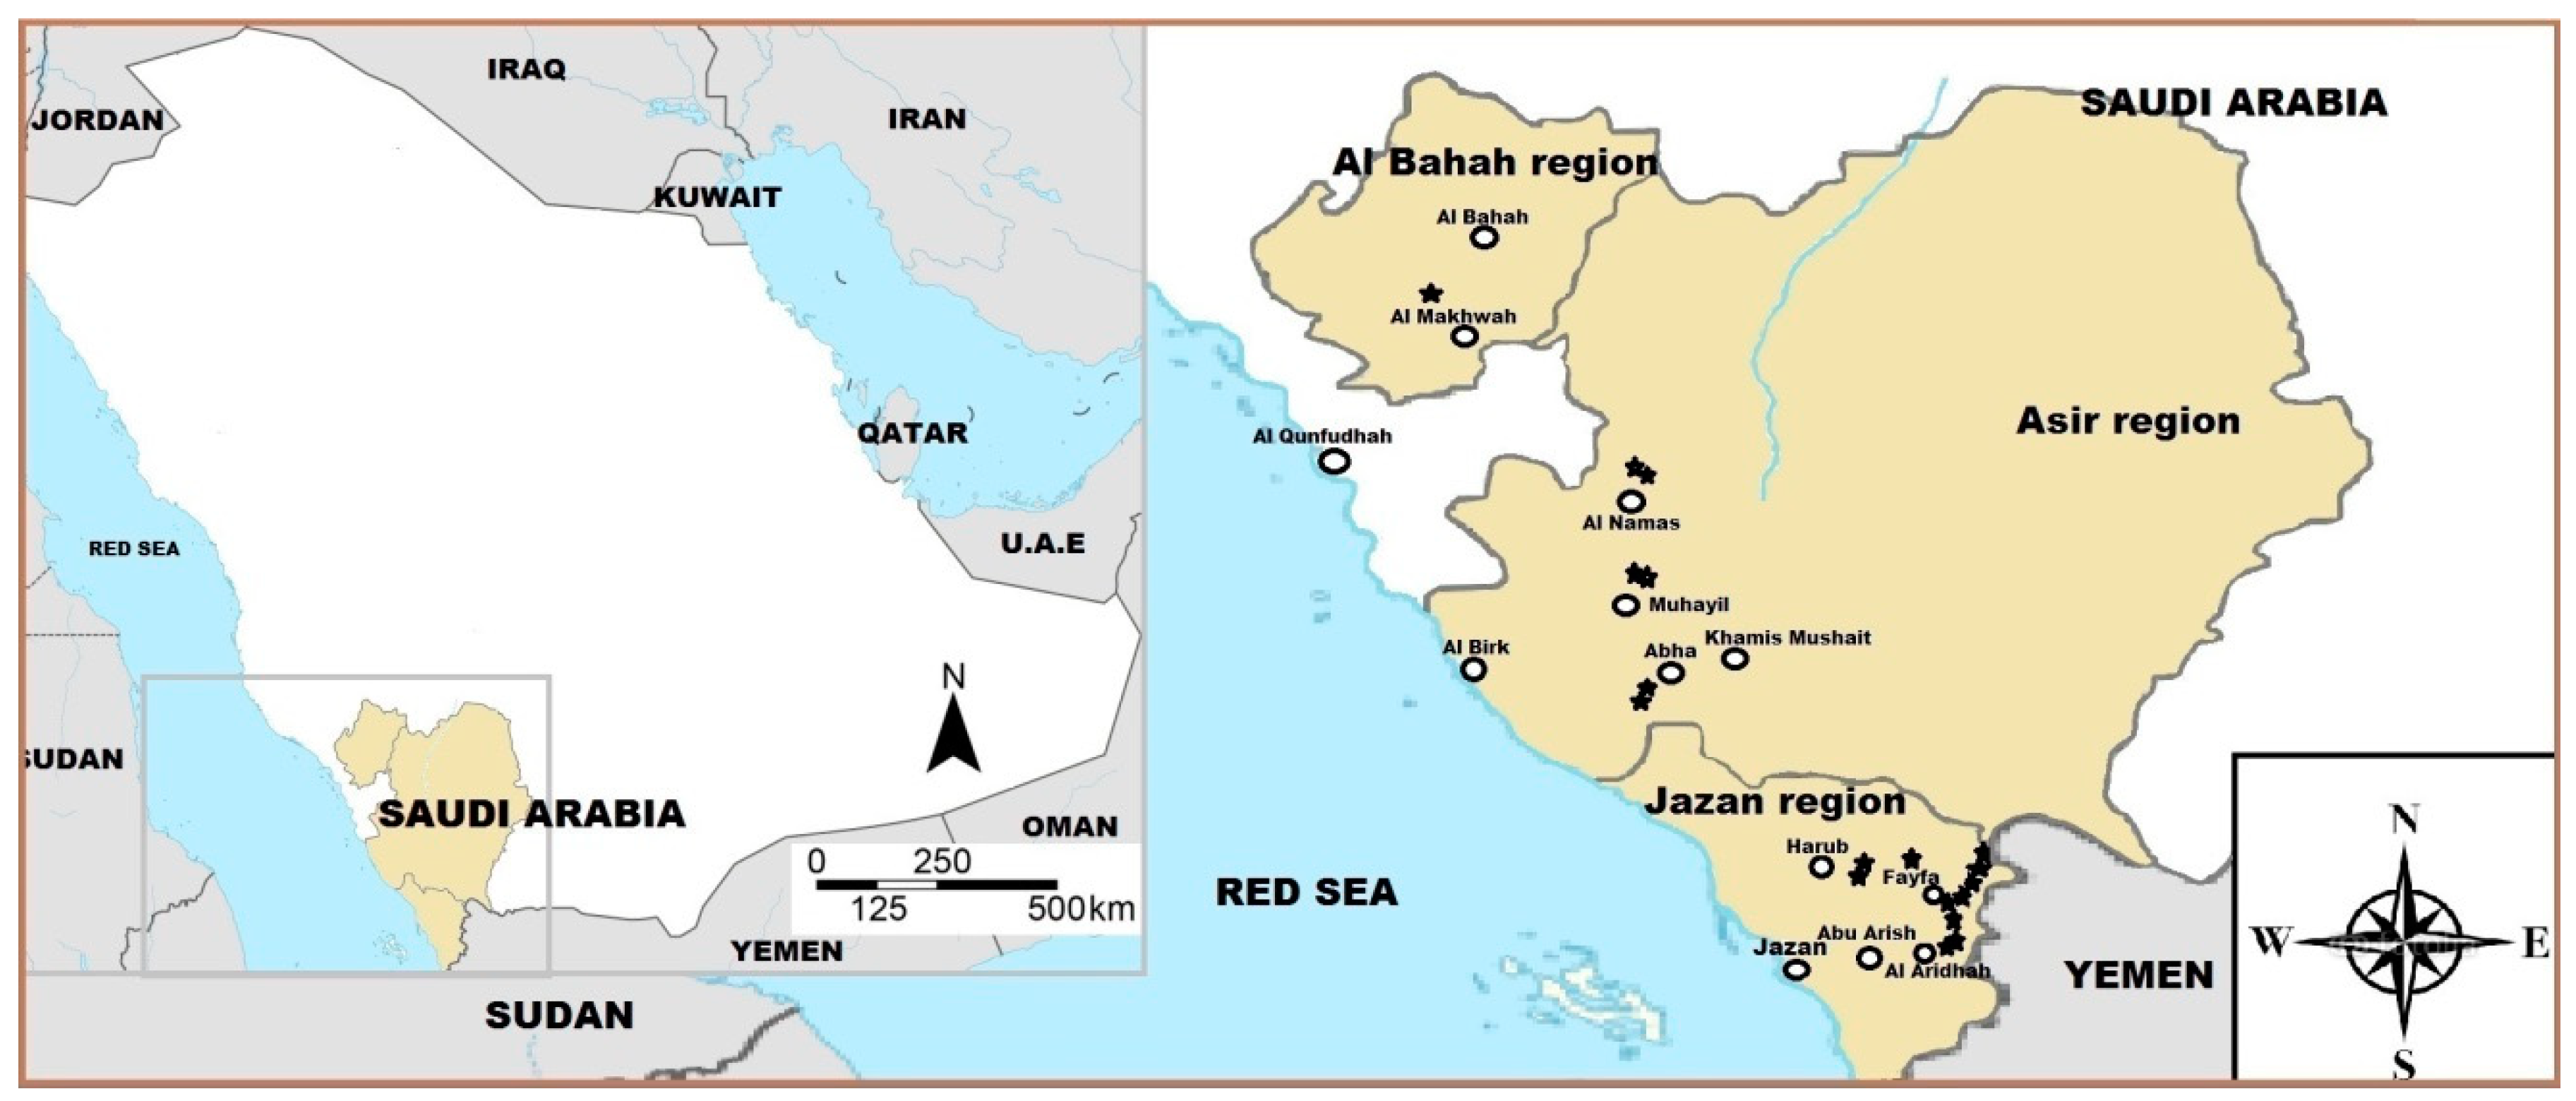
2.1. Plant Material

A survey was carried out at several sites in the Sarawat mountain range, running parallel to the Red Sea from the southeast to the northwest through the three administrative regions of Jazan, Assir, and Al-Baha (Figure 1). The survey covered a strip of terraced mountains located between latitudes 17° N and 20° N, the most northern location where coffee is commercially grown in the world. The coffee gardens included in the survey were found at altitudes ranging from 1100 to 1850 m a.s.l. In total, we collected young leaves from 56 accessions, from Jebel Fayfa (Fayfa district), Eddayer, Maadi (Haroub district), Jebel Al-Gahr (Al-Rayth district), Rayda valley (Assouda district in Assir region), Mahayel Assir district, Al-Majarda district and Jebel Shada (Al-Mekhwah district of Al-Baha region) (Table 1). We tagged and sampled 1–3 trees representing each tree population. Each accession was given a code starting with the acronym “KSA” (e.g., KSA-1), but, for the sake of simplicity, we dropped the acronym in the figures. The letter “R” was added to the code of accessions 1–19, 45, and 51 to indicate that they were sourced from a small, local coffee germplasm collection established in the Fayfa district.

2.2. DNA Extraction

Plant material, composed of young leaves of the different C. arabica accessions, was collected from representative trees of each population and transported to the lab in a cooler. The leaves were surface sanitized by immersion in 5% sodium hypochlorite solution for 1–2 min and then rinsing with sterile distilled water. The material was ground in liquid nitrogen and then stored in a −80 °C freezer. DNA was extracted from 100 mg of mixed powder using an innuPREP Plant DNA Kit (Analytik Jena GmbH, Jena, Germany) according to the manufacturer’s protocol. DNA quality and concentration were measured with a Nanodrop ND-1000 spectrophotometer (Saveen o Werner, Limhamn, Sweden).

2.3. Primer Selection and SRAP-PCR Amplification

The SRAP analysis was carried out according to Li and Qurios [21], with some modifications. Each Polymerase Chain Reaction (PCR) of SRAP markers (Table 2) employed a 20 μL reaction volume with one GoTaq Green Master mix (Promega; Madison, WI, USA), 0.1 μM for each reverse and forward primer, DNA template (50 ng) and 7 μL nuclease-free water, to make 20 μL reaction. The PCR amplification protocol included the following steps: initial denaturation for 5 min at 94 °C followed by denaturation for 1 min at 94 °C for 5 cycles; then, the temperature was reduced to 35 °C for 1 min and elongation was carried out at 72 °C for 1 min. After that, the temperature was increased to 50 °C for 1 min for annealing and elongation occurred at 72 °C to complete the final step for 30 cycles. PCR products were checked by electrophoresis on 1.5% agarose gel in TBE buffer. The bands were visualized under UV light after staining with ethidium bromide.

2.4. Data Collection

The SRAP data were collected in binary format (fragment absent = 0, fragment present = 1). For subsequent analysis, we concatenated all matrices to create a single binary matrix for further analysis. The principal coordinate analysis (PCoA) was used to construct the biplot using PAST 3.11 software. Jaccard similarity coefficients were used to examine data from SRAP markers [22]. The Unweighted Pair-Group Method with Arithmetic Mean Algorithm (UPGMA) in PAST 3.11 software was used to create the phylogenetic trees [23]. The markers’ potential to estimate genetic variability was assessed by computing the polymorphic information content (PIC), multiplex ratio (EMR), marker index (MI) and resolving power (RP). The PIC was calculated using the formula, PIC = 1 j = 1 n Pij 2 , where Pij is the frequency of the ith allele of each marker j and the summation extends towards n alleles for each marker [24]. The EMR is the number of polymorphic fragments per assay. The average number of DNA fragments amplified per genotype using a marker is called the multiplex ratio (MR). The MI was calculated as the product of EMR by PIC; it measures the primer’s capacity to detect polymorphic loci among different genotypes. Resolving power measures the primer’s capacity to differentiate among different genotypes; this was computed as RP = ΣIb, where Ib is the informative fragments.
Additionally, genetic diversity was assessed with different parameters, such as the effective number of alleles (Ne), genetic diversity within population (Hs), Shannon’s information index (I), total genetic diversity (Ht), genetic differentiation (Gst), gene flow (Nm) and Nei’s gene diversity (H) using POPGENE (v1.32) program [25]. Furthermore, the clusters of genetically similar accessions were identified using the model-based Bayesian technique, using the STRUCTURE program (v2.4), which was utilized to create the Bayesian bar graphs [26]. After 10 independent runs, with each K cluster ranging from 1 to 10, the number of clusters (K) was estimated. A total of 105 burn-in periods and 104 Markov Chain Monte Carlo (MCMC) repetitions were used for the admixture model. After that, the STRUCTURE HARVESTER web server (v0.6.94) [26] was used to calculate the ad hoc parameters for convenient (ΔK) determination [27].

3. Results

3.1. SRAP Analysis

Primers that produced a distinct, polymorphic, and consistent amplification were chosen for amplification in all accessions. Thirty different combinations were used to determine the genetic diversity among the 56 coffee accessions; only six SRAP primers showed polymorphism and reproducibility. The total number of bands, polymorphic loci, and polymorphic information content (PIC) are described in Table 3. A total of 1125 fragment were produced from all six SRAP primers, with an average of 187.5 per marker. The (F4 x R11) combination produced a maximum of 293 fragment, followed by F1 × R11, which produced 240 fragment. The minimum was 103 fragment, which were produced from the F04 x R10 primer. The polymorphic information content of each primer was also calculated. The fraction polymorphism (FP) recorded for all SRAP primers was 1; however, the average % polymorphism of 91.66 was recorded. The minimum % polymorphism was recorded for the F04 x R10 combination. The maximum PIC 0.49 was recorded for F03 × R03, followed by 0.42 PIC for F09 × R10. The minimum PIC value was 0.13 PIC, recorded for F04 × R10. The maximum MI was 2.94 for the combination F09 × R10; this was followed by 2.22 for the F04 × R11 primer combination. The maximum resolving power (RP = 7.95) was recorded for primer combination F09 × R10, the minimum (RP = 3.75) was recorded for F04 × R10, and the average was 6.06. The MR was 4.88 bands per primer (Table 3).

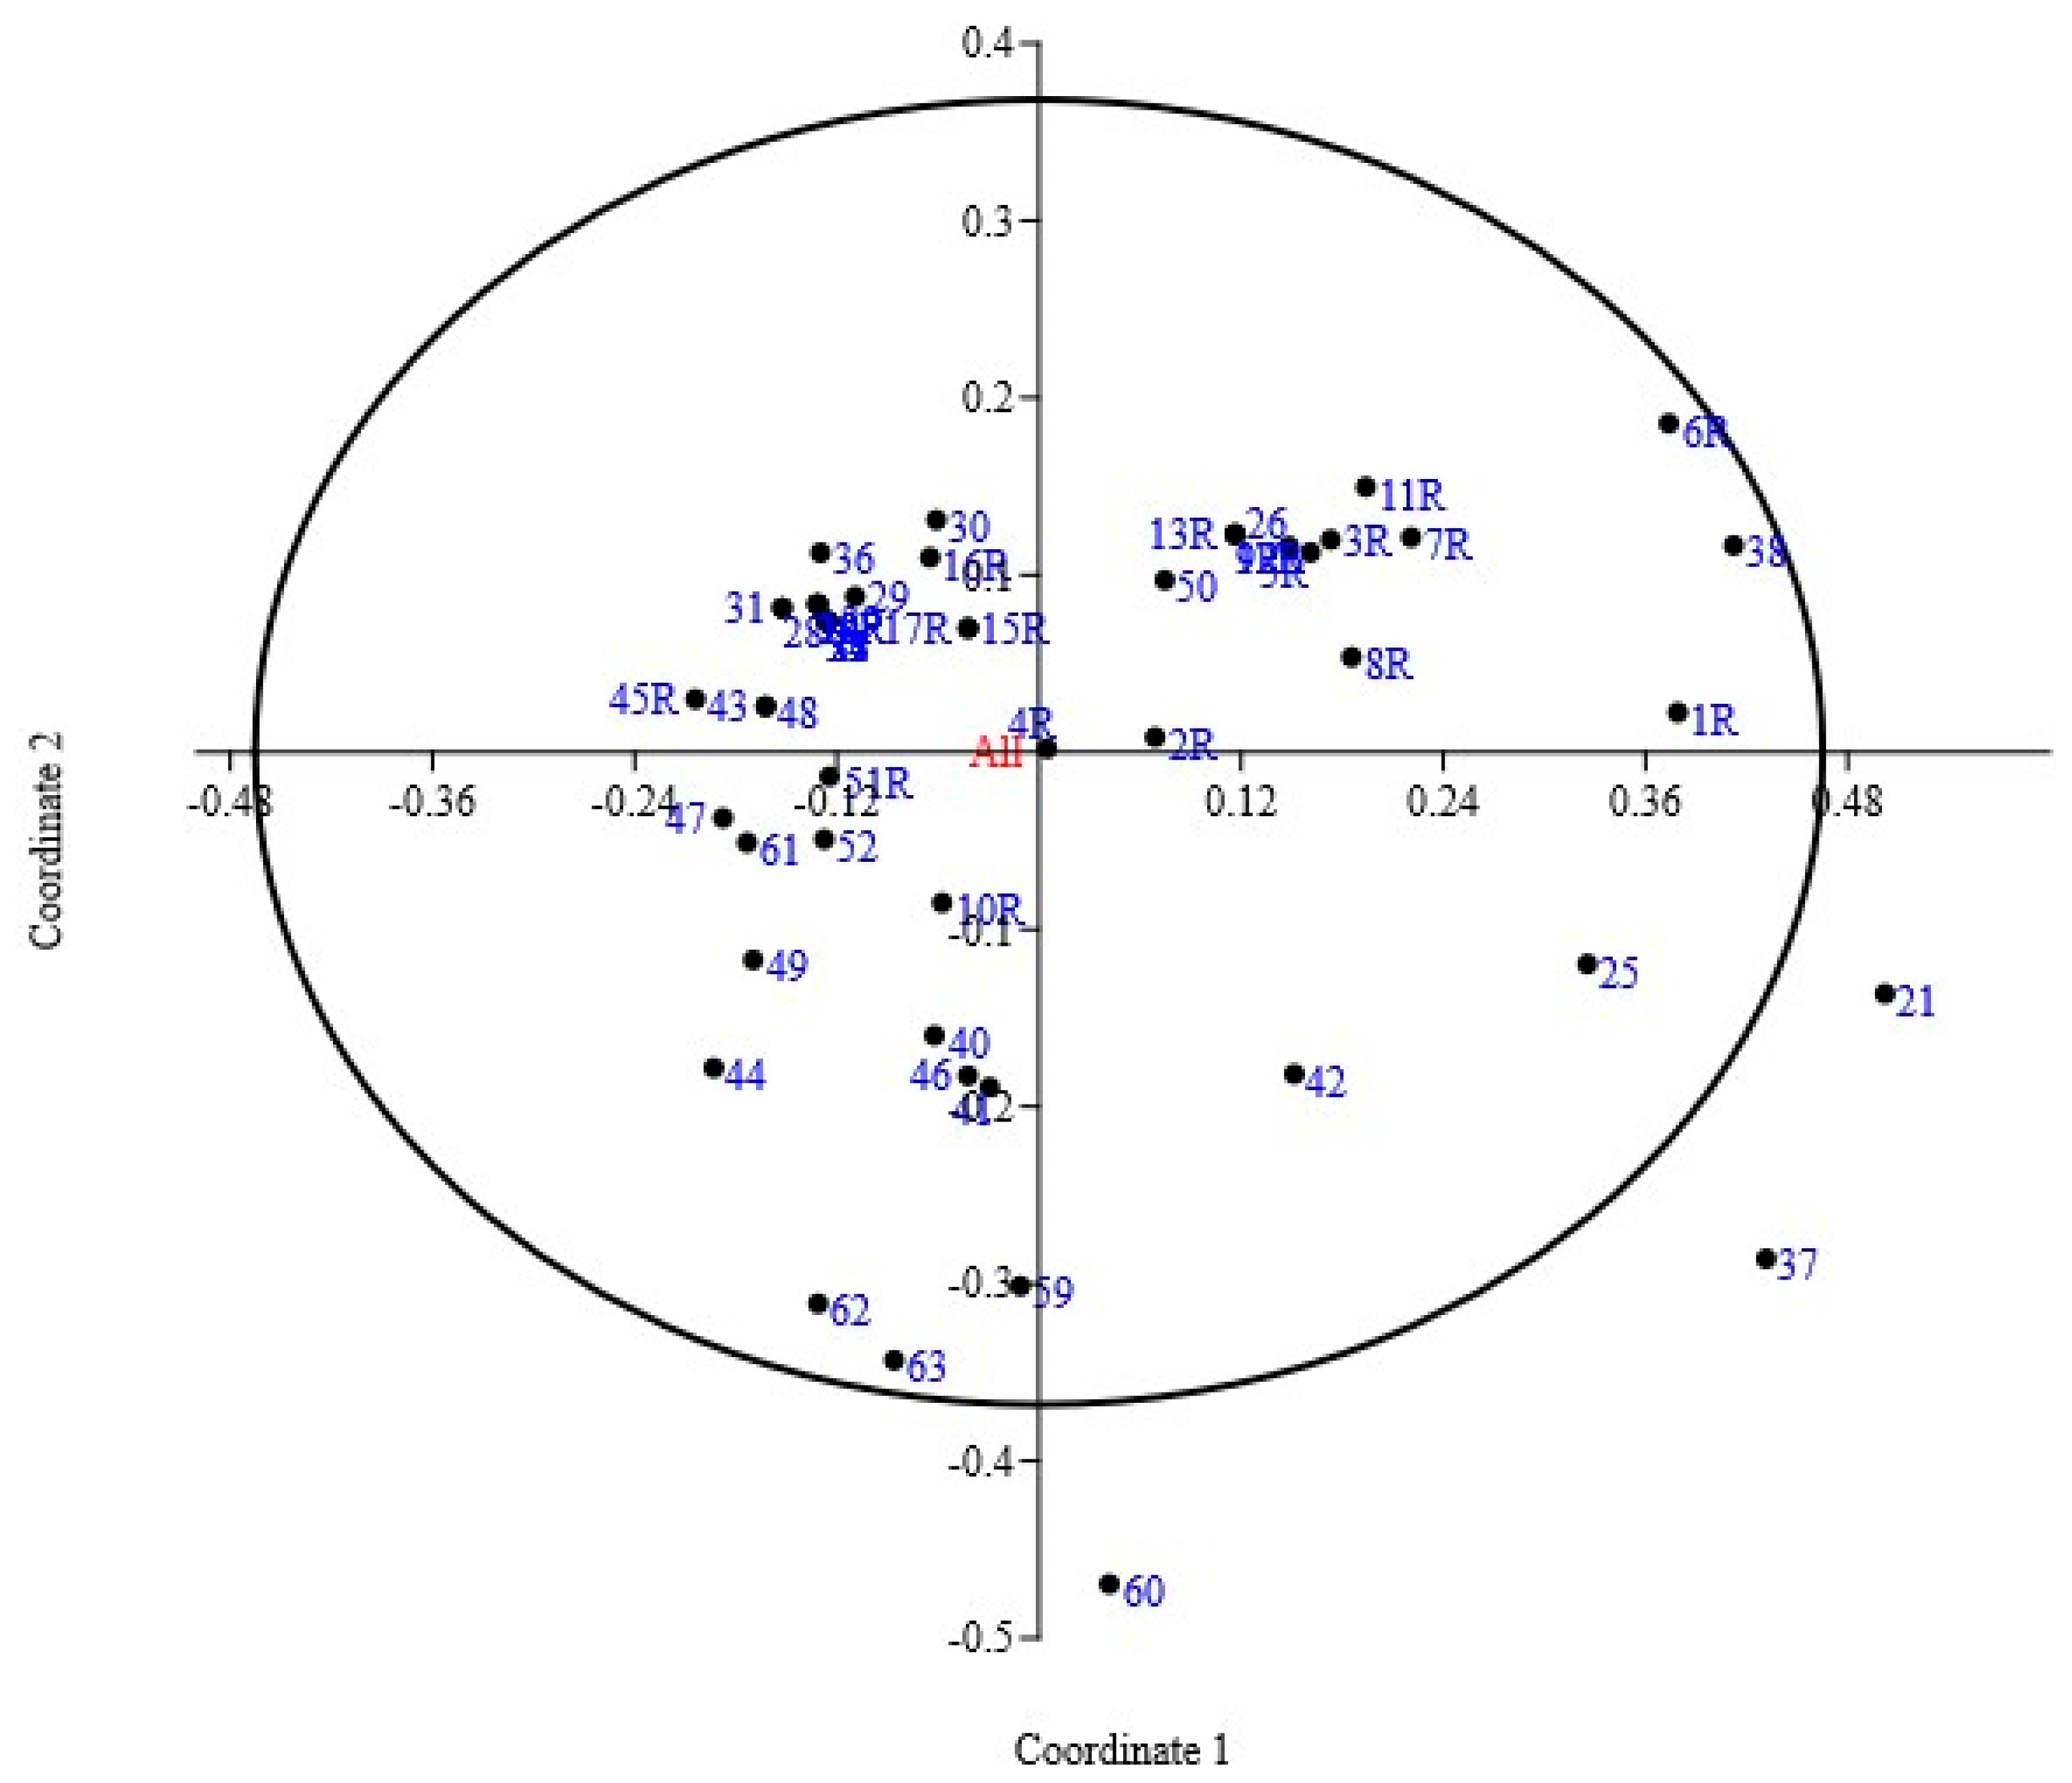
3.2. Principal Coordinate Analysis

Principal Coordinates Analysis (PCoA) was performed on the data generated by the amplification of coffee genomic DNA using the six SRAP primer combinations. The obtained eigenvalues indicate that the first four coordinates provide a good summary of the data, as they explained 62.3% of the total variability (Table 4).
The biplot of PC1 and PC2 shows the grouping of the 56 coffee landraces (Figure 2). PC1 separated accessions KSA1R, KSA6R, KSA38, KSA25, KSA21, KSA37, KSA3R, KSA42, KSA7R, KSA8R, KSA11R, KSA50, KSA5R, KSA26, KSA9R, KSA13R, KSA4 and KSA2R, which were collected from the central districts of the Jazan region (Jebel Fayfa and Eddayer), from the accessions collected from locations further to the north (Al-Gahr, Al-Mekhwah), indicating the genetic relatedness of the first group. In particular, accessions KSA1R, KSA6R, KSA21, KSA25, KSA37 and KSA38 were present away from the center of the plot along PC1, suggesting high genetic diversity among this subgroup. A second group, separated along PC1 but in the fourth quadrat, comprised accessions from the Rayda district in the Assir region and the Al-Gahr district in the Jazan region (north). PC2 separated accessions of the northern districts of Al-Mekhwah (Shada Al-ala) (KSA62 and KSA63) and Al-Majarda (KSA59 and KSA60) from the accessions of the Jazan region. Another group comprised accessions from Fayfa and one accession from Shada Al-Ala (KSA61), clustered in the third quadrat (Figure 2). The accessions of the northern districts mostly segregated together along coordinate 2, but coordinate 3 distinguished the two groups from one another.
Although they have morphologically similar berries and leaves [unpublished data], accessions KSA21 and KSA26 were separated along coordinate 3. In fact, the former was far from the center of the plot on coordinates 1 and 3 indicating its distinctiveness from the other accessions. Accessions KSA21, KSA37, and KSA60 were the most divergent in the collection, and they were also distinct from one another. These accessions had low correlations with the other accessions (Supplementary File S1). KSA37 was from Eddayer (central Jazan), KSA60 was collected from Al-Majarda (Assir region) and KSA21 was from Jebel Fayfa; these three locations are several hundred kilometers apart.

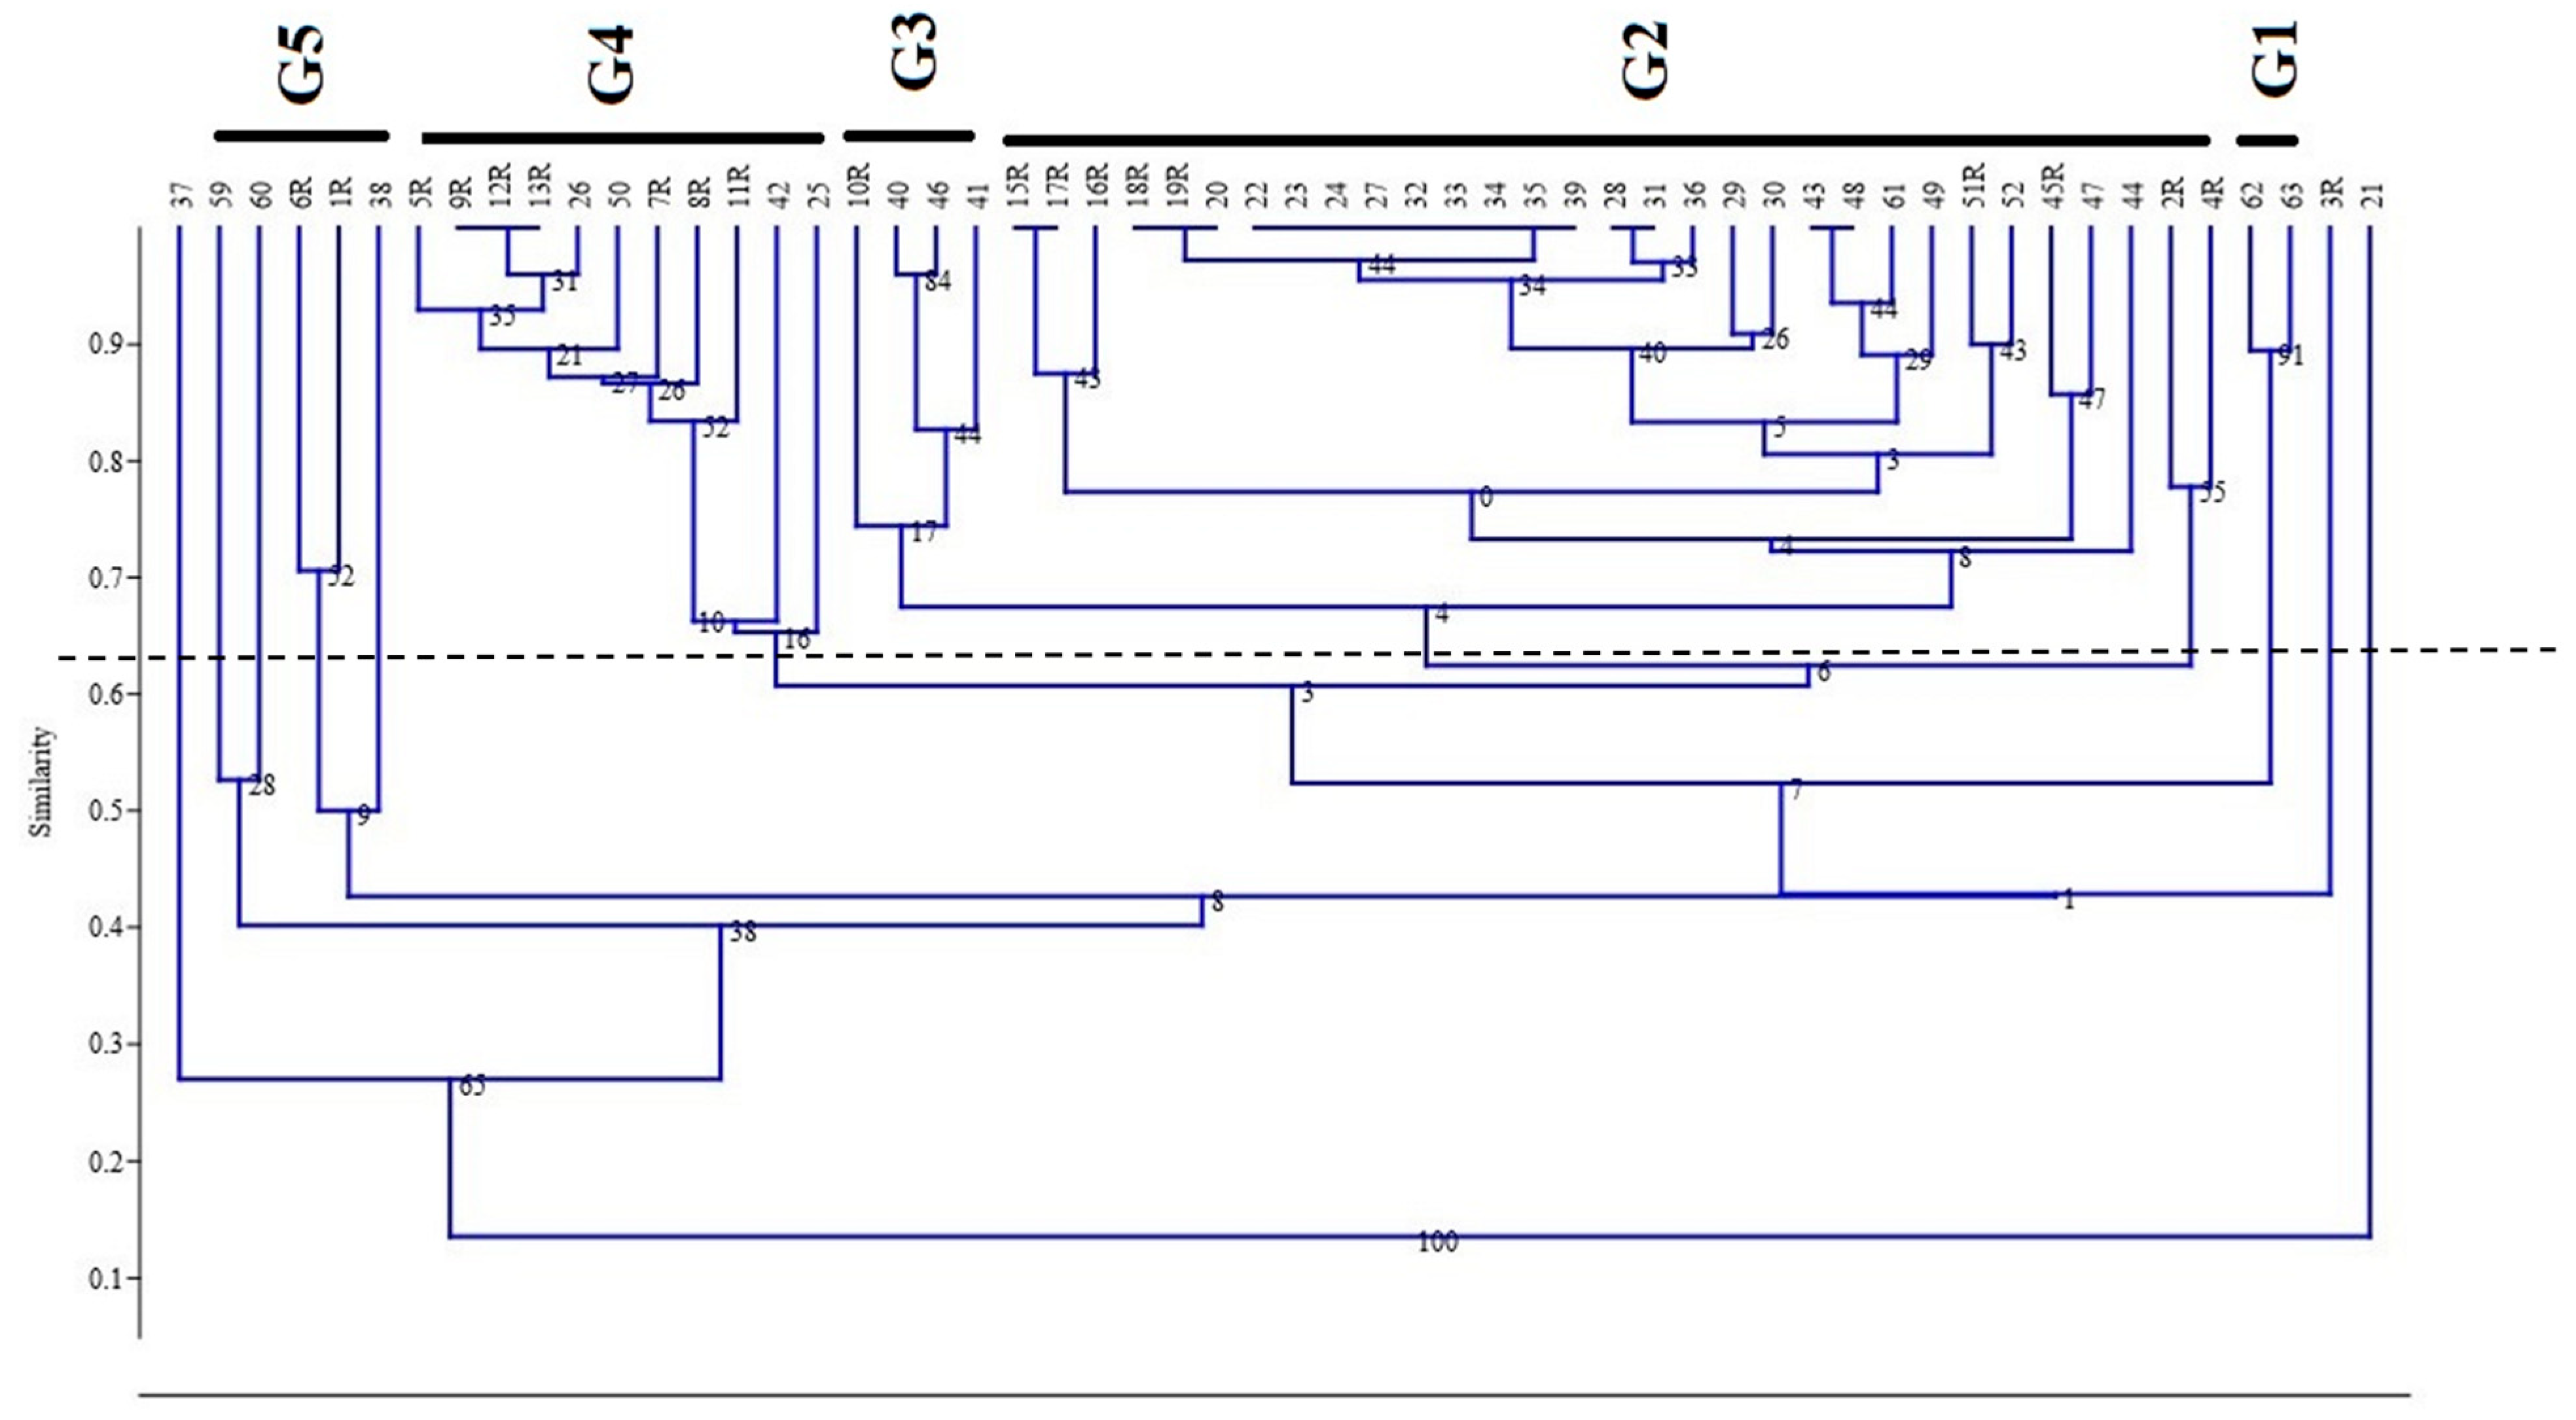
3.3. Hierarchical Cluster Analysis (HCA)

A cluster analysis was carried out using the Jaccard coefficient based on the UPGMA clustering method. The dendrogram grouped the coffee accessions into five groups and three single accessions (Figure 3). The first small group (G1) contained KSA62 and KSA663 from the district of Shada Al-ala in the Al-Baha region. Group 2 was the largest, with 29 coffee accessions collected from different locations. This group can be further subdivided into six subgroups. The first subgroup contains three accessions (KSA15R, KSA16R, and KSA17R), which came from the Rayda district in the Assir region (south). Accessions KSA18R, KSA19R, KSA20, KSA22, KSA23, KSA24, KSA27, KSA32, KSA33, KSA34, KSA35, KSA39, KSA28, KSA31, KSA36, KSA29, KSA30, KSA43, KSA48, KSA59, KSA61, KSA51R, KSA52, KSA45R, and KSA47 formed the largest subgroup. Members of this subgroup mainly originated from the Jazan region, except for KSA61, which was from the Al-Baha region. Members of this group were highly intercorrelated (Supplementary S1). Accession KSA44 is a 100-year-old tree from Jebel Fayfa; this formed a separate subgroup. The last small subgroup contained KSA2R and KSA4R, from the district of Eddayer in Jazan. Group 3 comprised accessions KSA10R, KSA46, KSA40 and KSA41; they are all from Jazan, except for the latter, which was from Rayda (Assir). The fourth group contained accessions KSA5R, KSA9R, KSA12R, KSA13R, KSA26, KSA50, KSA7R, KSA8R, KSA11R, KSA25 and KSA42, which are all from Jazan, except for the latter, which is from Rayda. Group 5 comprised accessions KSA6R, KSA1R, KSA38, KSA59 and KSA60. The first three were from the Jazan region, while the last two were from Al-Majarda (Assir). The latter formed a separate subgroup, despite having a low similarity coefficient of just 0.52. Accessions KSA37 and KSA3R, from the Eddayer district in Jazan, and KSA21, from Jebel Fayfa, were not in any of the groups; these accessions had very low correlations with the other accessions (Supplementary S1).

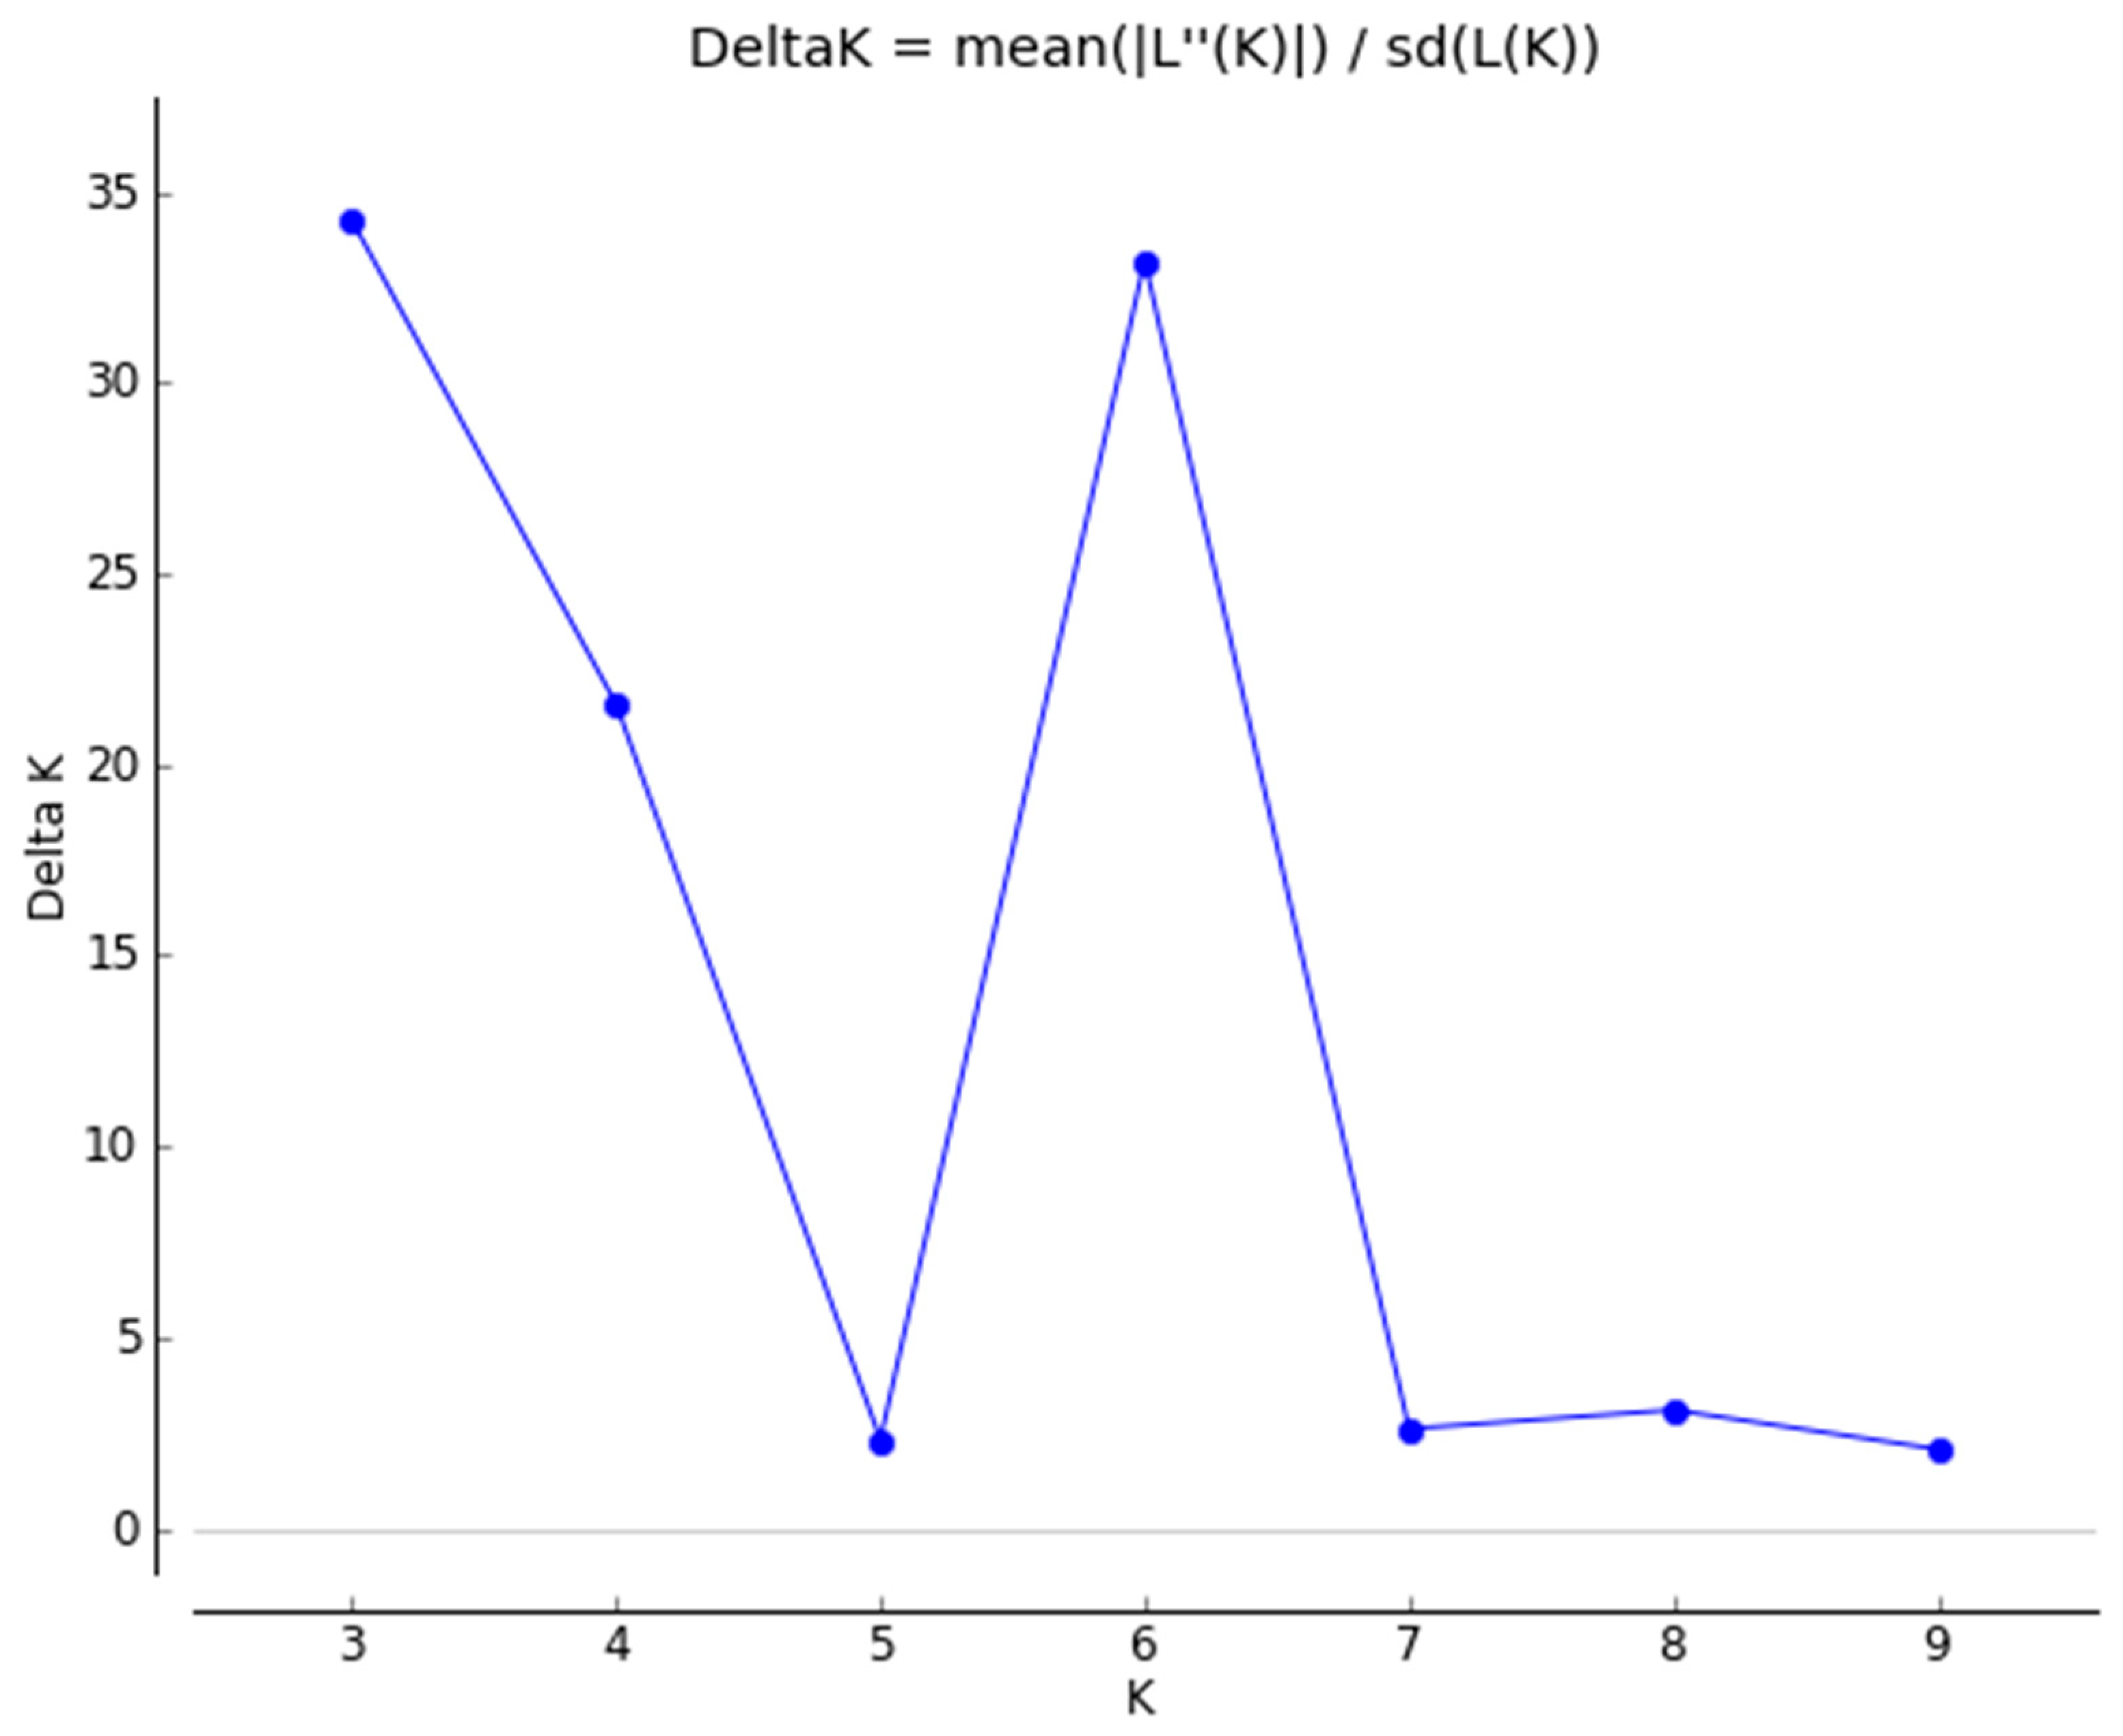
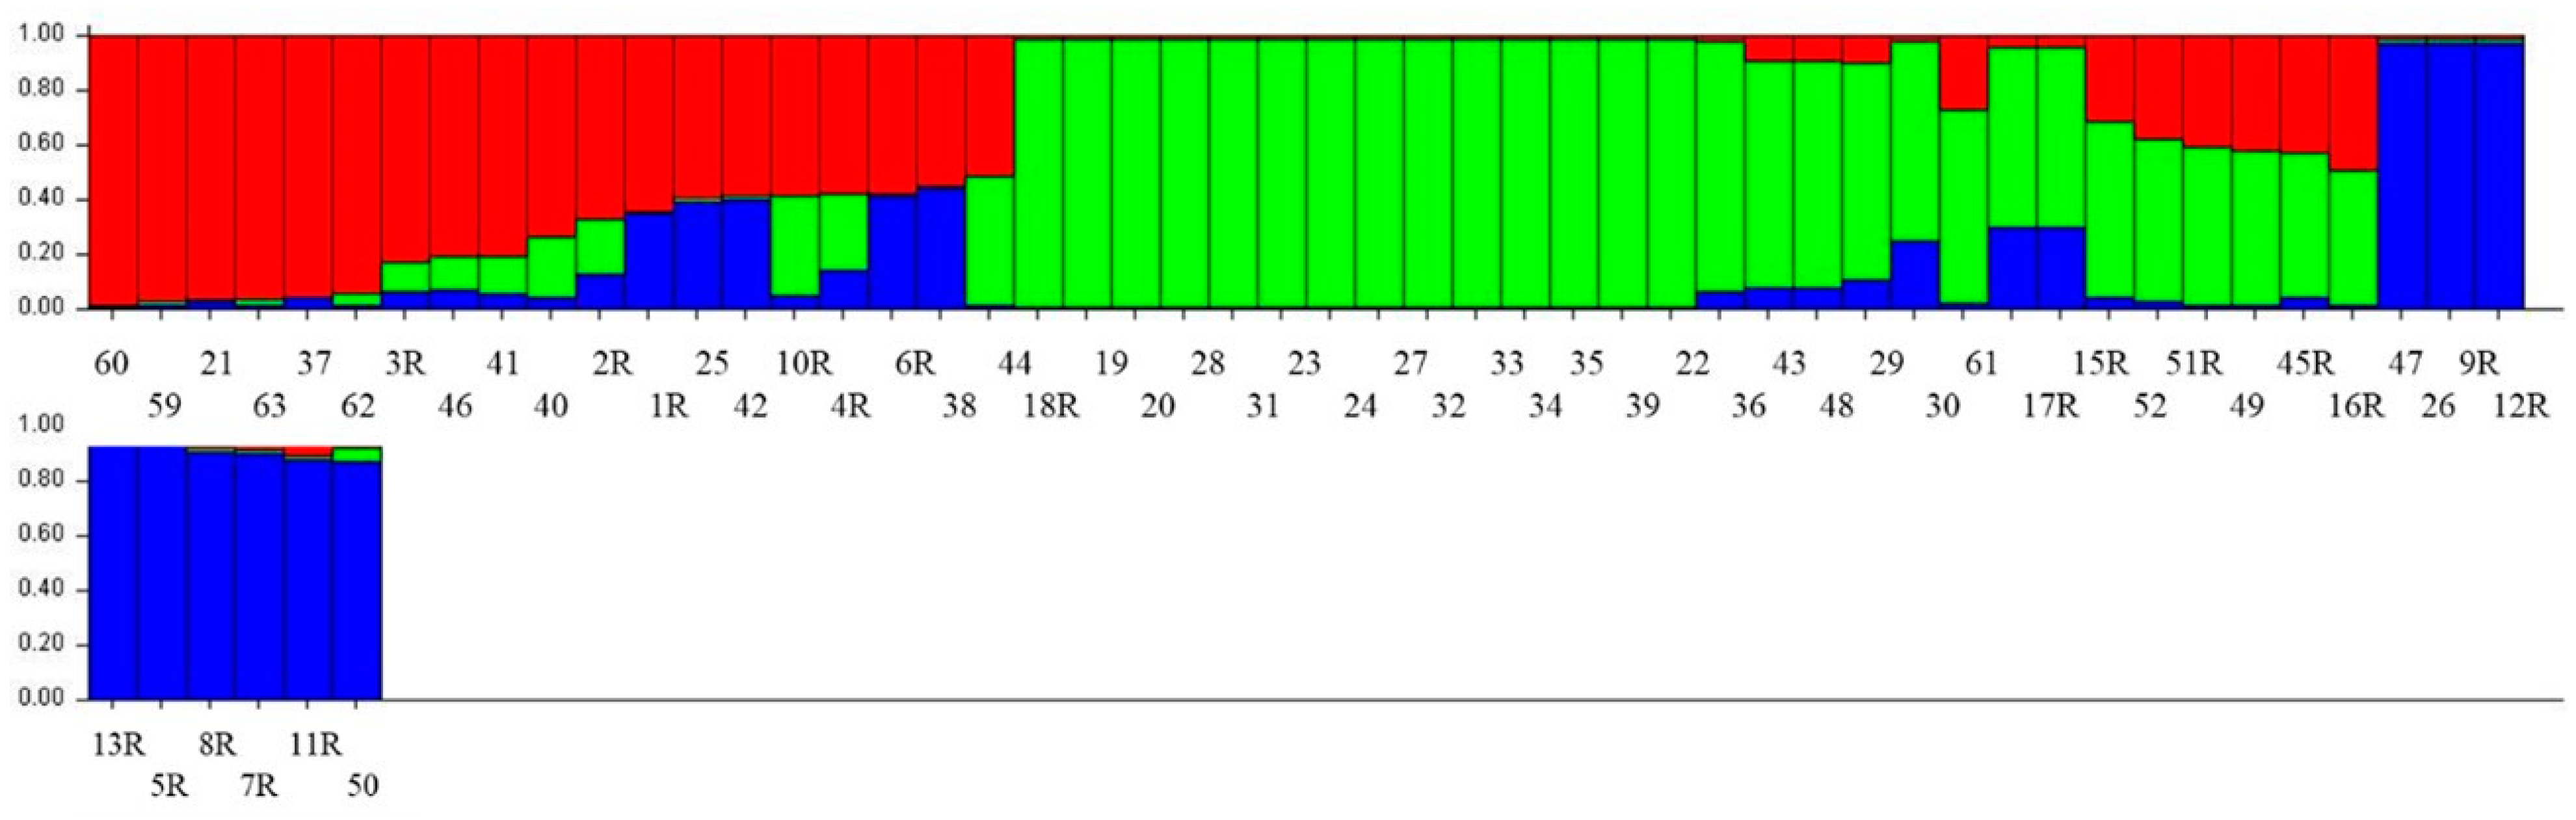
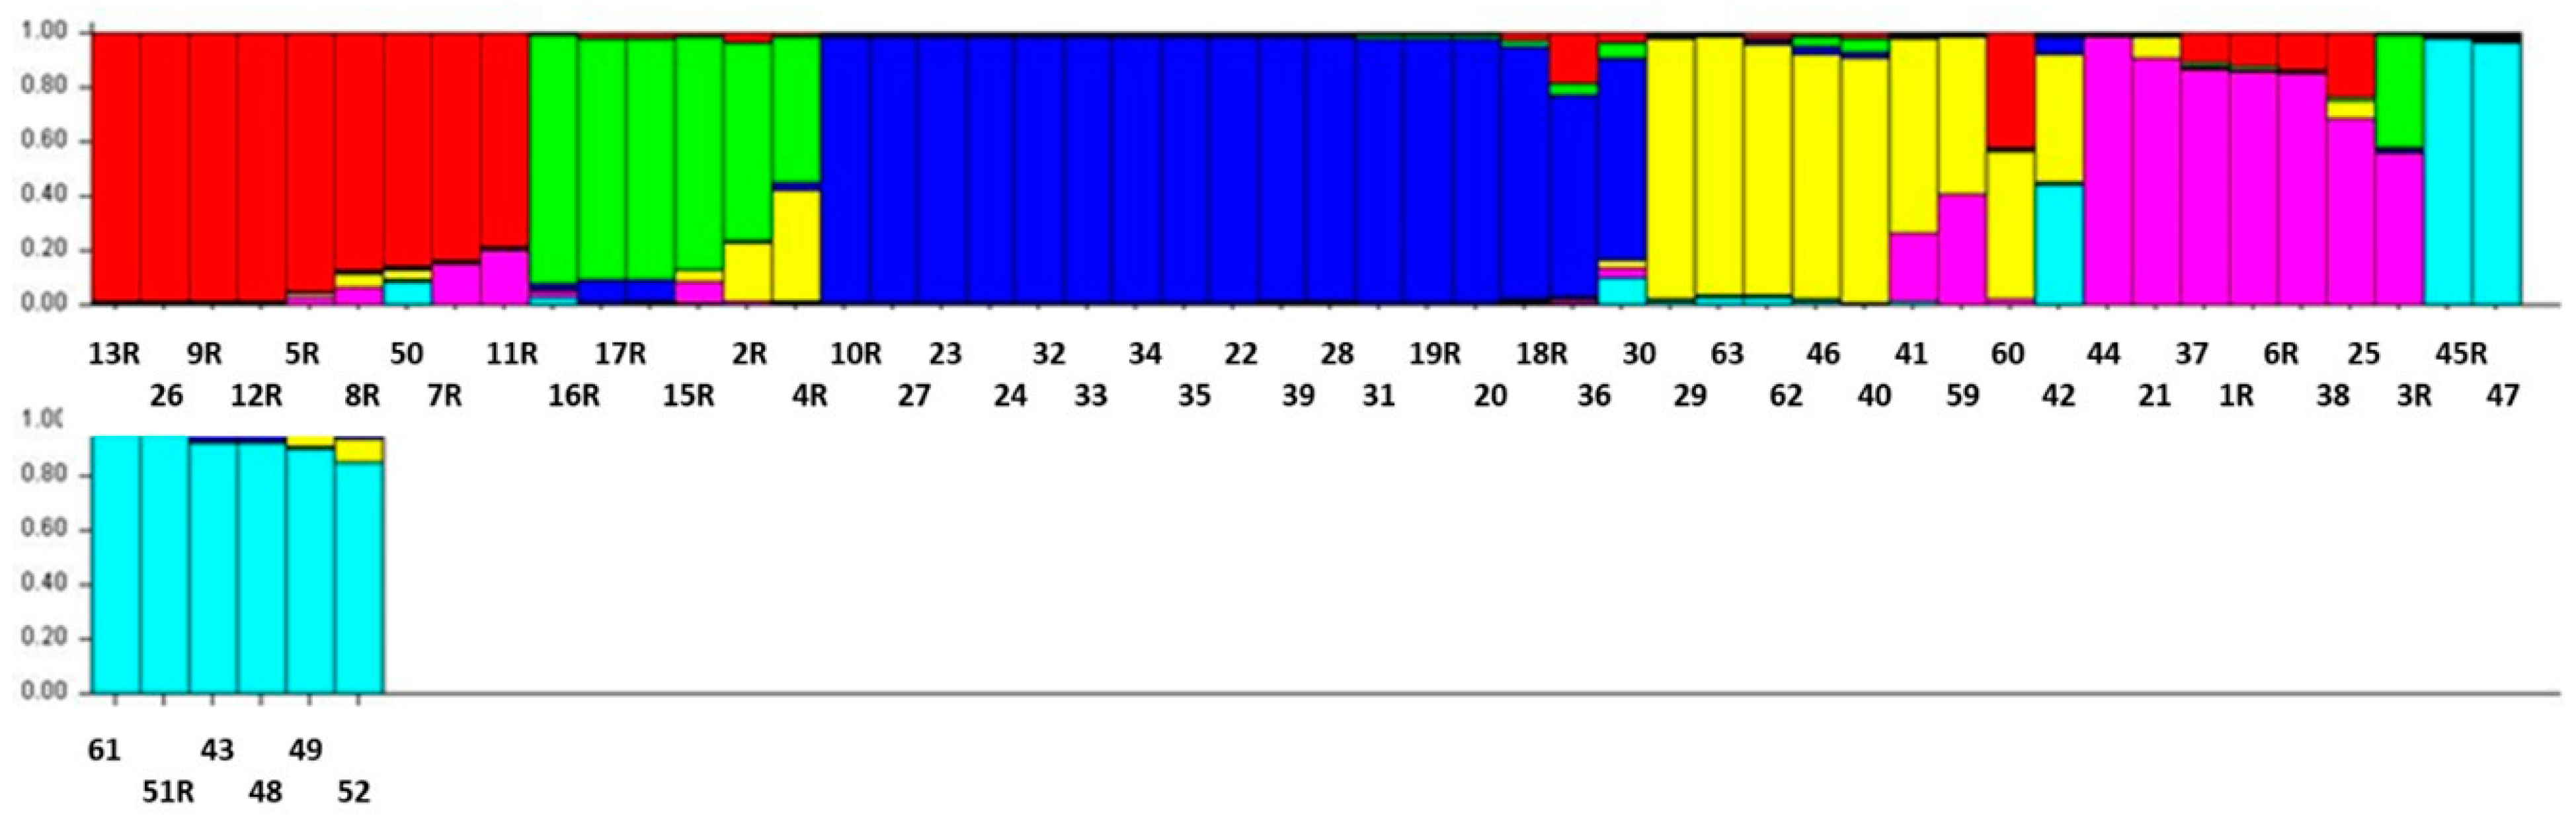
3.4. Structure Analysis

The admixture simulation model was used to assess the clustering of local coffee populations by screening six SRAP primer combinations on the 56 coffee accessions. A 1–10 K cluster range was evaluated. The output results show a sharp peak with no ambiguity, showing the highest delta K value at K = 3. There was a second sharp peak at K = 6 (Figure 4). Furthermore, the Bayesian bar graph was used to construct the graph for the admixture model. The accessions were grouped in subgroup clusters with >70% probability of membership fractions.
Out of 56 accessions, 10 formed subpopulation I (red color, representing 17.8% of the total number of accessions), 22 accessions formed subpopulation II (green color, representing 39.3%), and 9 formed subpopulation III (blue color, 16.1%). The other accessions appeared to have descended from multiple subpopulations, based on the Q value of less than 70% for all three subpopulations in K = 3 structural analysis results (Figure 5, Table 5).
Group I mainly contains accessions sourced from the northern districts of Al-Baha and Al-Majarda (Assir region). Group II members are mostly from Jebel Fayfa while members of Group III are from central Jazan (Tallan, Haroub, and Dafa). At the sharp peak in K = 6 (Figure 4), the 56 Arabica coffee accessions were divided into six subclusters. Each color represents a subgroup in the structural analysis results at K = 6 (Q value greater than 70%), while accessions with a Q value of less than 70% have mixed ancestries of more than one population (Figure 6). Of the 56 accessions, 9 were present in subpopulation I (red color), 5 were present in subpopulation II (green color), 17 in sub-population III (blue color), 6 in subpopulation IV (yellow color), 5 in subpopulation V (purple), and 8 in subpopulation VI (teal) (Figure 6).

4. Discussion

The evolution and persistence of species in their natural populations are both based on genetic diversity. Genetic diversity, both within and between populations, in natural settings may be influenced by changes in environmental conditions. Populations with high genetic diversity are more resilient to habitat loss and environmental change [28]. The evaluation and quantification of genetic variability and its dispersion in time and place can be aided by research on the genetics of the species [29]. Phenotypic and molecular levels of analysis can be used to evaluate genetic variability [30]. Diagnostic molecular markers are now more widely available for use in molecular taxonomy, cultivar identification, and marker-assisted selection in plants due to advancements in DNA fingerprinting techniques [18,31]. SRAP is a relatively new PCR marker technique that was widely employed in recent years for the characterization of plant germplasm, cultivar identification, genetic mapping, and gene cloning [32]. In the current study, six different SRAP marker combinations were used to determine the genetic diversity among 56 local Arabica coffee accessions. The six primers produced 1125 polymorphic bands in total, with an average of 187.5 alleles per primer in the 56 coffee accessions. On average, 91.4% PIC value was recorded for all primers. Similar results were recorded by Yunita et al. [33], who studied genetic diversity in Arabica coffee in Indonesia using sixteen SRAP marker combinations. They found that the average number of polymorphic loci ranged from 19 to 23, with polymorphic loci information ranging from 82.6 to 100%. In the present study, we recorded PIC values between 82.6% and 100%.
In the current study, MR was 4.88, EMR was 4.88, MI was 1.56, PIC was 0.32 and the average RP of all SRAP primer combinations was 6.06. Kumar et al. [34] reported similar results for a Jojoba population (EMR = 5.36, PIC = 0.47, RP = 8.07 and I = 2.59) using SRAP markers. The MI, which measures the efficiency of a molecular marker system, was relatively high indicating that the SRAP markers were reliable in revealing genetic differences among the different populations because they target the open-reading frame (ORF) gene-rich regions and are more prevalent in nature [34]. The genetic diversity parameters, such as the observed number of alleles (Na), effective number of alleles (Ne), Nei genetic diversity (H), and Shannon’s information index (I), were also calculated. The Na was 1.39, Ne was 1.25, H was 0.146, and I was 0.22. The average total genetic diversity (Ht) among the 56 coffee accessions was 0.30, genetic diversity within a population (Hs) was 0.15, genetic differentiation (Gst) was 0.50, and gene flow (Nm) was 0.48. Yan et al., 2019 [35], reported similar genetic diversity in Mallotus oblongifolius using SRAP markers, where H was 0.34 and I was 0.51, but the genetic differentiation in their study was weak (Gst = 0.276), whereas gene flow (Nm) was 1.31.
The cluster analysis was carried out using the Jaccard coefficient based on the UPGMA clustering method. The dendrogram grouped the coffee accessions into five main groups and three individual accessions (KSA21, KSA3R, and KSA37), which represented the most divergent genotypes. Similarly, in the study by Yunita et al. [33], SRAP data allowed for the grouping of the coffee genotypes into three clusters, which correlated with geographic distribution. In the present study, clustering generally followed geographic distribution too. Members of groups 2–4 were mostly from the Jazan region and the district of Rayda in South Assir, whereas accessions collected from the northern districts in Al-Baha and north Assir (Al-Majarda) formed two small, separate groups (G1 and G5). Therefore, it appears that there is only limited overlap between the coffee populations of the northern districts and those collected from districts further to the south. This could be because the settlements and farming communities along the western flanks of the Sarawat mountain range are quite isolated; therefore, the exchange of coffee planting material between distant districts appears to have been minimal in the past. In fact, old trees from different locations, such as KSA1R, KSA3R, KSA26, KSA36, KSA44, KSA46, KSA47, KSA50, KSA60 and KSA61, were mostly segregated into different groups and subgroups. The owners of the trees of accessions KSA26, KSA36, KSA44, KSA46 and KSA47 estimated the age of their trees to be more than 150 years. The other accessions represent younger plantings, mainly made with nursery stock provided by the Jazan Mountain Region Development Authority (JMRDA), which sources the coffee seeds for its nursery from gardens in the Jazan districts of Eddayer (villages of Tallan, Khasher, and Al-Zoghli) and Jebel Fayfa. Most of the plant material planted in Rayda (south Assir, close to the Jazan region) appears to have originated from the Jazan region. Showing the effect of geographic isolation on population structure, accessions KSA59 and KSA60, from the intriguing distant hamlet of Wadi Al-ghil (Al-Majardeh district of Assir region), formed a separate subgroup despite having a low similarity coefficient of just 0.52. Similarly, accessions KSA62 and KSA63, collected from the small and isolated farming district of Shada Al-Ala in the Al-Baha region, clustered in one subgroup with a high similarity coefficient despite having cherries with a distinct shapes and size [unpublished data]. Similar strong correlations were reported between marker-assisted clustering and geographic origin by Al-Murish et al. [18] for Yemeni coffee, and Subositi and Mujahid [36] for Tempuyung plant, where the SRAP markers were able to distinguish Tempuyung accessions originating from the same location. Generally, a high genetic resemblance typically correlates with geographic proximity [18]. However, there seem to be exceptions to this rule; we found alternate cases, where geographic proximity and morphological similarity did not match genetic resemblance. For instance, KSA21, KSA26, KSA34 and KSA63 all had bronze new leaves and a fairly large oval and pointed berries [unpublished data]; however, they segregated in different quadrats on the PCoA biplot and in different clusters in the dendrogram of the HCA (Figure 2 and Figure 3); they were also in different subpopulations, as revealed by the population structure analysis (Figure 6), despite their geographic proximity (KSA21, KSA26 and KSA34 were all collected from Jebel Fayfa). This may be because this particular location is one of the most densely populated districts in Jazan, where agriculture in general, and coffee cultivation in particular, has been practiced for centuries. Therefore, various genotypes had the time to segregate and diverge over several cultivation cycles.
Accessions KSA1R, KSA6R, and KSA38 were present away from the center along the PC1 axis, indicating that they are the most divergent genotypes. Similarly, accessions KSA59, KSA60, KSA62 and KSA63, from the northern districts of Al-Majerda (Assir region) and Al-Mekhwah (Al-Baha region), respectively, segregated away from the center along PC2, indicating their distinctiveness. Surprisingly, the main cultivar in Al-Baha region, called Shadawi (accession KSA61), was not in this group, suggesting a different genetic background (Figure 2). KSA61 clustered with accessions from the central districts of Jazan region, with only about a 20% probability of belonging to Subpopulation IV containing the genotypes from Al-Baha and north Assir (Figure 6). It could be that this genotype (KSA61) has a mixed ancestry, comprising older genotypes from Jazan (KSA20, KSA36 or KSA50) and Al-Majarda (KSA59 or KSA60). KSA62 and KSA63 from Al-Baha were represented by very few trees and may have segregated from KSA61, the dominant genotype in Al-Baha. KSA63 had long and pointed cherries, whereas KSA62 had redder cherries [unpublished data]. KSA62 and KSA63 had a similarity coefficient of 0.88 but were morphologically distinct.
The cluster analysis results, which revealed that accessions obtained from the same location generally exhibited a reduced segregation, validated PCoA. These findings demonstrated that all accessions could be discriminated at the resolution level. Overall, PCoA and cluster analysis grouping concorded with the population structure analysis. The admixture simulation model analysis showed a sharp peak with no ambiguity at the delta K value of 3, and a second sharp peak occurred at K = 6 (Q value greater than 70%) (Figure 4 and Figure 6). Similar results were reported by Jingade et al. [37], who studied Arabica coffee diversity in India using SRAP markers. In their study, the coffee populations showed the highest delta K value at K = 2 and a second peak at K = 4. In the first (K = 2) grouping, 42 Arabica genotypes were divided into two main subpopulations while 6 accessions were recorded as mixed-ancestry populations. In the second (K = 4) grouping, the 42 accessions were divided into four subpopulation clusters. Similar admixture results were also reported, suggesting that the admixtures may have been collected from the same location but descended from parents with distinct gene pools [38]. This may have been the case for the four local genotypes, characterized by large, elongated and pointed berries, which was a rare phenotype in the collection; in fact, only three accessions from Jebel Fayfa (KSA21, KSA26, KSA34) and one accession from Al-Baha (KSA63) had this feature [unpublished data]. However, the four genotypes segregated into four different groups in the population structure histogram; therefore, they appear to be heterozygous for the six analyzed SRAP primers. It could be that this particular shape of fruit is a recessive character in the population and only appeared in the two old farming districts of Jebel Fayfa and Shada Al-Ala, where the genotypes had the time to segregate over several reproductive cycles, as suggested earlier. KSA63 may have evolved from genotype KSA61, which appears to have a mixed ancestry (Figure 5).
We found considerable diversity among the coffee populations that we surveyed in terms of tree and cherry morphology and appearance, bean chemistry [unpublished data], and genetic makeup (Figure 6). Given the crop’s autogamous nature, it is plausible that these accessions were originally the same or descended from a small number of parents but were differentiated through multiple reproduction cycles and grower breeding over more than five centuries of continuous coffee-growing. Similarly, Anthony et al. [39] suggested that the likely cause of such differentiation in C. arabica at a rate of 10–15%, is outcrossing, which can reach 50% in the Ethiopian forests [40]. Furthermore, bees and other insect pollinators can carry coffee pollen as far as 6.5 km in nature; hence, hybrid vigor can increase genetic drift [41]. Alternatively, these coffee heirlooms may have resulted from multiple introductions of new coffee genetic material from the species’ center of origin in the Ethiopian highlands over centuries of commercial exchange. This may be the more likely scenario given the remarkable diversity in tree and berry morphology and bean chemistry of local coffee populations in Saudi Arabia.
Ovalle-Rivera et al. [12] suggested that growers may face different challenges due to climate shifts, and environmental conditions may become less favorable to coffee cultivation in major producing countries. This is especially true for the southwest Arabian Peninsula region and the Middle East in general [11]. The relatively rich genetic diversity of local coffee populations, as suggested by the present study, and the fact that this material has evolved in mostly semi-arid environments, which are subject to frequent drought, suggest that this germplasm may contain some interesting genes, which are significant for abiotic stress resistance. These germplasms should be conserved and used in future coffee-breeding programs to improve the environmental resilience of the coffee crop [13].

5. Conclusions

SRAP molecular markers were successfully used to assess the genetic diversity of local coffee populations grown on the mountain terraces of southwestern Saudi Arabia. The 56 accessions were mostly segregated according to geographic distribution, indicating the limited inter-regional exchange of seed and nursery stock in the region. Most of the populations from the Jazan region were somewhat related because most of the new plantings there relied on planting stock provided by one nursery, belonging to the JMRDA. The accessions from the northern district of Al-Baha and Assir formed separate groups. The results of PCoA, HCR and structural population analysis suggest considerable genetic diversity among the local coffee populations. Based on these analyses, accessions KSA1R, KSA6R, KSA21, KSA25, KSA37, KSA38, KSA42, KSA59, KSA60, KSA62 and KSA63 were the most divergent genotypes. Conserving this material and using it in breeding programs should increase coffee genetic diversity in the future and encourage the environmental resilience of the crop. Additional molecular and functional genomics studies are necessary to further elucidate how this germplasm has evolved and enhance the value of local Arabica coffee diversity in the country.

Supplementary Materials

The following supporting information can be downloaded at: https://www.mdpi.com/article/10.3390/agronomy13020302/s1, Table S1: Correlation matrix among the 56 coffee accessions.

Author Contributions

Conceptualization, I.A., H.K. and S.S.A.; methodology, M.A., H.K., M.M., Z.A.-F. and T.T.; sample collection, K.A.-G., H.K., M.D.Y.O., T.T. and M.M.; DNA analysis, K.A.-G., M.A., M.M. and T.T.; formal analysis, M.A. and H.K.; data curation, K.A.-G., M.A. and H.K.; writing, H.K. and M.A.; review and editing, I.A., Z.A.-F., M.D.Y.O., M.A. and H.K.; project administration, H.K.; funding acquisition, H.K., M.D.Y.O., T.T. and M.M. All authors have read and agreed to the published version of the manuscript.

Funding

This research was funded by the Deputyship for Research & Innovation, Ministry of Education in Saudi Arabia, grant number 1.092.

Institutional Review Board Statement

Not applicable.

Informed Consent Statement

Not applicable.

Data Availability Statement

The datasets generated during and/or analyzed during the current study are available from the corresponding author on reasonable request.

Acknowledgments

The authors extend their appreciation to the Deputyship for Research & Innovation, Ministry of Education in Saudi Arabia for funding this research work through project number 1.092.

Conflicts of Interest

The authors declare no conflict of interest.

References

  1. Wintgens, J.N. Coffee: Growing, Processing, Sustainable Production. A Guidebook for Growers, Processors, Traders, and Researchers, 1st ed.; WILEY-VCH Verlag GmbH & Co. KGaA: Weinheim, Germany, 2004. [Google Scholar]
  2. Ferreira, T.; Shuler, J.; Guimarães, R.; Farah, A. Chapter 1 Introduction to coffee plant and genetics. In Coffee: Production, Quality and Chemistry, 1st ed.; Farah, A., Ed.; The Royal Society of Chemistry: London, UK, 2019; pp. 1–25. [Google Scholar]
  3. Teressa, A.; Crouzillat, D.; Petiard, V.; Brouhan, P. Genetic diversity of arabica coffee (Coffea arabica L.) collections. Ethiop. J. Appl. Sci. Technol. 2010, 1, 63–79. [Google Scholar]
  4. Anthony, F.; Bertrand, B.; Quiros, O.; Wilches, A.; Lashermes, P.; Berthaud, J.; Charrier, A. Genetic diversity of wild coffee (Coffea arabica L.) using molecular markers. Euphytica 2001, 118, 53–65. [Google Scholar] [CrossRef]
  5. da Silva, B.S.R.; Sant’Ana, G.C.; Chaves, C.L.; Godoy Androcioli, L.; Ferreira, R.V.; Sera, G.H.; Charmetant, P.; Leroy, T.; Pot, D.; Domingues, D.S. Population structure and genetic relationships between ethiopian and brazilian coffea arabica genotypes revealed by SSR markers. Genetica 2019, 147, 205–216. [Google Scholar] [CrossRef] [PubMed]
  6. AL-Asmari, K.M.; Zeid, I.M.A.; Al-Attar, A.M. Coffee arabica in Saudi Arabia: An overview. Int. J. Pharm. Phytopharm. Res. (EIJPPR) 2020, 10, 71–78. [Google Scholar]
  7. Al-Zaidi, A.A.; Baig, M.B.; Shalaby, M.Y.; Hazber, A. Level of knowledge and its application by coffee farmers in the Udeen area, governorate of Ibb--Republic of Yemen. J. Anim. Plant Sci. 2016, 26, 1797–1804. [Google Scholar]
  8. Tounekti, T.; Mahdhi, M.; Al-Turki, T.A.; Khemira, H. Genetic diversity analysis of coffee (Coffea arabica L.)germplasm accessions growing in the southwestern Saudi Arabia using quantitative traits. Nat. Resour. 2017, 8, 321–336. [Google Scholar]
  9. Montagnon, C.; Sheibani, F.; Benti, T.; Daniel, D.; Bote, A.D. Deciphering early movements and domestication of Coffea arabica through a comprehensive genetic diversity study covering Ethiopia and Yemen. Agronomy 2022, 12, 3203. [Google Scholar] [CrossRef]
  10. Montagnon, C.; Mahyoub, A.; Solano, W.; Sheibani, F. Unveiling a unique genetic diversity of cultivated Coffea arabica L. In its main domestication center: Yemen. Genet. Resour. Crop Evol. 2021, 68, 2411–2422. [Google Scholar] [CrossRef]
  11. De Pauw, E. An Agroecological Exploration of the Arabian Peninsula; International Center for Agricultural Research in the Dry Areas (ICARDA): Beirut, Lebanon, 2002. [Google Scholar]
  12. Ovalle-Rivera, O.; Läderach, P.; Bunn, C.; Obersteiner, M.; Schroth, G. Projected shifts in Coffea arabica suitability among major global producing regions due to climate change. PLoS ONE 2015, 10, e0124155. [Google Scholar] [CrossRef] [Green Version]
  13. Tounekti, T.; Mahdhi, M.; Al-Turki, T.; Khemira, H. Water relations and photo-protection mechanisms during drought stress in four coffee (Coffea arabica) cultivars from southwestern Saudi Arabia. S. Afr. J. Bot. 2018, 117, 17–25. [Google Scholar] [CrossRef]
  14. Afzal, M.; Alghamdi, S.S.; Migdadi, H.M.; Khan, M.A.; Farooq, M. Morphological and molecular genetic diversity analysis of chickpea genotypes. Int. J. Agric. Biol. 2018, 20, 1062–1070. [Google Scholar]
  15. Ahmad, A.; Wang, J.-D.; Pan, Y.-B.; Sharif, R.; Gao, S.-J. Development and use of simple sequence repeats (SSRs) markers for sugarcane breeding and genetic studies. Agronomy 2018, 8, 260. [Google Scholar] [CrossRef] [Green Version]
  16. Alzahib, R.H.; Migdadi, H.M.; Ghamdi, A.A.A.; Alwahibi, M.S.; Afzal, M.; Elharty, E.H.; Alghamdi, S.S. Exploring genetic variability among and within hail tomato landraces based on sequence-related amplified polymorphism markers. Diversity 2021, 13, 135. [Google Scholar] [CrossRef]
  17. Benti, T. Progress in arabica coffee breeding in Ethiopia: Achievements, challenges and prospects. Int. J. Sci. Basic Appl. Res. 2017, 33, 15–25. [Google Scholar]
  18. Al-Murish, T.M.; Elshafei, A.A.; Al-Doss, A.A.; Barakat, M.N. Genetic diversity of coffee (Coffea arabica L.)in Yemen via SRAP, TRAP and SSR markers. J. Food Agric. Environ. 2013, 11, 411–416. [Google Scholar]
  19. Machado, C.; Pimentel, N.; Golynsk, A.; Ferreira, A.; Vieira, H.; Partelli, F. Genetic diversity among 16 genotypes of Coffea arabica in the Brazilian Cerrado. Genet. Mol. Res. 2017, 16, 16039794. [Google Scholar] [CrossRef]
  20. Geleta, M.; Herrera, I.; Monzón, A.; Bryngelsson, T. Genetic diversity of arabica coffee (Coffea arabica L.) in Nicaragua as estimated by simple sequence repeat markers. Sci. World J. 2012, 2012, 939820. [Google Scholar] [CrossRef]
  21. Li, G.; Quiros, C.F. Sequence-related amplified polymorphism (SRAP), a new marker system based on a simple PCR reaction: Its application to mapping and gene tagging in brassica. Theor. Appl. Genet. 2001, 103, 455–461. [Google Scholar] [CrossRef]
  22. Jaccard, P. Nouvelles recherches sur la distribution florale. Bull. Soc. Vaud. Sci. Nat. 1908, 44, 223–270. [Google Scholar]
  23. Hammer, Ø.; Harper, D.A.; Ryan, P.D. Past: Paleontological statistics software package for education and data analysis. Palaeontol. Electron. 2001, 4, 9. [Google Scholar]
  24. Anderson, J.A.; Churchill, G.; Autrique, J.; Tanksley, S.; Sorrells, M. Optimizing parental selection for genetic linkage maps. Genome 1993, 36, 181–186. [Google Scholar] [CrossRef] [PubMed]
  25. Yeh, F.C.; Yang, R.; Boyle, T.B.; Ye, Z.; Mao, J.X. Popgene Version 1.32, the User-Friendly Shareware for Population Genetic Analysis; Molecular Biology and Biotechnology Centre, University of Alberta: Edmonton, AB, Canada, 1999. [Google Scholar]
  26. Earl, D.A.; VonHoldt, B.M. Structure harvester: A website and program for visualizing structure output and implementing the Evanno method. Conserv. Genet. Resour. 2012, 4, 359–361. [Google Scholar] [CrossRef]
  27. Evanno, G.; Regnaut, S.; Goudet, J. Detecting the number of clusters of individuals using the software structure: A simulation study. Mol. Ecol. 2005, 14, 2611–2620. [Google Scholar] [CrossRef] [Green Version]
  28. Hopley, T.; Byrne, M. Gene flow and genetic variation explain signatures of selection across a climate gradient in two riparian species. Genes 2019, 10, 579. [Google Scholar] [CrossRef] [PubMed] [Green Version]
  29. Chown, S.L.; Hodgins, K.A.; Griffin, P.C.; Oakeshott, J.G.; Byrne, M.; Hoffmann, A.A. Biological invasions, climate change, and genomics. In Crop Breeding: Bioinformatics and Preparing for Climate Change; Santosh, K., Ed.; Apple Academic Press: Waretown, NJ, USA, 2016; pp. 37–91. [Google Scholar]
  30. Luo, Y.; Zhang, X.; Xu, J.; Zheng, Y.; Pu, S.; Duan, Z.; Li, Z.; Liu, G.; Chen, J.; Wang, Z. Phenotypic and molecular marker analysis uncovers the genetic diversity of the grass Stenotaphrum secundatum. BMC Genet. 2020, 21, 86. [Google Scholar] [CrossRef]
  31. Hasan, N.; Choudhary, S.; Naaz, N.; Sharma, N.; Laskar, R.A. Recent advancements in molecular marker-assisted selection and applications in plant breeding programmes. J. Genet. Eng. Biotechnol. 2021, 19, 128. [Google Scholar] [CrossRef]
  32. Nadeem, M.A.; Nawaz, M.A.; Shahid, M.Q.; Doğan, Y.; Comertpay, G.; Yıldız, M.; Hatipoğlu, R.; Ahmad, F.; Alsaleh, A.; Labhane, N. DNA molecular markers in plant breeding: Current status and recent advancements in genomic selection and genome editing. Biotechnol. Biotechnol. Equip. 2018, 32, 261–285. [Google Scholar] [CrossRef] [Green Version]
  33. Yunita, R.; Oktavioni, M.; Chaniago, I.; Syukriani, L.; Setiawan, M.A.; Jamsari, J. Analysis of genetic diversity of arabica coffee [Coffea arabica L.] in Solok regency by SRAP molecular markers. IOP Conf. Ser. Earth Environ. Sci. 2020, 497, 012018. [Google Scholar] [CrossRef]
  34. Kumar, J.; Heikrujam, M.; Sharma, K.; Agrawal, V. SRAP and SSR marker-assisted genetic diversity, population structure analysis and sex identification in jojoba (Simmondsia chinensis). Ind. Crop. Prod. 2019, 133, 118–132. [Google Scholar] [CrossRef]
  35. Yan, W.; Li, J.; Zheng, D.; Friedman, C.; Wang, H. Analysis of genetic population structure and diversity in Mallotus oblongifolius using ISSR and SRAP markers. PeerJ 2019, 7, e7173. [Google Scholar] [CrossRef] [Green Version]
  36. Subositi, D.; Mujahid, R. Karakterisasi genetik tempuyung (Sonchus arvensis L.) berdasarkan penanda molekuler sequence-related amplified polymorphism. J. Biol. Indones. 2013, 9, 167–174. [Google Scholar]
  37. Jingade, P.; Huded, A.K.; Kosaraju, B.; Mishra, M.K. Diversity genotyping of Indian coffee (Coffea arabica L.)germplasm accessions by using SRAP markers. J. Crop Improv. 2019, 33, 327–345. [Google Scholar] [CrossRef]
  38. Liu, C.C.; Shringarpure, S.; Lange, K.; Novembre, J. Exploring population structure with admixture models and principal component analysis. In Statistical Population Genomics; Dutheil, J.Y., Ed.; Springer US: New York, NY, USA, 2020; pp. 67–86. [Google Scholar]
  39. Anthony, F.; Combes, M.; Astorga, C.; Bertrand, B.; Graziosi, G.; Lashermes, P. The origin of cultivated Coffea arabica L. varieties revealed by AFLP and SSR markers. Theor. Appl. Genet. 2002, 104, 894–900. [Google Scholar] [CrossRef] [PubMed]
  40. Berecha, G.; Aerts, R.; Vandepitte, K.; Van Glabeke, S.; Muys, B.; Roldán-Ruiz, I.; Honnay, O. Effects of forest management on mating patterns, pollen flow and intergenerational transfer of genetic diversity in wild arabica coffee (Coffea arabica L.) from Afromontane rainforests. Biol. J. Linn. Soc. 2014, 112, 76–88. [Google Scholar] [CrossRef] [Green Version]
  41. Bertrand, R.; Lenoir, J.; Piedallu, C.; Riofrío-Dillon, G.; De Ruffray, P.; Vidal, C.; Pierrat, J.-C.; Gégout, J.-C. Changes in plant community composition lag behind climate warming in lowland forests. Nature 2011, 479, 517–520. [Google Scholar] [CrossRef]
Figure 1. A map of southwestern Saudi Arabia showing the sites where we collected coffee plant material for the study. The collection sites are marked with black stars (adapted from Tounekti et al. [8]).
Agronomy 13 00302 g001
Figure 2. Biplot analysis of coffee accessions’ diversity as inferred from SRAP marker data.
Agronomy 13 00302 g002
Figure 3. Dendrogram generated by Jaccard coefficient and UPGMA clustering method, based on SRAP molecular marker data from 56 local Arabica coffee accessions. The numbers in front of the branches are bootstrap values.
Agronomy 13 00302 g003
Figure 4. The number of K clusters (1–10) generated from six SRAP primer combinations using ad hoc statistics for ΔK, showing peaks in optimal sub-cluster populations for population structure analysis.
Agronomy 13 00302 g004
Figure 5. Population structure analysis at K = 3 using six SRAP molecular markers’ data on 56 Arabica coffee accessions collected from the southwestern part of Saudi Arabia. Each color represents a subgroup of the total population, and the number represents the accession coding used in the study. Each accession is represented by a bar (the total length of the bar represents a probability of 1.0) made of three stacked sections; the length of each section represents the probability of membership in each of the three subgroups.
Agronomy 13 00302 g005
Figure 6. Population structure analysis at K = 6 using six SRAP molecular markers’ data for 56 Arabica coffee accessions collected from the southwestern part of Saudi Arabia. Each color represents a subgroup of the total population, and the numbers represent the accession coding used in the study.
Agronomy 13 00302 g006
Table 1. Altitude and latitude of the sites where the coffee accessions were sourced. The sites are located between longitudes 42°22′ and 43°07′ E.
#Accession No.RegionDistrictAltitude (m a.s.l.)Latitude
1KSA1RJazanKhacher/Al-Zoughli125417°18′03″ N
2KSA2RJazanKhacher/Al-Guatil148417°19′01″ N
3KSA3RJazanKhacher/Al-Guatil148417°19′01″ N
4KSA4RJazanJebel Fayfa154117°15′21″ N
5KSA5RJazanWadi Dafa125417°25′41″ N
6KSA6RJazanTallan167217°23′12″ N
7KSA7RJazanTallan167217°23′12″ N
8KSA8RJazanTallan154617°23′01″ N
9KSA9RJazanTallan167217°23′12″ N
10KSA10RAl-BahaShada Al-ala154819°50′54″ N
11KSA11RJazanKhacher/Al-Zoughli125417°18′03″ N
12KSA12RJazanMaaddi128717°29′29″ N
13KSA13RJazanMaaddi134417°29′29″ N
14KSA15RAssirRayda159418°11′37″ N
15KSA16RAssirRayda159418°11′37″ N
16KSA17RAssirRayda151918°11′37″ N
17KSA18RJazanJebel Fayfa126017°15′20″ N
18KSA19RJazanJebel Fayfa166017°15′55″ N
19KSA20JazanJebel Fayfa126017°15′20″ N
20KSA21JazanJebel Fayfa126017°15′20″ N
21KSA22JazanJebel Fayfa126017°15′20″ N
22KSA23JazanJebel Fayfa126017°15′20″ N
23KSA24JazanJebel Fayfa126017°15′20″ N
24KSA25JazanJebel Fayfa126017°15′20″ N
25KSA26JazanJebel Fayfa155017°15′24″ N
26KSA27JazanJebel Fayfa155017°15′24″ N
27KSA28JazanJebel Fayfa155017°15′24″ N
28KSA29JazanAl-Gahr184617°38′08″ N
29KSA30JazanAl-Gahr184617°38′08″ N
30KSA31JazanAl-Gahr184617°38′08″ N
31KSA32JazanAl-Gahr184617°38′08″ N
32KSA33JazanAl-Gahr184617°38′08″ N
33KSA34JazanJebel Fayfa166017°15′55″ N
34KSA35JazanJebel Fayfa166017°15′55″ N
35KSA36JazanJebel Fayfa145017°15′59″ N
36KSA37JazanEddayer110017°22′10″ N
37KSA38JazanEddayer122817°22′10″ N
38KSA39JazanEddayer122817°22′10″ N
39KSA40JazanHaroub110017°29′29″ N
40KSA41AssirRayda145018°11′37″ N
41KSA42AssirRayda145018°11′37″ N
42KSA43AssirRayda140018°11′37″ N
43KSA44JazanJebel Fayfa152417°15′48″ N
44KSA45RJazanJebel Fayfa152417°15′48″ N
45KSA46JazanAl-Gahr175017°39′01″ N
46KSA47JazanAl-Gahr175017°39′01″ N
47KSA48JazanJebel Fayfa126017°15′20″ N
48KSA49JazanJebel Fayfa126017°15′20″ N
49KSA50JazanJebel Fayfa126017°15′20″ N
50KSA51RJazanJebel Fayfa152417°17′13″ N
51KSA52JazanJebel Fayfa155017°15′24″ N
52KSA59AssirAl-Majarda132919°09′35″ N
53KSA60AssirAl-Majarda130019°09′35″ N
54KSA61Al-BahaShada Al-ala154819°50′54″ N
55KSA62Al-BahaShada Al-ala154819°50′54″ N
56KSA63Al-BahaShada Al-ala154819°50′54″ N
Table 2. Forward and reverse sequences of the SRAP markers used in the study.
Primer PairForward SequenceReverse Sequence
F1 × R115‘-TGAGTCCAAACCGGATA-3’5‘-GACTGCGTACGAATTCAG-3’
F3 × R35‘-TGAGTCCAAACCGGAT-3’5‘-GACTGCGTACGAATTGAC-3’
F4 × R105‘-TGAGTCCAAACCGGAGA-3’
F4 × R115‘-TGAGTCCAAACCGGAGA-3’5‘-GACTGCGTACGAATTCAG-3’
F6 × R25‘-TGAGTCCAAACCGGACC-3’5‘-GACTGCGTACGAATTTGC-3’
F9 × R105‘-TGAGTCCAAACCGGTCC-3’
Table 3. Genetic variability among 56 coffee accessions, as revealed by SRAP markers.
Primer CombinationTotal Number of FragmentsTotal Number of BandsNumber of Polymorphic LociFraction Polymorphism (FP)% PolymorphismPIC ValueMarker Index (MI)Resolving Power (RP)
F01 × R112406611000.221.306.85
F03 × R031714411000.491.965.95
F04 × R10103221500.130.263.75
F04 × R112936611000.372.226.92
F06 × R021084411000.331.324.98
F09 × R102107711000.422.947.95
Total112529 1.981036.40
Average number of bands187.54.834.83191.660.321.666.06
F1 × R11 means forward and reverse primer combination, respectively. PIC = polymorphic information content. Multiplex ratio (MR) = total bands/total primers used = 29/6 = 4.88.
Table 4. Principal coordinates (PCs), eigenvalues, percentage of variance explained by the PCs and cumulative percentage of variance explained by each of the PCs.
AxisEigenvalueCumulative EigenvaluePercent %Cumulative (%)
11.841.8426.8426.84
21.163.0016.8243.66
30.703.7010.1853.84
40.584.288.4862.32
50.434.726.3068.62
60.345.064.9973.61
70.295.354.1777.78
80.225.563.1780.95
90.135.691.8882.82
100.115.801.5884.40
110.085.881.2185.61
120.075.951.0286.63
130.056.000.7387.36
Table 5. Structural population grouping of the studied 56 Arabica coffee accessions at K = 3.
Accession No.RegionDistrictStructure StatusAccession No.RegionDistrictStructure Status
KSA1RJazanKhacher/Al-ZoughliAMKSA30JazanAl-GahrSPII
KSA2RJazanKhacher/Al-GuatilAMKSA31JazanAl-GahrSPII
KSA3RJazanKhacher/Al-GuatilSPIKSA32JazanAl-GahrSPII
KSA4RJazanJebel FayfaAMKSA33JazanAl-GahrSPII
KSA5RJazanWadi DafaSPIIIKSA34JazanJebel FayfaSPII
KSA6RJazanTallanAMKSA35JazanJebel FayfaSPII
KSA7RJazanTallanSPIIIKSA36JazanJebel FayfaSPII
KSA8RJazanTallanSPIIIKSA37JazanEddayerSPI
KSA9RJazanTallanSPIIIKSA38JazanEddayerAM
KSA10RAl-BahaShada Al-alaAMKSA39JazanEddayerSPII
KSA11RJazanKhacher/Al-ZoughliSPIIIKSA40JazanHaroubSPI
KSA12RJazanMaadiSPIIIKSA41AssirRaydaSPI
KSA13RJazanMaadiSPIIIKSA42AssirRaydaAM
KSA15RAssirRaydaSPIIKSA43AssirRaydaSPII
KSA16RAssirRaydaAMKSA44JazanJebel FayfaAM
KSA17RAssirRaydaSPIIKSA45RJazanJebel FayfaAM
KSA18RJazanJebel FayfaSPIIKSA46JazanAl-GahrSPI
KSA19RJazanJebel FayfaSPIIKSA47JazanAl-GahrAM
KSA20JazanJebel FayfaSPIIKSA48JazanJebel FayfaSPII
KSA21JazanJebel FayfaSPIKSA49JazanJebel FayfaAM
KSA22JazanJebel FayfaSPIIKSA50JazanJebel FayfaSPIII
KSA23JazanJebel FayfaSPIIKSA51RJazanJebel FayfaAM
KSA24JazanJebel FayfaSPIIKSA52JazanJebel FayfaAM
KSA25JazanJebel FayfaAMKSA59AssirAl-MajardaSPI
KSA26JazanJebel FayfaSPIIIKSA60AssirAl-MajardaSPI
KSA27JazanJebel FayfaSPIIKSA61Al-BahaShada Al-alaSPII
KSA28JazanJebel FayfaSPIIKSA62Al-BahaShada Al-alaSPI
KSA29JazanAl-GahrSPIIKSA63Al-BahaShada Al-alaSPI
Note: Subpopulation I (SPI, red color), subpopulation II (SPII, green color), Subpopulation III (SPIII blue color), Ancestry Admixture (AM, multi-color peak).
Disclaimer/Publisher’s Note: The statements, opinions and data contained in all publications are solely those of the individual author(s) and contributor(s) and not of MDPI and/or the editor(s). MDPI and/or the editor(s) disclaim responsibility for any injury to people or property resulting from any ideas, methods, instructions or products referred to in the content.

