Article

Experimental Study on Kinetics and Mechanism of Ciprofloxacin Degradation in Aqueous Phase Using Ag-TiO2/rGO/Halloysite Photocatalyst

1
Department of Oil Refining and Petrochemistry, Hanoi University of Mining and Geology, 18 Vien Street, Bac Tu Liem District, Hanoi 11910, Vietnam
2
Institute of Ecology and Works Protection, Vietnam Academy for Water Resources, 267 Chua Boc Street, Dong Da District, Hanoi 11515, Vietnam
*
Author to whom correspondence should be addressed.
Catalysts 2023, 13(2), 225; https://doi.org/10.3390/catal13020225
Submission received: 24 November 2022 / Revised: 19 December 2022 / Accepted: 10 January 2023 / Published: 18 January 2023
(This article belongs to the Section Photocatalysis)

Abstract

:
In this study, Ag-TiO2/rGO/halloysite nanotubes were synthesised from natural sources using a simple method. The material was characterised by X-ray diffraction (XRD), Fourier-transform infrared (FTIR), Raman spectroscopy, BET, scanning electron microscopy (SEM) and UV-vis DRS techniques. The as-synthesised material has a sandwich-like shape, with the active phase distributed evenly over the rGO/HNT support. Compared to pure TiO2, the material has a lower band gap energy (~2.7 eV) and a suitable specific surface area (~80 m2/g), making it able to participate effectively in the photochemical degradation of pollutants. The catalyst showed exceptional activity in the degradation of CIP antibiotics in water, achieving a conversion of about 90% after 5 h of irradiation at an initial CIP concentration of 20 ppm. This efficiency was significantly higher than that of pure TiO2 and Ag-TiO2, which could prove the important effect of the support and silver doping. The results of the experiments show that the process follows a pseudo-first-order kinetic model in the case of (1%)Ag wt. and pseudo-second-order in the case of (3%)Ag wt., which could be explained by the aggregation of silver and the increasing role of chemisorption. Tests with radical scavengers showed that the •OH radical had the greatest effect on CIP decomposition, while •O2 had the least. The neutral pH value and the high degree of mineralisation (approx. 80%) confirm the potential of the material for use in wastewater treatment.

1. Introduction

The presence of pharmaceuticals, especially antibiotics, in surface waters is harmful to the environment. Due to the spread of bacterial drug resistance, the presence of a wide range of antibiotics in the aquatic environment can pose a major risk to the ecosystem and public health. Recent studies have documented the presence of fluoroquinolones in the environment in numerous countries [1,2,3]. Therefore, alternative physicochemical methods are needed to remove these toxins and reduce their negative impact on the environment.
Ciprofloxacin, an antibiotic from the fluoroquinolone family, is commonly used to treat various bacterial infections [4]. Several studies have shown that CIP is sensitive to direct photochemical effects from UV irradiation with hydrogen peroxide (H2O2) and titanium dioxide (TiO2) [5].
Since TiO2 has a considerable band gap energy, UV irradiation is required to initiate the photocatalytic ability. Moreover, the rapid recombination of electron–hole pairs can drastically reduce quantum efficiency. Therefore, the TiO2 band gap must be reduced to gain photon energy, which is a common method to improve photocatalytic efficiency. To reduce the band gap, metals and metal oxides such as Cu, Ag, Cr, Fe, etc., are often added to the TiO2 crystal lattice. Another option is the addition of non-metals such as N, C, S, F, Cl, etc. Silver, one of the most effective components among them [6], is often chosen to enhance the photocatalytic activity of pure TiO2. This metal not only shifts the TiO2 band gap to the visible light region but also produces the plasmonic resonance effect that assists in electron–hole separation [7,8,9]. Reduced electron–hole recombination allows the effective transport of photochemical energy, which affects the redox reactions at the composite surfaces.
The use of photocatalysis, as mentioned above, is increasing as a green and exceptional method that can treat a wide range of organic contaminants [10,11,12]. However, due to the lack of stability, toxicity, and the insufficient use of solar energy, the applicability of such photocatalysts is limited. Grafting photoactive phases onto the support could be a successful approach for solving this problem. In addition, the use of mixed active phases that can improve the photocatalytic activity by gaining their special effect was also reported. In those publications, the kinetics and mechanism of antibiotics’ degradation under irradiation were discussed thoroughly [13,14,15]. Advances in our regard include the use of reduced graphene oxide and halloysite nanotubes from natural sources.
Halloysite nanotubes (HNTs) have a typical length in the range of 100 to 200 nm and a specific surface area of 40 to 150 m2/g. The uniform pore size (40–200 nm) and the ordered tubular structure of halloysite-based materials are their advantages. Most recent studies have focused on the use of halloysite as a support with metal nanoparticles dispersed on its outer surface to serve as the active phase [16,17,18].
In addition, numerous recent works have presented different strategies for the preparation of graphene-based photocatalysts and evaluated their activity. In this situation, graphene serves as an electron-accepting and transferring centre, which enables the material to perform photochemical processes with lower excitation energies [19,20]. Published work shows that the method of producing graphene still presents certain challenges, particularly the number of carbon monolayers and the reattachment of these monolayers in graphene [21]. Due to the advantages of halloysite and graphene as individual materials, but also due to their limitations, there is little research focused on the process of fusing these two elements to produce nanocomposites. As little is known about this substance, it is often used in its unmodified form and has not been specifically used as a catalyst, particularly as a photocatalyst.
In this work, the preparation of the photocatalyst Ag-TiO2/rGO/HNT was reported. The photocatalytic activity, kinetics, the effects of pH and active phase content, and the existence of reactive radicals in the reaction process were also investigated to provide a basis for developing a suitable reaction mechanism.

2. Results and Discussion

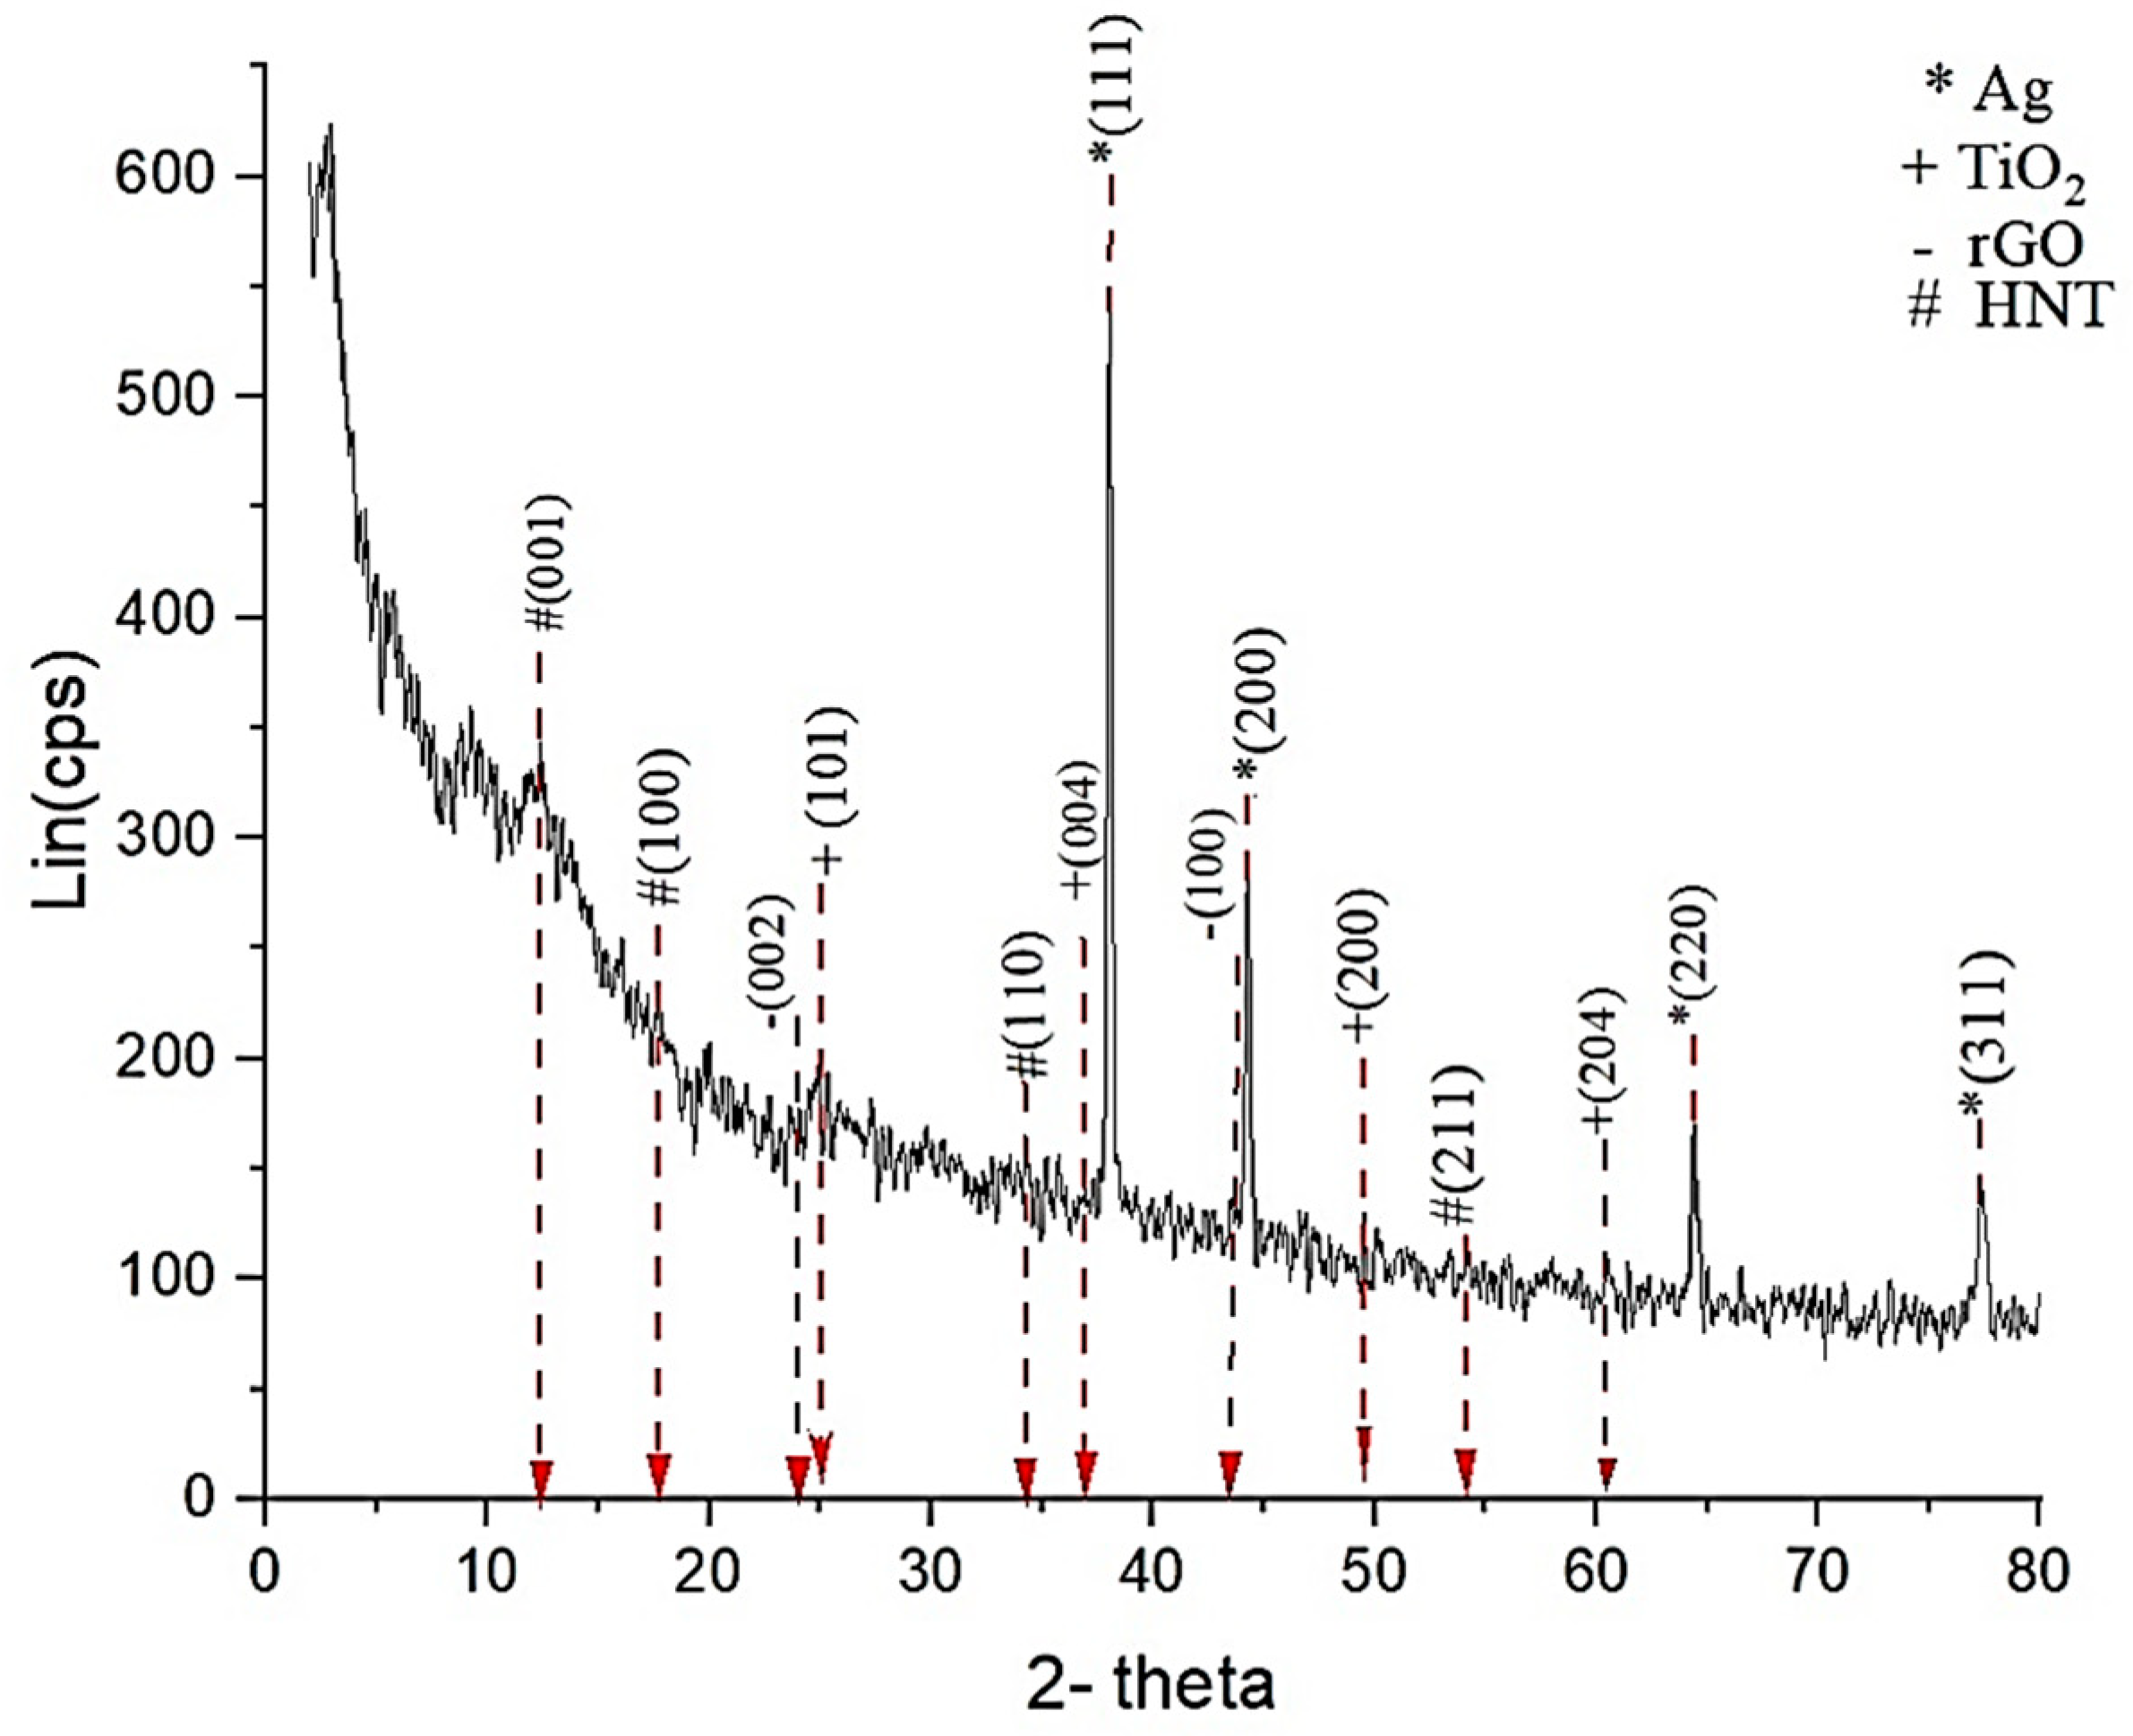
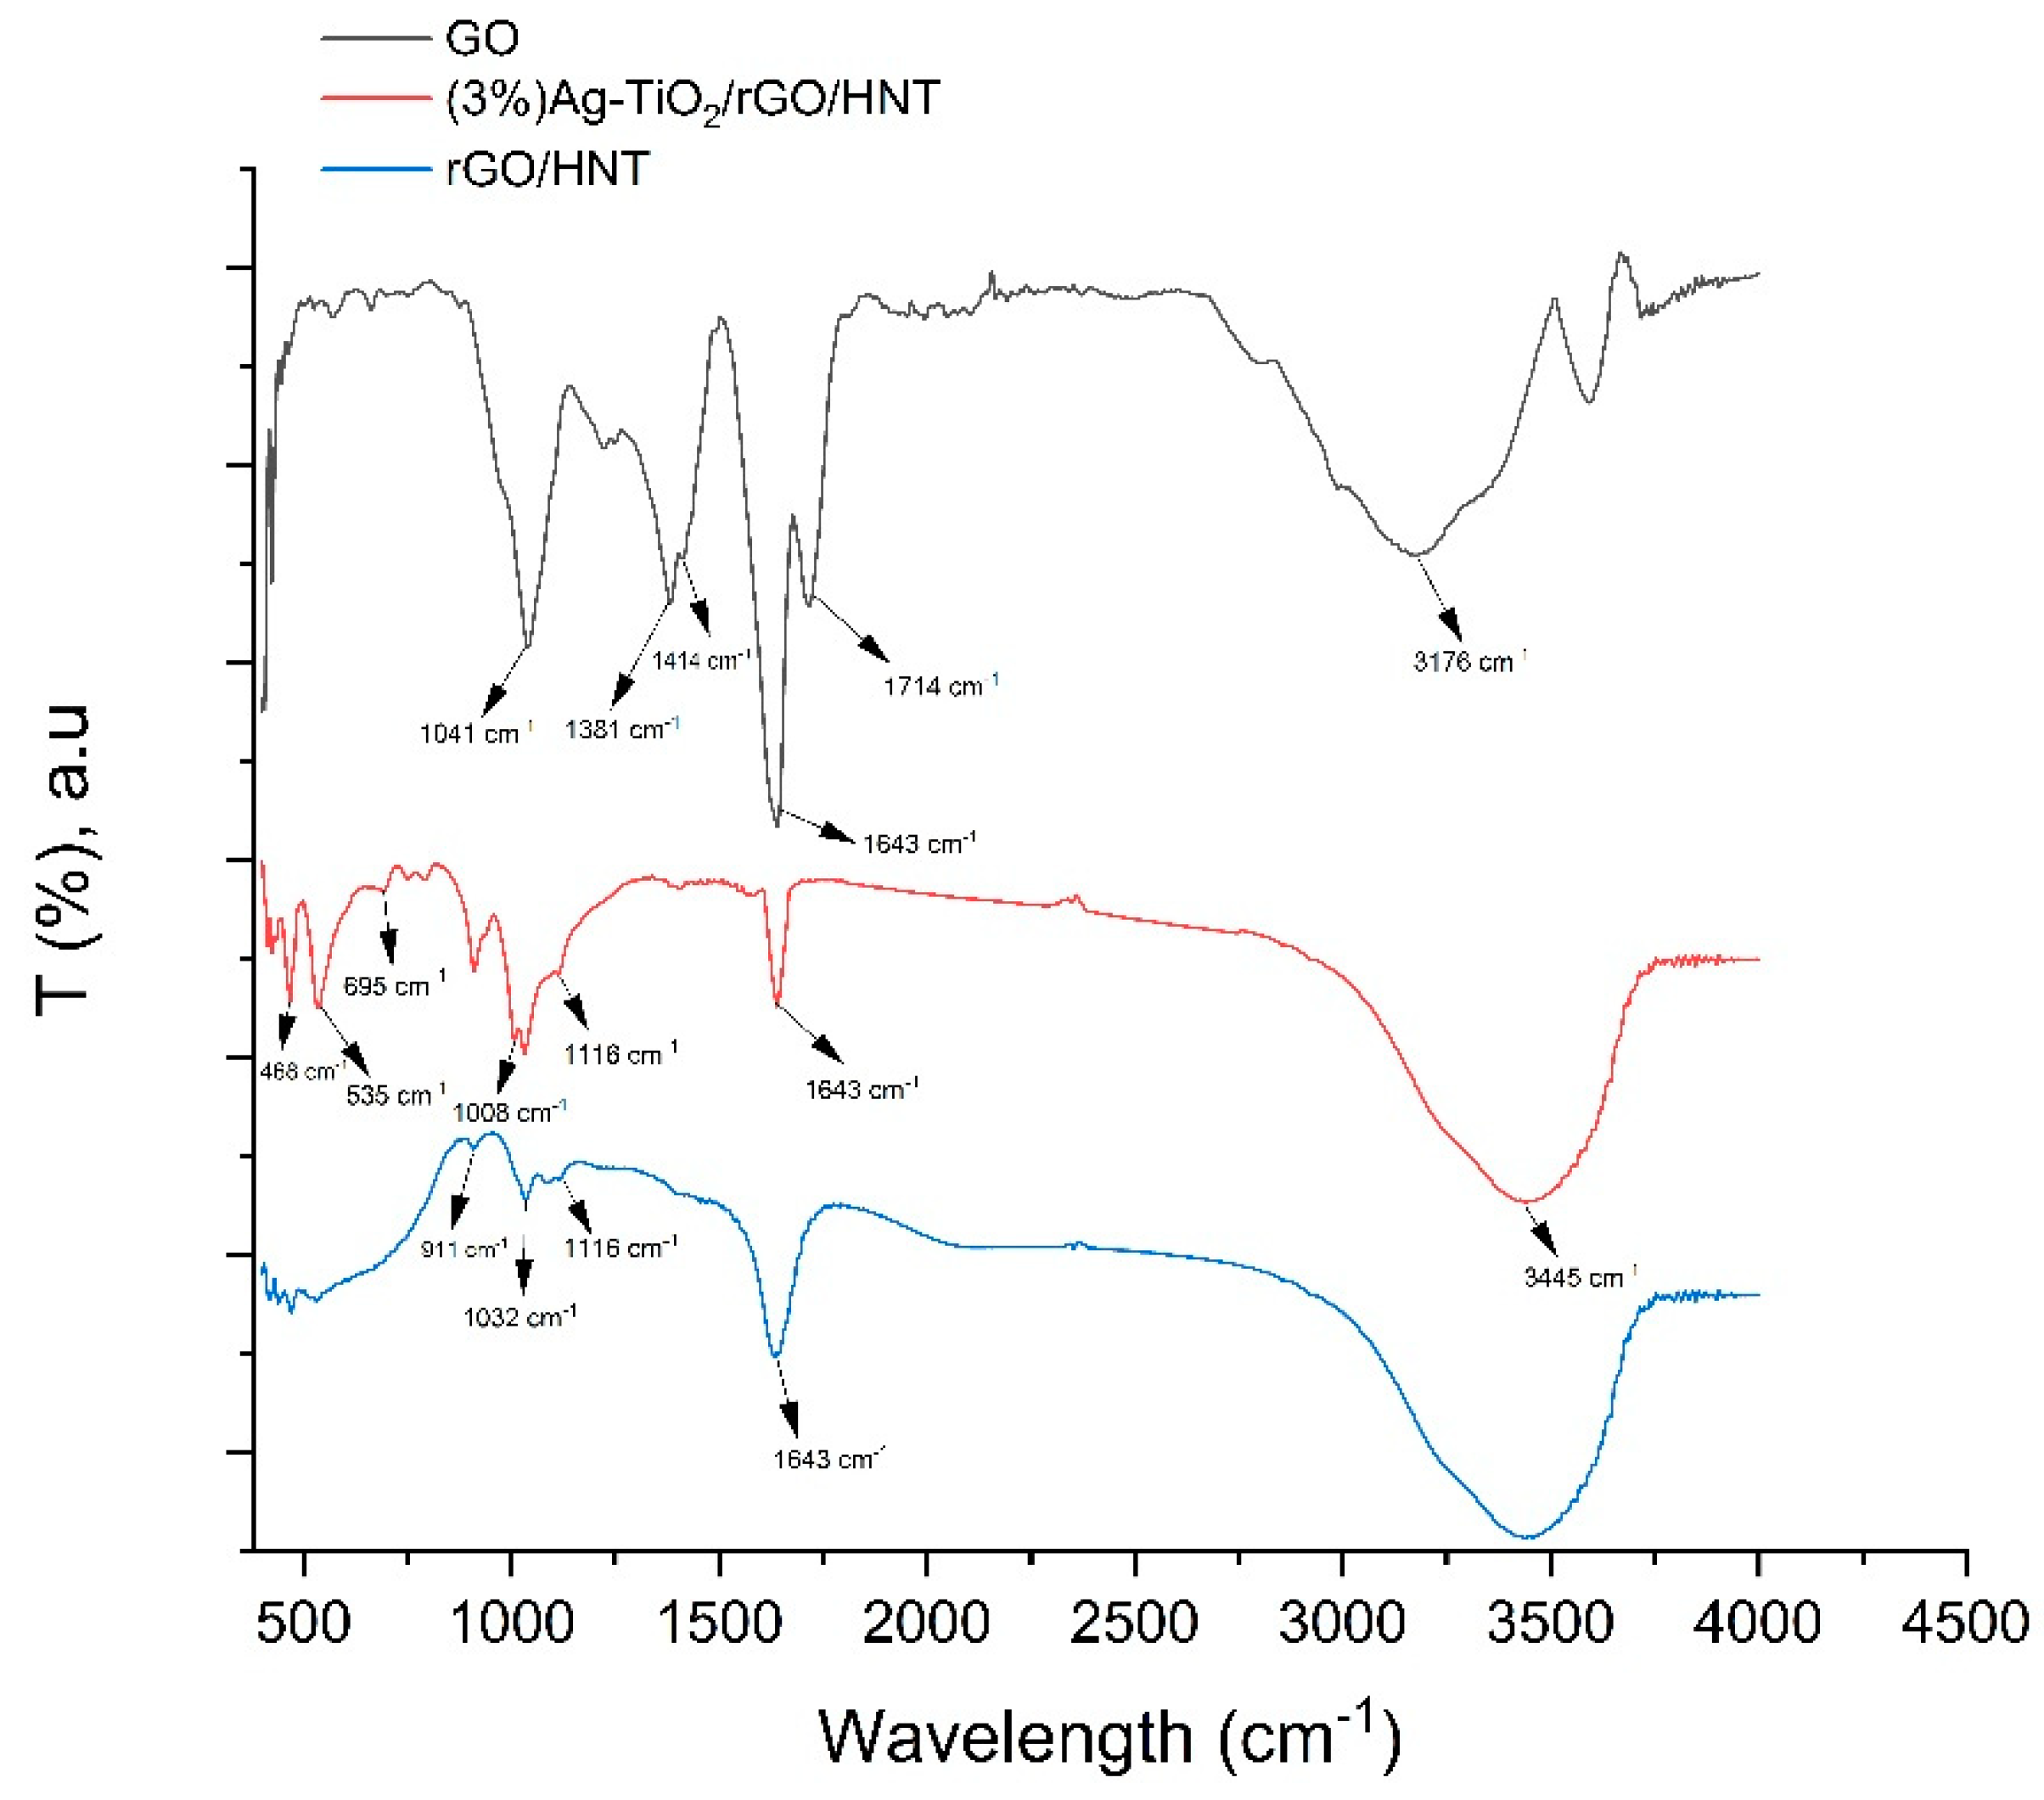
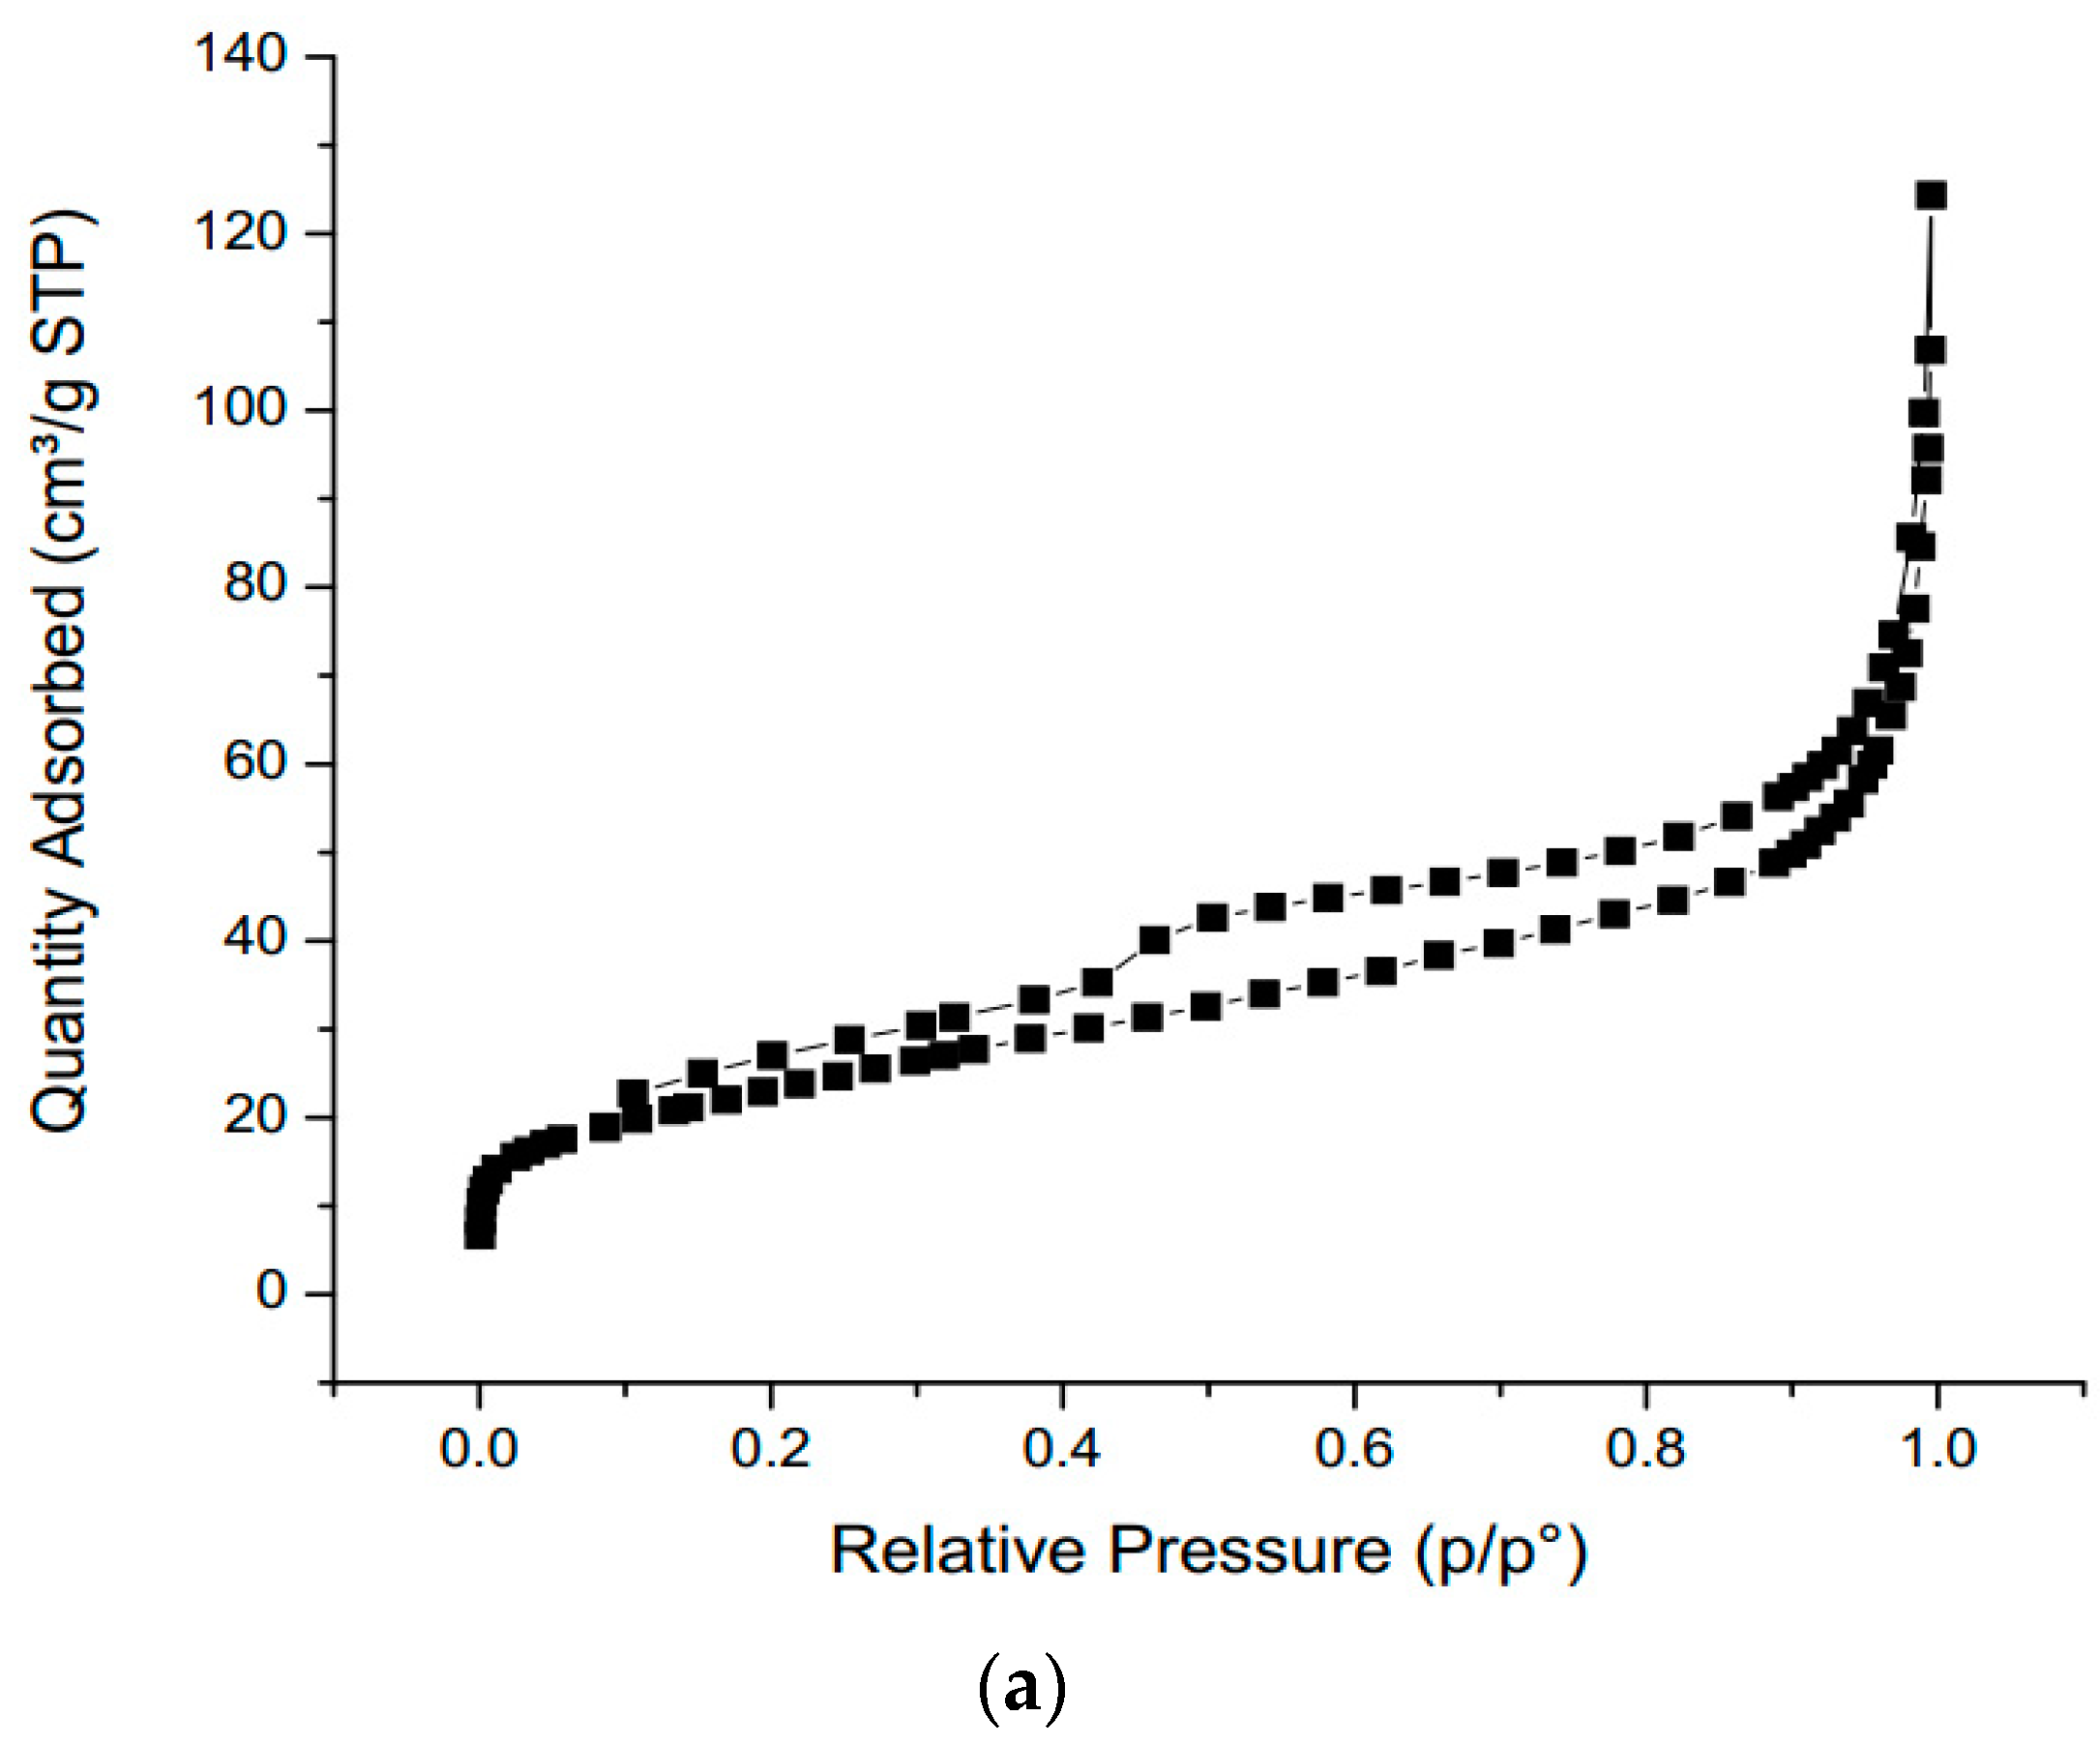
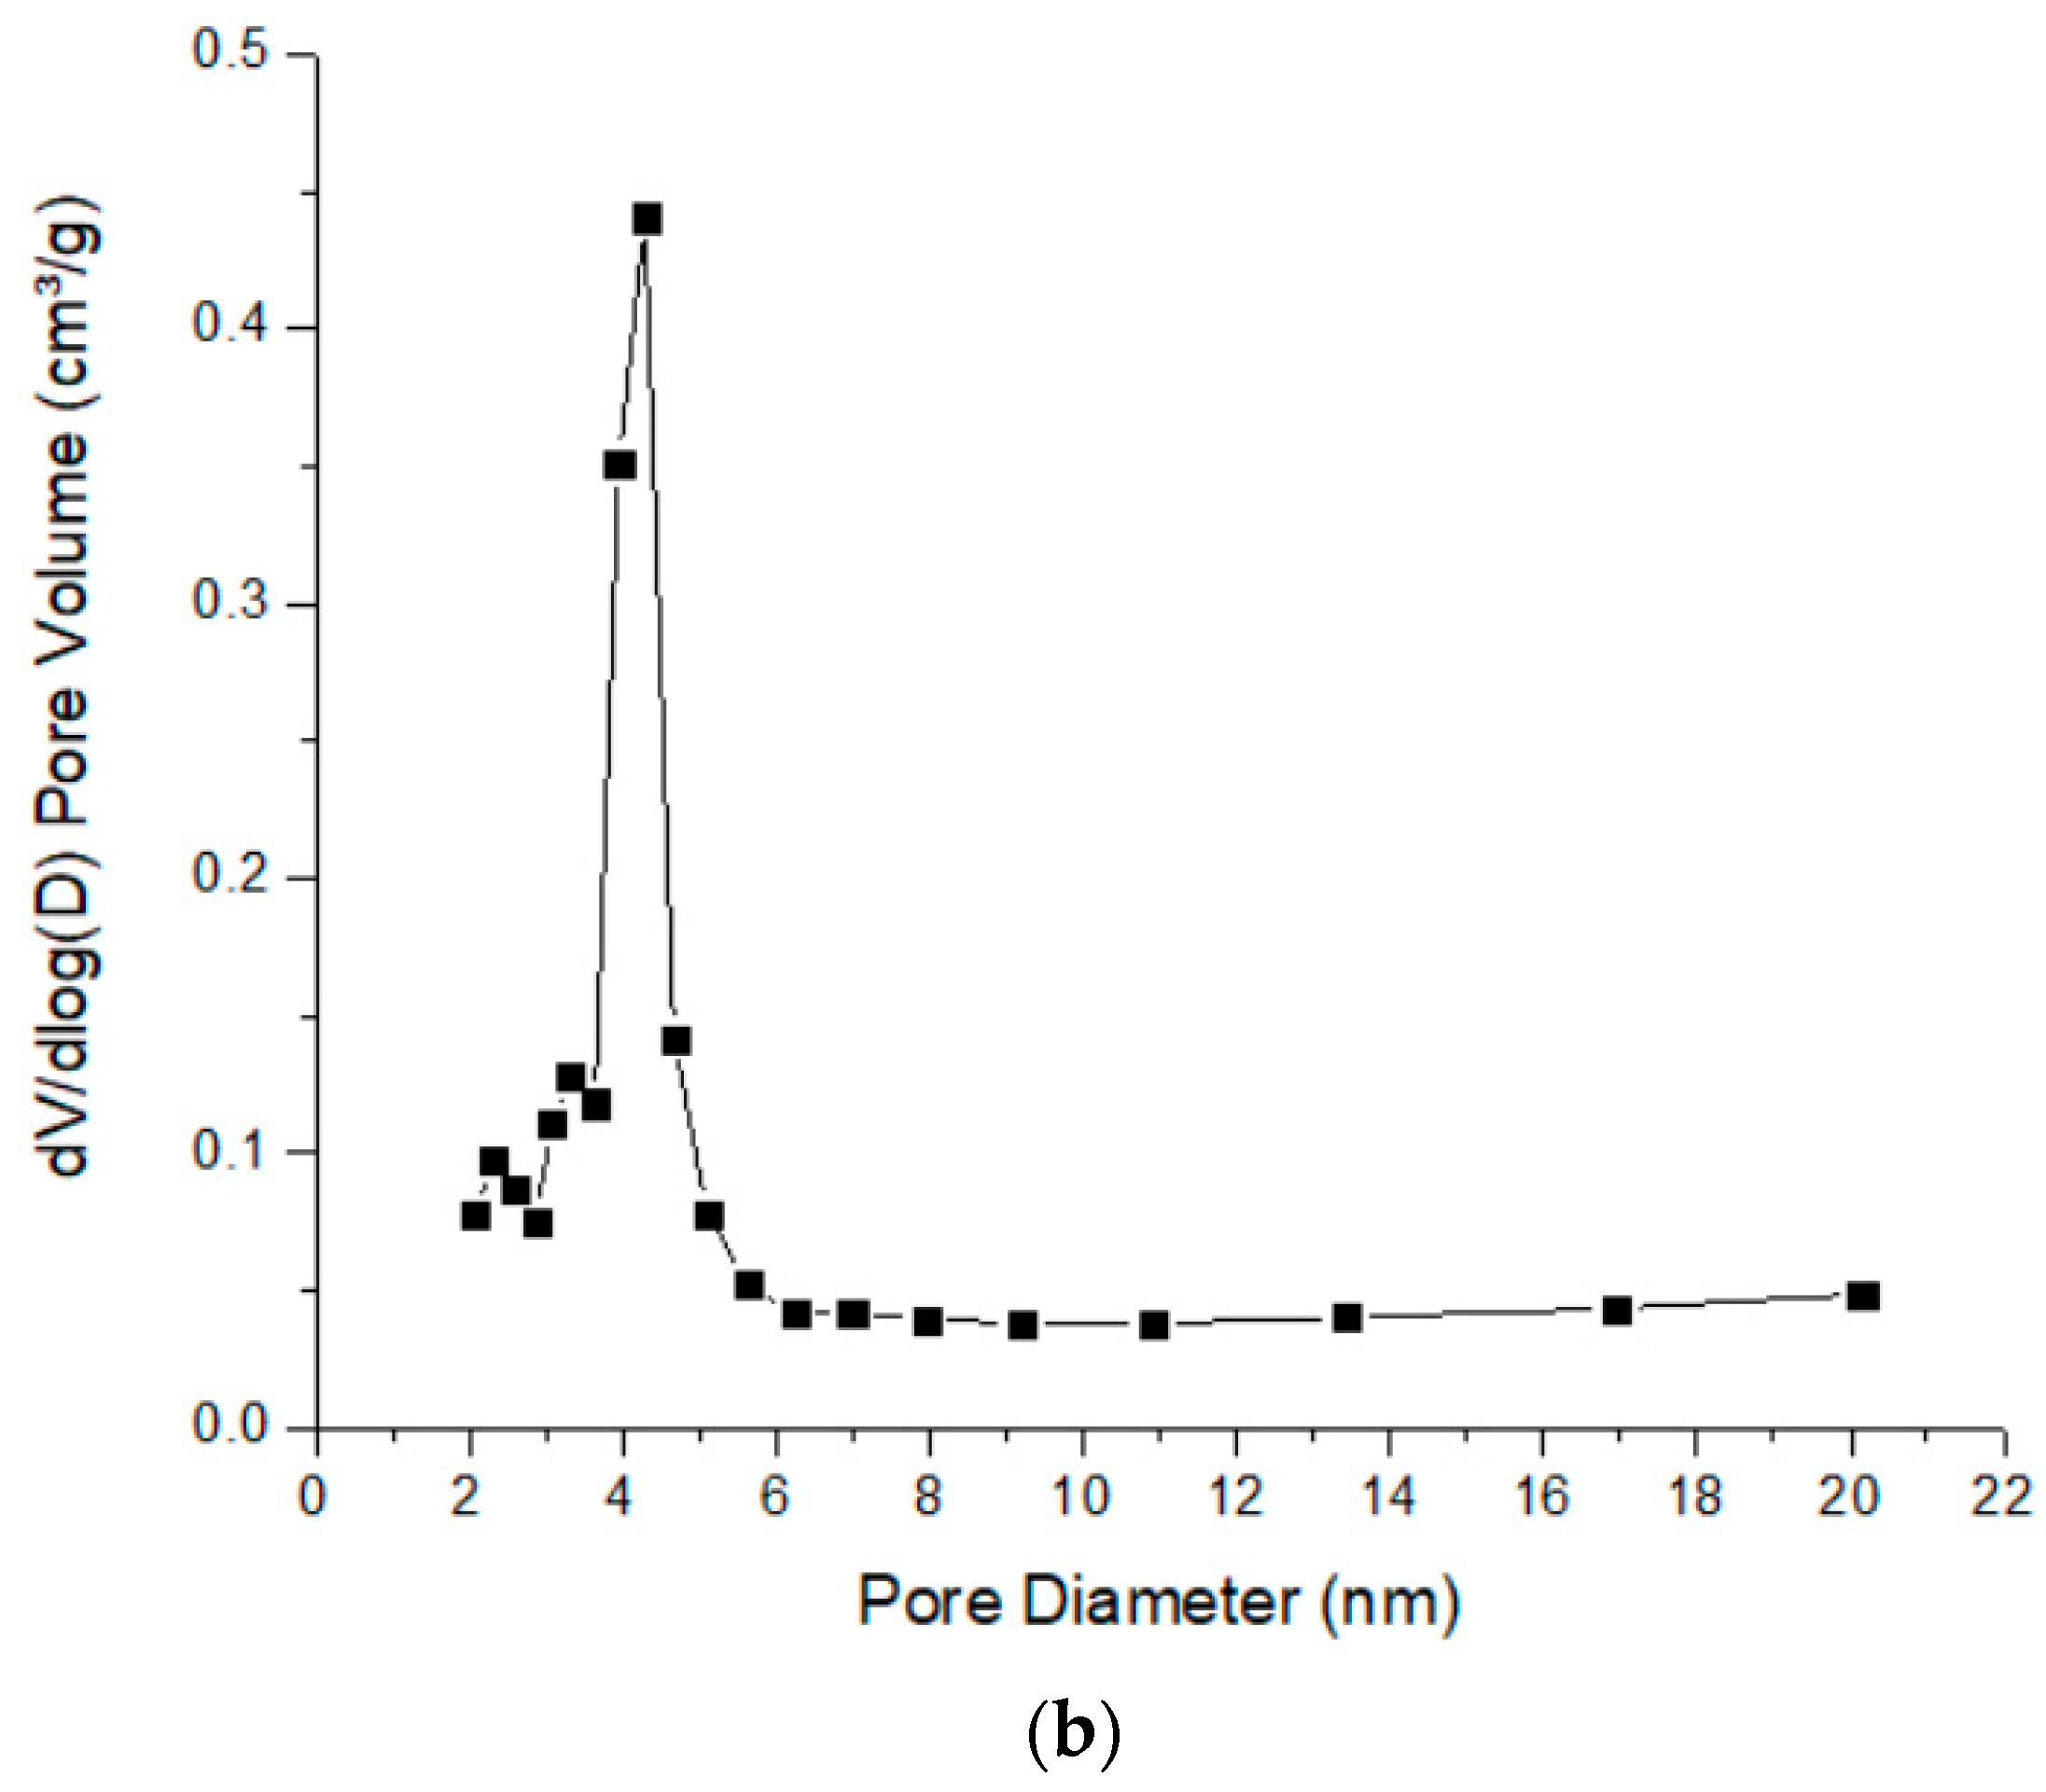
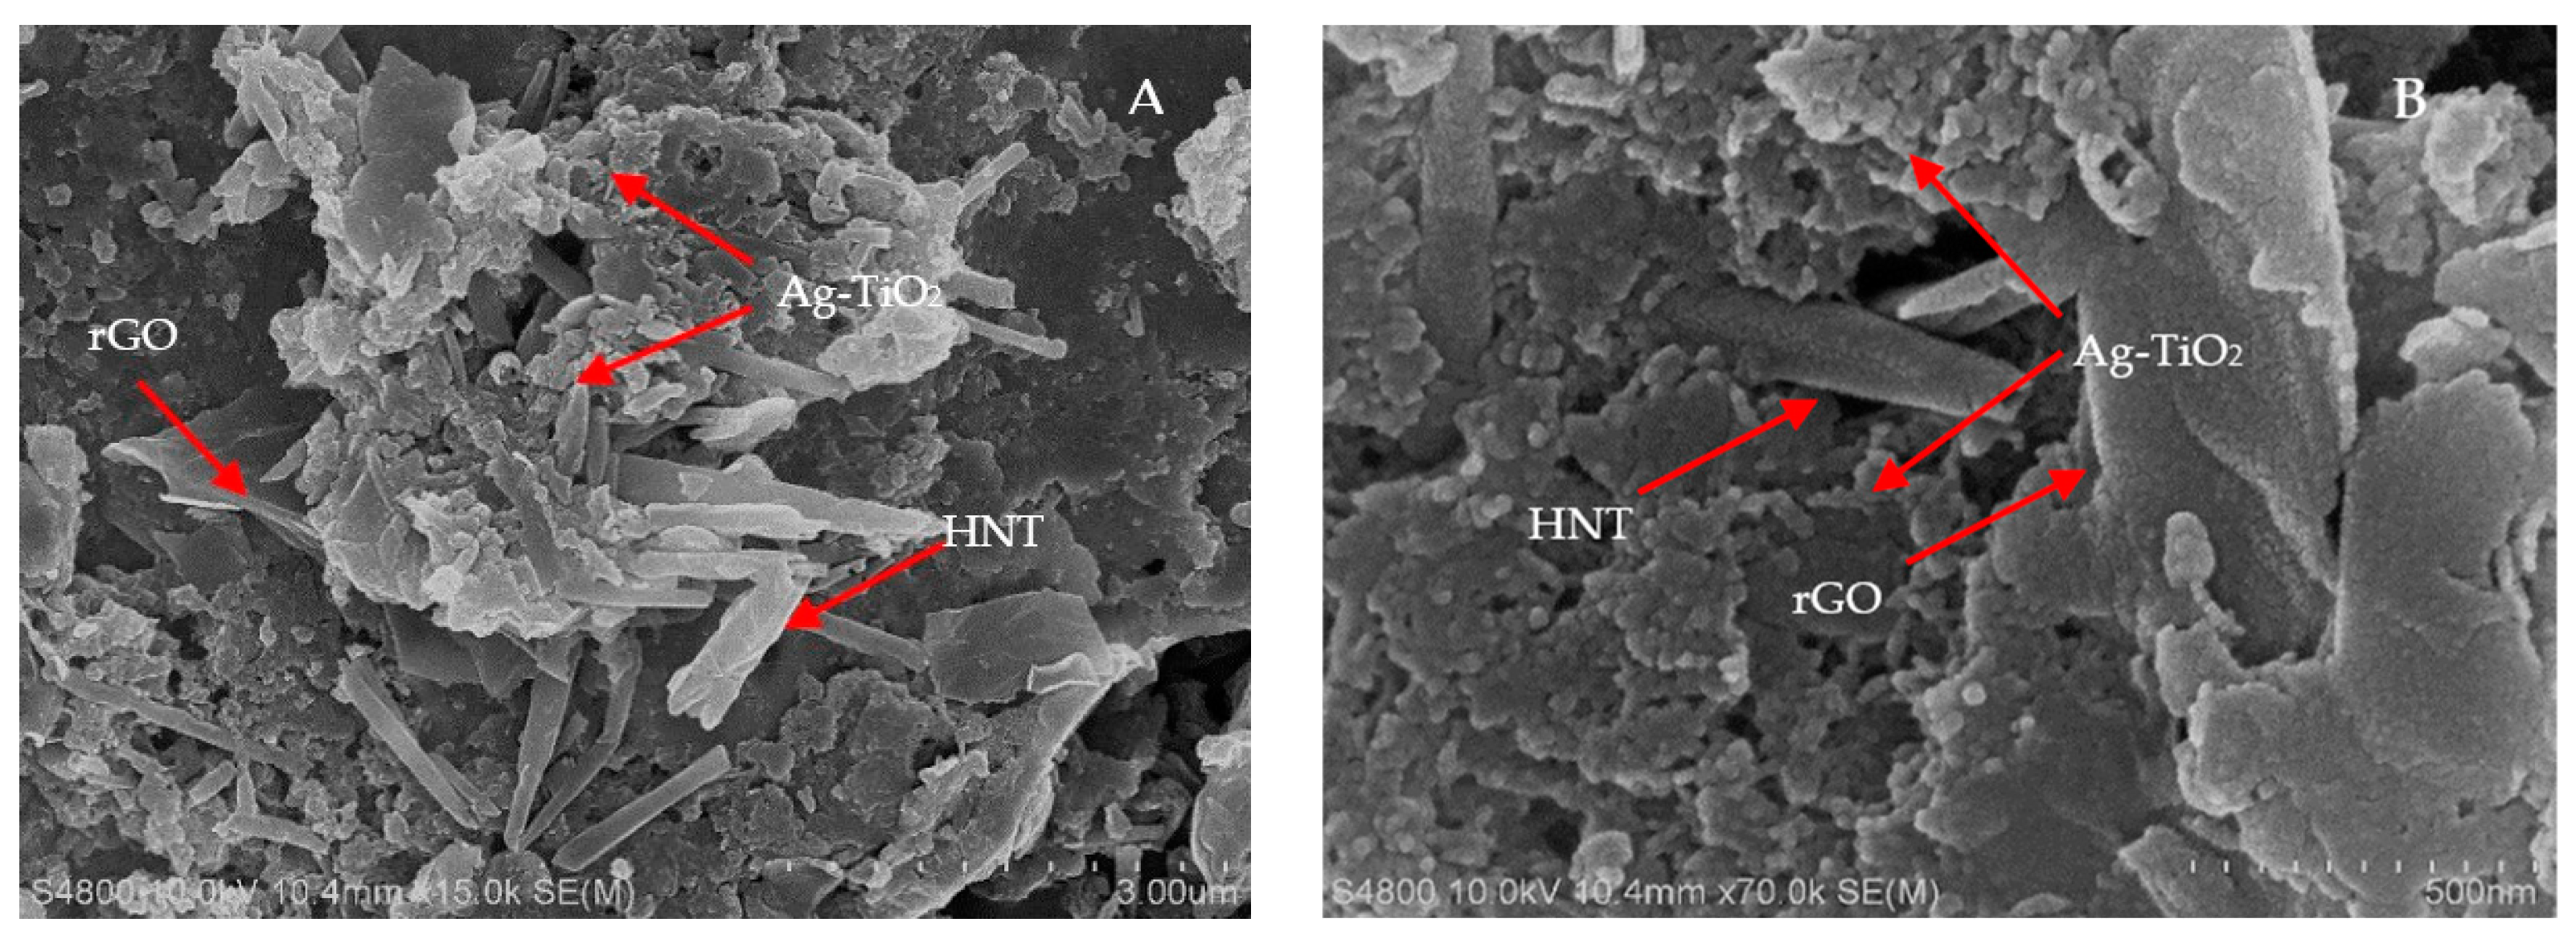
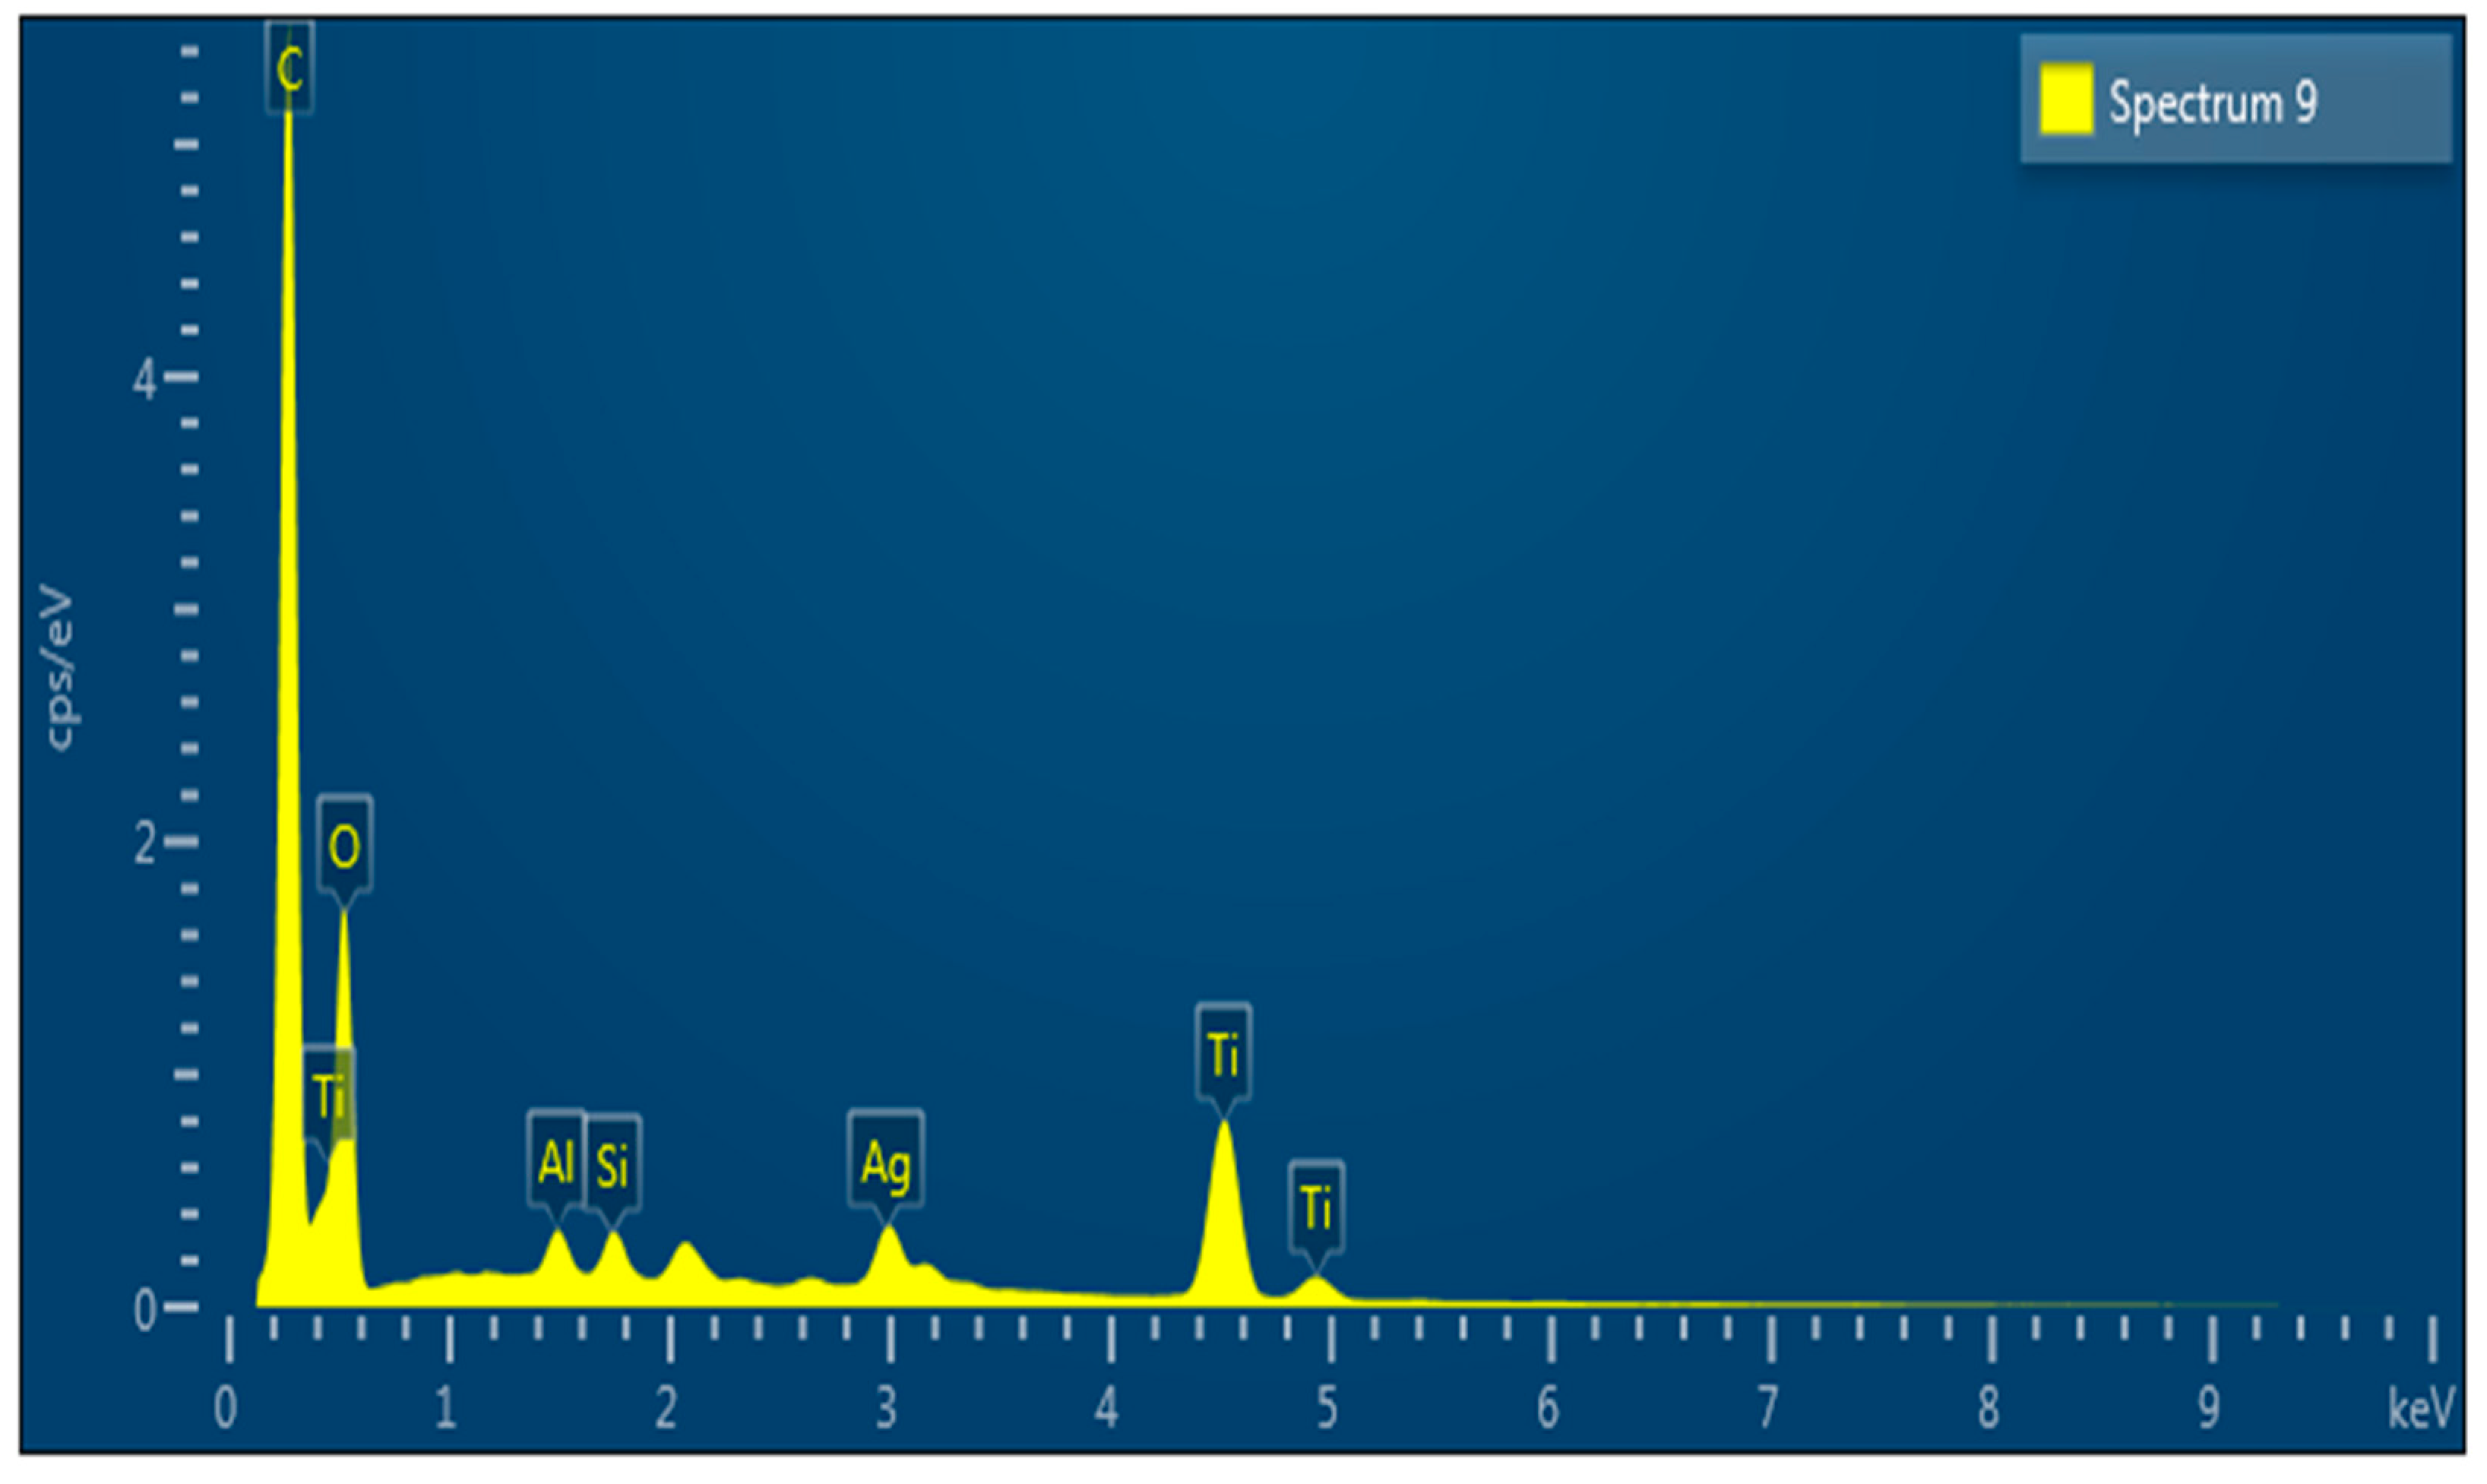
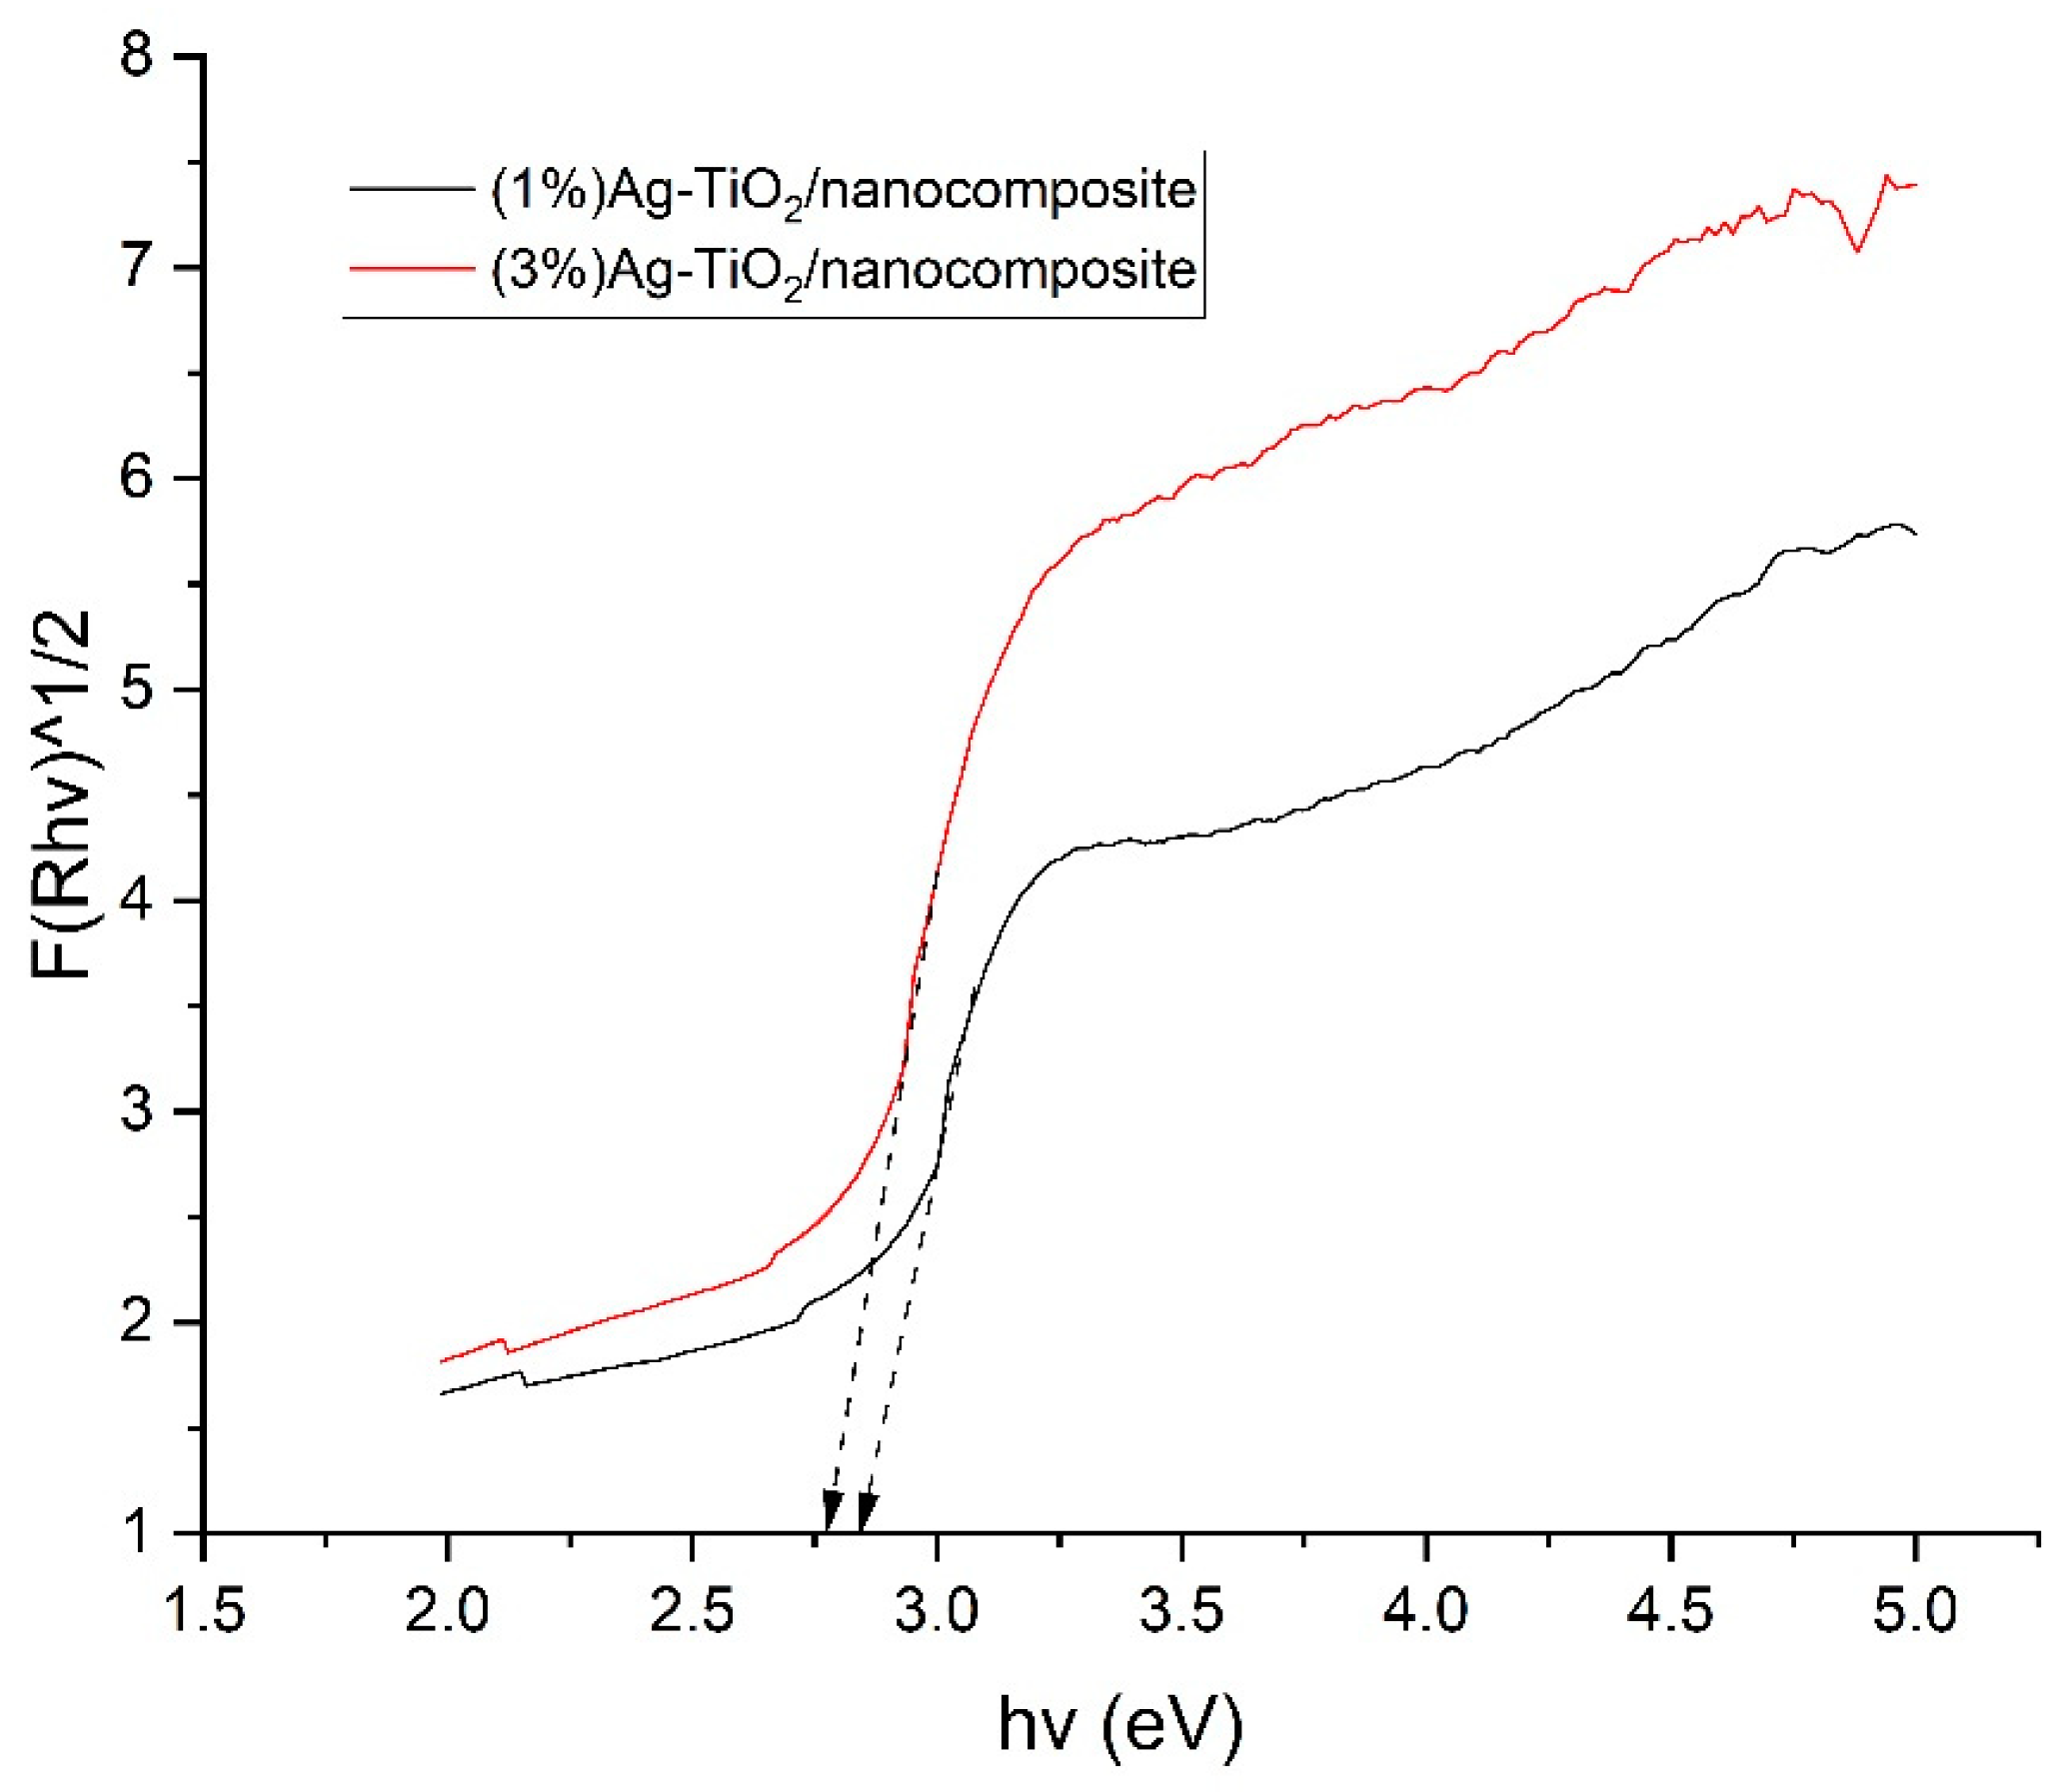
2.1. Material Characterization

Modern physicochemical techniques were used to study the surface morphology, surface area, porous properties, and structure of the catalysts.
The XRD spectrum of the catalyst in the range of 2θ = 5–80° is shown in Figure 1. The XRD results show that there are distinct HNT peaks at angles of 2θ = 12.5°, 38°, 55.0° and 62.37° (ICDD #00-060-1517) corresponding to the faces (001), (110), (211) and (220), respectively. The peaks at 24.3° and 43.6° also show the presence of rGO in rGO/HNT. The absence of a peak at 11° indicates that GO has been successfully converted to rGO. Silver nanoparticles are also clearly visible in the XRD data at diffraction angles of 2θ = 38.1°, 44.1°, 64.2° and 76.8° (JCPDS, silver file No. 04-0783), corresponding to the faces (111), (200), (220) and (311), respectively. TiO2 appears with diffraction peaks at position 2θ = 24.8°; 37.3°; 47.6°; 62.3° (JCPDS card No. 21-1272), corresponding to crystal faces (101), (004), (200), (204), representing the dominance of the anatase form [22].
In addition, FT-IR, SEM, and EDX methods were used to identify the typical bonds as well as the surface morphology and to qualitatively detect the elements present in the material.
Figure 2 shows the results of the material characterisation using the FT-IR technique. The existence of TiO2 and HNT in Ag-TiO2/rGO/HNT is demonstrated by characteristic bands at wavenumbers of 1032 cm−1 (Si-O) [23], 1008 cm−1 (Si-O-Si), 911 cm−1 (Ti-O-Si) [23], and 692 cm−1 (Al-O-Si). The absence of the bands at wavenumbers 1714 cm−1 and 1413 cm−1 (C=O) and the presence of the graphene-specific band at 1570 cm−1 prove that GO was converted to rGO throughout the synthesis process [24]. The bands at 3164 cm−1 and 1383.8 cm−1 characterise the vibrations of the group OH. The peaks at wavenumbers 535.04 cm−1 and 468.49 cm−1 correspond to the Ti-O and Ti-O-Ti bonds [25]. Finally, the band at 1116.21 cm−1 links with the stretching vibration of Ti-O-C.
The specific surface area and pore size distribution studied with the isothermal N2 adsorption technique at 77.3 K are shown in Figure 3a,b, while Figure 4 shows the images from SEM.
Using the data from BET, which can be seen in Figure 3a,b, it was found that the specific surface area of the catalyst is about 78 m2/g, and the mean pore diameter determined by the BJH technique is about 5 nm. Moreover, the N2 adsorption–desorption hysteresis of the synthesised material exhibits a shape classified by IUPAC as type IV, which further supports the average pore size of the material. Due to its excellent specific surface area and mesopore size, the synthesised catalyst is ideal for the adsorption catalysis process in the treatment of organic impurities.
It can also be seen from the images of SEM that the intercalation of nanoscale halloysite tubes between the rGO layers prevents the adhesion of these rGO layers. Furthermore, the uniform distribution of Ag-TiO2 particles on the rGO layers and the halloysite tubes can be seen in the SEM images. Based on the SEM scans, the size of the catalyst particles is estimated to be 30 to 40 nm.
The EDX technique is then used to verify the existence of elements in the sample, as shown in Figure 5. The result shows that all the components that make up the composite material are present. The silver content is about 5%, showing a slight aggregation at the site examined. This result partly reflects the successful synthesis of the catalytic materials. UV-vis diffusion spectrometry was used to estimate the band gap energy of the catalytic material. The band gap energies of the materials can be determined by expressing the correlation between [F(R)hv]2 in terms of hν.
The values of the band gap energy of the samples were determined by using the Kubelka–Munk equation:
( F ( R   ) · h ν ) 1 n = B ( h ν E g )
where α is the optical absorbance, is the energy of the photon, A is a constant, Eg is the band gap energy, n is a constant, and n = 2. The results are shown in Figure 6.
The band gap energies of the samples decrease in the following order: TiO2 (3.2 eV) > (1%)Ag-TiO2 > (3%)Ag-TiO2. As a result, the photocatalytic activity for CIP degradation is increased. Surprisingly, the (3%)Ag-TiO2 sample shows the lowest band gap energy compared to (1%)Ag-TiO2. However, the difference is not significant. This could be due to the presence of an ideal amount of Ag, which can react strongly to visible light by plasmonic action. In addition, the appropriate composition could prevent the recombination of electron/hole pairs, promoting their transfer into processes. The aggregation that prevents light absorption appears to be caused by an excessive number of silver nanoparticles.

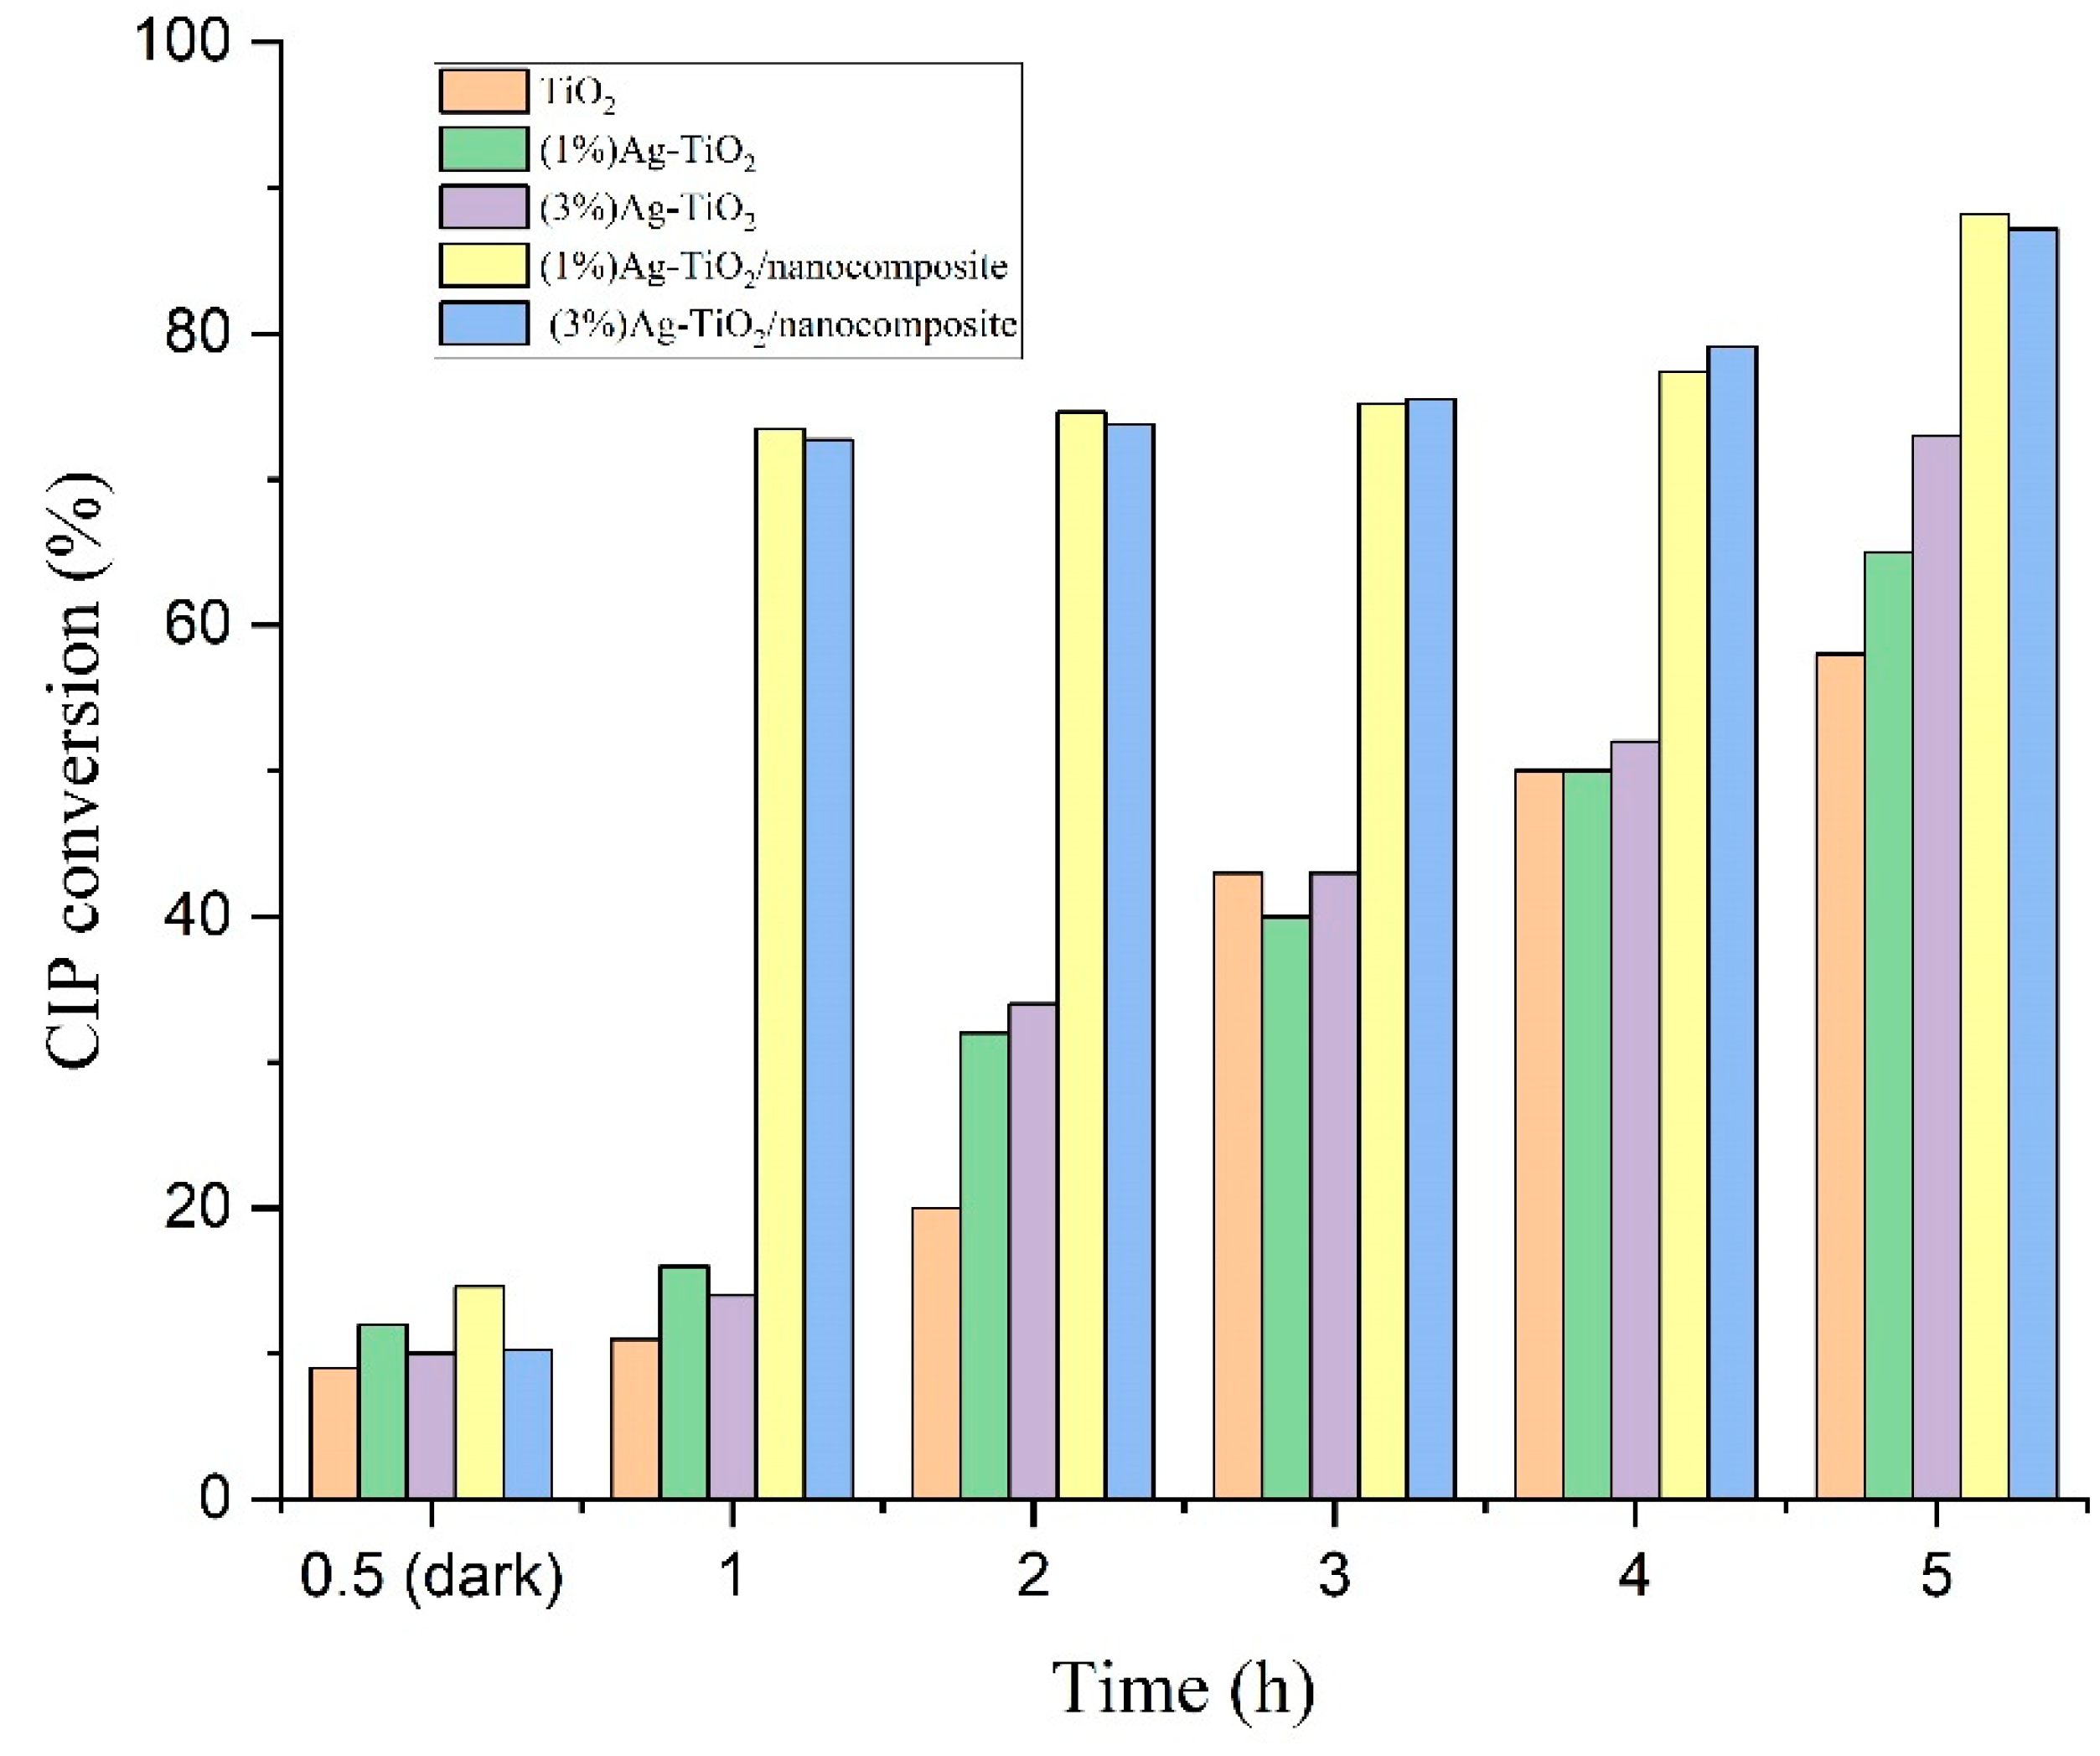
2.2. Photocatalytic Activity

The efficacy of the synthesised materials was evaluated in CIP antibiotic photodegradation, and 10 mg of catalyst was used in these experiments. Figure 7 shows a comparison of the catalytic activities of the different materials.
In general, the transformation of CIP over time is quite similar in the presence of (1%)Ag-TiO2 and (3%)Ag-TiO2. The highest conversion was recorded with (1%)Ag-TiO2 material after 5 h 89%, while the value for (3%)Ag-TiO2 is 87%. With Ag doping, the CIP conversion increases significantly. Ag doping plays a key role in controlling the selective crystallisation process for the anatase phase in the sol–gel process. This is because Ag has a higher ionic radius (1.26 Å) than Ti (0.605 Å). When doped into the TiO2 lattice, it replaces Ti4+ and causes a looser electronic cloud in TiO2. These conditions would be suitable for the formation of the anatase phase (as opposed to the fixed structure suitable for the formation of the rutile phase [26,27]. It is often believed that anatase has superior photocatalytic efficiency than rutile TiO2 [28,29,30,31]. A material with an indirect band gap allows the excited electrons to remain longer in the conduction band, making it more photoactive [32,33,34].
Moreover, the presence of Ag on the surface of TiO2 acts as electron and hole “traps”, preventing the recombination of holes and electrons and stimulating the concentration of OH groups, which in turn increases the photocatalytic activity [35,36]. With increasing Ag doping, the number of electronic traps increases and thus, the photocatalytic activity of Ag-TiO2 increases.
In addition, the effectiveness of the photochemical degradation process is increased by the dispersion of the active phase on the composite support. Due to the extremely high electron mobility of rGO, the photocatalytic activity of Ag-TiO2/rGO materials was significantly enhanced. When the electrons of TiO2 that have just migrated into the conduction band are captured by rGO and immediately migrate very fast on the rGO surface, the recombination ability with the holes on the TiO2 surface is minimal, the holes that exist independently are almost preserved, and this creates ideal conditions for these holes to form OH free radicals. Similarly, the presence of silver on the TiO2 surface inhibits the probable recombination of holes and electrons, which leads to an increase in the concentration of •OH and increases the photocatalytic activity.

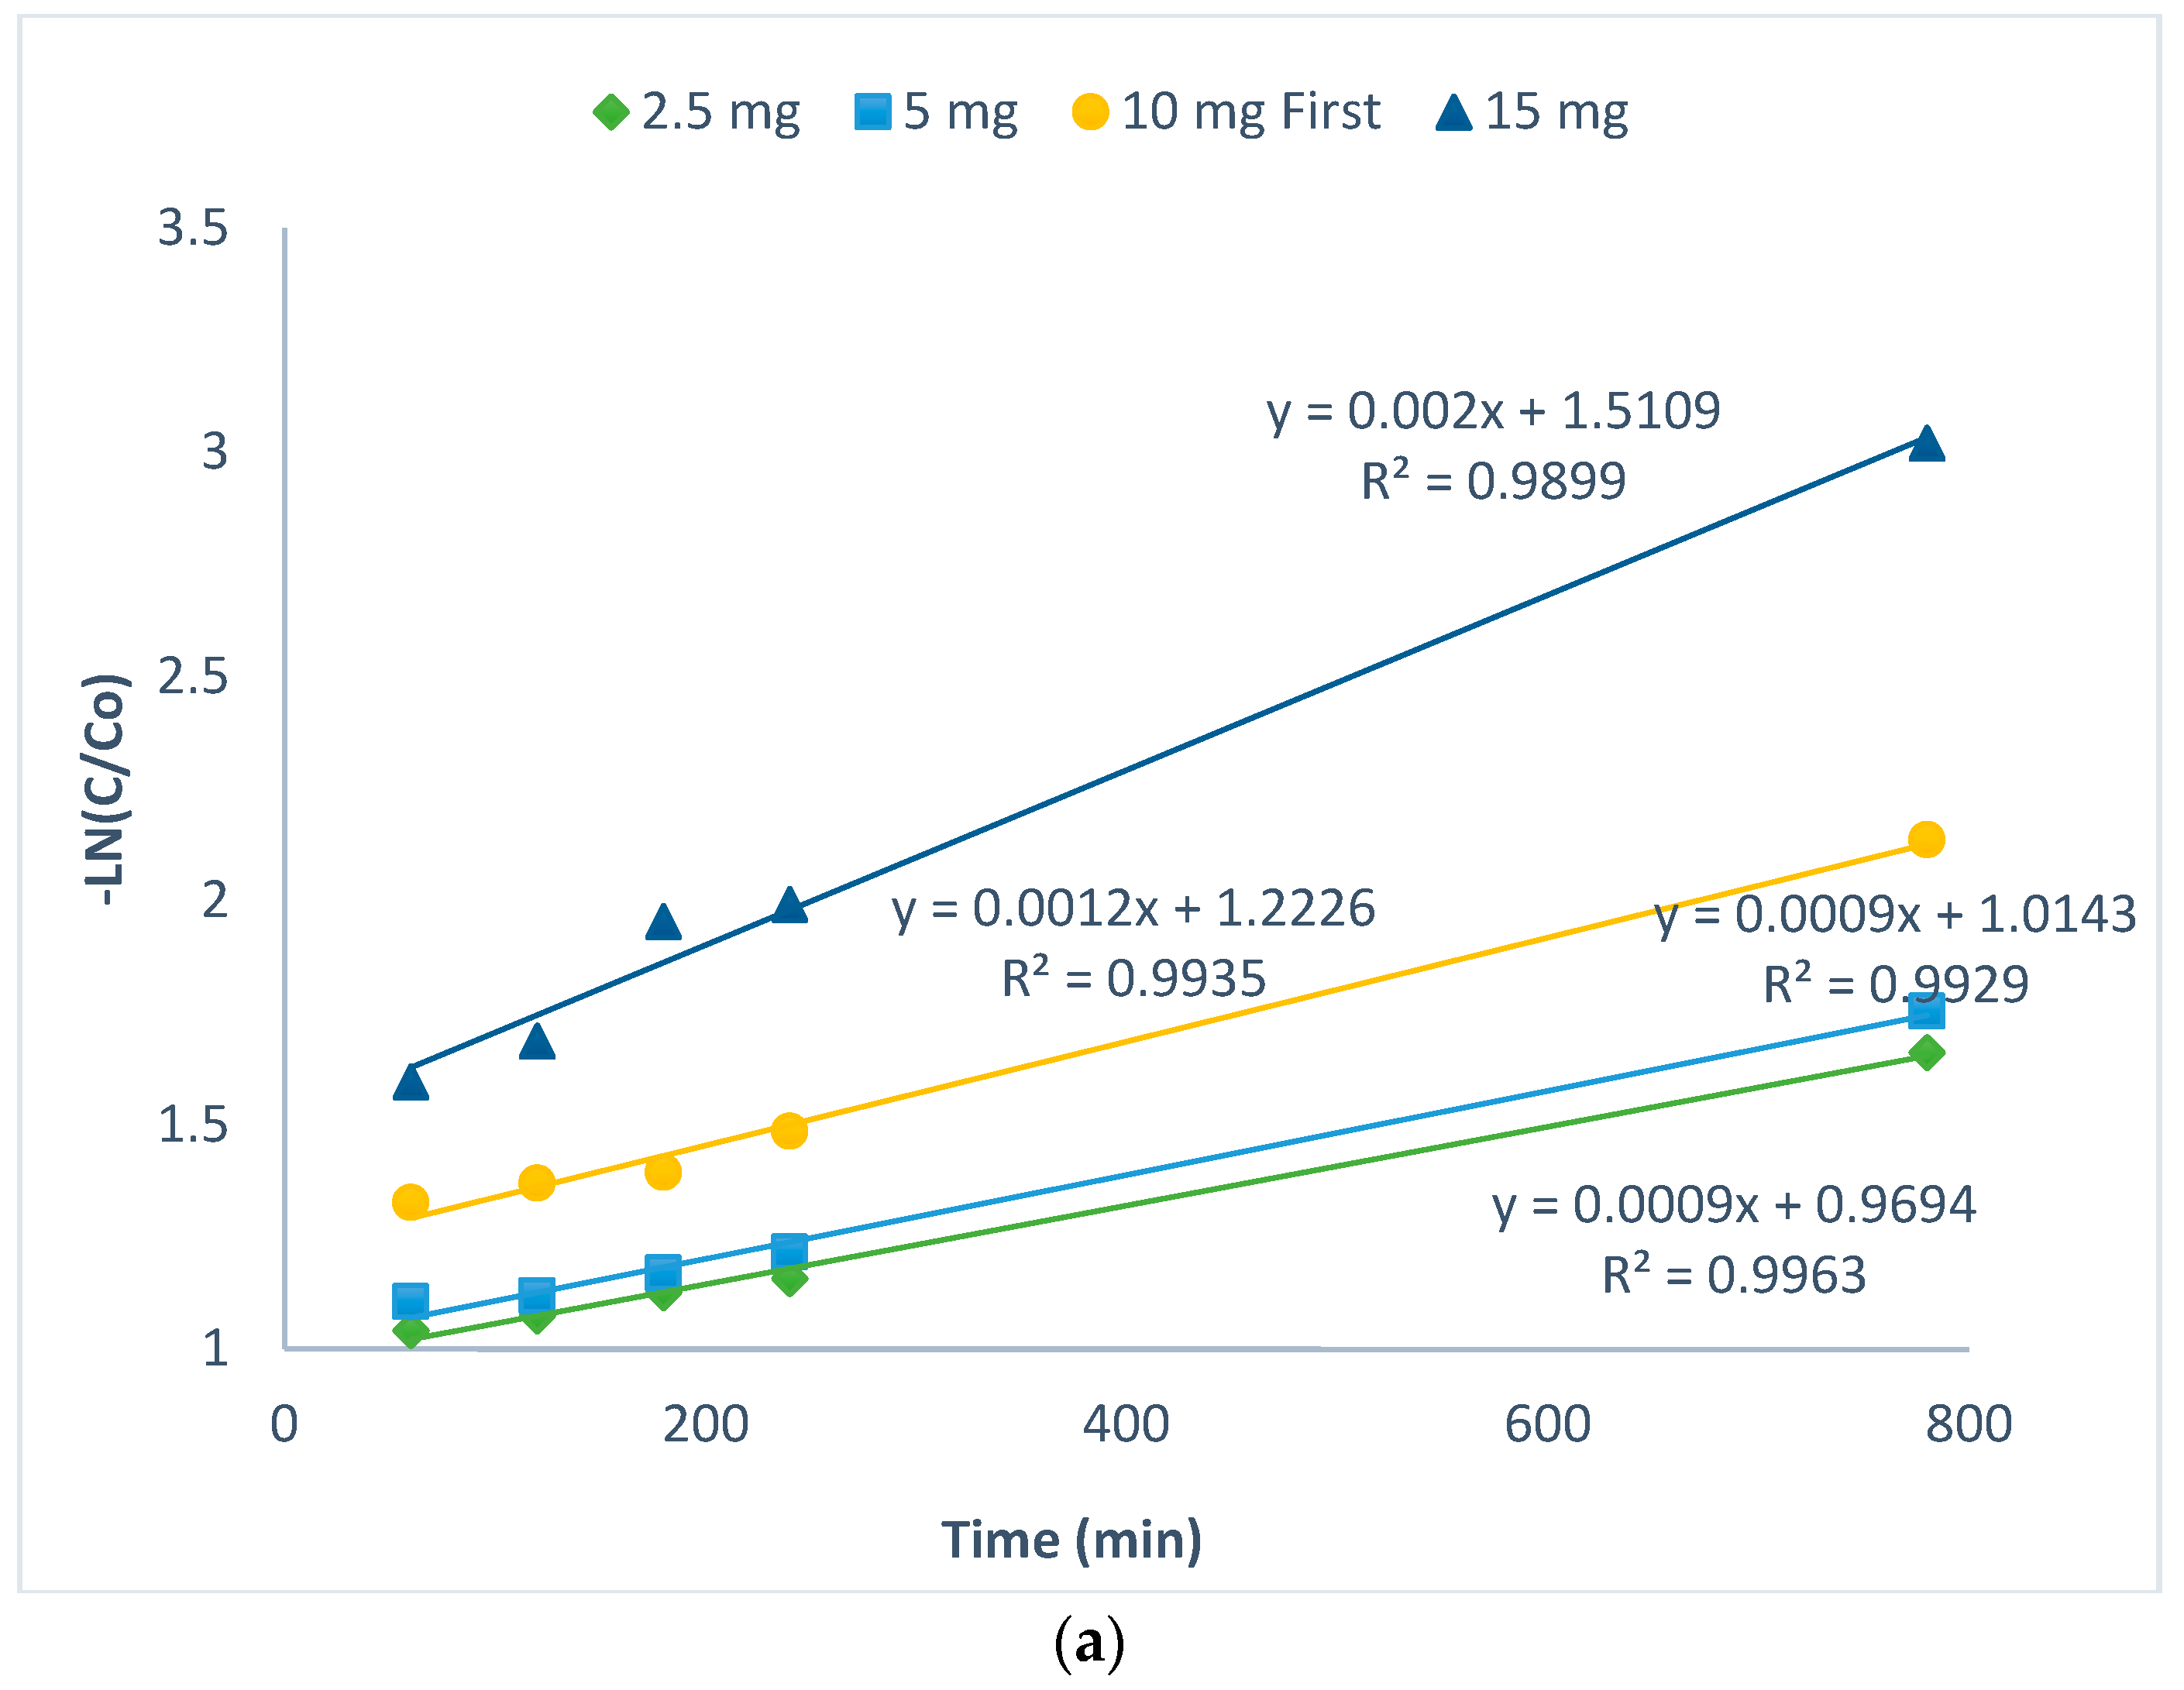
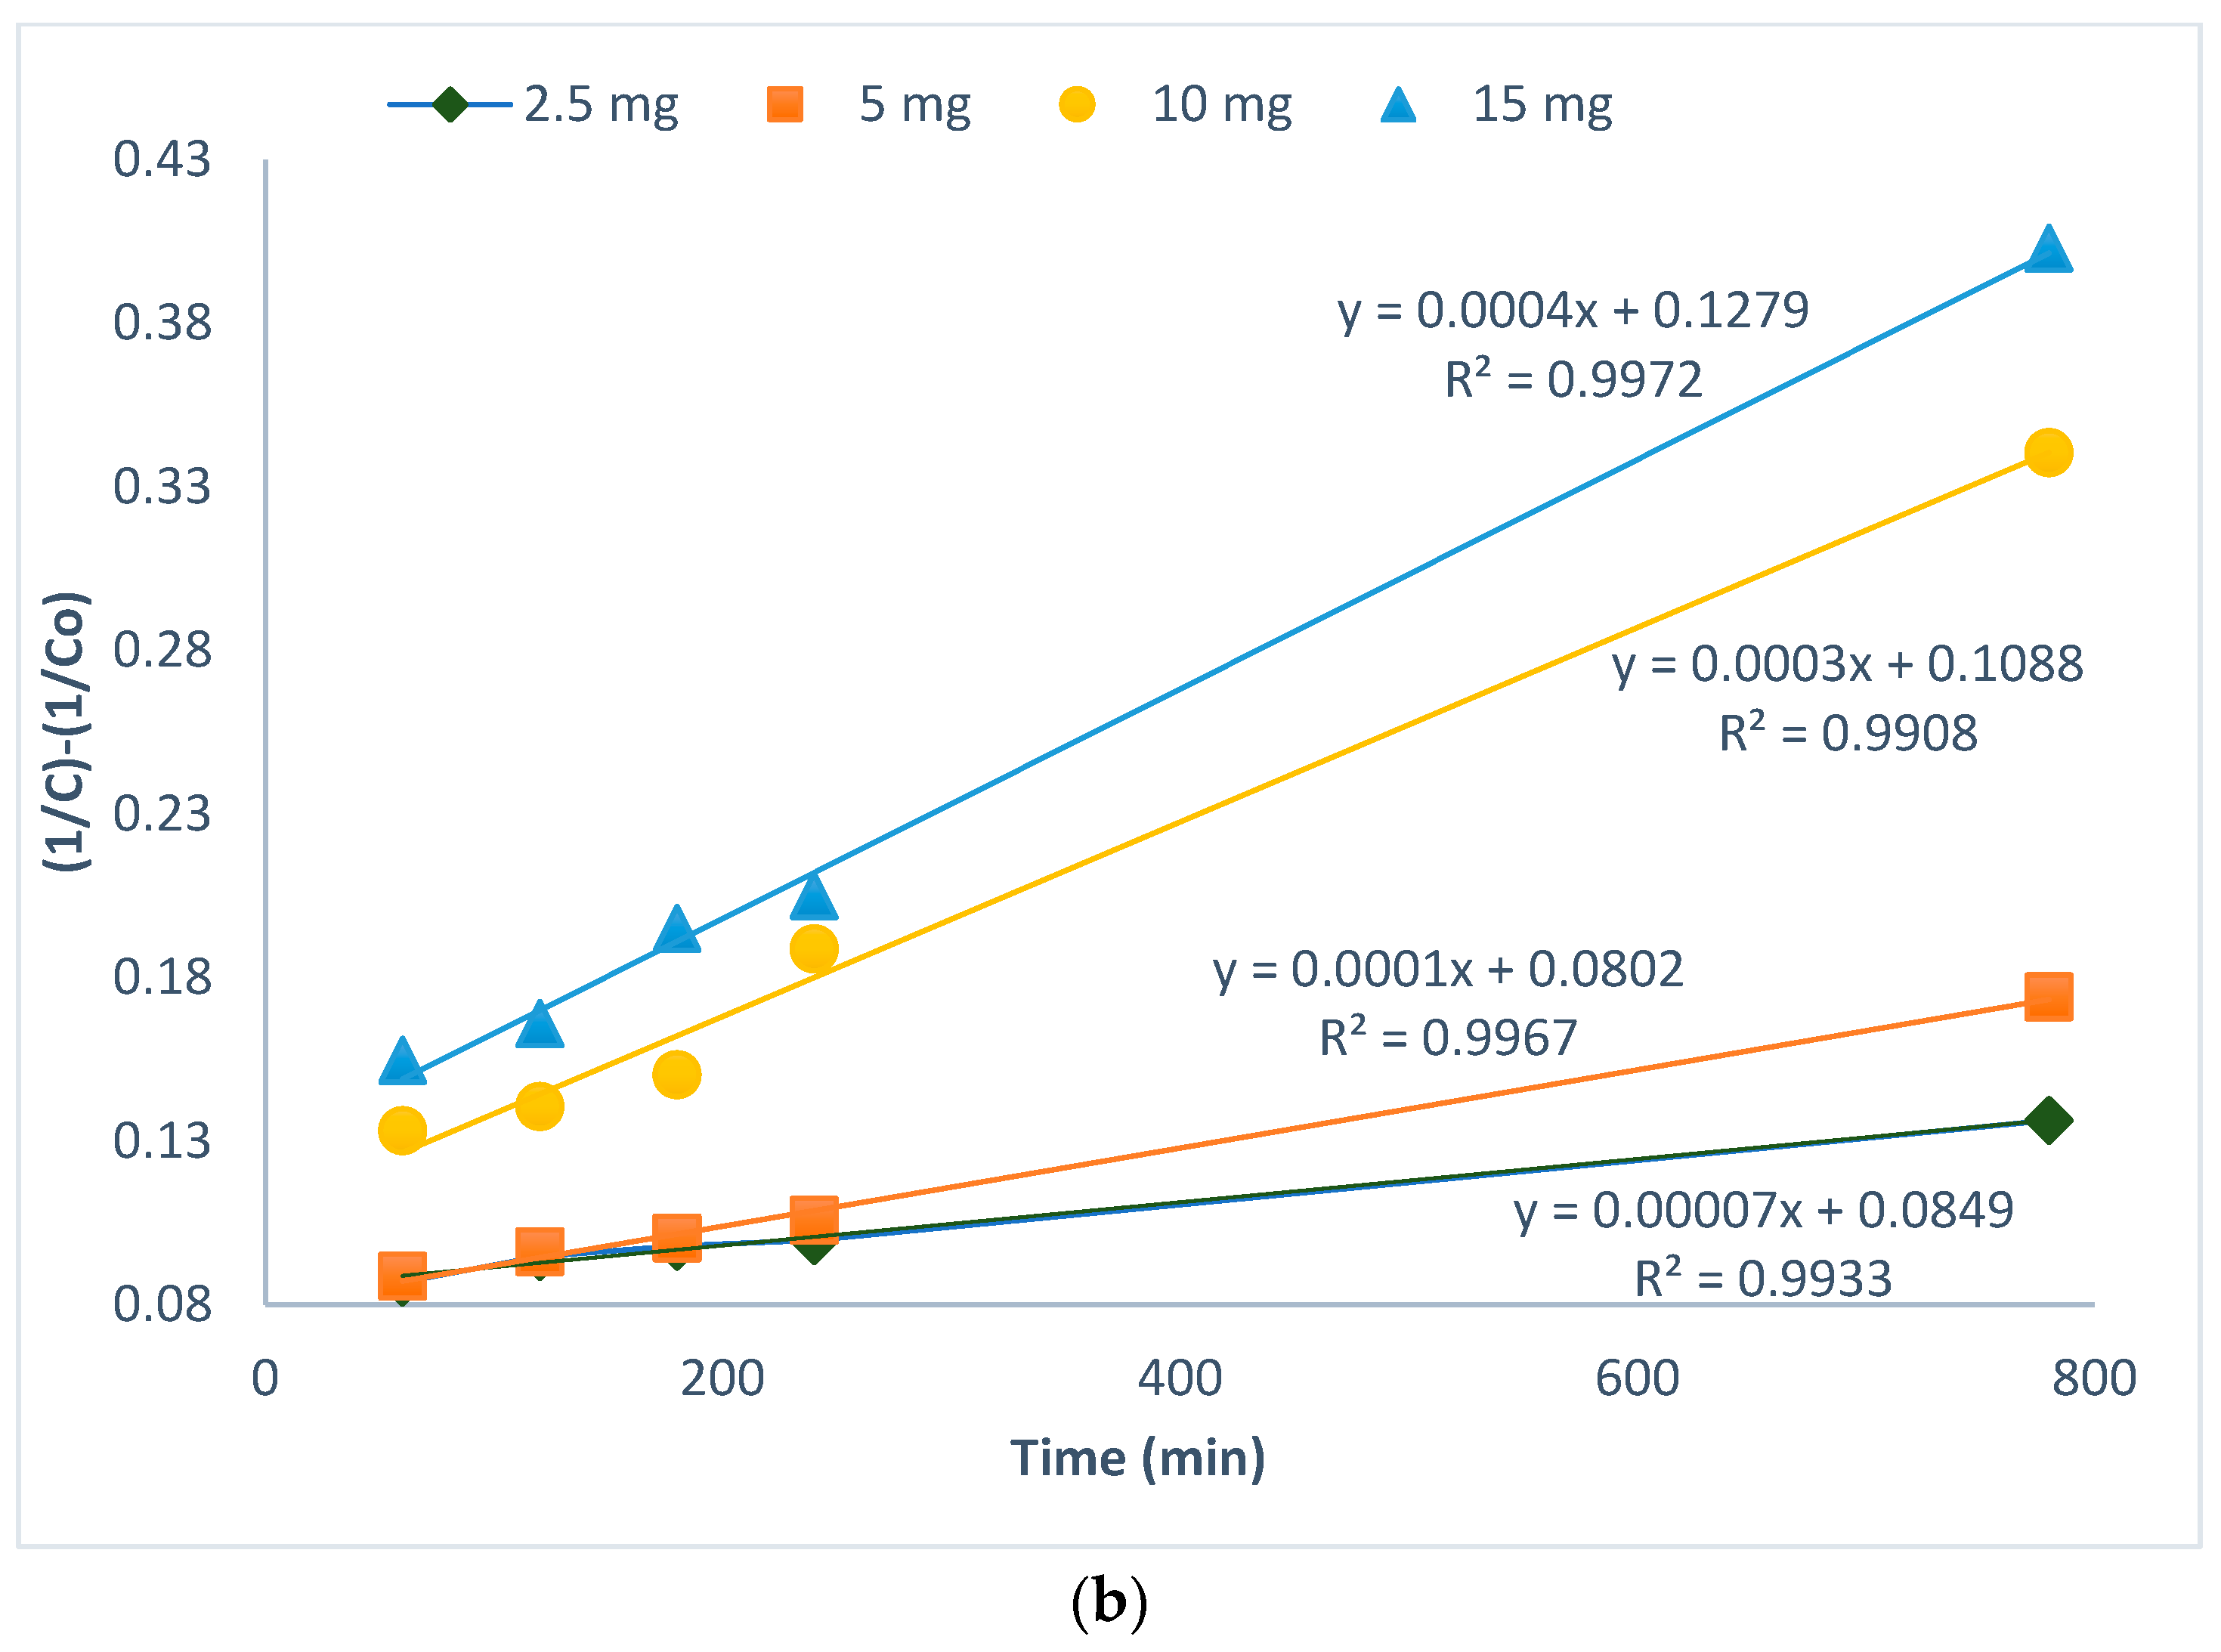
2.3. Kinetics of CIP Photodegradation

The kinetics of the degradation of ciprofloxacin over the selected catalyst was estimated using a pseudo-first-order model expressed by the following Equation (1):
ln (C/C0) = −kt
where C0 is the initial concentration of ciprofloxacin, C is the ciprofloxacin concentration after a certain reaction time, k is the reaction rate constant, and t is the time of the reaction. According to this model, the reaction rate constant can be determined by plotting [−ln (C/C0)] against t, where the slope of the line indicates the value of k. The estimated reaction rates for (1%)Ag-TiO2/rGO/HNT are shown in Figure 8a.
As can be seen, the kinetics of the photocatalytic degradation of CIP on (3%)Ag-TiO2/rGO/HNT follows the first-order model. This assumes that the rate of absorption of the pollutant with time is directly proportional to the difference between the saturated concentration and the amount of adsorbent, which is true for the initial phase of an adsorption process. Thus, this step is crucial for the speed of the reaction.
For the kinetics of CIP degradation involving (3%)Ag-TiO2/rGO/HNT, the results are shown in Figure 8b, which follows the pseudo-second-order.
(1%)Ag-TiO2/rGO/HNT degrades CIP more effectively than (3%)Ag-TiO2/rGO/HNT. According to the theory that chemical sorption is the rate-limiting phase, the pseudo-second-order predicts the behaviour over the whole adsorption range. In this scenario, the adsorption rate is determined by the adsorption capacity and not by the adsorbate concentration [37]. In this context, the amount of Ag and the aggregation of the active phase on the support surface have a considerable influence on the kinetics of CIP degradation.
The number of Ag nanoparticles doped with TiO2/rGO/HNT is the key factor for CIP removal efficiency. (3%)Ag-TiO2 has an excessive amount of Ag nanoparticles, which allows the Ag ions to occupy surface active sites and aggregate them, which can inhibit light absorption and create a centre for electron/hole pair recombination. This reduces light absorption, which also affects the ability of CIP to degrade. Furthermore, in all cases, better adsorption was obtained by the (1%)Ag sample, as shown by the 30 min adsorption time in the dark. This means that the presence of more nanosilver could affect the adsorption capacity and make chemisorption more important. If this theory is complemented with the finding that •OH radicals contribute significantly to CIP degradation (which can be demonstrated by scavenger tests in the next part), it can be concluded that the lower the efficiency of pollutant adsorption and photon absorption, the more H2O2 is involved in the reaction to compensate for the lack of photoexcited •OH radicals. Table 1 shows the agreement of the experimental data with the second-order kinetic model.

2.4. Effect of pH

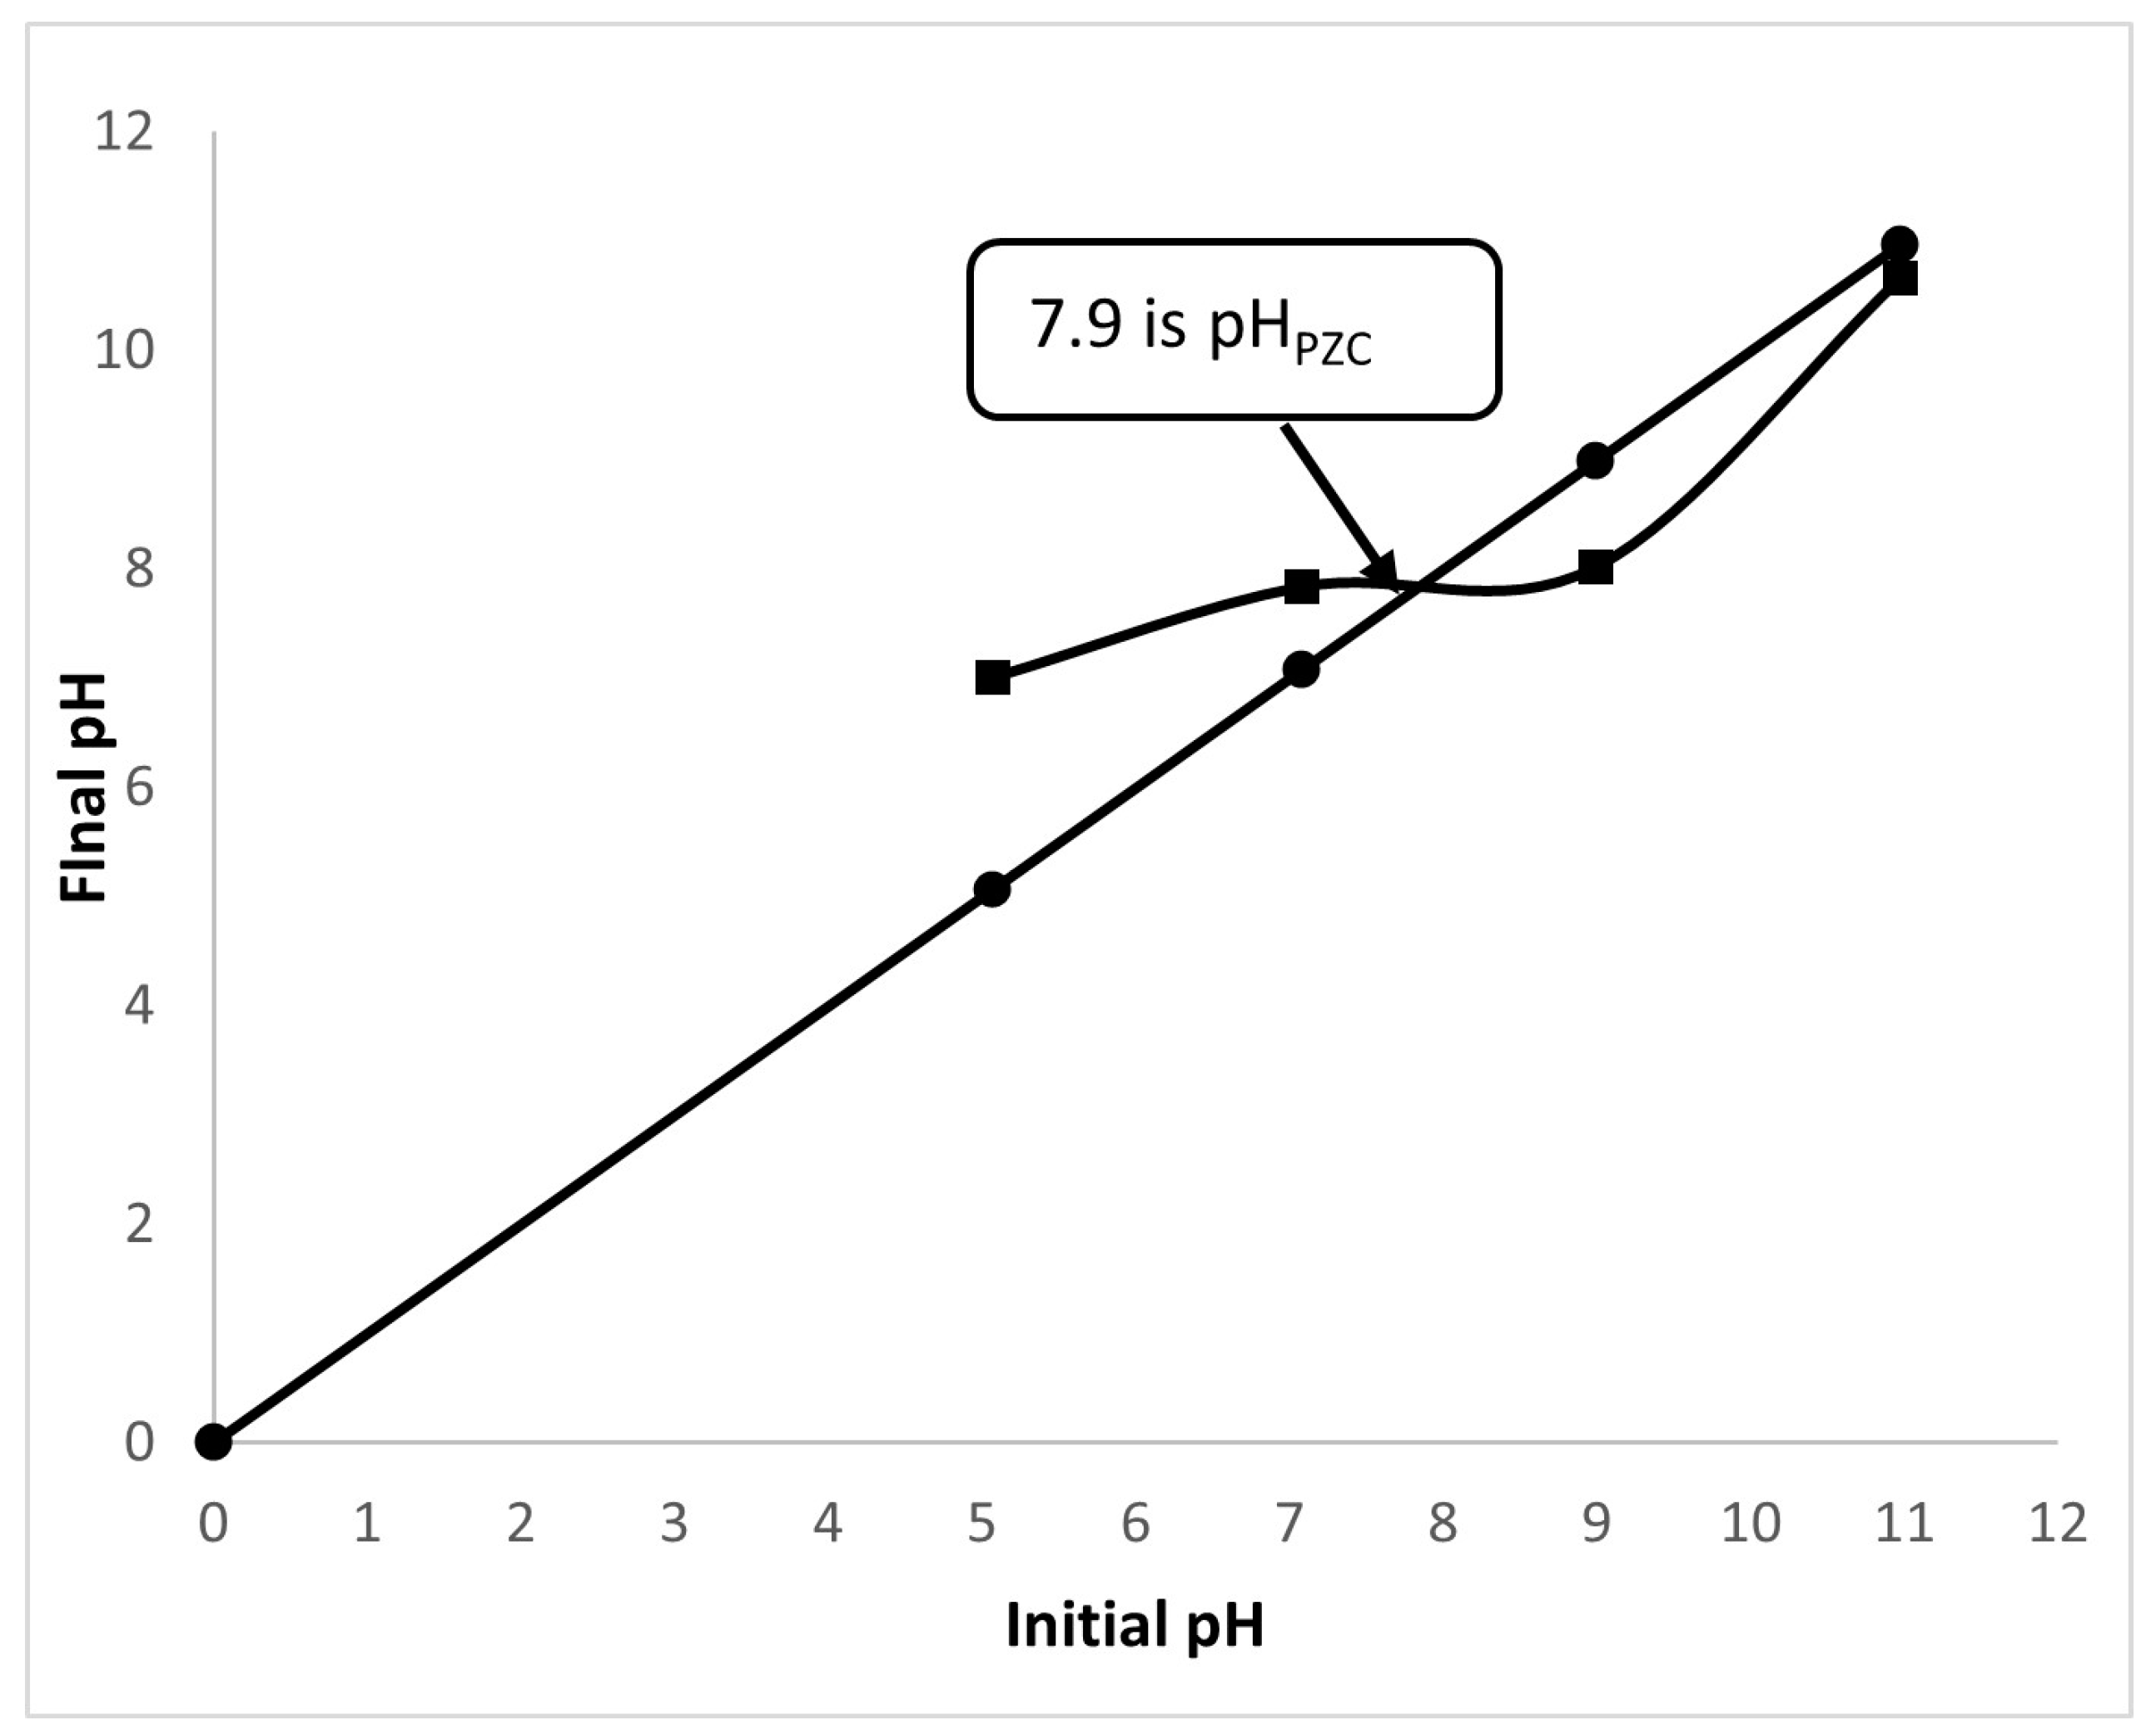
2.4.1. Point of Zero Charge (pHPZC) of Ag-TiO2/rGO/HNT

In this study, the point of zero charge for the Ag-TiO2/rGO/HNT material was found using the drift approach and four initial pH values (5, 7, 9 and 11). Table 2 and Figure 9 show the results.
As shown in Table 2 and Figure 10, the point of zero charge of the Ag-TiO2/rGO/HNT material is 7.9. Below this value (pH < 7.9), the surface is positively charged; above this value (pH > 7.9), it is negatively charged. The surface of the adsorbent is positively charged when the pH is lower than pHPZC, which promotes the adsorption of anions. On the other hand, the surface of the adsorbent is negatively charged when the pH is higher than pHPZC, which facilitates the adsorption of cations.

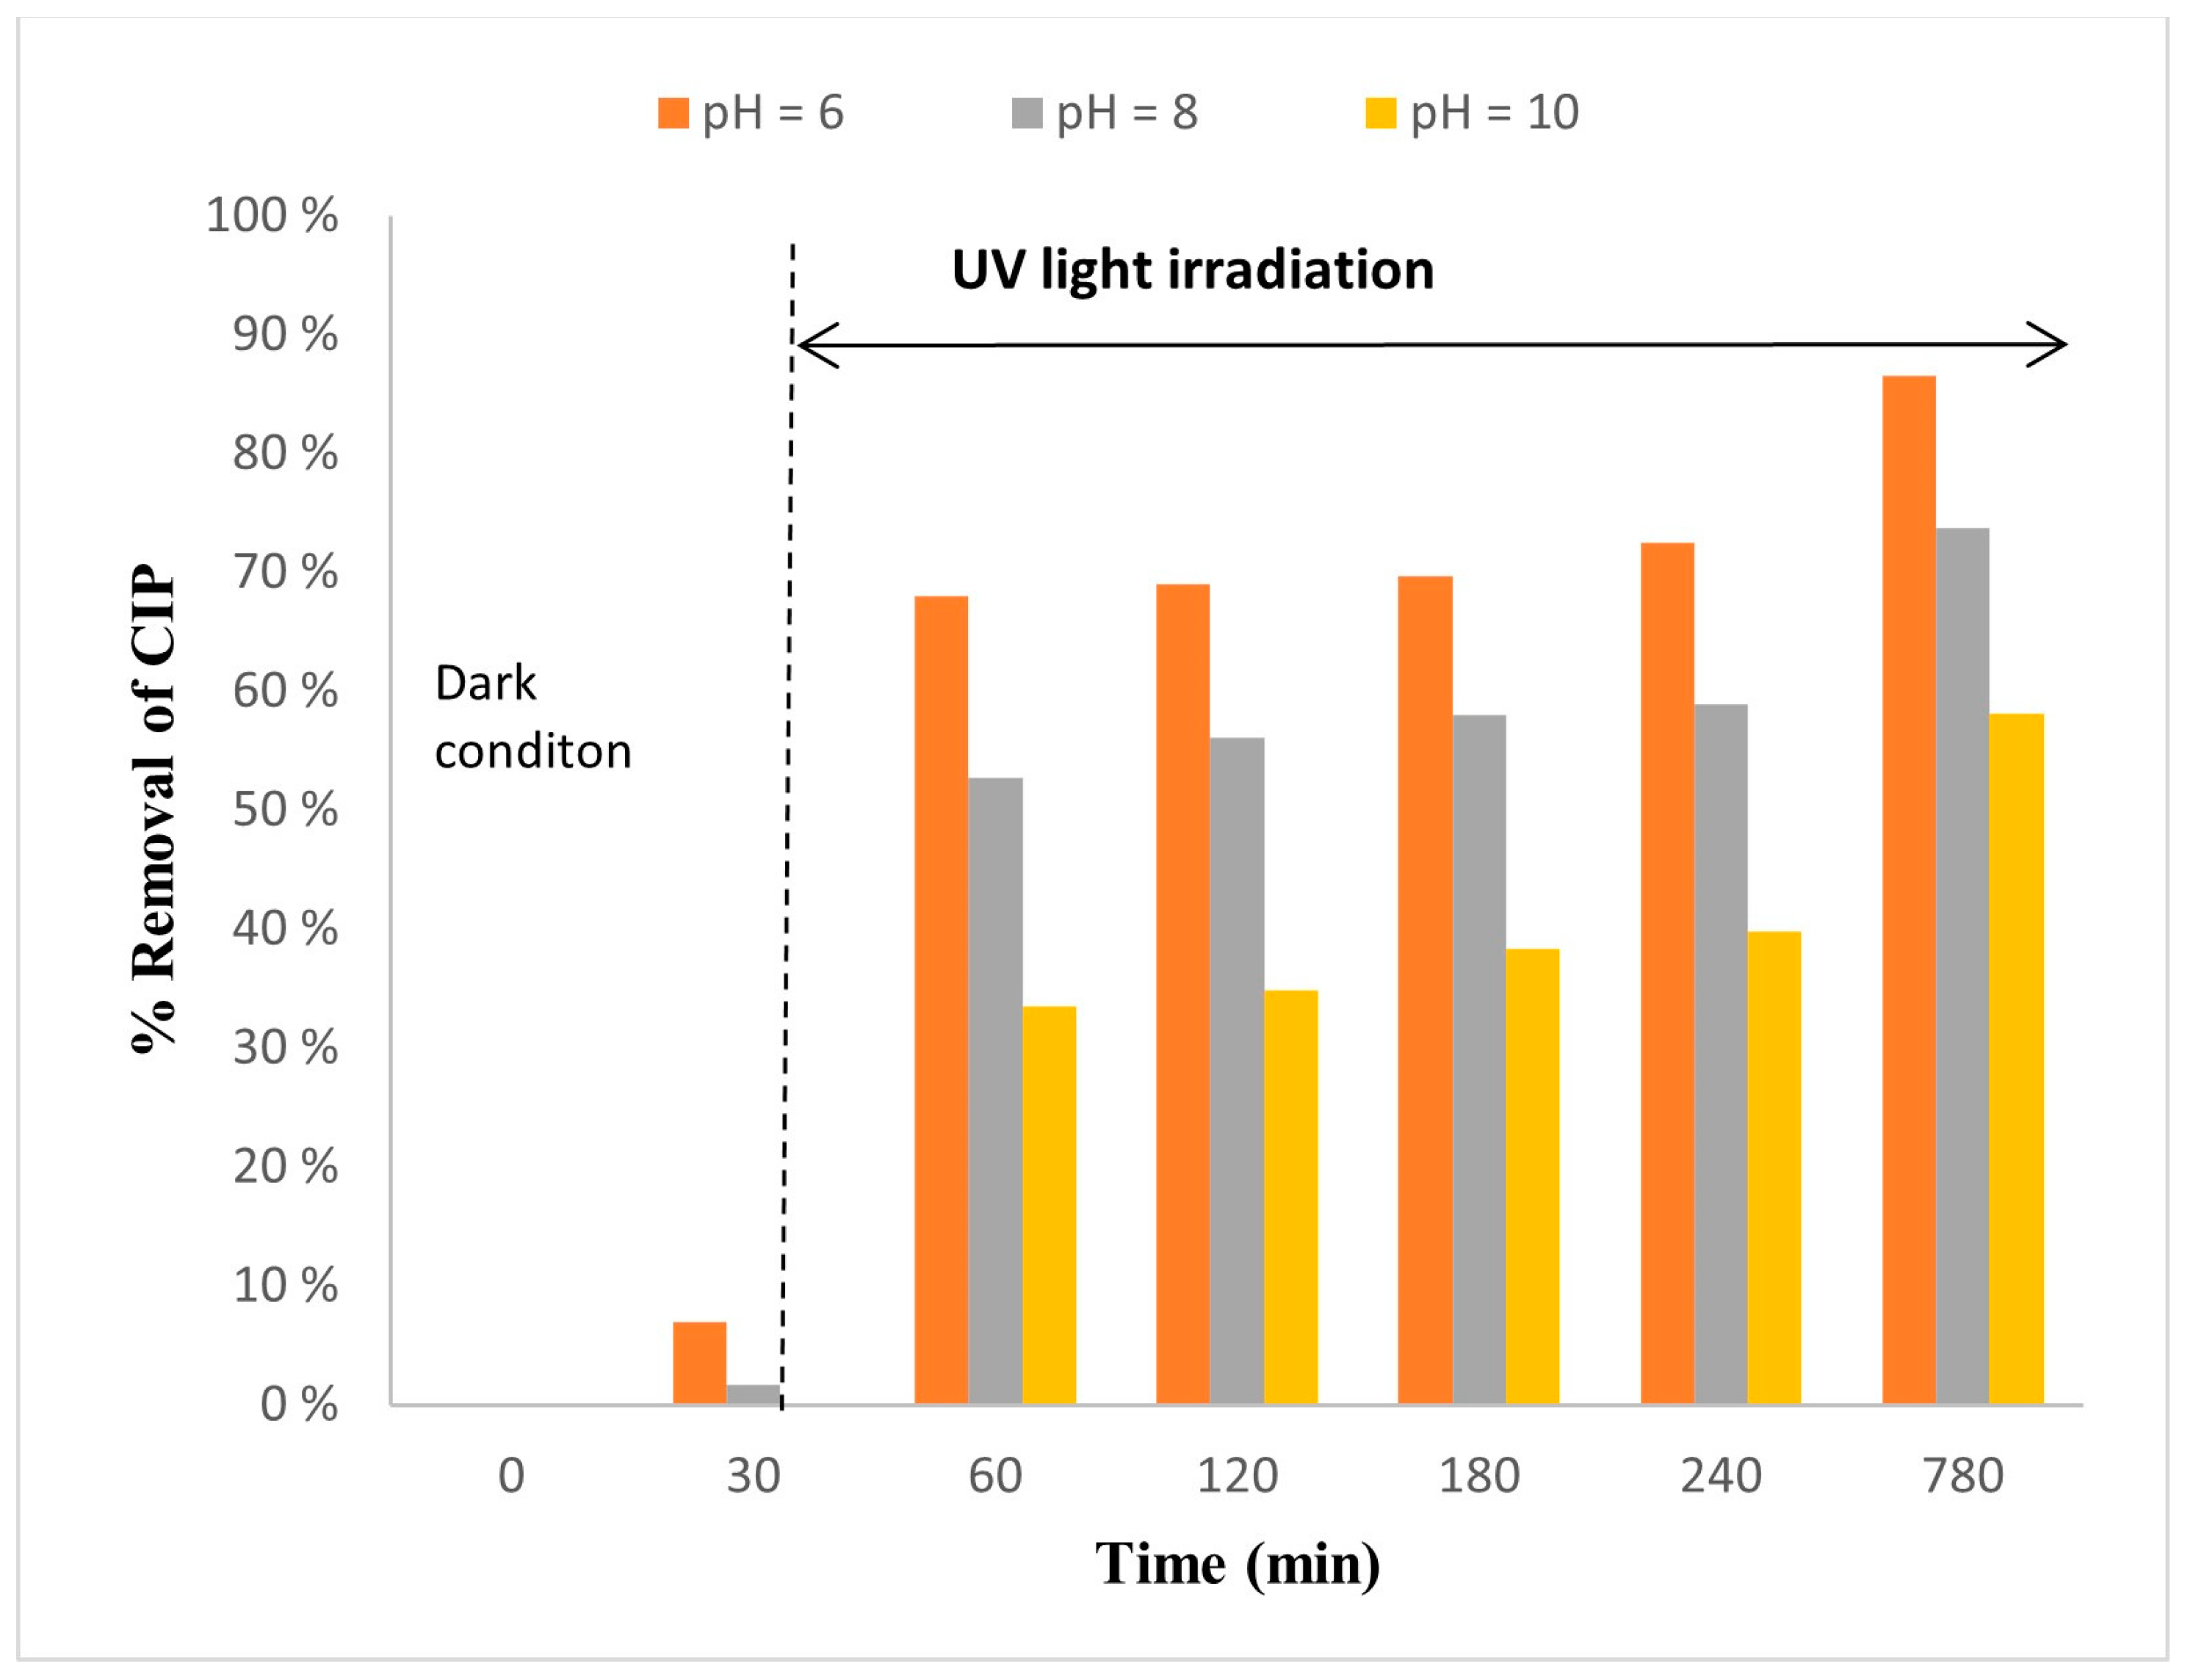
2.4.2. The Influence of pH

The efficiency of CIP removal by Ag-TiO2/rGO/HNT at three pH values 6, 8, and 10 was studied to better understand the effects of pH. The studies were conducted in 50 mL of a 20-ppm CIP solution containing 0.5 mL of H2O2 (30%) and 10 mg of (1%)Ag-TiO2/rGO/HNT under normal conditions, and the results are shown in Figure 10.
In the pH range studied, CIP was degraded with an efficiency of 87% at pH = 6, 74% at pH = 8, and 58% at pH = 10. Figure 10 shows that the maximum CIP degradation occurs at pH = 6.
CIP has an amphoteric character, which is due to the bicyclic aromatic ring skeleton with a carboxylic acid group (C-3, pKa1 of 5.76 ± 0.15), a keto group and a basic amino group in the piperazine ring (C-7, pKa2 of 8.68 ± 0.11) [38]. Therefore, depending on the pH setting, CIP can assume several ionic forms, each with different physicochemical properties (such as solubility and lipophilicity). If the pH of the solution is below 5.76, the cationic form CIP (+), which is formed by the protonation of the amino group in the piperazine fragment, predominates. The anionic form CIP (−), formed by the loss of a proton from the carboxyl group, often occurs when the pH of the solution is greater than 8.68. When the solution pH is between 5.76 and 8.68, the zwitterionic form CIP (+/−) is the predominant species. The neutral form centred at pH 7.22, which is the point of zero charge of CIP.
When the charges of the photocatalyst and CIP are opposite to each other, this is the best condition for CIP degradation. According to the experiment results, the pHpzc value of Ag-TiO2/rGO/HNT is extremely close to the pHPZC value of CIP of 7.22. In this case, Ag-TiO2/rGO/HNT and CIP are in the same phase in terms of charge. Thus, the adsorption capacity peaks only in the neutral zwitterionic form state. Similar conclusions can be drawn from the data showing that CIP conversion is best at pH = 6 and decreases dramatically at pH = 10. From the efficiency at pH = 7, it can be inferred that a neutral to slightly acidic medium could perfect the CIP degradation process. This could be the advantage for CIP removal by Ag-TiO2/rGO/HNT photocatalyst.
However, other interactions could be stronger than pure electrostatic forces, so the surface charge effect is not so important. At this time, the adsorption ability can be influenced by the specific surface area and pore size of the adsorbent. The large specific surface area of the materials may have facilitated the adsorption of pollutants at the pore position, which helps to increase the efficiency of pollutant degradation in the photocatalyst.

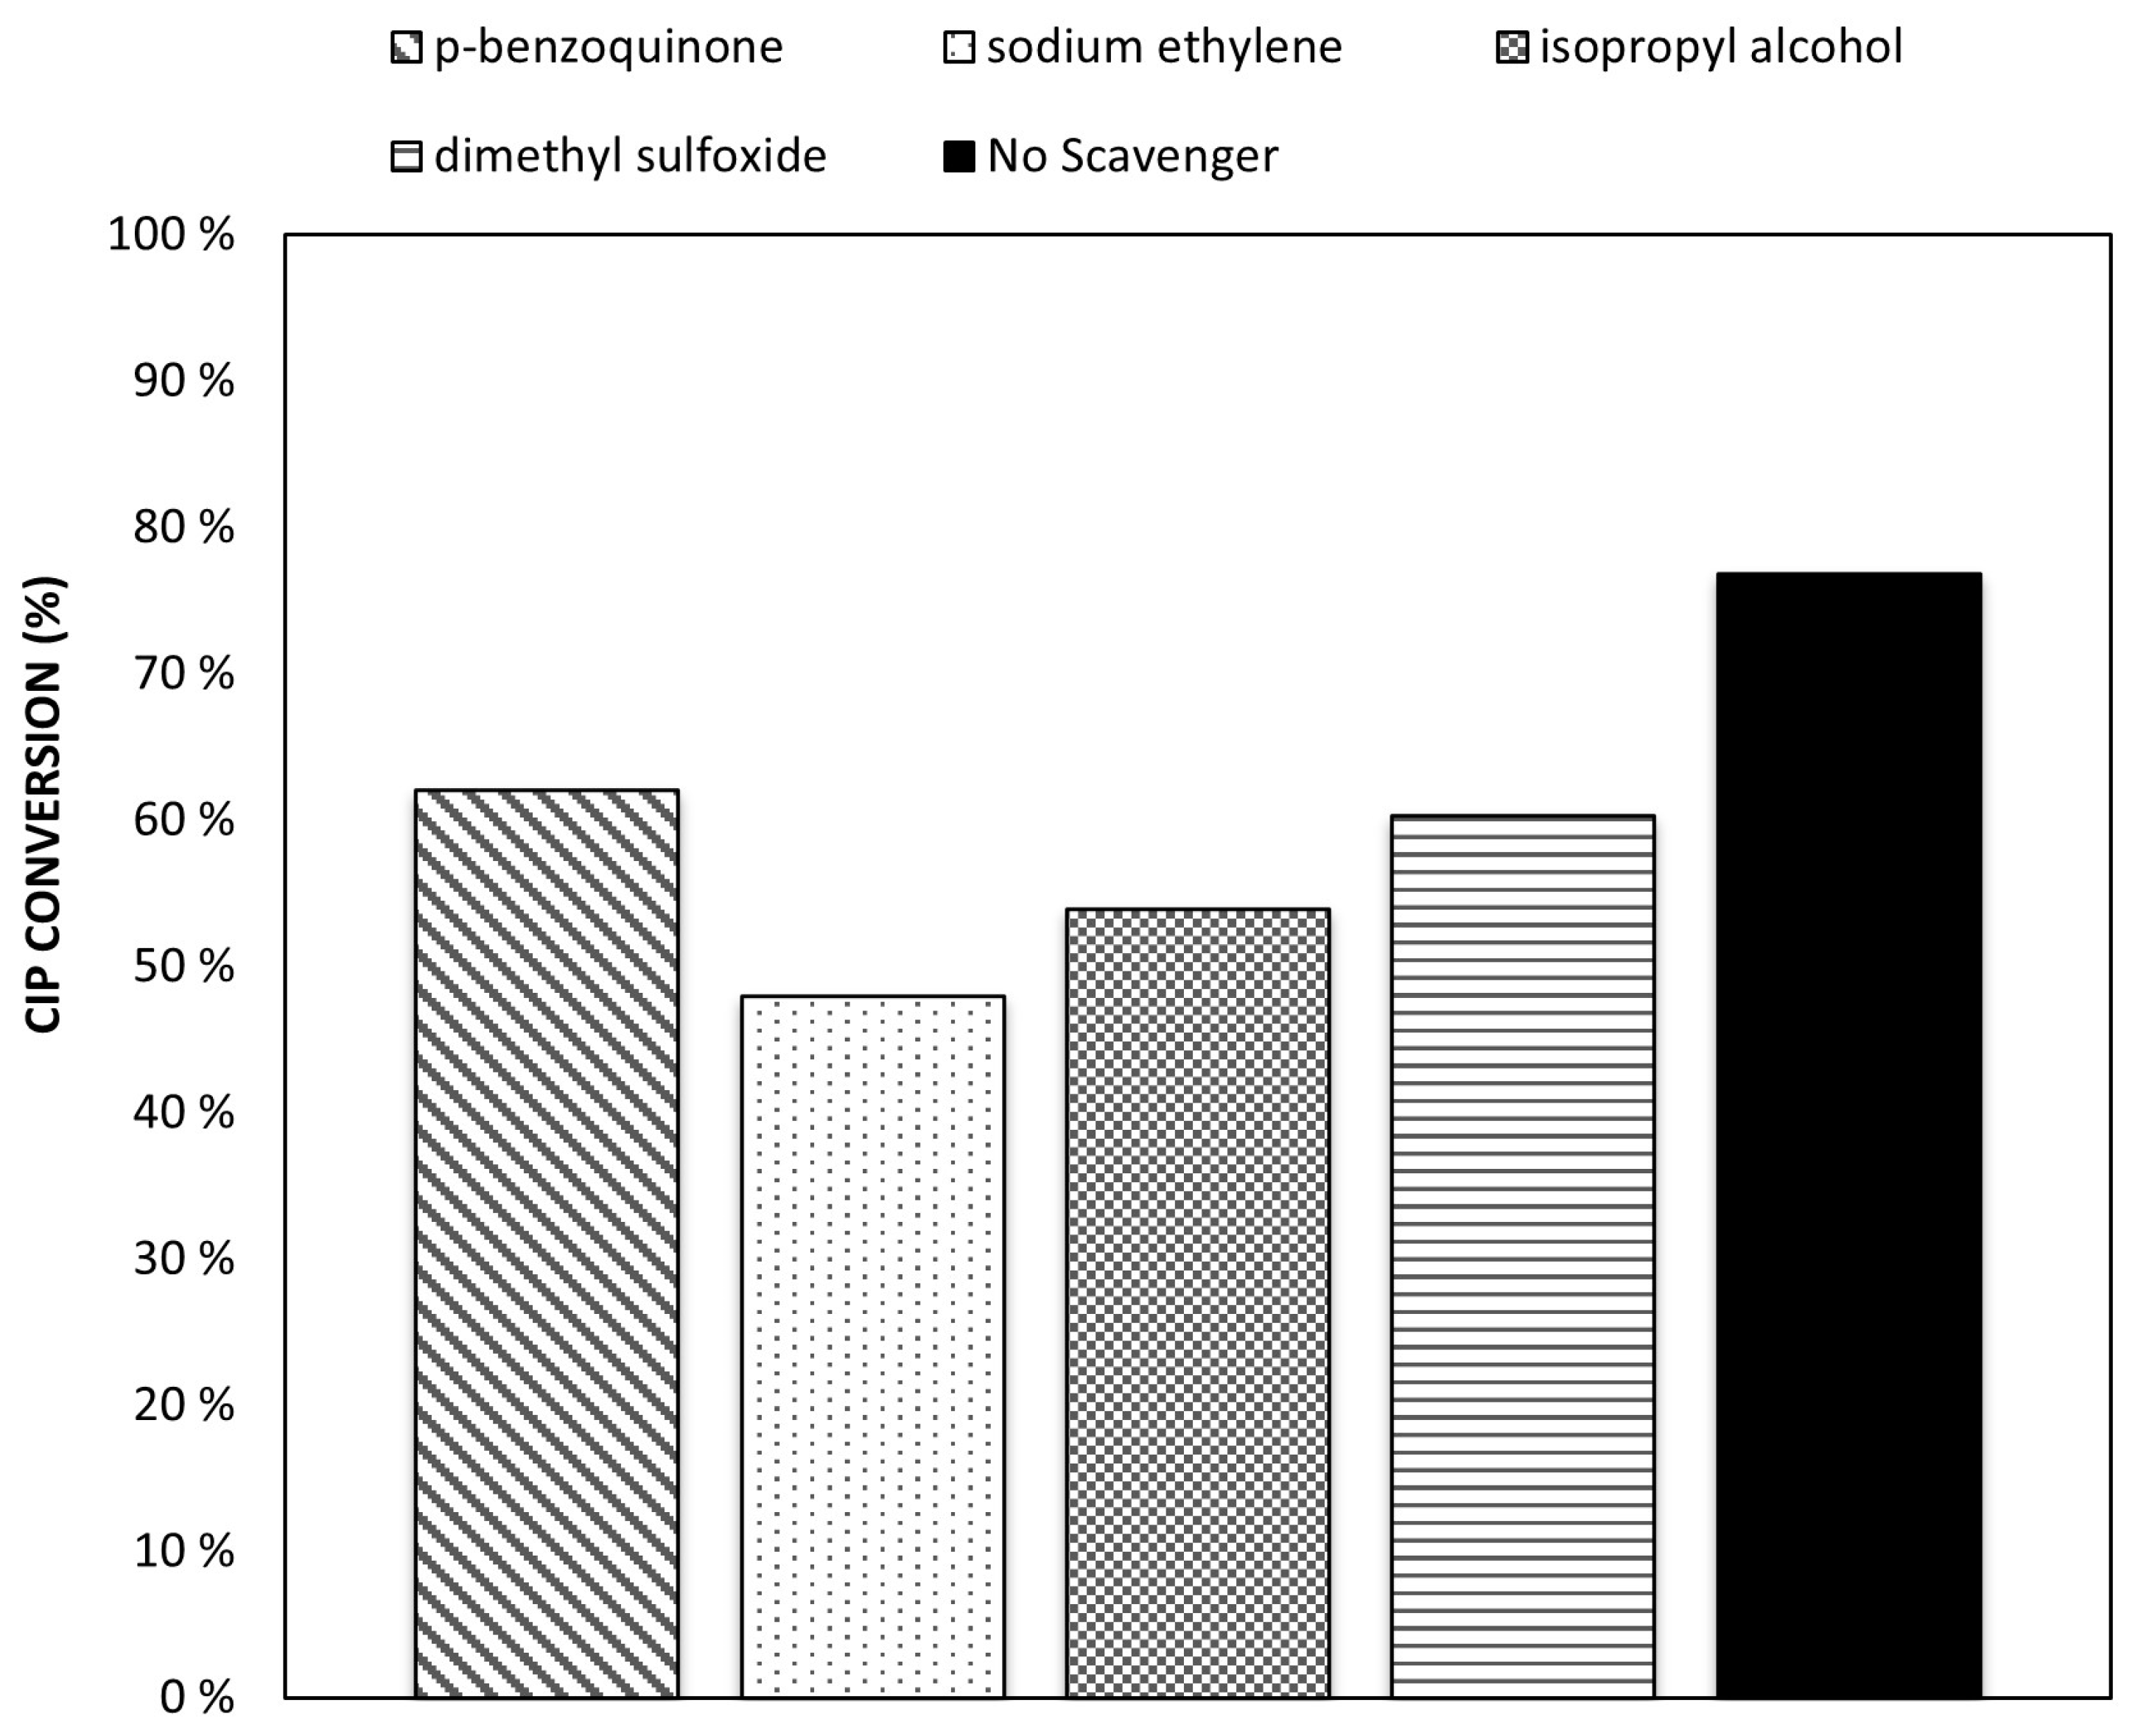
2.5. Scavengers Test

The CIP photodegradation results from the redox reactions triggered by active radicals generated by the photocatalytic process. To determine the contribution of these radicals (e.g., •O2 h+, e, and •OH), trapping experiments were performed for CIP photodegradation over the Ag-TiO2/rGO/HNT by introducing different scavengers, including p-benzoquinone (trapping of •O2), sodium ethylene (trapping of h+), isopropyl alcohol (trapping of •OH), and dimethyl sulfoxide (trapping of e) as quenchers for superoxide radicals (•O2), holes (h+), electrons (e), and hydroxyl radicals (•OH) [39]. The reactions were conducted using 10 mg (3%)Ag-TiO2/rGO/HNT as a catalyst. To avoid complete decomposition, which would make comparison impossible, the samples were taken two hours after irradiation.
Figure 11 illustrates how several reactive species contribute to the photodegradation of antibiotics.
As shown in Figure 11, the CIP photodegradation performance is significantly lower after the different scavengers participated in the photocatalytic reaction. It is generally known that the more a scavenger inhibits the efficiency of the photodegradation process, the more important a role the corresponding active radical plays in the CIP photodegradation process [40]. In our case, the CIP photodegradation process over the (1%)Ag-TiO2 composite is very strongly inhibited (from 77% to 48%) by the isopropyl alcohol scavenger. A decrease in photodegradation efficiency is also observed after the addition of sodium ethylene (from 77% to 53%). Finally, a decrease in photodegradation efficiency is also observed after the addition of 1,4-benzoquinone and dimethyl sulfoxide (from 77% to 62% and 60%, respectively). It can be concluded that •OH served as the predominant active radicals in the whole photocatalytic system, and the contribution of these radicals to the CIP photodegradation in order of importance is as follows: •OH > h+ > e > •O2.

2.6. Mechanism of CIP Photodegradation Reaction Using/rGO/HNT

Conduction Band Energy (ECB) and Valence Band Energy Level (EVB)

The ionization energy (EIE) and electron affinity (EEA) of each element are necessary information to determine the EVB and ECB of the synthesized materials. These values could be obtained from the literature and are listed in Table 3.
Based on the data, the geometric mean of the electronegativity of the constituent atoms could be calculated using the following formulas:
X Ag = 1 2 ( 7.6   +   1.3 )   = 4.45
X Ti = 1 2 ( 6.82   +   0.075 )   =   3.4475
X O = 1 2 ( 13.62   +   1.461 )   =   7.5405
χ = [ x ( A ) a x ( B ) b x ( C ) c ] 1 a + b + c     ( a )
χ =   ( 4.45   ×   3.4475   ×   7.5405   ×   7.5405 ) 1 1 + 1 + 2
X = 5.43
The valence band edge potential and the conduction band edge potential of a semiconductor material can be determined with the help of the following (b) and (c) [45].
E CB   = χ     E e 1 2 Eg   ( b )
E VB = Eg + E CB   ( c )
where ECB is the edge potential of the conduction band, and EVB is the edge potential of the valence band. X is the geometric mean of the electronegativity of the constituent atoms, Ee is the energy of the free electrons on the hydrogen scale (approximately 4.5 eV), and Eg is the band gap energy of the semiconductor corrected by the scissor’s operator.
The Eg of (1%)Ag-TiO2 is 2.75 eV, the Eg of TiO2 is 3.2 eV, and the Eg of (3%)Ag-TiO2 is 2.61 eV, as shown in the UV-Vis DRS results. The calculations of ECB and EVB of the two materials are presented in Table 4.
TiO2 cannot absorb any visible light due to its enormous band gap energy (3.2 eV) and band gap alignment (EVB = +2.9 eV, ECB = −0.3 eV). Ag doping can reduce the band gap of TiO2, resulting in the enhanced photoactivity of TiO2 while supporting a strong redox potential.
The calculated valence band and conduction band energies of (1%)Ag-TiO2 are 2.17 eV and −0.445 eV, while these values for (3%)Ag-TiO2 are 2.32 eV and −0.43 eV, respectively. The redox potential of O2/O2 (−0.33 eV) [46] is less negative than the conduction band energy of (1%)Ag-TiO2 and (3%)Ag-TiO2. Therefore, the electrons accumulated on the surface of (1%)Ag-TiO2 and (3%)Ag-TiO2 are captured by the oxygen to form •O2, which is presented in reaction (2). Silver is excited by visible light thanks to the surface plasmonic resonance effect. The electron from silver is then transferred to TiO2, and Ag+ will be formed. While this is going on, combining titanium dioxide rGO, which has high conductivities, and effective electron capture can enhance the transfer of photogenerated electrons, further reduce recombination, and boost photocatalytic activity. Additionally, it is important to note that, in terms of energy, the Schottky barrier (depletion layer) created in the Ag-TiO2 interaction can favour the transit of photoinduced electrons from Ag to TiO2.
Ag-TiO2 + hv → (eCB) + (hVB+)
(eCB) + O2 → •O2
However, the scavenger test confirms that •O2 plays a very minor role in the degradation of CIP. It can, therefore, be assumed that the •O2 formed reacts with protons to produce H2O2 and then •OH is formed.
•O2 + H+HO2
2HO2 → H2O2 + O2
H2O2 + (hvb+) → 2•OH
The redox potential of OH/•OH is 1.99 eV [46], which is less positive than the potential of the holes in the valence band of (1%)Ag-TiO2 (2.17 eV) and (3%)Ag-TiO2 (2.32 eV). Therefore, both can oxidise OH to •OH (R7)
•O2 + H2O → HO2 + OH
hvb+ + OH → •OH
•OH + Organic compounds → CO2 + H2O
In this case, the formation of the radical •OH could also occur indirectly from the •O2, and it has been suggested that the amount of •OH formed is influenced by the amount of •O2 formed. On the other hand, the holes on the surface of (1%)Ag-TiO2 and (3%)Ag-TiO2 are also involved in photocatalytic activity. It can be concluded that the active species •OH, h+ and e- play an important role in the degradation of CIP.
Due to the easier transition of electrons from the valence band to the conduction band due to the narrower band gap in the (3%)Ag sample, the (3%)Ag conductivity is higher than the (1%)Ag conductivity. As a result, the (3%)Ag-TiO2 must absorb less energy at room temperature to be excited than the (1%)Ag-TiO2. However, the photocatalytic activity of (3%)Ag-TiO2 is lower than that of (1%)Ag-TiO2. This could be because the surface active sites can also be occupied by the aggregated metal ion, resulting in the inhibition of light absorption and creating centres for the recombination of electron/hole pairs. In the case of the (1%)Ag-TiO2/nanocomposite, there is a significant improvement in the separation efficiency of the photoinduced electron–hole pairs and a decrease in the recombination rate. Therefore, the amount of doped Ag could be the decisive factor for the enhancement of the photocatalytic activity. This observation is in line with other publications in the literature. Several publications showed that noble metal ions could be easily reduced on irradiated TiO2 nanoparticles [47,48,49]. If some of the metal ions are incorporated into the TiO2 matrix, the photogenerated electrons will reduce the rest. In this case, the metal ions are at the interface of TiO2, and the metal could become recombination centres, reducing the lifetime of the (e, h+) pairs and negatively affecting the photocatalytic activity [50,51,52].

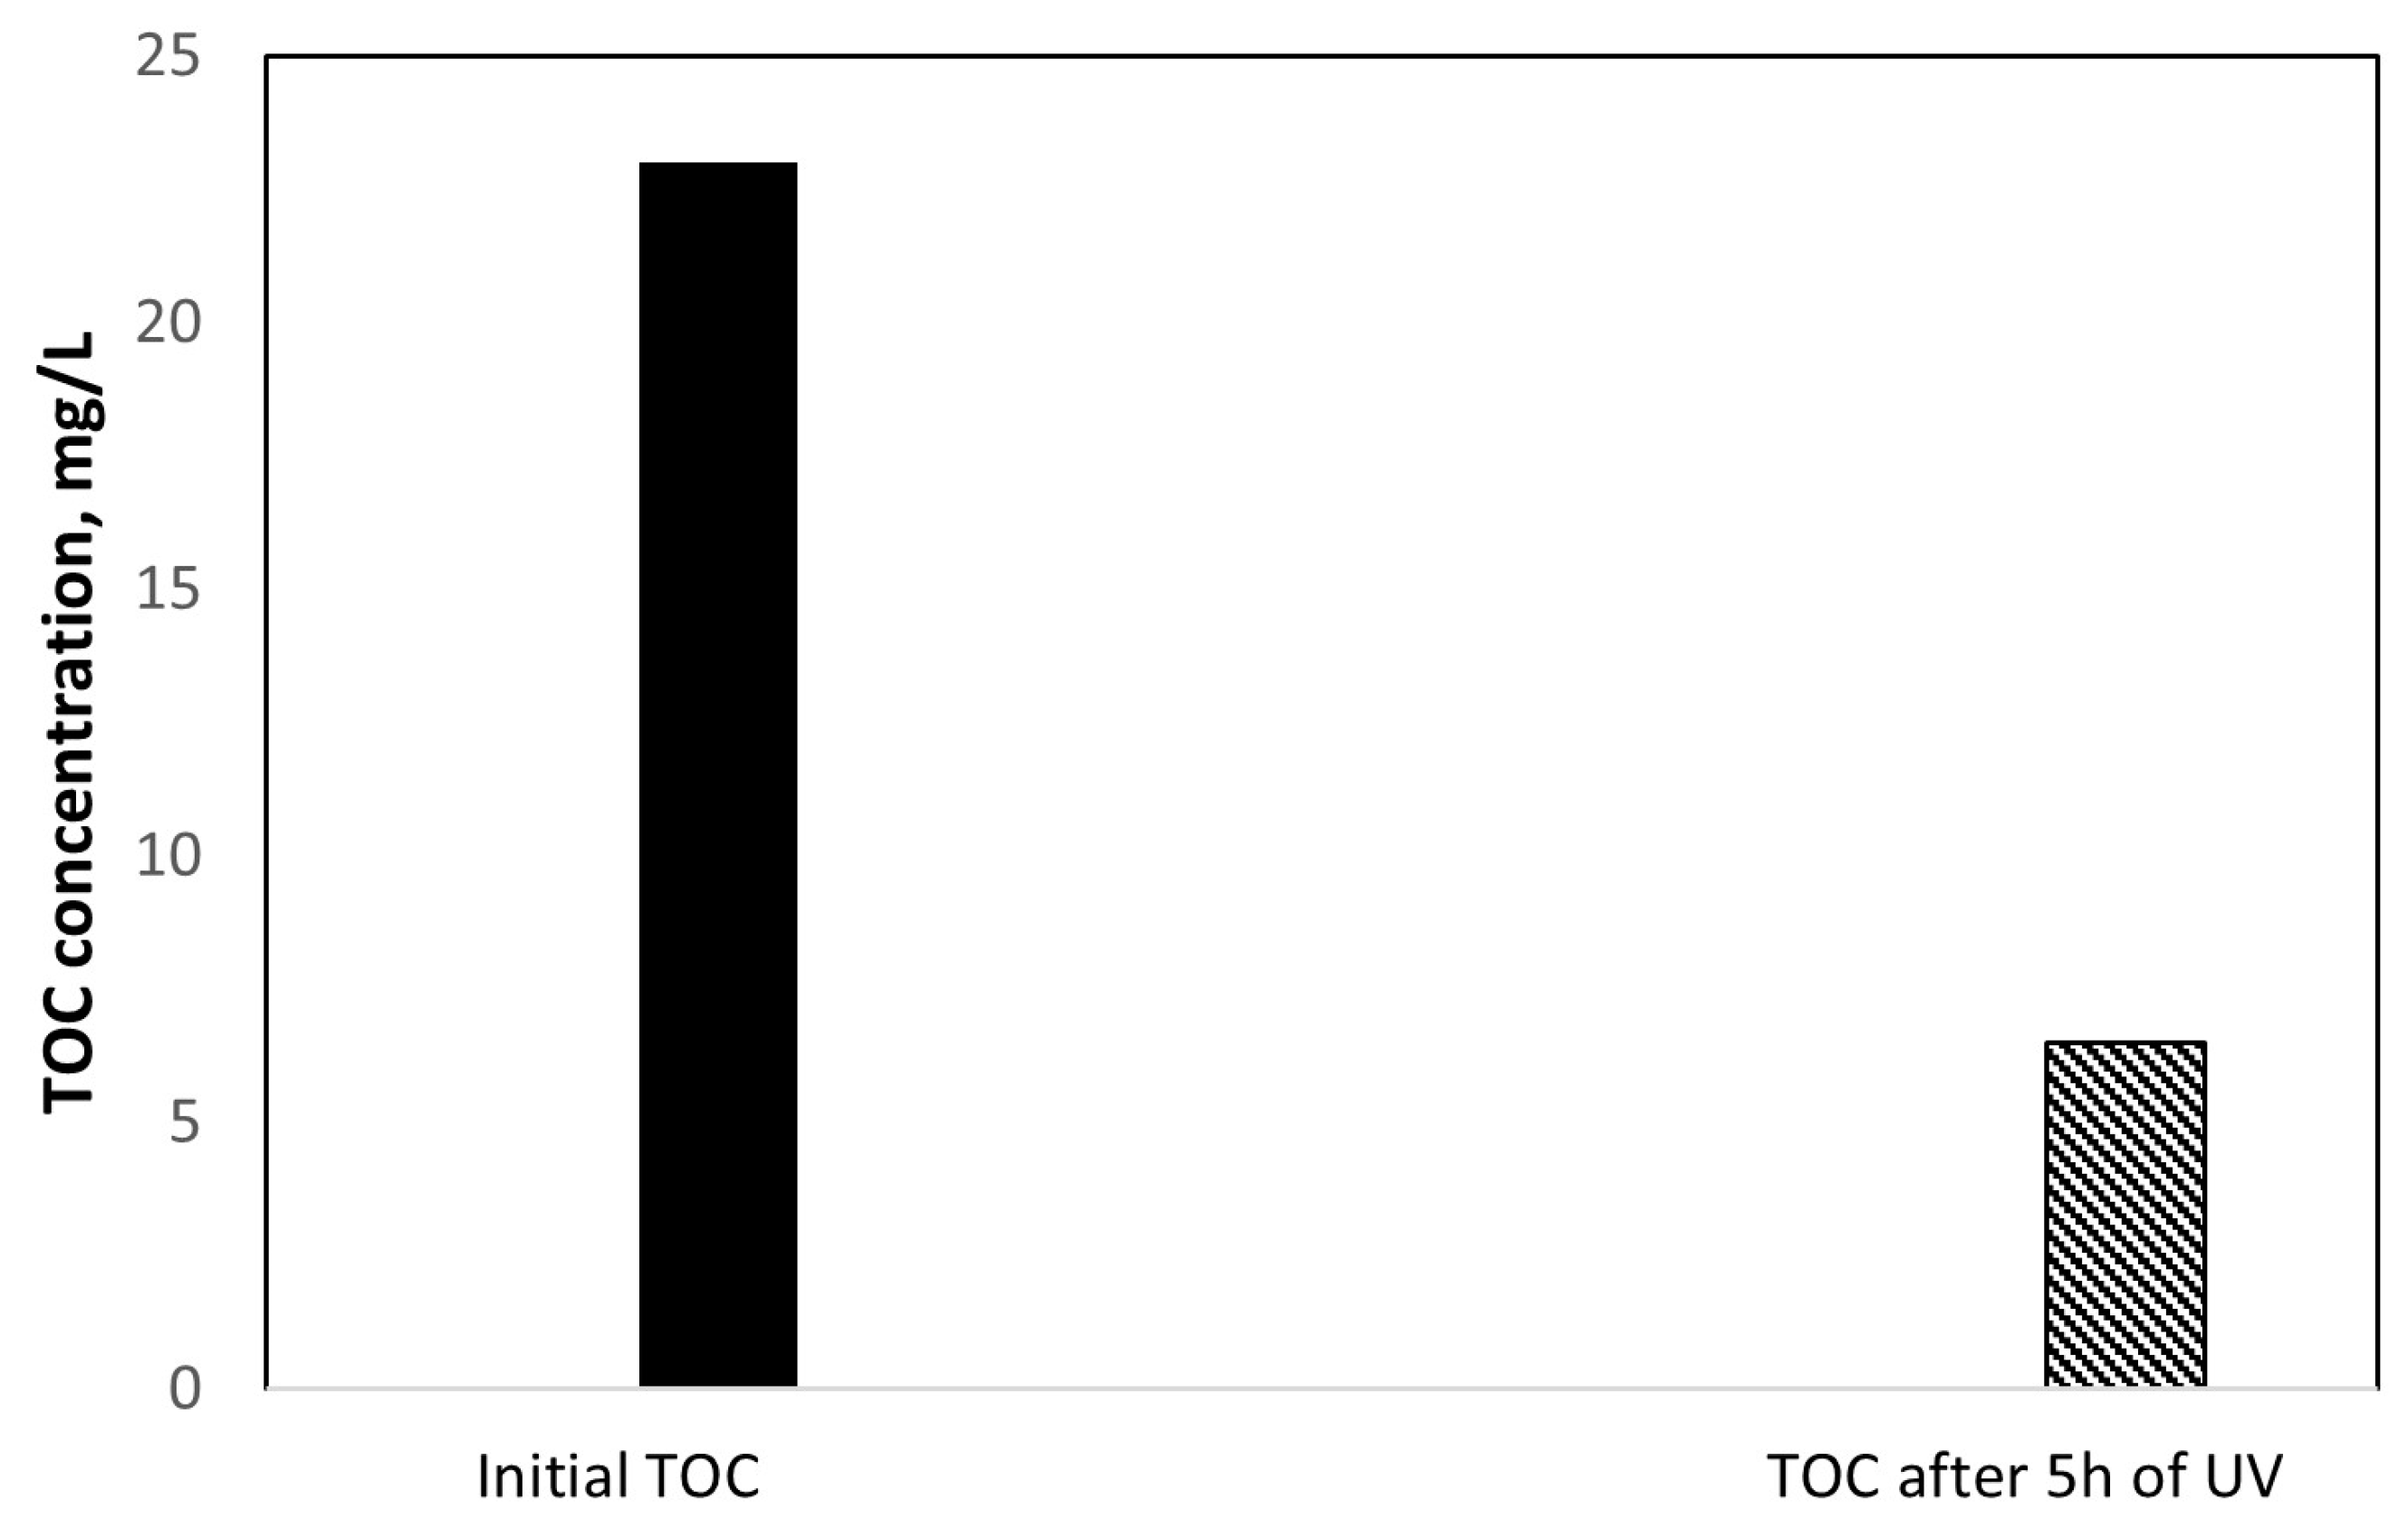
2.7. Total Organic Carbon (TOC) Analysis

The degree of mineralisation was analysed to determine the completion of the degradation process. Theoretically, CIP could be converted to CO2 and water after photocatalytic decomposition, but there are several incomplete products. The result of the total organic carbon concentration before and after the reaction is shown in Figure 12.
The TOC concentration decreased during the reaction process, as shown in Figure 12. After 5 h of irradiation, about 75% of the original TOC was mineralised. These results show that CIP was not only effectively mineralised but also converted into less complicated chemical compounds.

3. Materials and Methods

3.1. Chemicals

The raw ore of graphite and halloysite is dried to remove the adsorbed free water. The following ingredients were obtained from Xilong (China): crystal KMnO4 98%, H2O2 30%, hydrochloric acid 36.5%, sulphuric acid 98%, hydrazine, ascorbic acid (≥99.7%). TTIP and acetic acid (99.9%) were purchased from Sigma-Aldrich. Silver nitrate (>99.8%), isopropyl alcohol (99.7%), ethylenediaminetetraacetic acid disodium (99%), p-benzoquinone (99%), and dimethyl sulphoxide (99%); ciprofloxacin (99.99%) was from Merck. The compounds were used directly from the manufacturers without any additional treatment.

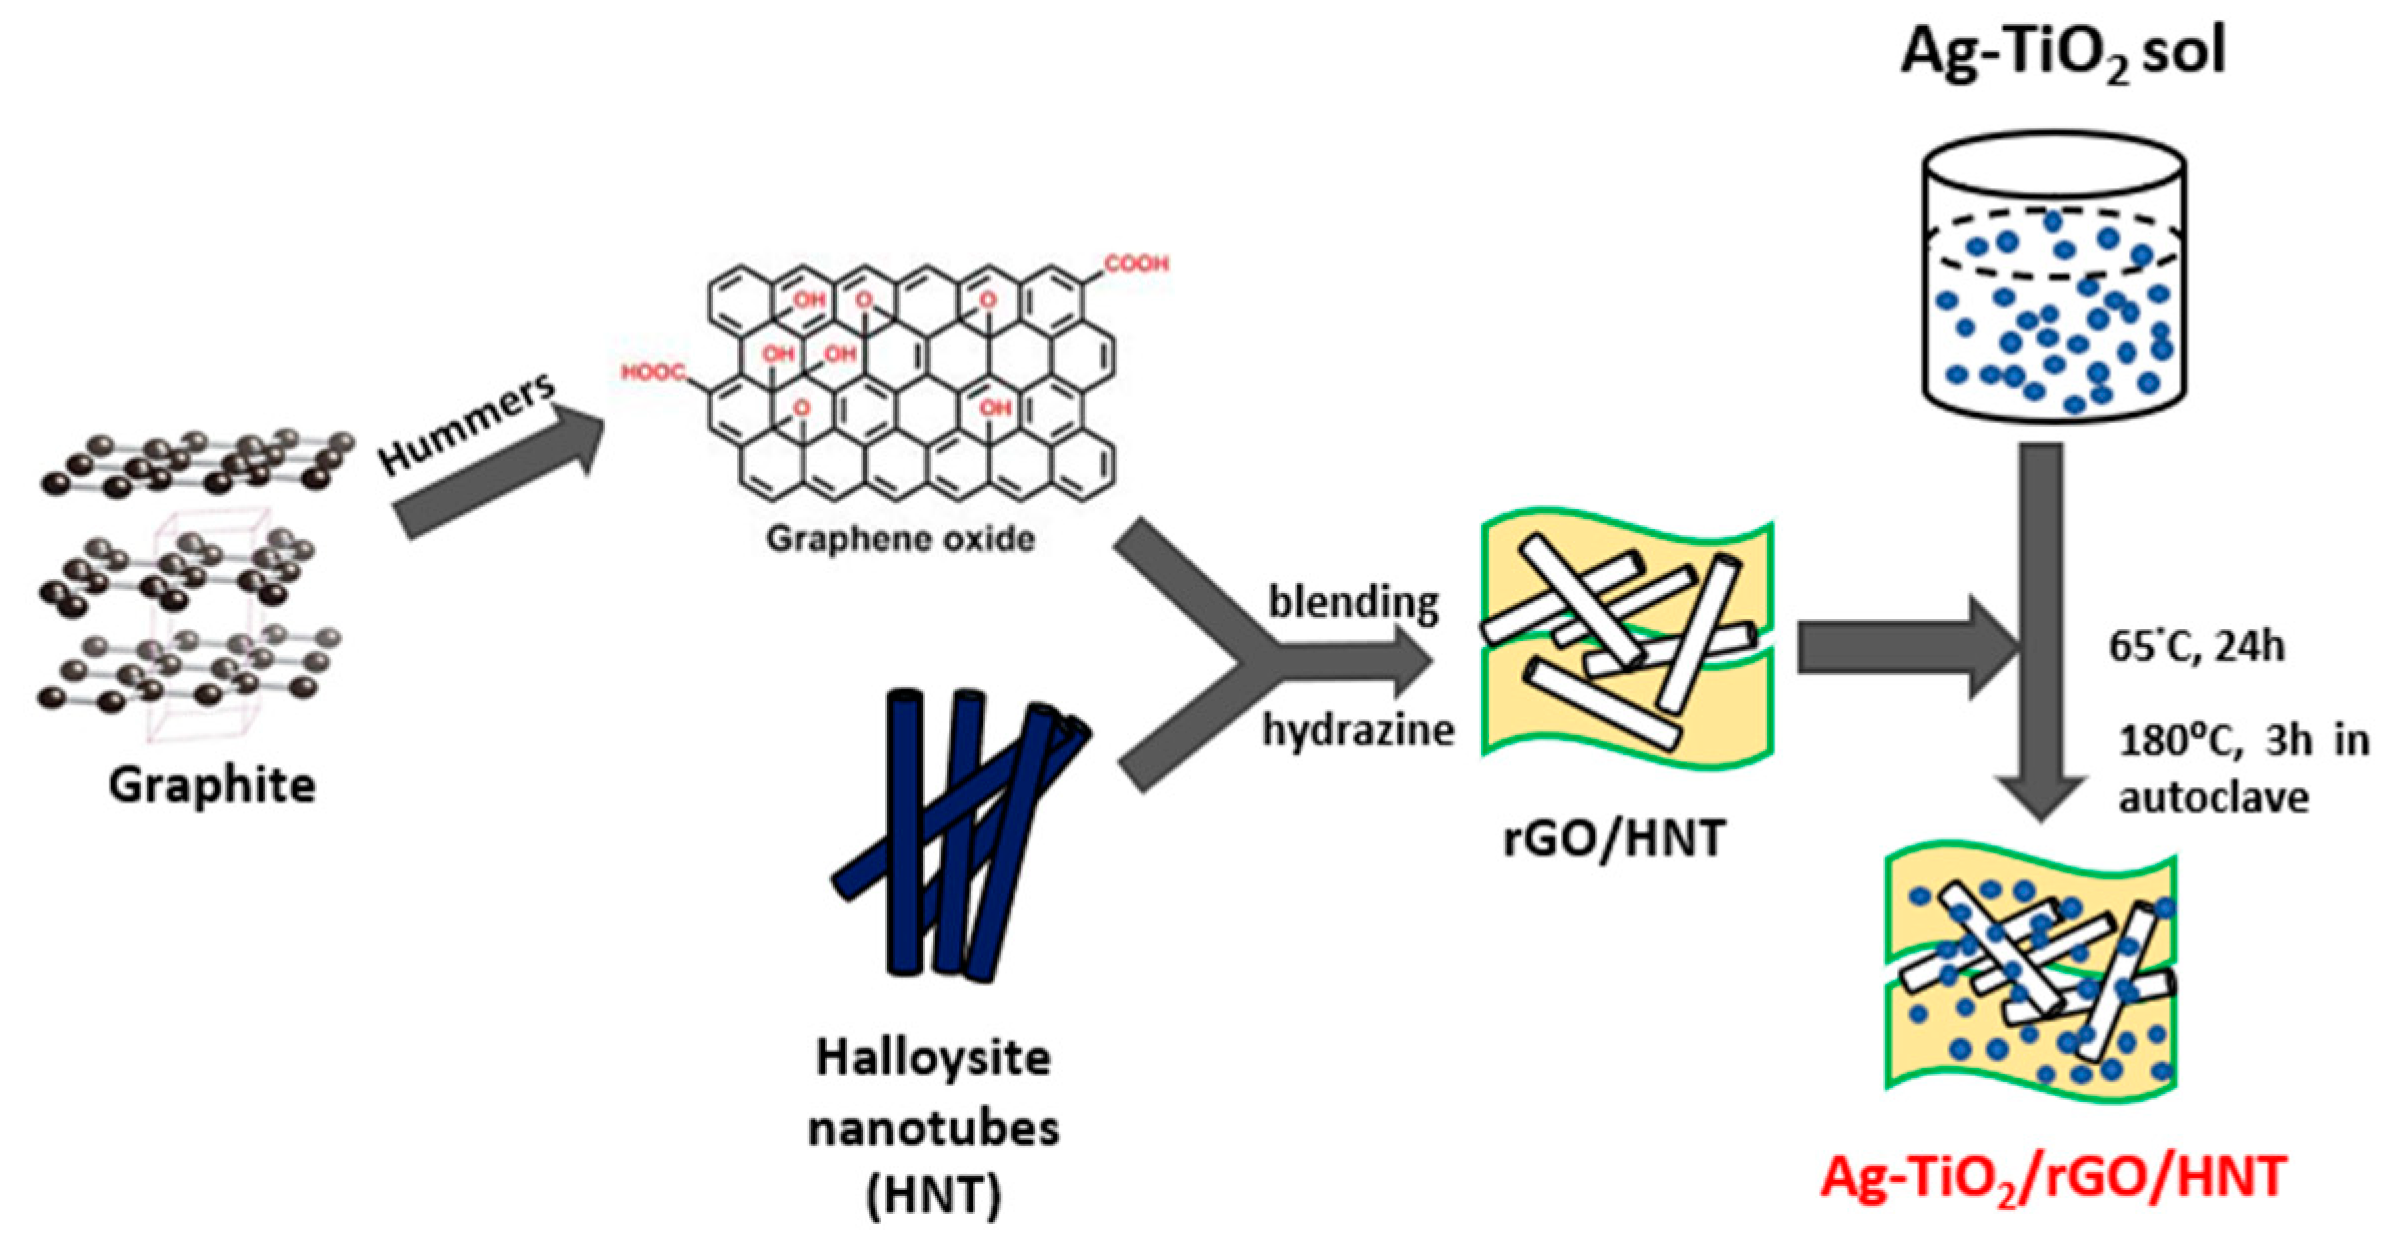
3.2. Synthesis of Graphene Oxide

Graphite was converted to graphene oxide using the Hummers method [53]. A typical experiment consisted of cooling 42 mL of H2SO4 98% to below 5 °C, adding 5 g of graphite powder and stirring the mixture at 400 rpm for 30 min until it turned black. After adding 15 g KMnO4, the temperature was kept at 20 °C for 4 h. Then, 140 mL of water was gradually added to the mixture while the temperature was kept below 50 °C for three hours. After stirring for 20 min and gradually adding 50 mL of H2O2 (30%), the mixture had a light brown colour. After ultrasonication for 30 min, the material was filtered, washed with a 0.1 M HCl solution until the pH was 7, and then dried at 70 °C to produce graphene oxide.

3.3. Halloysite Purification

Halloysite ore from a kaolin deposit in Vietnam was pulverised and sieved to exclude impurities. Then, 20 g of crude halloysite was dried at 100 °C for 3 h before being dispersed in 27.5 mL of distilled water. Then, 1 mL of H2SO4 (98%) solution was added dropwise to the mixture and stirred at 90 °C for two hours. The resulting mixture was filtered before being repeatedly rinsed with distilled water to remove excess H2SO4. Next, 750 mL of distilled water was added to the dried sample mixture and stirred for 24 h before allowing it to settle for 96 h. The mixture was then filtered, the solution removed from the top and the solid residue taken from the bottom. The extracted solid was centrifuged, dehydrated, and washed several times with water before being filtered to yield purified HNT.

3.4. Preparation of rGO/HNT

Then, 50 mL of distilled water was dispersed with 100 mg of HNT for 10 min (solution 1) and stirred ultrasonically. In addition, 200 mg of GO was added to 200 mL of water, followed by sonication for 10 min (solution 2). Combined solutions 1 and 2, stirred the mixture for 10 min and ultrasonicated at 90 °C for 30 min. In the next phase, 2 mL of hydrazine 80% was added to the mixture with constant stirring for 2 h. The remaining material was then filtered and dried to obtain GO/HNT.

3.5. Preparation of Ag-TiO2/Nanocomposite

Cooled 3.3 mL of CH3COOH in ice until solid. After adding 6.6 mL of C2H5OH and stirring the mixture for about 30 min, a perfectly clear solution was obtained. Then, 3.3 mL of TTIP was gradually added, stirring continuously for 30 min. Then, 0.12 g of glucose was added to the mixture, stirred and the temperature was gradually raised to 80 °C over the next 45 min. Then, 280 mL of AgNO3 (0.002 M) was gradually added to the solution to form an Ag-TiO2 sol. The temperature of the Ag-TiO2 sol was then gradually lowered to 65 °C. Then, 3 g of pure rGO/HNT was added and the mixture was stirred at 65 °C for 24 h. Finally, the mixture was incubated at 180 °C for 5 h in an autoclave. Ag-TiO2/rGO/HNT material was prepared after washing, filtering, and drying the final solution at 70 °C for 24 h. All of the steps are summarized in Figure 13.

3.6. Material Characterizations

A D8 Bruker device with Cu Kα radiation, λ = 1.5403 in the scan range of 2 = 5–80°, was used to record X-ray diffraction (XRD). The Jasco FT/IR-4600 instrument was used to perform the FTIR spectroscopic investigation to obtain more information about the chemical bonding of the material. The EDX results were obtained using the ESEM-XL30 instrument.
Scanning electron micrographs (SEM) were taken to identify the morphology on the surface of the material. JSM-6701F (JEOL) was used to take SEM images of the prepared materials. A small amount of the suspension was applied to a piece of silicon to create the SEM sample.
To determine the band gap energy of a material and measure the number of pollutants removed after the photocatalytic degradation process, the UV-VIS spectra with a wavelength range of 200 to 800 nm were recorded using the Jasco V-750 instrument.
The N2 adsorption–desorption isotherm (BET) was performed at 77.34 °C on CHEMBET-3030 to calculate the specific surface area and pore size distribution of the material. The drift method was used to determine the point of zero charge of the nanocomposite [54].

3.7. Photocatalytic Activity Evaluation

A known weight of catalyst was added to 50 mL of CIP solution (20 ppm) in a two-neck flask with a round bottom. The solution was then placed in a dark box to eliminate the effect of photolysis. The solutions were then vigorously shaken (400 rpm) with a magnetic stirrer for at least 30 min. The first sample was taken at this time. After 30 min, the system was subjected to UV irradiation. Every hour of irradiation, samples were taken, the catalyst (if any) was filtered, and UV-vis measurements were taken to quantify the concentration of CIP.
The conversion of CIP during photodecomposition with the Ag-TiO2/rGO/HNT catalyst is used to evaluate the catalytic efficiency, considering the results of experiments with scavengers and the effects of pH. The following equation is used to determine this value:
Conversion   (   % ) = ( C o C t C o ) 1
In which:
Co is the concentration of CIP in the feed solution at the initial time t = 0 (hours).
Ct is the concentration of CIP in the treated solution at time t.
The concentrations of CIP were calculated from a calibration curve using the UV-Vis spectroscopy data at a wavelength of 273 nm.

4. Conclusions

In this research, the method for the synthesis of Ag-TiO2/rGO/HNT was presented. Through various modern physicochemical techniques, it was shown that nano Ag-TiO2 with a size of about 30–40 nm was successfully decorated on an rGO/HNT support. The catalyst exhibited a good specific surface area (~80 m2/g) and had a mesoporous system. Moreover, its interstitial structure can produce greater space efficiency and facilitate the adsorption and photodegradation of CIP. Furthermore, the doping of nanosilver in the TiO2 matrix shifted the energy band gap of the catalyst to a lower value of about 2.7 eV, allowing more photons to be collected in the visible range. Indeed, the Ag-TiO2/nanocomposite showed significantly better activity than pure TiO2 and Ag-TiO2. In the presence of the as-synthesised catalyst, 20 ppm CIP was degraded by 90% compared to 60–70% when TiO2 and Ag-TiO2 were used. Interestingly, the material with lower silver content showed higher CIP degradation efficiency than the higher-loaded sample. This could indicate the negative effect of Ag aggregation on the surface of the support, which inhibits photon absorption and creates centres for the recombination of electrons and holes. The reaction was found to follow the first-order kinetic model when (1%)Ag-TiO2/nanocomposite is involved, while the second-order fits better in the case of the (3%)Ag-TiO2/nanocomposite.
Importantly, the scavenger test revealed that •OH acts as the predominant active radical in the whole photocatalytic system, and the contribution of radicals to CIP photodegradation follows the order: •OH > h+ > e > •O2. The experimental results also show that CIP degradation is most effective at pH values between 6 and 7. It can therefore be assumed that a neutral to slightly acidic medium would be ideal. Finally, the mineralisation of about 75% makes the Ag-TiO2/rGO/HNT catalysed photodegradation process of CIP possible and opens the potential to use this material in the deep treatment of antibiotic residues in wastewater.

Author Contributions

N.-T.T.: Data curation, Investigation. H.-C.L.: Data curation, Formal analysis. T.-L.N.: Supervision, Resources, Methodology, Writing—original draft. H.-S.N.: Formal analysis, Supervision, Writing—review and editing, Validation. All authors have read and agreed to the published version of the manuscript.

Funding

This research was supported by the Vietnam Ministry of Education and Training [grant number B2021-MDA-02].

Data Availability Statement

The data presented in this study are available in this article, in the form of figures, tables, and references.

Acknowledgments

We would like to thank Hanoi University of Mining and Geology for the provision of laboratory facilities used in this work and the support of the grant (B2021-MDA-02) of the Vietnam Ministry of Education and Training to complete this study.

Conflicts of Interest

The authors declare no conflict of interest.

References

  1. Ikehata, K.; Gamal El-Din, M.; Snyder, S.A. Ozonation and Advanced Oxidation Treatment of Emerging Organic Pollutants in Water and Wastewater. Ozone Sci. Eng. 2008, 30, 21–26. [Google Scholar] [CrossRef]
  2. Watkinson, A.J.; Murby, E.J.; Costanzo, S.D. Removal of Antibiotics in Conventional and Advanced Wastewater Treatment: Implications for Environmental Discharge and Wastewater Recycling. Water Res. 2007, 41, 4164–4176. [Google Scholar] [CrossRef] [PubMed]
  3. Xu, W.; Zhang, G.; Li, X.; Zou, S.; Li, P.; Hu, Z.; Li, J. Occurrence and Elimination of Antibiotics at Four Sewage Treatment Plants in the Pearl River Delta (PRD), South China. Water Res. 2007, 41, 4526–4534. [Google Scholar] [CrossRef] [PubMed]
  4. Adebileje, T.; Adebileje, S.; Aye, P.O. Ciprofloxacin Hydrochloride Encapsulated into PLGA Nanoparticles for Drug Delivery Application: Fractional Factorial Design. OALib 2018, 05, 1–14. [Google Scholar] [CrossRef]
  5. Avisar, D.; Lester, Y.; Mamane, H. PH Induced Polychromatic UV Treatment for the Removal of a Mixture of SMX, OTC and CIP from Water. J. Hazard. Mater. 2010, 175, 1068–1074. [Google Scholar] [CrossRef]
  6. Koo, Y.; Littlejohn, G.; Collins, B.; Yun, Y.; Shanov, V.N.; Schulz, M.; Pai, D.; Sankar, J. Synthesis and Characterization of Ag–TiO2–CNT Nanoparticle Composites with High Photocatalytic Activity under Artificial Light. Compos. Part B Eng. 2014, 57, 105–111. [Google Scholar] [CrossRef]
  7. Shi, B.; Yin, H.; Gong, J.; Nie, Q. Ag/AgCl Decorated Bi4Ti3O12 Nanosheet with Highly Exposed (001) Facets for Enhanced Photocatalytic Degradation of Rhodamine B, Carbamazepine and Tetracycline. Appl. Surf. Sci. 2017, 419, 614–623. [Google Scholar] [CrossRef]
  8. Cui, W.; Li, X.; Gao, C.; Dong, F.; Chen, X. Ternary Ag/AgCl-(BiO)2CO3 Composites as High-Performance Visible-Light Plasmonic Photocatalysts. Catal. Today 2017, 284, 67–76. [Google Scholar] [CrossRef]
  9. Yang, Y.; Liu, E.; Dai, H.; Kang, L.; Wu, H.; Fan, J.; Hu, X.; Liu, H. Photocatalytic Activity of Ag–TiO2-Graphene Ternary Nanocomposites and Application in Hydrogen Evolution by Water Splitting. Int. J. Hydrogen Energy 2014, 39, 7664–7671. [Google Scholar] [CrossRef]
  10. Zhu, Y.; Zhao, F.; Wang, F.; Zhou, B.; Chen, H.; Yuan, R.; Liu, Y.; Chen, Y. Combined the Photocatalysis and Fenton-like Reaction to Efficiently Remove Sulfadiazine in Water Using g-C3N4/Ag/γ-FeOOH: Insights Into the Degradation Pathway From Density Functional Theory. Front. Chem. 2021, 9. [Google Scholar] [CrossRef]
  11. Gholami, P.; Khataee, A.; Soltani, R.D.C.; Dinpazhoh, L.; Bhatnagar, A. Photocatalytic Degradation of Gemifloxacin Antibiotic Using Zn-Co-LDH@biochar Nanocomposite. J. Hazard. Mater. 2020, 382, 121070. [Google Scholar] [CrossRef] [PubMed]
  12. Khaledian, H.R.; Zolfaghari, P.; Elhami, V.; Aghbolaghy, M.; Khorram, S.; Karimi, A.; Khataee, A. Modification of Immobilized Titanium Dioxide Nanostructures by Argon Plasma for Photocatalytic Removal of Organic Dyes. Molecules 2019, 24, 383. [Google Scholar] [CrossRef] [PubMed] [Green Version]
  13. Wen, X.-J.; Niu, C.-G.; Zhang, L.; Liang, C.; Guo, H.; Zeng, G.-M. Photocatalytic Degradation of Ciprofloxacin by a Novel Z-Scheme CeO2–Ag/AgBr Photocatalyst: Influencing Factors, Possible Degradation Pathways, and Mechanism Insight. J. Catal. 2018, 358, 141–154. [Google Scholar] [CrossRef]
  14. Zhu, L.; Li, H.; Xia, P.; Liu, Z.; Xiong, D. Hierarchical ZnO Decorated with CeO2 Nanoparticles as the Direct Z-Scheme Heterojunction for Enhanced Photocatalytic Activity. ACS Appl. Mater. Interfaces 2018, 10, 39679–39687. [Google Scholar] [CrossRef]
  15. Syed, A.; Yadav, L.S.R.; Bahkali, A.H.; Elgorban, A.M.; Abdul Hakeem, D.; Ganganagappa, N. Effect of CeO2-ZnO Nanocomposite for Photocatalytic and Antibacterial Activities. Crystals 2020, 10, 817. [Google Scholar] [CrossRef]
  16. Li, X.; Zhu, W.; Yin, Y.; Lu, X.; Yao, C.; Ni, C. La1−xAgxFeO3/Halloysites Nanocomposite with Enhanced Visible Light Photocatalytic Performance. J. Mater. Sci. Mater. Electron. 2016, 27, 4180–4185. [Google Scholar] [CrossRef]
  17. Peng, H.; Liu, X.; Tang, W.; Ma, R. Facile Synthesis and Characterization of ZnO Nanoparticles Grown on Halloysite Nanotubes for Enhanced Photocatalytic Properties. Sci. Rep. 2017, 7, 2250. [Google Scholar] [CrossRef] [Green Version]
  18. Mishra, G.; Mukhopadhyay, M. TiO2 Decorated Functionalized Halloysite Nanotubes (TiO2@HNTs) and Photocatalytic PVC Membranes Synthesis, Characterization and Its Application in Water Treatment. Sci. Rep. 2019, 9, 4345. [Google Scholar] [CrossRef] [Green Version]
  19. Pastrana-Martínez, L.M.; Morales-Torres, S.; Figueiredo, J.L.; Faria, J.L.; Silva, A.M.T. 5—Graphene Photocatalysts. In Multifunctional Photocatalytic Materials for Energy; Woodhead Publishing in Materials; Lin, Z., Ye, M., Wang, M., Eds.; Woodhead Publishing: Sawston, UK, 2018; pp. 79–101. ISBN 978-0-08-101977-1. [Google Scholar]
  20. Lu, K.-Q.; Li, Y.-H.; Tang, Z.-R.; Xu, Y.-J. Roles of Graphene Oxide in Heterogeneous Photocatalysis. ACS Mater. Au 2021, 1, 37–54. [Google Scholar] [CrossRef]
  21. Graphene in Photocatalysis: A Review—Li-2016-Small-Wiley Online Library. Available online: https://onlinelibrary.wiley.com/doi/10.1002/smll.201600382 (accessed on 5 November 2022).
  22. Sher Shah, M.S.A.; Park, A.R.; Zhang, K.; Park, J.H.; Yoo, P.J. Green Synthesis of Biphasic TiO2–Reduced Graphene Oxide Nanocomposites with Highly Enhanced Photocatalytic Activity. ACS Appl. Mater. Interfaces 2012, 4, 3893–3901. [Google Scholar] [CrossRef]
  23. Nyankson, E.; Olasehinde, O.; John, V.T.; Gupta, R.B. Surfactant-Loaded Halloysite Clay Nanotube Dispersants for Crude Oil Spill Remediation. Ind. Eng. Chem. Res. 2015, 54, 9328–9341. [Google Scholar] [CrossRef]
  24. Krishnamoorthy, K.; Kim, G.-S.; Kim, S.J. Graphene Nanosheets: Ultrasound Assisted Synthesis and Characterization. Ultrason. Sonochem. 2013, 20, 644–649. [Google Scholar] [CrossRef] [PubMed]
  25. Beranek, R.; Kisch, H. Tuning the Optical and Photoelectrochemical Properties of Surface-Modified TiO2. Photochem. Photobiol. Sci. 2008, 7, 40–48. [Google Scholar] [CrossRef] [PubMed]
  26. Zhao, G.; Kozuka, H.; Yoko, T. Photoelectrochemical Properties of Dye-Sensitized TiO2 Films Containing Dispersed Gold Metal Particles Prepared by Sol-Gel Method. J. Ceram. Soc. Jpn. 1996, 104, 164–168. [Google Scholar] [CrossRef] [Green Version]
  27. Venkatachalam, N.; Palanichamy, M.; Murugesan, V. Sol–Gel Preparation and Characterization of Alkaline Earth Metal Doped Nano TiO2: Efficient Photocatalytic Degradation of 4-Chlorophenol. J. Mol. Catal. Chem. 2007, 273, 177–185. [Google Scholar] [CrossRef]
  28. Liu, L.; Zhao, H.; Andino, J.M.; Li, Y. Photocatalytic CO2 Reduction with H2O on TiO2 Nanocrystals: Comparison of Anatase, Rutile, and Brookite Polymorphs and Exploration of Surface Chemistry. ACS Catal. 2012, 2, 1817–1828. [Google Scholar] [CrossRef]
  29. Batzill, M. Fundamental Aspects of Surface Engineering of Transition Metal Oxide Photocatalysts. Energy Environ. Sci. 2011, 4, 3275–3286. [Google Scholar] [CrossRef]
  30. Scanlon, D.O.; Dunnill, C.W.; Buckeridge, J.; Shevlin, S.A.; Logsdail, A.J.; Woodley, S.M.; Catlow, C.R.A.; Powell, M.J.; Palgrave, R.G.; Parkin, I.P.; et al. Band Alignment of Rutile and Anatase TiO2. Nat. Mater. 2013, 12, 798–801. [Google Scholar] [CrossRef]
  31. Xu, M.; Gao, Y.; Moreno, E.M.; Kunst, M.; Muhler, M.; Wang, Y.; Idriss, H.; Wöll, C. Photocatalytic Activity of Bulk TiO2 Anatase and Rutile Single Crystals Using Infrared Absorption Spectroscopy. Phys. Rev. Lett. 2011, 106, 138302. [Google Scholar] [CrossRef] [Green Version]
  32. Luttrell, T.; Halpegamage, S.; Tao, J.; Kramer, A.; Sutter, E.; Batzill, M. Why Is Anatase a Better Photocatalyst than Rutile?—Model Studies on Epitaxial TiO2 Films. Sci. Rep. 2014, 4, 4043. [Google Scholar] [CrossRef]
  33. Zhang, J.; Zhou, P.; Liu, J.; Yu, J. New Understanding of the Difference of Photocatalytic Activity among Anatase, Rutile and Brookite TiO2. Phys. Chem. Chem. Phys. 2014, 16, 20382–20386. [Google Scholar] [CrossRef]
  34. Prieto-Mahaney, O.-O.; Murakami, N.; Abe, R.; Ohtani, B. Correlation between Photocatalytic Activities and Structural and Physical Properties of Titanium(IV) Oxide Powders. Chem. Lett. 2009, 38, 238–239. [Google Scholar] [CrossRef]
  35. Zhang, H.; Jiang, Y.; Zhou, B.; Wei, Z.; Zhu, Z.; Han, L.; Zhang, P.; Hu, Y. Preparation and Photocatalytic Performance of Silver-Modified and Nitrogen-Doped TiO2 Nanomaterials with Oxygen Vacancies. New J. Chem. 2021, 45, 4694–4704. [Google Scholar] [CrossRef]
  36. Grabowska, E.; Zaleska, A.; Sorgues, S.; Kunst, M.; Etcheberry, A.; Colbeau-Justin, C.; Remita, H. Modification of Titanium(IV) Dioxide with Small Silver Nanoparticles: Application in Photocatalysis. J. Phys. Chem. C 2013, 117, 1955–1962. [Google Scholar] [CrossRef]
  37. Ho, Y.S.; McKay, G. Pseudo-Second Order Model for Sorption Processes. Process. Biochem. 1999, 34, 451–465. [Google Scholar] [CrossRef]
  38. Igwegbe, C.A.; Oba, S.N.; Aniagor, C.O.; Adeniyi, A.G.; Ighalo, J.O. Adsorption of Ciprofloxacin from Water: A Comprehensive Review. J. Ind. Eng. Chem. 2021, 93, 57–77. [Google Scholar] [CrossRef]
  39. Guo, J.; Ma, D.; Sun, F.; Zhuang, G.; Wang, Q.; Al-Enizi, A.M.; Nafady, A.; Ma, S. Substituent Engineering in G-C3N4/COF Heterojunctions for Rapid Charge Separation and High Photo-Redox Activity. Sci. China Chem. 2022, 65, 1704–1709. [Google Scholar] [CrossRef]
  40. Song, S.; Wu, K.; Wu, H.; Guo, J.; Zhang, L. Synthesis of Z-Scheme Multi-Shelled ZnO/AgVO3 Spheres as Photocatalysts for the Degradation of Ciprofloxacin and Reduction of Chromium(VI). J. Mater. Sci. 2020, 55, 4987–5007. [Google Scholar] [CrossRef]
  41. Blondel, C.; Delsart, C.; Valli, C.; Yiou, S.; Godefroid, M.R.; Van Eck, S. Electron Affinities of 16 O, 17 O, 18 O, the fine structure of 16O, and the hyperfine structure of 17O. Phys. Rev. A 2001, 64, 052504. [Google Scholar] [CrossRef]
  42. Tang, R.; Fu, X.; Ning, C. Accurate Electron Affinity of Ti and Fine Structures of Its Anions. J. Chem. Phys. 2018, 149, 134304. [Google Scholar] [CrossRef]
  43. High-Precision Electron Affinity of Oxygen/Nature Communications. Available online: https://www.nature.com/articles/s41467-022-33438-y (accessed on 10 January 2023).
  44. Lide, D.R. CRC Handbook of Chemistry and Physics, 84th Edition Edited by David R. Lide (National Institute of Standards and Technology). J. Am. Chem. Soc. 2004, 126, 1586. [Google Scholar] [CrossRef]
  45. Li, Y.; Wang, J.; Yao, H.; Dang, L.; Li, Z. Efficient Decomposition of Organic Compounds and Reaction Mechanism with BiOI Photocatalyst under Visible Light Irradiation. J. Mol. Catal. Chem. 2011, 334, 116–122. [Google Scholar] [CrossRef]
  46. Fu, Y.; Tan, M.; Guo, Z.; Hao, D.; Xu, Y.; Du, H.; Zhang, C.; Guo, J.; Li, Q.; Wang, Q. Fabrication of Wide-Spectra-Responsive NA/NH2-MIL-125(Ti) with Boosted Activity for Cr(VI) Reduction and Antibacterial Effects. Chem. Eng. J. 2023, 452, 139417. [Google Scholar] [CrossRef]
  47. Borgarello, E.; Harris, R.; Serpone, N. Photochemical Deposition and Photorecovery of Gold Using Semiconductor Dispersions. A Practical Application of Photocatalysis. Photochem. Depos. Photorecovery Gold Using Semicond. Dispers. Pract. Appl. Photocatal. 1985, 9, 743–747. [Google Scholar]
  48. Kraeutler, B.; Bard, A.J. Heterogeneous Photocatalytic Preparation of Supported Catalysts. Photodeposition of Platinum on Titanium Dioxide Powder and Other Substrates. J. Am. Chem. Soc. 1978, 100, 4317–4318. [Google Scholar] [CrossRef]
  49. Herrmann, J.-M.; Disdier, J.; Pichat, P. Photocatalytic Deposition of Silver on Powder Titania: Consequences for the Recovery of Silver. J. Catal. 1988, 113, 72–81. [Google Scholar] [CrossRef]
  50. Choi, W.; Termin, A.; Hoffmann, M.R. The Role of Metal Ion Dopants in Quantum-Sized TiO2: Correlation between Photoreactivity and Charge Carrier Recombination Dynamics. J. Phys. Chem. 1994, 98, 13669–13679. [Google Scholar] [CrossRef]
  51. Subramanian, V.; Wolf, E.; Kamat, P.V. Semiconductor−Metal Composite Nanostructures. to What Extent Do Metal Nanoparticles Improve the Photocatalytic Activity of TiO2 Films? J. Phys. Chem. B 2001, 105, 11439–11446. [Google Scholar] [CrossRef]
  52. Li, X.Z.; Li, F.B. Study of Au/Au3+-TiO2 Photocatalysts toward Visible Photooxidation for Water and Wastewater Treatment. Environ. Sci. Technol. 2001, 35, 2381–2387. [Google Scholar] [CrossRef]
  53. Hummers, W.S.; Offeman, R.E. Preparation of Graphitic Oxide. J. Am. Chem. Soc. 1958, 80, 1339. [Google Scholar] [CrossRef]
  54. Nasiruddin Khan, M.; Sarwar, A. Determination of Points of Zero Charge of Natural and Treated Adsorbents. Surf. Rev. Lett. 2007, 14, 461–469. [Google Scholar] [CrossRef]
Figure 1. XRD diffractions of (3%)Ag-TiO2/rGO/HNT.
Catalysts 13 00225 g001
Figure 2. FTIR spectra of different samples.
Catalysts 13 00225 g002
Figure 3. (a) N2 adsorption–desorption isotherm of (3%)Ag-TiO2/rGO/HNT. (b) Pore size distribution of (3%)Ag-TiO2/rGO/HNT.
Catalysts 13 00225 g003aCatalysts 13 00225 g003b
Figure 4. SEM images (A,B) of (3%)Ag-TiO2/rGO/HNT.
Catalysts 13 00225 g004
Figure 5. EDX results of (3%)Ag-TiO2/rGO/HNT.
Catalysts 13 00225 g005
Figure 6. Transformed Kubelka-Munk (from diffuse reflectance spectra) with energy of excitation source for (1%)Ag-TiO2/rGO/HNT and (3%)Ag-TiO2/rGO/HNT.
Catalysts 13 00225 g006
Figure 7. Comparison of photocatalytic activity of varied materials.
Catalysts 13 00225 g007
Figure 8. (a) Kinetic investigation of CIP degradation with the presence of (1%)Ag-TiO2/rGO/HNT. (b) Kinetic investigation of CIP degradation with the presence of (3%)Ag-TiO2/rGO/HNT.
Catalysts 13 00225 g008aCatalysts 13 00225 g008b
Figure 9. Point of zero charge (pHPZC) of Ag-TiO2/rGO/HNT.
Catalysts 13 00225 g009
Figure 10. Effect of pH to conversion of removing CIP.
Catalysts 13 00225 g010
Figure 11. Effect of different scavengers on CIP conversion: p-benzoquinone (•O2 trap), sodium ethylene (h+ trap), isopropyl alcohol (•OH trap), dimethyl sulfoxide (e trap).
Catalysts 13 00225 g011
Figure 12. TOC before and after the photodegradation of CIP.
Catalysts 13 00225 g012
Figure 13. Schematic diagram of Ag-TiO2/rGO/HNT synthesis.
Catalysts 13 00225 g013
Table 1. Kinetic equation of CIP by using (3%)Ag-TiO2/rGO/HNT.
Pseudo First OrderPseudo Second Order
SampleLinear equationkR2Linear equationkR2
2.5 mgy = 0.0004x + 1.00180.00040.989y = 7 × 10⁻⁵x + 0.08490.000070.9933
5 mgy = 0.0007x + 0.98480.00070.9991y = 0.0001x + 0.08020.00010.9967
10 mgy = 0.0013x + 1.49920.00130.9665y = 0.0003x + 0.10880.00030.9908
15 mgy = 0.0011x + 1.35740.00110.9945y = 0.0004x + 0.12790.00040.9972
Table 2. Experimental results of pH based on drift method.
Initial pH05.077.088.9910.97
Final pH07.017.848.0210.66
Table 3. Ionization energy and Electron affinity of the elements [41,42,43,44].
Ag (eV)Ti (eV)O (eV)
EIE7.66.8213.62
EEA1.30.0751.461
Table 4. Result of ECB and EVB of (1%)AgTiO2, (3%)AgTiO2 and TiO2.
(1%)Ag-TiO2(3%)Ag-TiO2TiO2
ECB−0.445−0.43−0.3
EVB2.1652.322.9
Disclaimer/Publisher’s Note: The statements, opinions and data contained in all publications are solely those of the individual author(s) and contributor(s) and not of MDPI and/or the editor(s). MDPI and/or the editor(s) disclaim responsibility for any injury to people or property resulting from any ideas, methods, instructions or products referred to in the content.

