
Evaluating Second-Generation Deep Learning Technique for Noise Reduction in Myocardial T1-Mapping Magnetic Resonance Imaging


Abstract
1. Introduction
2. Materials and Methods
2.1. Patient Study Population
2.2. CMR Patient Protocol
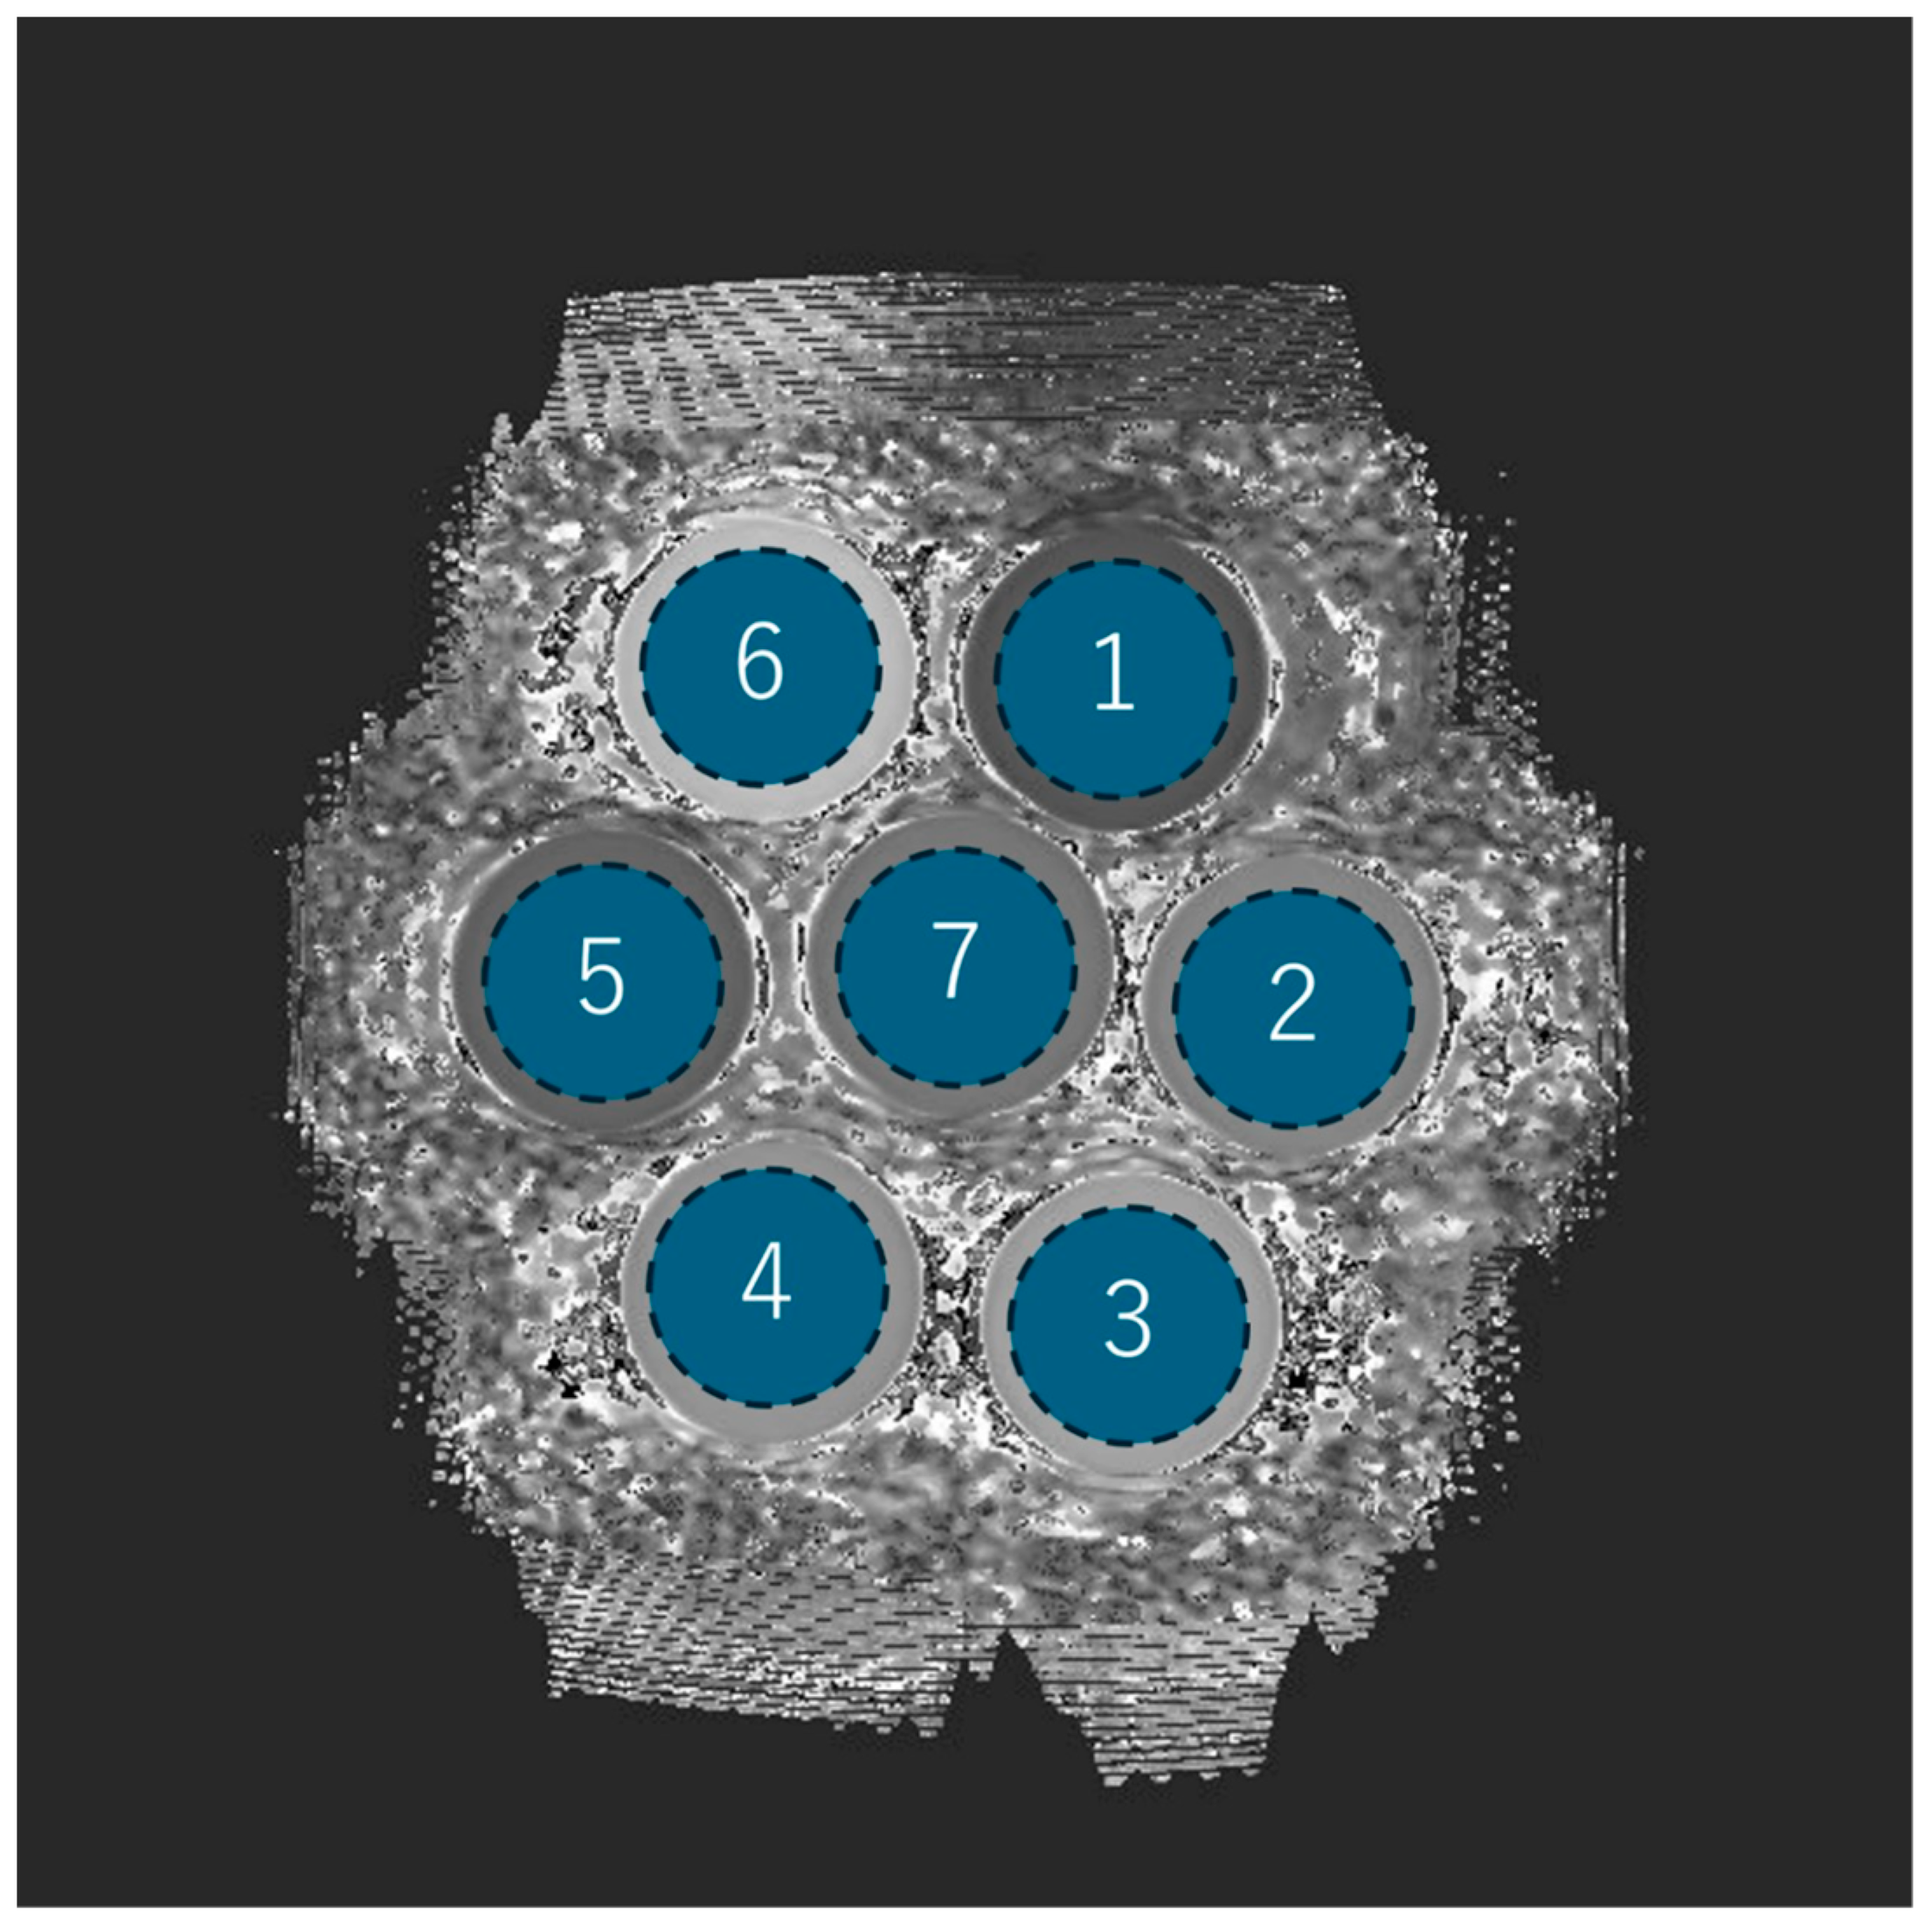
2.3. Phantom Configuration and Scan Protocol
2.4. Quantitative Image Evaluation Methods
2.5. Statistical Analysis
3. Results
3.1. Patient Study
3.2. Phantom Study
4. Discussion
5. Conclusions
Author Contributions
Funding
Institutional Review Board Statement
Informed Consent Statement
Data Availability Statement
Conflicts of Interest
Abbreviations
| AF | atrial fibrillation |
| AFD | Anderson–Fabry disease |
| CMR | cardiac magnetic resonance imaging |
| CNR | contrast-to-noise ratio |
| CA | cardiac amyloidosis |
| CV | coefficient of variation |
| DCM | dilated cardiomyopathy |
| DLR | deep learning-based reconstruction |
| DWI | diffusion-weighted imaging |
| ECV | extracellular volume |
| ICC | Intraclass correlation coefficient |
| IQR | interquartile range |
| LGE | late gadolinium enhancement |
| MOLLI | modified Look-Locker inversion recovery |
| NIDCM | non-ischemic dilated cardiomyopathy |
| PVI | pulmonary vein isolation |
| RF | radio frequency |
| ROI | region of interest |
| SD | standard deviation |
| SNR | signal-to-noise ratio |
| SR-DLR | super-resolution deep learning-based reconstruction |
| WHCMRA | whole-heart coronary magnetic resonance angiography |
References
- Haaf, P.; Garg, P.; Messroghli, D.R.; Broadbent, D.A.; Greenwood, J.P.; Plein, S. Cardiac T1 Mapping and Extracellular Volume (ECV) in clinical practice: A comprehensive review. J. Cardiovasc. Magn. Reson. 2016, 18, 89. [Google Scholar] [CrossRef] [PubMed]
- Cameron, D.; Vassiliou, V.S.; Higgins, D.M.; Gatehouse, P.D. Towards accurate and precise T (1) and extracellular volume mapping in the myocardium: A guide to current pitfalls and their solutions. Magn. Reson. Mater. Phys. Biol. Med. 2018, 31, 143–163. [Google Scholar] [CrossRef] [PubMed]
- Nakamori, S.; Dohi, K.; Ishida, M.; Goto, Y.; Imanaka-Yoshida, K.; Omori, T.; Goto, I.; Kumagai, N.; Fujimoto, N.; Ichikawa, Y.; et al. Native T1 Mapping and Extracellular Volume Mapping for the Assessment of Diffuse Myocardial Fibrosis in Dilated Cardiomyopathy. JACC Cardiovasc. Imaging 2018, 11, 48–59. [Google Scholar] [CrossRef] [PubMed]
- Oda, S.; Kidoh, M.; Morita, K.; Takashio, S.; Tsujita, K. Histogram features of Fabry disease with pseudonormalization in native T1 mapping. Eur. Heart J.-Cardiovasc. Imaging 2021, 22, e23. [Google Scholar] [CrossRef]
- Yang, J.; Wang, F.; Wang, Z.; Zhang, W.; Xie, L.; Wang, L. Evaluation of late gadolinium enhancement cardiac MRI using deep learning reconstruction. Acta Radiol. 2023, 64, 2714–2721. [Google Scholar] [CrossRef]
- Lu, X.; Liu, W.V.; Yan, Y.; Yang, W.; Liu, C.; Gong, W.; Quan, G.; Jiang, J.; Yuan, L.; Zha, Y. Evaluation of deep learning-based reconstruction late gadolinium enhancement images for identifying patients with clinically unrecognized myocardial infarction. BMC Med. Imaging 2024, 24, 127. [Google Scholar]
- Kariyasu, T.; Machida, H.; Takahashi, S.; Fukushima, K.; Yoshioka, T.; Yokoyama, K. Denoising using deep-learning-based reconstruction for whole-heart coronary MRA with sub-millimeter isotropic resolution at 3 T: A volunteer study. Diagn. Interv. Radiol. 2022, 28, 470–477. [Google Scholar] [CrossRef]
- van der Velde, N.; Hassing, H.C.; Bakker, B.J.; Wielopolski, P.A.; Lebel, R.M.; Janich, M.A.; Kardys, I.; Budde, R.P.; Hirsch, A. Improvement of late gadolinium enhancement image quality using a deep learning-based reconstruction algorithm and its influence on myocardial scar quantification. Eur. Radiol. 2021, 31, 3846–3855. [Google Scholar] [CrossRef]
- Matsuo, K.; Nakaura, T.; Morita, K.; Uetani, H.; Nagayama, Y.; Kidoh, M.; Hokamura, M.; Yamashita, Y.; Shinoda, K.; Ueda, M.; et al. Feasibility study of super-resolution deep learning-based reconstruction using k-space data in brain diffusion-weighted images. Neuroradiology 2023, 65, 1619–1629. [Google Scholar] [CrossRef]
- de Boer, R.A.; De Keulenaer, G.; Bauersachs, J.; Brutsaert, D.; Cleland, J.G.; Diez, J.; Du, X.J.; Ford, P.; Heinzel, F.R.; Lipson, K.E.; et al. Towards better definition, quantification and treatment of fibrosis in heart failure. A scientific roadmap by the Committee of Translational Research of the Heart Failure Association (HFA) of the European Society of Cardiology. Eur. J. Heart Fail. 2019, 21, 272–285. [Google Scholar] [CrossRef]
- Piek, A.; De Boer, R.A.; Silljé, H.H.W. The fibrosis-cell death axis in heart failure. Heart Fail. Rev. 2016, 21, 199–211. [Google Scholar] [CrossRef] [PubMed]
- Messroghli, D.R.; Moon, J.C.; Ferreira, V.M.; Grosse-Wortmann, L.; He, T.; Kellman, P.; Mascherbauer, J.; Nezafat, R.; Salerno, M.; Schelbert, E.B.; et al. Clinical recommendations for cardiovascular magnetic resonance mapping of T1, T2, T2* and extracellular volume: A consensus statement by the Society for Cardiovascular Magnetic Resonance (SCMR) endorsed by the European Association for Cardiovascular Imaging (EACVI). J. Cardiovasc. Magn. Reson. 2017, 19, 75. [Google Scholar] [PubMed]
- Martinez-Naharro, A.; Patel, R.; Kotecha, T.; Karia, N.; Ioannou, A.; Petrie, A.; Chacko, L.A.; Razvi, Y.; Ravichandran, S.; Brown, J.; et al. Cardiovascular magnetic resonance in light-chain amyloidosis to guide treatment. Eur. Heart J. 2022, 43, 4722–4735. [Google Scholar] [CrossRef] [PubMed]
- Azuma, M.; Kato, S.; Sekii, R.; Kodama, S.; Kinoshita, K.; Suzurikawa, K.; Kagimoto, M.; Nakayama, N.; Iguchi, K.; Fukui, K.; et al. Extracellular volume fraction by T1 mapping predicts improvement of left ventricular ejection fraction after catheter ablation in patients with non-ischemic dilated cardiomyopathy and atrial fibrillation. Int. J. Cardiovasc. Imaging 2021, 37, 2535–2543. [Google Scholar] [CrossRef]
- Pan, J.A.; Kerwin, M.J.; Salerno, M. Native T1 Mapping, Extracellular Volume Mapping, and Late Gadolinium Enhancement in Cardiac Amyloidosis: A Meta-Analysis. JACC Cardiovasc. Imaging 2020, 13, 1299–1310. [Google Scholar] [CrossRef] [PubMed]
- Karamitsos, T.D.; Piechnik, S.K.; Banypersad, S.M.; Fontana, M.; Ntusi, N.B.; Ferreira, V.M.; Whelan, C.J.; Myerson, S.G.; Robson, M.D.; Hawkins, P.N.; et al. Noncontrast T1 mapping for the diagnosis of cardiac amyloidosis. JACC Cardiovasc. Imaging 2013, 6, 488–497. [Google Scholar] [CrossRef]
- Bulluck, H.; Maestrini, V.; Rosmini, S.; Abdel-Gadir, A.; Treibel, T.A.; Castelletti, S.; Bucciarelli-Ducci, C.; Manisty, C.; Moon, J.C. Myocardial T1 mapping ― Hope or Hype? Circ. J. 2015, 79, 487–494. [Google Scholar] [CrossRef]
- Garg, P.; Saunders, L.C.; Swift, A.J.; Wild, J.M.; Plein, S. Role of cardiac T1 mapping and extracellular volume in the assessment of myocardial infarction. Anatol. J. Cardiol. 2018, 19, 404–411. [Google Scholar] [CrossRef]
- Morioka, M.; Takashio, S.; Nakashima, N.; Nishi, M.; Fujiyama, A.; Hirakawa, K.; Hanatani, S.; Usuku, H.; Yamamoto, E.; Kidoh, M.; et al. Correlation Between Cardiac Images, Biomarkers, and Amyloid Load in Wild-Type Transthyretin Amyloid Cardiomyopathy. J. Am. Heart Assoc. 2022, 11, e024717. [Google Scholar] [CrossRef]
- Martinez-Naharro, A.; Kotecha, T.; Norrington, K.; Boldrini, M.; Rezk, T.; Quarta, C.; Treibel, T.A.; Whelan, C.J.; Knight, D.S.; Kellman, P.; et al. Native T1 and Extracellular Volume in Transthyretin Amyloidosis. JACC Cardiovasc. Imaging 2019, 12, 810–819. [Google Scholar] [CrossRef]
- Maurer, M.S.; Schwartz, J.H.; Gundapaneni, B.; Elliott, P.M.; Merlini, G.; Waddington-Cruz, M.; Kristen, A.V.; Grogan, M.; Witteles, R.; Damy, T.; et al. Tafamidis Treatment for Patients with Transthyretin Amyloid Cardiomyopathy. N. Engl. J. Med. 2018, 379, 1007–1016. [Google Scholar] [CrossRef] [PubMed]
- Kato, S.; Azuma, M.; Horita, N.; Utsunomiya, D. Monitoring the Efficacy of Tafamidis in ATTR Cardiac Amyloidosis by MRI-ECV: A Systematic Review and Meta-Analysis. Tomography 2024, 10, 1303–1311. [Google Scholar] [CrossRef] [PubMed]
- Ioannou, A.; Patel, R.K.; Martinez-Naharro, A.; Razvi, Y.; Porcari, A.; Rauf, M.U.; Bolhuis, R.E.; Fernando-Sayers, J.; Virsinskaite, R.; Bandera, F.; et al. Tracking Treatment Response in Cardiac Light-Chain Amyloidosis with Native T1 Mapping. JAMA Cardiol. 2023, 8, 848. [Google Scholar] [CrossRef] [PubMed]
- Arbelo, E.; Protonotarios, A.; Gimeno, J.R.; Arbustini, E.; Barriales-Villa, R.; Basso, C.; Bezzina, C.R.; Biagini, E.; Blom, N.A.; de Boer, R.A.; et al. 2023 ESC Guidelines for the management of cardiomyopathies. Eur. Heart J. 2023, 44, 3503–3626. [Google Scholar]
- Ponsiglione, A.; Gambardella, M.; Green, R.; Cantoni, V.; Nappi, C.; Ascione, R.; De Giorgi, M.; Cuocolo, R.; Pisani, A.; Petretta, M.; et al. Cardiovascular magnetic resonance native T1 mapping in Anderson-Fabry disease: A systematic review and meta-analysis. J. Cardiovasc. Magn. Reson. 2022, 24, 31. [Google Scholar] [CrossRef]
- Ponsiglione, A.; De Giorgi, M.; Ascione, R.; Nappi, C.; Sanduzzi, L.; Pisani, A.; Dell’Aversana, S.; Cuocolo, A.; Imbriaco, M. Advanced CMR Techniques in Anderson-Fabry Disease: State of the Art. Diagnostics 2023, 13, 2598. [Google Scholar] [CrossRef]
- Nordin, S.; Kozor, R.; Vijapurapu, R.; Augusto, J.B.; Knott, K.D.; Captur, G.; Treibel, T.A.; Ramaswami, U.; Tchan, M.; Geberhiwot, T.; et al. Myocardial Storage, Inflammation, and Cardiac Phenotype in Fabry Disease After One Year of Enzyme Replacement Therapy. Circ. Cardiovasc. Imaging 2019, 12, e009430. [Google Scholar] [CrossRef]
- Averbuch, T.; White, J.A.; Fine, N.M. Anderson-Fabry disease cardiomyopathy: An update on epidemiology, diagnostic approach, management and monitoring strategies. Front. Cardiovasc. Med. 2023, 10, 1152568. [Google Scholar] [CrossRef] [PubMed]
- Sohns, C.; Marrouche, N.F. Atrial fibrillation and cardiac fibrosis. Eur. Heart J. 2020, 41, 1123–1131. [Google Scholar] [CrossRef]
- Marrouche, N.F.; Wazni, O.; McGann, C.; Greene, T.; Dean, J.M.; Dagher, L.; Kholmovski, E.; Mansour, M.; Marchlinski, F.; Wilber, D.; et al. Effect of MRI-Guided Fibrosis Ablation vs Conventional Catheter Ablation on Atrial Arrhythmia Recurrence in Patients With Persistent Atrial Fibrillation. JAMA 2022, 327, 2296. [Google Scholar] [CrossRef]


| Characteristics | |
|---|---|
| Patients, n | 36 |
| Female | 17(19) |
| Age, mean ± SD (range), y | 61 ± 17 (19–81) |
| Indication for examination, n | |
| Myocardial infarction | 10 |
| Heart failure | 11 |
| Hypertrophic cardiomyopathy | 7 |
| Dilated cardiomyopathy | 2 |
| Cardiac sarcoidosis | 4 |
| Cardiac Fabry’s disease | 1 |
| Pulmonary hypertension | 1 |
| SR-DLR (−) | SR-DLR (+) | p-Value | |
|---|---|---|---|
| native T1 | |||
| Mean (ms) | 1000.2 (974.3–1013.6) | 1004.5 (977.2–1015.8) | 1.000 |
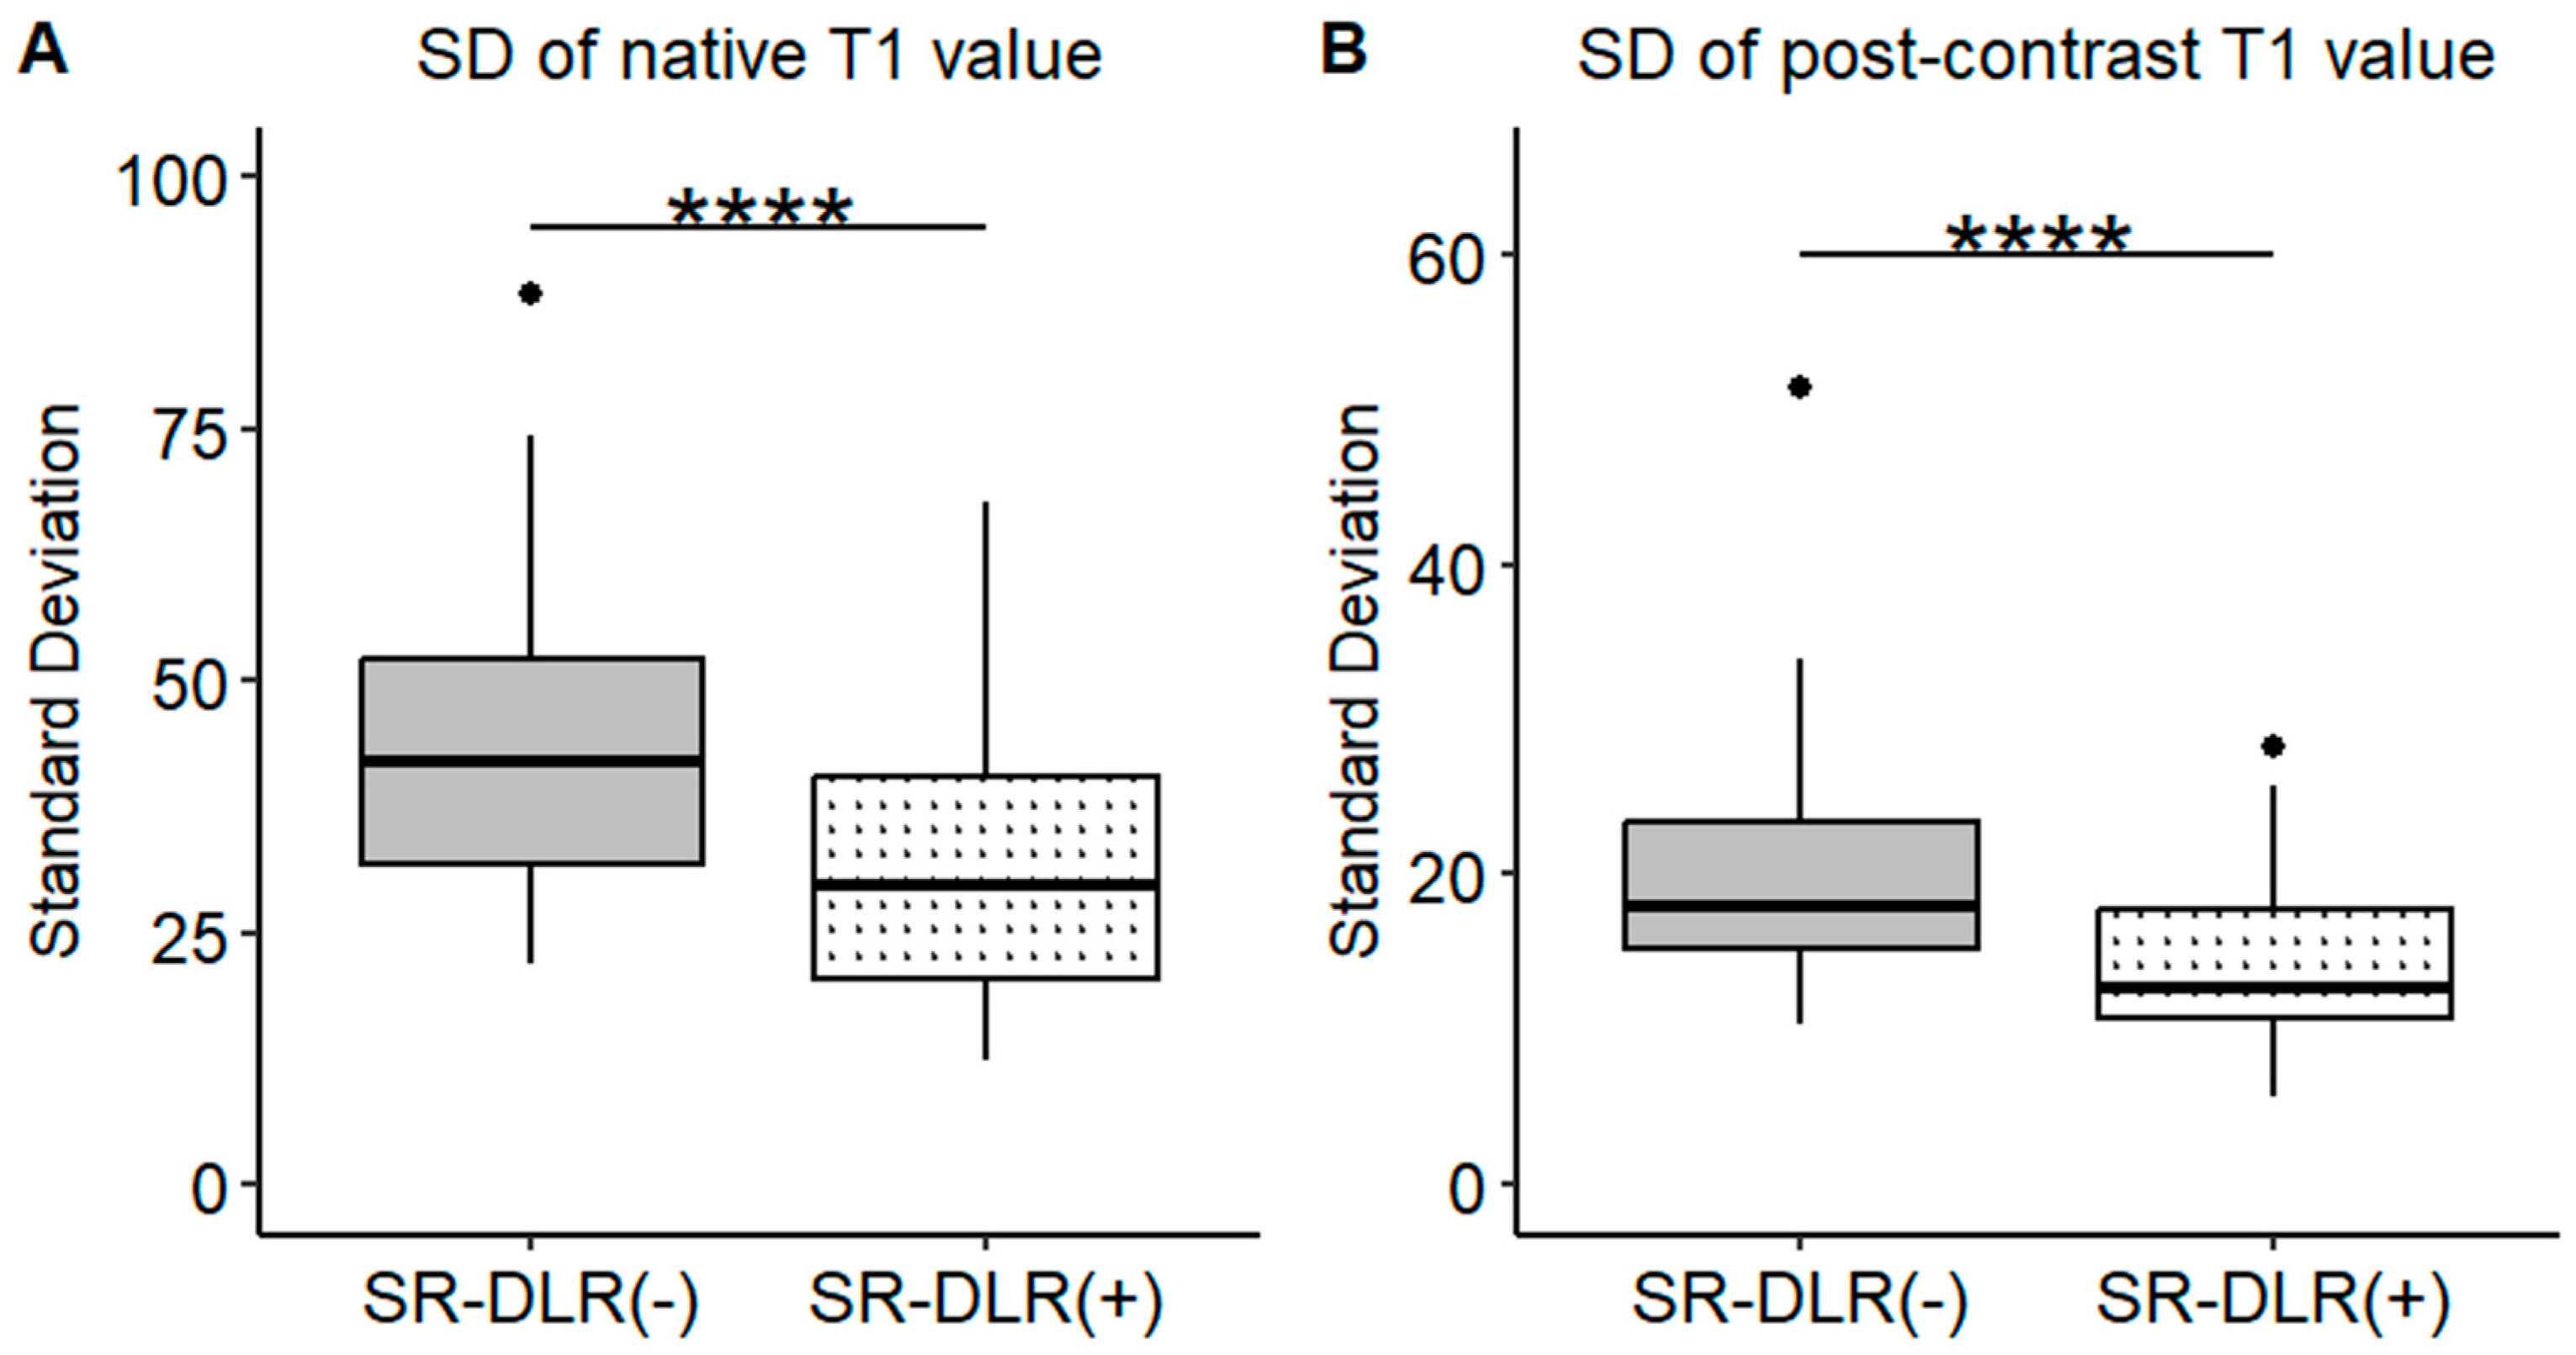
| SD (ms) | 44.0 (38.6–49.4) | 31.8 (26.9–36.7) | 0.001 |
| CV (%) | 4.4 (3.9–4.9) | 3.3 (2.8–3.8) | |
| post-contrast T1 | |||
| Mean (ms) | 556.4 (536.4–592.7) | 563.8 (537.1–591.7) | 0.831 |
| SD (ms) | 20.0 (17.2–22.4) | 14.4 (12.7–16.2) | 0.001 |
| CV (%) | 3.5 (3.1–4.0) | 2.6 (2.3–2.9) |
| Phantom Number | SR-DLR (−) | SR-DLR (+) | p-Value |
|---|---|---|---|
| 1 | |||
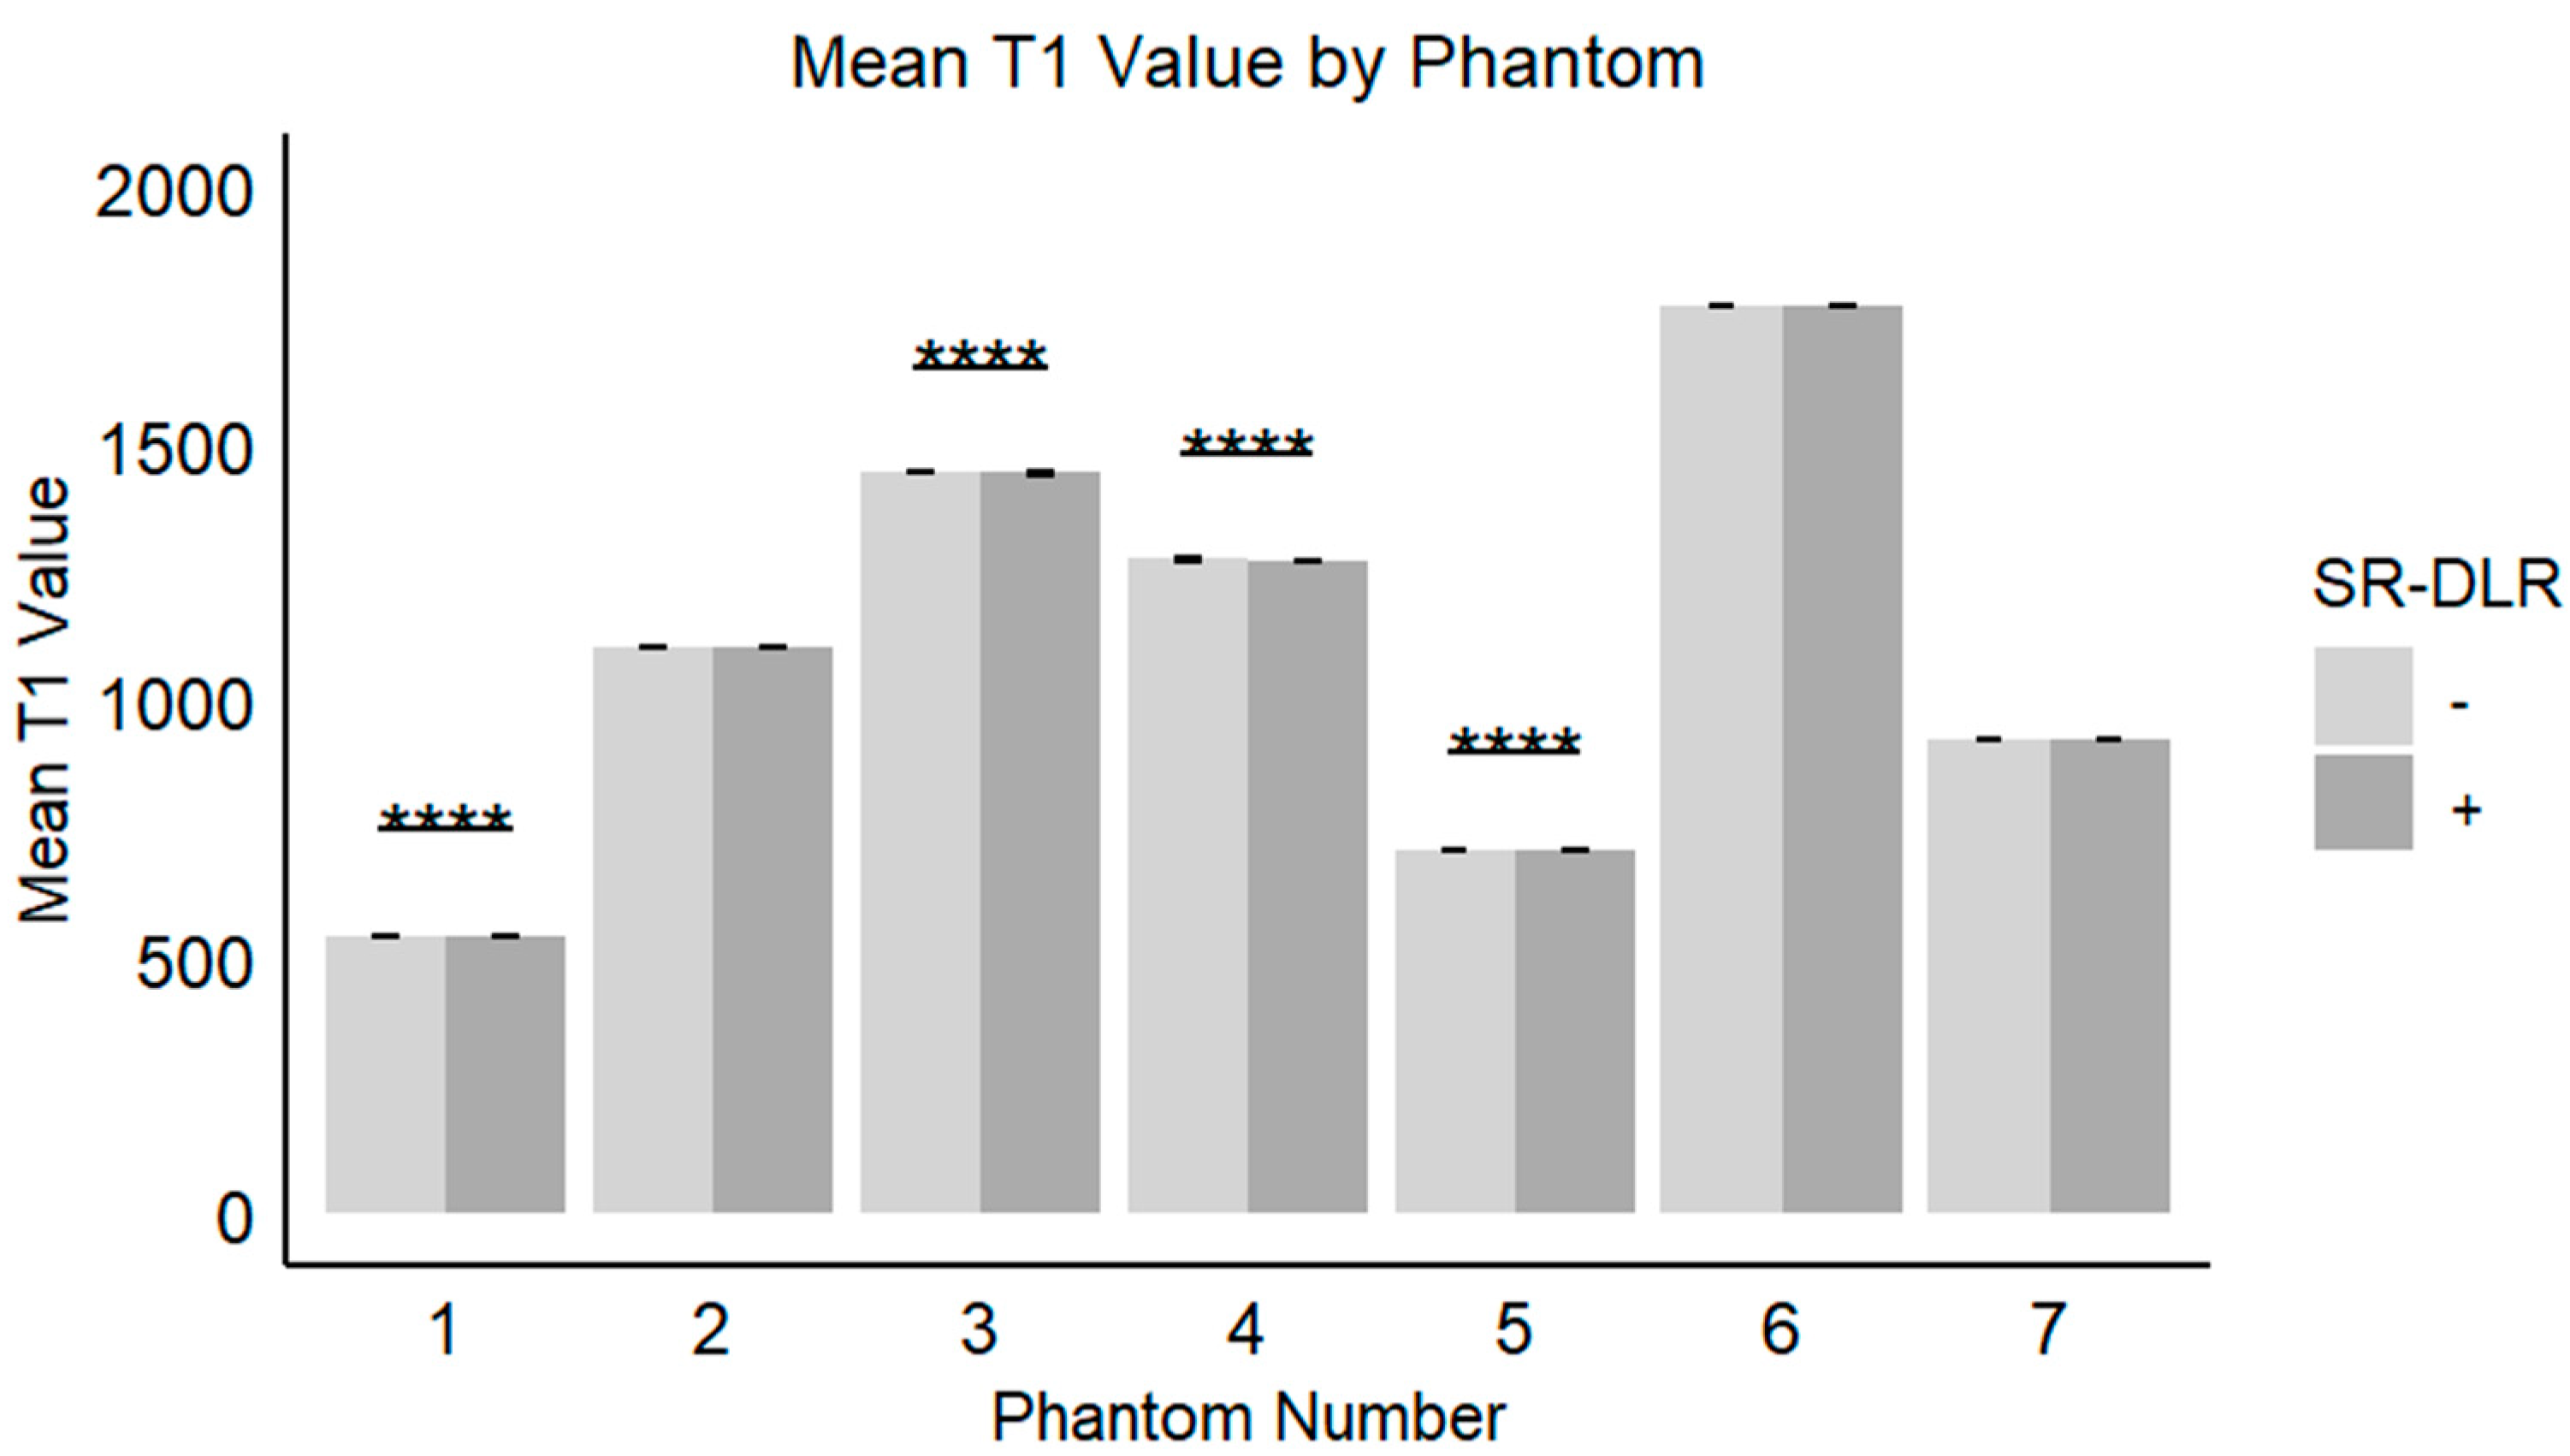
| Mean (ms) | 541.9 (541.4–542.3) | 541.3 (540.8–541.7) | <0.001 |
| SD (ms) | 7.6 (7.4, 7.7) | 4.4 (4.3, 4.5) | <0.001 |
| CV (%) | 1.40 (1.38, 1.41) | 0.81 (0.79, 0.82) | |
| 2 | |||
| Mean (ms) | 1102.5 (1101.8–1103.3) | 1102.1 (1101.5–1102.7) | 0.097 |
| SD (ms) | 13.4 (13.2, 13.7) | 8.6 (8.4–8.8) | <0.001 |
| CV (%) | 1.22 (1.20, 1.24) | 0.78 (0.76, 0.79) | |
| 3 | |||
| Mean (ms) | 1442.4 (1441.8–1443.2) | 1441.6 (1441.0–1442.4) | 0.003 |
| SD (ms) | 14.3 (14.1, 14.5) | 9.7 (9.5, 9.9) | <0.001 |
| CV (%) | 0.99 (0.98, 1.00) | 0.67 (0.66, 0.68) | |
| 4 | |||
| Mean (ms) | 1274.2 (1273.4–1274.8) | 1273.5 (1272.7–11274.2) | 0.019 |
| SD (ms) | 12.6 (12.4, 12.8) | 8.3 (8.1, 8.5) | <0.001 |
| CV (%) | 0.99 (0.98, 1.00) | 0.65 (0.64, 0.67) | |
| 5 | |||
| Mean (ms) | 707.1 (706.6–707.5) | 706.6 (706.0–706.9) | 0.007 |
| SD (ms) | 10.1 (9.9, 10.2) | 6.5 (6.4, 6.7) | <0.001 |
| CV (%) | 1.42 (1.40, 1.44) | 0.92 (0.91, 0.94) | |
| 6 | |||
| Mean (ms) | 1767.1 (1766.0–1768.4) | 1767.1 (1766.0–1768.8) | 0.896 |
| SD (ms) | 23.8 (23.5, 24.1) | 15.1 (14.8, 15.5) | <0.001 |
| CV (%) | 1.35 (1.33, 1.37) | 0.86 (0.83, 0.88) | |
| 7 | |||
| Mean (ms) | 923.4 (922.6–923.8) | 923.1 (922.3–923.6) | 0.221 |
| SD (ms) | 11.3 (11.1, 11.5) | 7.3 (7.0, 7.5) | <0.001 |
| CV (%) | 1.22 (1.20, 1.25) | 0.79 (0.77, 0.81) |
Disclaimer/Publisher’s Note: The statements, opinions and data contained in all publications are solely those of the individual author(s) and contributor(s) and not of MDPI and/or the editor(s). MDPI and/or the editor(s) disclaim responsibility for any injury to people or property resulting from any ideas, methods, instructions or products referred to in the content. |
© 2025 by the authors. Licensee MDPI, Basel, Switzerland. This article is an open access article distributed under the terms and conditions of the Creative Commons Attribution (CC BY) license (https://creativecommons.org/licenses/by/4.0/).
Share and Cite
Sawamura, S.; Kato, S.; Yasuda, N.; Iwahashi, T.; Hirano, T.; Kato, T.; Utsunomiya, D. Evaluating Second-Generation Deep Learning Technique for Noise Reduction in Myocardial T1-Mapping Magnetic Resonance Imaging. Diseases 2025, 13, 157. https://doi.org/10.3390/diseases13050157
Sawamura S, Kato S, Yasuda N, Iwahashi T, Hirano T, Kato T, Utsunomiya D. Evaluating Second-Generation Deep Learning Technique for Noise Reduction in Myocardial T1-Mapping Magnetic Resonance Imaging. Diseases. 2025; 13(5):157. https://doi.org/10.3390/diseases13050157
Chicago/Turabian StyleSawamura, Shungo, Shingo Kato, Naofumi Yasuda, Takumi Iwahashi, Takamasa Hirano, Taiga Kato, and Daisuke Utsunomiya. 2025. "Evaluating Second-Generation Deep Learning Technique for Noise Reduction in Myocardial T1-Mapping Magnetic Resonance Imaging" Diseases 13, no. 5: 157. https://doi.org/10.3390/diseases13050157
APA StyleSawamura, S., Kato, S., Yasuda, N., Iwahashi, T., Hirano, T., Kato, T., & Utsunomiya, D. (2025). Evaluating Second-Generation Deep Learning Technique for Noise Reduction in Myocardial T1-Mapping Magnetic Resonance Imaging. Diseases, 13(5), 157. https://doi.org/10.3390/diseases13050157