
Risk of Insulin Resistance: Comparison of the Commerce vs. Industry Sector and Associated Variables
 , , , , and
Abstract
1. Introduction
- TyG index (Triglyceride-Glucose index) [41]: This marker has proven to be a practical and cost-effective substitute for detecting insulin resistance, with good correlation to the hyperinsulinemic clamp.
- METS-IR (Metabolic Score for Insulin Resistance) [42]: This index incorporates BMI, glucose, triglycerides, and HDL cholesterol into its formula and has shown high predictive capacity for identifying IR across diverse populations.
- SPISE (Single Point Insulin Sensitivity Estimator) [43]: Designed primarily for adolescents and young adults, it is based on triglycerides, HDL cholesterol, and body mass index. It has demonstrated utility in estimating insulin sensitivity without requiring insulin measurements, making it especially useful for large cohorts or low-resource settings.
2. Methods
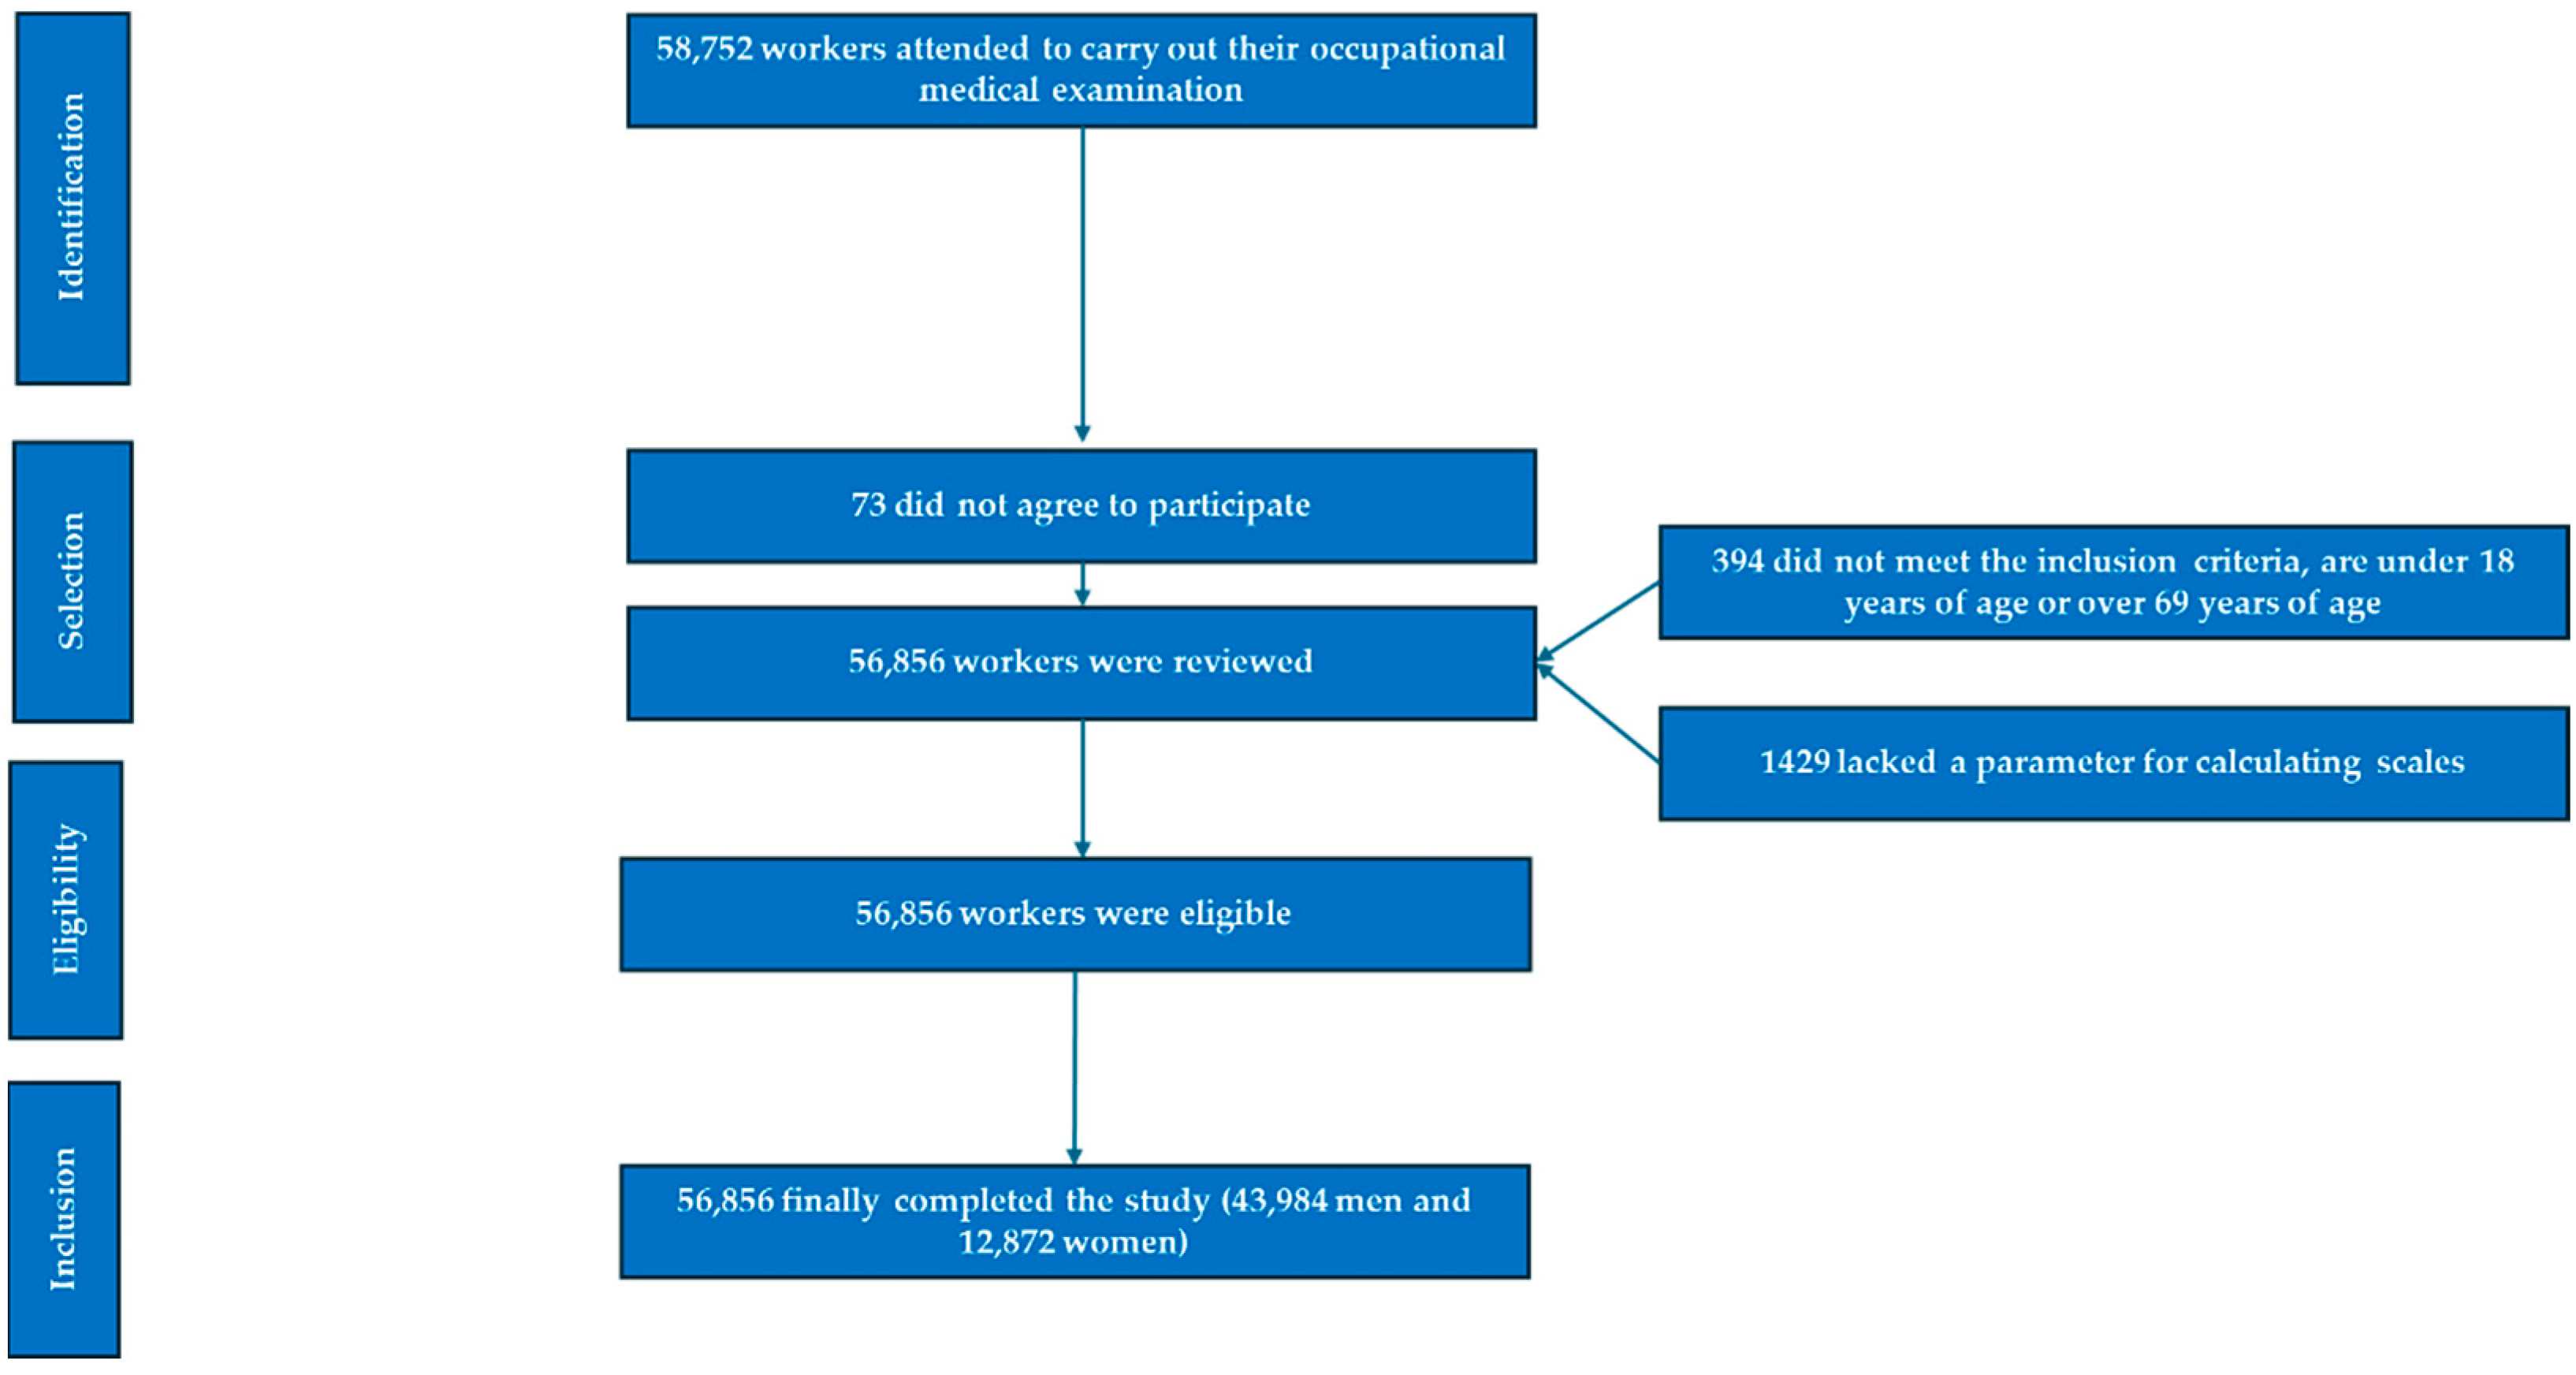
2.1. Study Design and Population
2.2. Eligibility Criteria
- Be between 18 and 69 years of age.
- Provide informed consent for participation.
- Explicitly authorize the use of their data for research purposes.
- Be employed by companies included in the study and not be on medical leave at the time of assessment.
2.3. Data Collection
- Structured Clinical Interview: Sociodemographic variables (age, sex, education level) and health-related behaviors such as smoking, dietary patterns, and physical activity were recorded.
- Physical and Clinical Measurements: Anthropometric data (weight, height, waist and hip circumferences) and blood pressure parameters (systolic and diastolic) were collected.
- Biochemical Analyses: Blood lipid profiles and glucose levels were assessed.
- Weight and height: Measured with the subject barefoot and wearing only underwear, standing upright, using a SECA 700 scale (SECA, Chino, CA, USA) and a SECA 220 stadiometer (SECA, Chino, CA, USA).
- Body circumferences: Measured using SECA measuring tape (SECA, Chino, CA, USA). Waist circumference was measured at the level of the last floating rib, while hip circumference was taken at the widest part of the buttocks. Both measurements were performed with the subject standing and abdomen relaxed.
- Blood pressure: Measured with an automatic sphygmomanometer OMRON-M3 (OMRON, Osaka, Japan), with the participant seated and after a minimum of ten minutes of rest. Three consecutive readings were taken at one-minute intervals, and the average of the three was recorded.
- Blood samples: Collected via venipuncture after a minimum 12-h fast. The samples were processed as follows: An 8.5 mL BD SST II Vacutainer serum tube with gel separator (reference BD 366468) was used. The samples were transported to the laboratory in a refrigerated container (between 5 and 10 degrees Celsius). Upon arrival, the samples were centrifuged within two hours of collection and immediately analyzed using an automated analyzer [58,59]. LDL was calculated using the Friedewald formula, except in cases with triglycerides ≥400 mg/dL, for which direct measurement was used [60]. All biochemical variables are reported in milligrams per deciliter (mg/dL).
2.3.1. Operational Definitions of Variables
- Biological sex: Classified as male or female.
- Education level: Grouped into two categories: basic education (primary) and higher education (secondary or tertiary).
- Tobacco use: Individuals were considered smokers if they had smoked daily in the past 30 days or had quit smoking within the last 12 months.
- Adherence to the Mediterranean diet: Assessed using a 14-item binary questionnaire (score 0–1). A score of 9 or higher indicated good adherence [61].
- Physical activity: Measured using the International Physical Activity Questionnaire (IPAQ), which evaluates the frequency, duration, and intensity of activities performed during the previous seven days [62].
2.3.2. Insulin Resistance Risk Scales
2.4. Statistical Analysis
3. Results
4. Discussion
- TyG and TyG-BMI were highly sensitive to adiposity and dyslipidemia, proving especially useful in identifying risk among overweight individuals and those with low physical activity.
- METS-IR provided a more comprehensive perspective by incorporating HDL cholesterol.
- SPISE, though less commonly used, yielded relevant information on insulin sensitivity in younger and leaner individuals.
4.1. Strengths of the Study
- Large sample size and sectoral representativeness: The study is based on a sample of over 56,000 workers from the commerce and industrial sectors, providing robust statistical power and allowing for reliable comparisons between groups. This broad scope facilitates the identification of genuine differences in IR risk and enhances the generalizability of findings within the labor context.
- Equitable inclusion of both sexes and a wide age range: The sample includes both men and women aged 18 to 69, enabling analysis of sex- and age-related differences and tracking the evolution of metabolic risk throughout the working life cycle.
- Simultaneous use of multiple validated IR indices: The combined use of TyG, TyG-BMI, METS-IR, and SPISE provides a more comprehensive evaluation of metabolic risk. Each index captures different IR-related dimensions (dyslipidemia, adiposity, insulin sensitivity), increasing the validity of findings and minimizing bias associated with reliance on a single marker.
- Comparative approach by economic sector: The sector-specific analysis (commerce vs. industry) represents a novel contribution. Few studies have explored how occupational type and structural characteristics (shifts, physical effort, stress, environment) relate to IR, lending added value to this research in the field of occupational health.
- Rigorous statistical control of confounding factors: The use of adjusted multinomial logistic regression models allows for assessment of independent associations while controlling for age, sex, education, physical activity, diet, and smoking—strengthening the reliability of the observed associations.
- Detailed assessment of lifestyle variables: The study incorporates key health behaviors (Mediterranean diet adherence, physical activity, smoking), often underrepresented in occupational health research, enabling the identification of meaningful associations between lifestyle and metabolic risk in workplace settings.
- Practical applicability to public health and occupational medicine: The indices employed are simple, cost-effective, and non-invasive, making the results easily translatable to screening, monitoring, and prevention programs within companies or organizations. This enhances the translational value of the study and its potential for large-scale interventions.
4.2. Study Limitations
- Cross-sectional design of the study prevents inferring causal relationships between the variables analyzed and IR rates. It would be interesting to conduct longitudinal studies to examine how IR evolves in these groups over time.
- Indirect measurement of IR: Although validated and widely used indices such as TyG, METS-IR, and SPISE were employed, they are indirect proxies and do not replace gold-standard methods like the hyperinsulinemic-euglycemic clamp.
- Self-reported data: Key variables such as physical activity, dietary adherence, and smoking status were self-reported, potentially introducing recall or social desirability bias.
- The pre- or postmenopausal status of the women was not recorded, which may influence glucose metabolism, body fat distribution, and insulin resistance.
- Lack of control for other occupational variables: Factors such as shift type, physical workload, occupational stress, or sleep quality were not included, despite their potential influence on metabolism and IR risk modulation.
- Limited generalizability: While the sample size is large, findings are limited to two occupational sectors and may not be generalizable to the entire working population or other socioeconomic settings.
5. Conclusions
Author Contributions
Funding
Institutional Review Board Statement
Informed Consent Statement
Data Availability Statement
Conflicts of Interest
References
- Guo, H.; Wu, H.; Li, Z. The Pathogenesis of Diabetes. Int. J. Mol. Sci. 2023, 24, 6978. [Google Scholar] [CrossRef] [PubMed] [PubMed Central]
- Tanase, D.M.; Gosav, E.M.; Costea, C.F.; Ciocoiu, M.; Lacatusu, C.M.; Maranduca, M.A.; Ouatu, A.; Floria, M. The Intricate Relationship between Type 2 Diabetes Mellitus (T2DM), Insulin Resistance (IR), and Nonalcoholic Fatty Liver Disease (NAFLD). J. Diabetes Res. 2020, 2020, 3920196. [Google Scholar] [CrossRef] [PubMed] [PubMed Central]
- Marušić, M.; Paić, M.; Knobloch, M.; Liberati Pršo, A.M. NAFLD, Insulin Resistance, and Diabetes Mellitus Type 2. Can. J. Gastroenterol. Hepatol. 2021, 2021, 6613827. [Google Scholar] [CrossRef] [PubMed] [PubMed Central]
- Chaurasia, B.; Summers, S.A. Ceramides in Metabolism: Key Lipotoxic Players. Annu. Rev. Physiol. 2021, 83, 303–330. [Google Scholar] [CrossRef] [PubMed] [PubMed Central]
- da Silva, A.A.; do Carmo, J.M.; Li, X.; Wang, Z.; Mouton, A.J.; HallJE. Role of Hyperinsulinemia and Insulin Resistance in Hypertension: Metabolic Syndrome Revisited. Can. J. Cardiol. 2020, 36, 671–682. [Google Scholar] [CrossRef] [PubMed] [PubMed Central]
- Kosmas, C.E.; Bousvarou, M.D.; Kostara, C.E.; Papakonstantinou, E.J.; Salamou, E.; Guzman, E. Insulin resistance and cardiovascular disease. J. Int. Med. Res. 2023, 51, 3000605231164548. [Google Scholar] [CrossRef] [PubMed] [PubMed Central]
- Chiefari, E.; Mirabelli, M.; La Vignera, S.; Tanyolaç, S.; Foti, D.P.; Aversa, A.; Brunetti, A. Insulin Resistance and Cancer: In Search for a Causal Link. Int. J. Mol. Sci. 2021, 22, 11137. [Google Scholar] [CrossRef] [PubMed] [PubMed Central]
- Li, X.; Wang, J.; Niu, L.; Tan, Z.; Ma, J.; He, L.; Yu, P.; Liu, X.; Li, J. Prevalence estimates of the insulin resistance and associated prevalence of heart failure among United Status adults. BMC Cardiovasc. Disord. 2023, 23, 294. [Google Scholar] [CrossRef] [PubMed] [PubMed Central]
- Yang, W.; Jiang, W.; Guo, S. Regulation of Macronutrients in Insulin Resistance and Glucose Homeostasis during Type 2 Diabetes Mellitus. Nutrients 2023, 15, 4671. [Google Scholar] [CrossRef] [PubMed] [PubMed Central]
- Lee, S.H.; Park, S.Y.; Choi, C.S. Insulin Resistance: From Mechanisms to Therapeutic Strategies. Diabetes Metab. J. 2022, 46, 15–37. [Google Scholar] [CrossRef] [PubMed] [PubMed Central]
- Bo, T.; Gao, L.; Yao, Z.; Shao, S.; Wang, X.; Proud, C.G.; Zhao, J. Hepatic selective insulin resistance at the intersection of insulin signaling and metabolic dysfunction-associated steatotic liver disease. Cell Metab. 2024, 36, 947–968. [Google Scholar] [CrossRef] [PubMed]
- De Bandt, J.P.; Coumoul, X.; Barouki, R. Branched-Chain Amino Acids and Insulin Resistance, from Protein Supply to Diet-Induced Obesity. Nutrients 2022, 15, 68. [Google Scholar] [CrossRef] [PubMed] [PubMed Central]
- Onyango, A.N. Excessive gluconeogenesis causes the hepatic insulin resistance paradox and its sequelae. Heliyon 2022, 8, e12294. [Google Scholar] [CrossRef] [PubMed] [PubMed Central]
- Campbell, I.; Campbell, H. Mechanisms of insulin resistance, mitochondrial dysfunction and the action of the ketogenic diet in bipolar disorder. Focus on the PI3K/AKT/HIF1-a pathway. Med. Hypotheses 2020, 145, 110299. [Google Scholar] [CrossRef] [PubMed]
- Gasmi, A.; Noor, S.; Menzel, A.; Doşa, A.; Pivina, L.; Bjørklund, G. Obesity and Insulin Resistance: Associations with Chronic Inflammation, Genetic and Epigenetic Factors. Curr. Med. Chem. 2021, 28, 800–826. [Google Scholar] [CrossRef] [PubMed]
- Juanola, O.; Martínez-López, S.; Francés, R.; Gómez-Hurtado, I. Non-Alcoholic Fatty Liver Disease: Metabolic, Genetic, Epigenetic and Environmental Risk Factors. Int. J. Environ. Res. Public Health 2021, 18, 5227. [Google Scholar] [CrossRef] [PubMed] [PubMed Central]
- Sen, P.; Fan, Y.; Schlezinger, J.J.; Ehrlich, S.D.; Webster, T.F.; Hyötyläinen, T.; Pedersen, O.; Orešič, M. Exposure to environmental toxicants is associated with gut microbiome dysbiosis, insulin resistance and obesity. Environ. Int. 2024, 186, 108569. [Google Scholar] [CrossRef] [PubMed]
- Pan, S.Y.; de Groh, M.; Aziz, A.; Morrison, H. Relation of insulin resistance with social-demographics, adiposity and behavioral factors in non-diabetic adult Canadians. J. Diabetes Metab. Disord. 2016, 15, 31. [Google Scholar] [CrossRef] [PubMed] [PubMed Central]
- He, M.; Wang, J.; Liang, Q.; Li, M.; Guo, H.; Wang, Y.; Deji, C.; Sui, J.; Wang, Y.-W.; Liu, Y.; et al. Time-restricted eating with or without low-carbohydrate diet reduces visceral fat and improves metabolic syndrome: A randomized trial. Cell Rep. Med. 2022, 3, 100777. [Google Scholar] [CrossRef] [PubMed] [PubMed Central]
- Li, Y.; Chen, X.; Chen, Y.; Yu, D.; Jiang, R.; Kou, X.; Sheng, L.; Liu, Y.; Song, Y. Berberine Improves TNF-α-Induced Hepatic Insulin Resistance by Targeting MEKK1/MEK Pathway. Inflammation 2022, 45, 2016–2026. [Google Scholar] [CrossRef] [PubMed]
- Huang, T.; Song, J.; Gao, J.; Cheng, J.; Xie, H.; Zhang, L.; Wang, Y.-H.; Gao, Z.; Wang, Y.; Wang, X.; et al. Adipocyte-derived kynurenine promotes obesity and insulin resistance by activating the AhR/STAT3/IL-6 signaling. Nat. Commun. 2022, 13, 3489. [Google Scholar] [CrossRef] [PubMed] [PubMed Central]
- Vatier, C.; Jéru, I.; Fellahi, S.; Capeau, J.; Bastard, J.P.; Vigouroux, C.; Groupe de Travail RIHN Adipokines. Leptine, adiponectine, syndromes lipodystrophiques et d’insulino-résistance sévère. Ann. Biol. Clin. 2020, 78, 261–264. (In French) [Google Scholar] [CrossRef] [PubMed]
- Li, Y.; Zhang, D.; Gao, Y.; Wang, P.; Wang, Z.; Zhang, B.; Liu, J.; Ye, D.; Ma, W.; Lu, S. METTL3 exacerbates insulin resistance in hepatocytes by regulating m6A modification of cytochrome P450 2B6. Nutr. Metab. 2023, 20, 40. [Google Scholar] [CrossRef] [PubMed] [PubMed Central]
- Tong, C.; Wu, Y.; Zhang, L.; Yu, Y. Insulin resistance, autophagy and apoptosis in patients with polycystic ovary syndrome: Association with PI3K signaling pathway. Front. Endocrinol. 2022, 13, 1091147. [Google Scholar] [CrossRef] [PubMed] [PubMed Central]
- Ramasubbu, K.; Devi Rajeswari, V. Impairment of insulin signaling pathway PI3K/Akt/mTOR and insulin resistance induced AGEs on diabetes mellitus and neurodegenerative diseases: A perspective review. Mol. Cell. Biochem. 2023, 478, 1307–1324. [Google Scholar] [CrossRef] [PubMed]
- van Gerwen, J.; Shun-Shion, A.S.; Fazakerley, D.J. Insulin signalling and GLUT4 trafficking in insulin resistance. Biochem. Soc. Trans. 2023, 51, 1057–1069. [Google Scholar] [CrossRef] [PubMed] [PubMed Central]
- Czech, M.P. Mechanisms of insulin resistance related to white, beige, and brown adipocytes. Mol. Metab. 2020, 34, 27–42. [Google Scholar] [CrossRef] [PubMed] [PubMed Central]
- Mestre Font, M.; Busquets-Cortés, C.; Ramírez-Manent, J.I.; Vallejos, D.; Sastre Alzamora, T.; López-González, A.A. Influence of sociodemographic variables and healthy habits on the values of cardiometabolic risk scales in 386924 Spanish workers. Acad. J. Health Sci. 2024, 39, 112–121. [Google Scholar] [CrossRef]
- Naghizadeh, M.; Maskouni, S.J.; Mortazavi, Z.; Ahmadi, M.; Shokri, S. The Impact of Fast Food Consumption on the Development of General and Central Obesity. Acad. J. Health Sci. 2024, 39, 44–48. [Google Scholar] [CrossRef]
- Mehdi, S.; Wani, S.U.D.; Krishna, K.L.; Kinattingal, N.; Roohi, T.F. A review on linking stress, depression, and insulin resistance via low-grade chronic inflammation. Biochem. Biophys. Rep. 2023, 36, 101571. [Google Scholar] [CrossRef] [PubMed] [PubMed Central]
- Sastre-Alzamora, T.; Tomás-Gil, P.; Paublini, H.; Pallarés, L.; Ramírez-Manent, J.I.; López-González, A.A. Relationship between heart age and insulin resistance risk scales in 139634 Spanish workers. Acad. J. Health Sci. 2024, 39, 16–22. [Google Scholar] [CrossRef]
- Antza, C.; Kostopoulos, G.; Mostafa, S.; Nirantharakumar, K.; Tahrani, A. The links between sleep duration, obesity and type 2 diabetes mellitus. J. Endocrinol. 2021, 252, 125–141. [Google Scholar] [CrossRef] [PubMed] [PubMed Central]
- Li, M.; Chi, X.; Wang, Y.; Setrerrahmane, S.; Xie, W.; Xu, H. Trends in insulin resistance: Insights into mechanisms and therapeutic strategy. Signal. Transduct. Target. Ther. 2022, 7, 216. [Google Scholar] [CrossRef] [PubMed] [PubMed Central]
- Yang, S.; Yu, B.; Yu, W.; Dai, S.; Feng, C.; Shao, Y.; Zhao, X.; Li, X.; He, T.; Jia, P. Development and validation of an age-sex-ethnicity-specific metabolic syndrome score in the Chinese adults. Nat. Commun. 2023, 14, 6988, Erratum in Nat. Commun. 2024, 15, 2589. https://doi.org/10.1038/s41467-024-46992-4. [Google Scholar] [CrossRef] [PubMed] [PubMed Central]
- Mestre-Font, M.; Busquets-Cortés, C.; Ramírez-Manent, J.I.; Tomás-Gil, P.; Paublini, H.; López-González, A.A. Influence of sociodemographic variables and healthy habits on the values of overweight and obesity scales in 386,924 Spanish workers. Acad. J. Health Sci. 2024, 39, 27–35. [Google Scholar] [CrossRef]
- Manzanero, R.Z.; López-González, A.A.; Tomás-Gil, P.; Paublini, H.; Martínez-Jover, A.; Ramírez-Manent, J.I. Cardiometabolic risk assessment in 28300 Spanish waiters. Acad. J. Health Sci. 2023, 39, 16–24. [Google Scholar] [CrossRef]
- Gastaldelli, A. Measuring and estimating insulin resistance in clinical and research settings. Obesity 2022, 30, 1549–1563. [Google Scholar] [CrossRef] [PubMed] [PubMed Central]
- Tahapary, D.L.; Pratisthita, L.B.; Fitri, N.A.; Marcella, C.; Wafa, S.; Kurniawan, F.; Rizka, A.; Tarigan, T.J.E.; Harbuwono, D.S.; Purnamasari, D.; et al. Challenges in the diagnosis of insulin resistance: Focusing on the role of HOMA-IR and Tryglyceride/glucose index. Diabetes Metab. Syndr. 2022, 16, 102581. [Google Scholar] [CrossRef] [PubMed]
- Paracha, A.I.; Haroon, Z.H.; Aamir, M.; Bibi, A. Diagnostic Accuracy of Markers of Insulin Resistance (HOMA-IR) and Insulin Sensitivity (QUICKI) in Gestational Diabetes. J. Coll. Physicians Surg. Pak. 2021, 31, 1015–1019. [Google Scholar] [CrossRef] [PubMed]
- Lechner, K.; Lechner, B.; Crispin, A.; Schwarz, P.E.H.; von Bibra, H. Waist-to-height ratio and metabolic phenotype compared to the Matsuda index for the prediction of insulin resistance. Sci. Rep. 2021, 11, 8224. [Google Scholar] [CrossRef] [PubMed] [PubMed Central]
- Paublini, H.; López González, A.A.; Busquets-Cortés, C.; Tomas-Gil, P.; Riutord-Sbert, P.; Ramírez-Manent, J.I. Relationship between Atherogenic Dyslipidaemia and Lipid Triad and Scales That Assess Insulin Resistance. Nutrients 2023, 15, 2105. [Google Scholar] [CrossRef] [PubMed] [PubMed Central]
- Duan, M.; Zhao, X.; Li, S.; Miao, G.; Bai, L.; Zhang, Q.; Yang, W.; Zhao, X. Metabolic score for insulin resistance (METS-IR) predicts all-cause and cardiovascular mortality in the general population: Evidence from NHANES 2001–2018. Cardiovasc. Diabetol. 2024, 23, 243. [Google Scholar] [CrossRef] [PubMed] [PubMed Central]
- Seo, M.W.; Cho, W.; Kim, J.Y. The single point insulin sensitivity estimator (SPISE) index as a predictor of metabolic syndrome in Korean adults. Obes. Res. Clin. Pract. 2023, 17, 198–202. [Google Scholar] [CrossRef] [PubMed]
- López-González, A.A.; Jover, A.M.; Martínez, C.S.; Artal, P.M.; Bote, S.A.; Jané, B.A.; Ramírez-Manent, J.I. The CUN-BAE, Deurenberg Fat Mass, and visceral adiposity index as confident anthropometric indices for early detection of metabolic syndrome components in adults. Sci. Rep. 2022, 12, 15486. [Google Scholar] [CrossRef] [PubMed] [PubMed Central]
- Lanthier, N.; Lebrun, V.; Molendi-Coste, O.; van Rooijen, N.; Leclercq, I.A. Liver Fetuin-A at Initiation of Insulin Resistance. Metabolites 2022, 12, 1023. [Google Scholar] [CrossRef] [PubMed] [PubMed Central]
- de Luis Román, D.A.; Gómez Hoyos, E.; Ortolá, A.; Delgado, E.; Díaz, G.; Torres, B.; López, J.J. La variante rs10401670 del gen de la resistina se relaciona con los niveles de resistina circulante, la resistencia a la insulina y la presencia de diabetes mellitus de tipo 2 en los pacientes obesos. Nutr. Hosp. 2020, 37, 293–298. (In Spanish) [Google Scholar] [CrossRef] [PubMed]
- Liu, C.; Zhou, X.R.; Ye, M.Y.; Xu, X.Q.; Zhang, Y.W.; Liu, H.; Huang, X.-Z. RBP4 Is Associated with Insulin Resistance in Hyperuricemia-Induced Rats and Patients with Hyperuricemia. Front. Endocrinol. 2021, 12, 653819. [Google Scholar] [CrossRef] [PubMed] [PubMed Central]
- Wang, M.; Li, Y.; Li, S.; Lv, J. Endothelial Dysfunction and Diabetic Cardiomyopathy. Front. Endocrinol. 2022, 13, 851941. [Google Scholar] [CrossRef] [PubMed] [PubMed Central]
- Acosta-Martinez, M.; Cabail, M.Z. The PI3K/Akt Pathway in Meta-Inflammation. Int. J. Mol. Sci. 2022, 23, 15330. [Google Scholar] [CrossRef] [PubMed] [PubMed Central]
- Shahim, B.; Redfors, B.; Stuckey, T.D.; Liu, M.; Zhou, Z.; Witzenbichler, B.; Weisz, G.; Rinaldi, M.J.; Neumann, F.; Metzger, D.C.; et al. On-Treatment Platelet Reactivity and Ischemic Outcomes in Patients with Diabetes Mellitus: Two-Year Results from ADAPT-DES. J. Am. Heart Assoc. 2023, 12, e026482. [Google Scholar] [CrossRef] [PubMed] [PubMed Central]
- Sakurai, Y.; Kubota, N.; Yamauchi, T.; Kadowaki, T. Role of Insulin Resistance in MAFLD. Int. J. Mol. Sci. 2021, 22, 4156. [Google Scholar] [CrossRef] [PubMed] [PubMed Central]
- Zhao, H.; Zhang, J.; Cheng, X.; Nie, X.; He, B. Insulin resistance in polycystic ovary syndrome across various tissues: An updated review of pathogenesis, evaluation, and treatment. J. Ovarian Res. 2023, 16, 9. [Google Scholar] [CrossRef] [PubMed] [PubMed Central]
- Zańko, A.; Siewko, K.; Krętowski, A.J.; Milewski, R. Lifestyle, Insulin Resistance and Semen Quality as Co-Dependent Factors of Male Infertility. Int. J. Environ. Res. Public Health 2022, 20, 732. [Google Scholar] [CrossRef] [PubMed] [PubMed Central]
- DiNicolantonio, J.J.; HO’Keefe, J. Myo-inositol for insulin resistance, metabolic syndrome, polycystic ovary syndrome and gestational diabetes. Open Heart 2022, 9, e001989. [Google Scholar] [CrossRef] [PubMed] [PubMed Central]
- Jung, E.; Romero, R.; Yeo, L.; Gomez-Lopez, N.; Chaemsaithong, P.; Jaovisidha, A.; Gotsch, F.; Erez, O. The etiology of preeclampsia. Am. J. Obstet. Gynecol. 2022, 226, S844–S866. [Google Scholar] [CrossRef] [PubMed] [PubMed Central]
- Sędzikowska, A.; Szablewski, L. Insulin and Insulin Resistance in Alzheimer’s Disease. Int. J. Mol. Sci. 2021, 22, 9987. [Google Scholar] [CrossRef] [PubMed] [PubMed Central]
- López-González, Á.A.; Martínez-Almoyna Rifá, E.; Paublini Oliveira, H.; Martorell Sánchez, C.; Tárraga López, P.J.; Ramírez-Manent, J.I. Asociación entre las variables sociodemográficas, los hábitos saludables y el estrés con síndrome metabólico: Un estudio descriptivo y transversal. Semergen 2025, 51, 102455. (In Spanish) [Google Scholar] [CrossRef] [PubMed]
- Allain, C.C.; Poon, L.S.; Chan, C.S.; Richmond, W.; Fu, P.C. Enzymatic determination of total serum cholesterol. Clin. Chem. 1974, 20, 470–475. [Google Scholar] [CrossRef]
- Roeschlau, P.; Bernt, E.; Gruber, W. Enzymatic determination of total cholesterol in serum. Z. Klin. Chem. Klin. Biochem. 1974, 12, 226. [Google Scholar]
- Vicente-Herrero, M.T.; Egea-Sancho, M.; Ramírez Iñiguez de la Torre, M.V.; López-González, A.A. Relación de los índices de adiposidad visceral (VAI) y adiposidad disfuncional (DAI) con las escalas de riesgo de resistencia a la insulina y prediabetes. Acad. J. Health Sci. 2024, 39, 25–31. [Google Scholar] [CrossRef]
- Martínez-González, M.Á.; Hernández Hernández, A. Effect of the Mediterranean diet in cardiovascular prevention. Rev. Esp. Cardiol. (Engl. Ed.) 2024, 77, 574–582, (In English and Spanish). [Google Scholar] [CrossRef] [PubMed]
- Mestre-Font, M.; Busquets-Cortés, C.; Ramírez-Manent, J.I.; Tomás-Gil, P.; Paublini, H.; López-González, A.A. Influence of sociodemographic variables and healthy habits on the values of type 2 diabetes risk scales. Acad. J. Health Sci. 2024, 39, 99–106. [Google Scholar] [CrossRef]
- Kurniawan, L.B. Triglyceride-Glucose Index as a Biomarker of Insulin Resistance, Diabetes Mellitus, Metabolic Syndrome, and Cardiovascular Disease: A Review. EJIFCC 2024, 35, 44–51. [Google Scholar] [PubMed] [PubMed Central]
- Cho, W.; Seo, M.W.; Rosenberg, J.; Kim, J.Y. Single point insulin sensitivity estimator index for identifying metabolic syndrome in US adults: NHANES 2017–March 2020. Obes. Res. Clin. Pract. 2024, 18, 280–285. [Google Scholar] [CrossRef] [PubMed]
- Tosoratto, J.; Carriedo, B.; Cantón, C. Cardiometabolic risk level in 43074 Spanish office workers: Associated variables. Acad. J. Health Sci. 2024, 39, 48–56. [Google Scholar] [CrossRef]
- Zhang, Y.D.; Wang, L.N. Research progress in the treatment of chronic fatigue syndrome through interventions targeting the hypothalamus-pituitary-adrenal axis. Front. Endocrinol. 2024, 15, 1373748. [Google Scholar] [CrossRef] [PubMed] [PubMed Central]
- Varra, F.N.; Varras, M.; Varra, V.K.; Theodosis-Nobelos, P. Molecular and pathophysiological relationship between obesity and chronic inflammation in the manifestation of metabolic dysfunctions and their inflammation-mediating treatment options (Review). Mol. Med. Rep. 2024, 29, 95. [Google Scholar] [CrossRef] [PubMed] [PubMed Central]
- Vital, P.; Larrieta, E.; Hiriart, M. Sexual dimorphism in insulin sensitivity and susceptibility to develop diabetes in rats. J. Endocrinol. 2006, 190, 425–432. [Google Scholar] [CrossRef] [PubMed]
- Brufani, C.; Tozzi, A.; Fintini, D.; Ciampalini, P.; Grossi, A.; Fiori, R.; Kiepe, D.; Manco, M.; Schiaffini, R.; Porzio, O.; et al. Sexual dimorphism of body composition and insulin sensitivity across pubertal development in obese Caucasian subjects. Eur. J. Endocrinol. 2009, 160, 769–775. [Google Scholar] [CrossRef] [PubMed]
- Addison, M.L.; Rissman, E.F. Sexual dimorphism of growth hormone in the hypothalamus: Regulation by estradiol. Endocrinology 2012, 153, 1898–1907. [Google Scholar] [CrossRef] [PubMed] [PubMed Central]
- Santos, J.D.M.; Silva, J.F.T.; Alves, E.D.S.; Cruz, A.G.; Santos, A.R.M.; Camargo, F.N.; Talarico, C.H.Z.; Silva, C.A.A.; Camporez, J.P. Strength Training Protects High-Fat-Fed Ovariectomized Mice against Insulin Resistance and Hepatic Steatosis. Int. J. Mol. Sci. 2024, 25, 5066. [Google Scholar] [CrossRef] [PubMed] [PubMed Central]
- Li, X.; Wang, J.; Zhang, M.; Li, X.; Fan, Y.; Zhou, X.; Sun, Y.; Qiu, Z. Biological aging mediates the associations of metabolic score for insulin resistance with all-cause and cardiovascular disease mortality among US adults: A nationwide cohort study. Diabetes Obes. Metab. 2024, 26, 3552–3564. [Google Scholar] [CrossRef] [PubMed]
- Wang, P.; Gao, X.; Willett, W.C.; Giovannucci, E.L. Socioeconomic Status, Diet, and Behavioral Factors and Cardiometabolic Diseases and Mortality. JAMA Netw. Open 2024, 7, e2451837. [Google Scholar] [CrossRef] [PubMed] [PubMed Central]
- Amaravadi, S.K.; Maiya, G.A.; Vaishali, K.; Shastry, B.A. Effectiveness of structured exercise program on insulin resistance and quality of life in type 2 diabetes mellitus-A randomized controlled trial. PLoS ONE 2024, 19, e0302831. [Google Scholar] [CrossRef] [PubMed] [PubMed Central]
- Gómez-Sánchez, M.; Gómez-Sánchez, L.; Llamas-Ramos, R.; Rodríguez-Sánchez, E.; García-Ortiz, L.; Martí-Lluch, R.; Rodríguez, M.C.; Llamas-Ramos, I.; Gómez-Marcos, M.A. Relationship between the Mediterranean Diet and Vascular Function in Subjects with and without Increased Insulin Resistance. Nutrients 2024, 16, 3106. [Google Scholar] [CrossRef] [PubMed] [PubMed Central]
- Rouland, A.; Thuillier, P.; Al-Salameh, A.; Benzerouk, F.; Bahougne, T.; Tramunt, B.; Berlin, I.; Clair, C.; Thomas, D.; Le Faou, A.-L.; et al. Smoking and diabetes. Ann. Endocrinol. 2024, 85, 614–622. [Google Scholar] [CrossRef] [PubMed]
- Guo, Z.; Liu, P.; Li, T.; Gao, E.; Bian, J.; Ren, X.; Xu, B.; Chen, X.; Huang, H.; Liu, J.; et al. Associations of urinary nicotine metabolites and essential metals with metabolic syndrome in older adults: The mediation effect of insulin resistance. J. Hazard Mater. 2024, 480, 135969. [Google Scholar] [CrossRef] [PubMed]
- Tobarra Sánchez, J.A.; Tárraga López, P.J.; Tárraga Marcos, M.L.; Gordito Soler, M.; García Agudo, S.; Ramírez-Manent, J.I. Benefits of smoking cessation. Acad. J. Health Sci. 2024, 39, 83–100. [Google Scholar] [CrossRef]

| Header | Men | Women | ||||
|---|---|---|---|---|---|---|
| Commerce n = 18,160 | Industry n = 25,824 | Commerce n = 9288 | Industry n = 3584 | |||
| Mean (SD) | Mean (SD) | p-Value | Mean (SD) | Mean (SD) | p-Value | |
| Age (years) | 39.5 (9.8) | 39.4 (10.5) | 0.225 | 35.9 (10.1) | 41.6 (10.5) | <0.001 |
| Height (cm) | 175.0 (6.7) | 173.9 (7.0) | <0.001 | 162.0 (6.4) | 160.9 (6.5) | <0.001 |
| Weight (kg) | 81.5 (12.5) | 81.3 (14.2) | 0.064 | 65.3 (13.4) | 68.8 (14.0) | <0.001 |
| Waist circumference (cm) | 87.5 (8.8) | 87.7 (9.0) | 0.121 | 73.7 (7.5) | 75.1 (8.0) | <0.001 |
| Hip circumference (cm) | 100.6 (7.9) | 99.6 (8.4) | <0.001 | 97.0 (8.9) | 98.1 (9.4) | <0.001 |
| SBP (mmHg) | 122.6 (14.4) | 124.5 (5.0) | 0.024 | 112.6 (14.2) | 117.9 (16.2) | <0.001 |
| DBP (mmHg) | 74.5 (10.2) | 75.6 (10.5) | 0.170 | 68.9 (9.8) | 71.5 (10.7) | <0.001 |
| Total cholesterol (mg/dL) | 193.9 (37.4) | 197.5 (38.6) | <0.001 | 189.4 (35.4) | 201.1 (39.3) | <0.001 |
| HDL-cholesterol (mg/dL) | 51.1 (6.7) | 51.4 (7.0) | <0.001 | 54.5 (7.9) | 52.3 (7.5) | <0.001 |
| LDL-cholesterol (mg/dL) | 119.4 (37.7) | 121.9 (37.2) | <0.001 | 117.7 (35.6) | 130.6 (38.8) | <0.001 |
| Triglycerides (mg/dL) | 119.3 (81.3) | 122.4 (84.6) | <0.001 | 85.4 (37.6) | 90.8 (45.8) | <0.001 |
| Glucose (mg/dL) | 86.3 (11.9) | 88.7 (12.9) | <0.001 | 84.2 (10.6) | 84.3 (11.9) | 0.210 |
| (%) | (%) | p-value | (%) | (%) | p-value | |
| 18–29 years | 17.7 | 20.3 | <0.001 | 32.1 | 16.5 | <0.001 |
| 30–39 years | 31.8 | 31.7 | 32.6 | 26.9 | ||
| 40–49 years | 33.6 | 28.5 | 23.6 | 31.0 | ||
| 50–59 years | 14.7 | 16.7 | 10.3 | 23.4 | ||
| 60–69 years | 2.2 | 2.8 | 1.4 | 2.2 | ||
| Elementary school | 52.4 | 36.7 | <0.001 | 90.1 | 83.7 | <0.001 |
| High school | 47.6 | 63.3 | 9.9 | 16.3 | ||
| Non Physical activity | 51.5 | 55.4 | <0.001 | 42.7 | 59.4 | <0.001 |
| Yes Physical activity | 48.5 | 44.6 | 57.7 | 40.6 | ||
| Non Mediterranean diet | 56.1 | 59.8 | <0.001 | 44.4 | 59.8 | <0.001 |
| Yes Mediterranean diet | 43.9 | 40.2 | 55.6 | 40.2 | ||
| Non smokers | 70.5 | 63.0 | <0.001 | 68.0 | 67.2 | 0.181 |
| Smokers | 29.5 | 37.0 | 32.0 | 32.8 |
| TyG * | TyG-BMI * | METS-IR * | SPISE-IR * | |||||||||||||
|---|---|---|---|---|---|---|---|---|---|---|---|---|---|---|---|---|
| Commerce | Industry | Commerce | Industry | Commerce | Industry | Commerce | Industry | |||||||||
| Men | n | Mean (SD) | n | Mean (SD) | n | Mean (SD) | n | Mean (SD) | n | Mean (SD) | n | Mean (SD) | n | Mean (SD) | n | Mean (SD) |
| 18–29 years | 3224 | 8.1 (0.5) | 5248 | 8.2 (0.5) | 3224 | 204.2 (34.2) | 5248 | 205.8 (39.3) | 3224 | 34.7 (6.5) | 5248 | 34.9 (5.8) | 3224 | 1.4 (0.4) | 5248 | 1.5 (0.4) |
| 30–39 years | 5768 | 8.3 (0.5) | 8184 | 8.4 (0.6) | 5768 | 217.5 (36.2) | 8184 | 225.5 (43.8) | 5768 | 37.3 (6.2) | 8184 | 38.5 (7.5) | 5768 | 1.6 (0.4) | 8184 | 1.7 (0.5) |
| 40–49 years | 6104 | 8.5 (0.5) | 7360 | 8.6 (0.6) | 6104 | 231.0 (39.0) | 7360 | 238.1 (45.2) | 6104 | 39.6 (6.6) | 7360 | 40.8 (7.7) | 6104 | 1.7 (0.4) | 7360 | 1.8 (0.5) |
| 50–59 years | 2664 | 8.6 (0.6) | 4312 | 8.7 (0.5) | 2664 | 241.0 (38.1) | 4312 | 244.8 (38.7) | 2664 | 41.2 (6.7) | 4312 | 42.0 (6.7) | 2664 | 1.8 (0.4) | 4312 | 1.9 (0.4) |
| 60–69 years | 400 | 8.7 (0.5) | 720 | 8.8 (0.5) | 400 | 249.6 (35.4) | 720 | 251.3 (34.4) | 400 | 42.4 (6.0) | 720 | 43.7 (6.7) | 400 | 1.9 (0.5) | 720 | 2.0 (0.5) |
| Elementary | 9512 | 8.4 (0.6) | 9480 | 8.5 (0.6) | 9512 | 225.7 (37.8) | 9480 | 229.0 (45.3) | 9512 | 38.9 (6.6) | 9480 | 39.1 (7.8) | 9512 | 1.7 (0.4) | 9480 | 1.8 (0.5) |
| High school | 8648 | 8.3 (0.6) | 16,344 | 8.4 (0.6) | 8648 | 222.1 (40.3) | 16,344 | 223.8 (42.0) | 8648 | 38.0 (6.9) | 16,344 | 38.6 (7.3) | 8648 | 1.6 (0.4) | 16,344 | 1.7 (0.5) |
| Non PhA | 9344 | 8.6 (0.5) | 14,304 | 8.7 (0.6) | 9344 | 249.9 (35.1) | 14,304 | 253.6 (39.6) | 9344 | 42.9 (6.2) | 14,304 | 43.5 (6.9) | 9344 | 1.9 (0.4) | 14,304 | 2.0 (0.4) |
| Yes PhA | 8816 | 8.0 (0.4) | 11,520 | 8.1 (0.4) | 8816 | 194.3 (22.0) | 11,520 | 196.2 (19.1) | 8816 | 33.3 (3.6) | 11,520 | 34.3 (3.2) | 8816 | 1.3 (0.2) | 11,520 | 1.4 (0.2) |
| Non MD | 10,184 | 8.6 (0.6) | 15,440 | 8.7 (0.6) | 10,184 | 245.3 (37.2) | 15,440 | 249.5 (41.2) | 10,184 | 42.1 (6.6) | 15,440 | 42.7 (7.2) | 10,184 | 1.9 (0.4) | 15,440 | 2.0 (0.5) |
| Yes MD | 7976 | 8.0 (0.4) | 10,384 | 8.1 (0.4) | 7976 | 193.9 (22.0) | 10,384 | 196.4 (19.5) | 7976 | 33.3 (3.7) | 10,384 | 33.8 (3.3) | 7976 | 1.3 (0.2) | 10,384 | 1.4 (0.2) |
| Non smokers | 12,808 | 8.3 (0.6) | 16,280 | 8.4 (0.6) | 12,808 | 222.7 (43.2) | 16,280 | 223.7 (41.8) | 12,808 | 38.3 (7.7) | 16,280 | 38.8 (7.8) | 12,808 | 1.6 (0.4) | 16,280 | 1.7 (0.5) |
| Smokers | 5352 | 8.4 (0.6) | 9544 | 8.5 (0.6) | 5352 | 223.9 (38.0) | 9544 | 229.7 (44.5) | 5352 | 38.9 (7.8) | 9544 | 39.3 (7.9) | 5352 | 1.7 (0.5) | 9544 | 1.8 (0.5) |
| Women | n | Mean (SD) | n | Mean (SD) | n | Mean (SD) | n | Mean (SD) | n | Mean (SD) | n | Mean (SD) | n | Mean (SD) | n | Mean (SD) |
| 18–29 years | 2984 | 7.9 (0.5) | 592 | 8.0 (0.4) | 2984 | 187.5 (40.2) | 592 | 190.7 (40.1) | 2984 | 32.0 (6.8) | 592 | 33.1 (6.7) | 2984 | 1.2 (0.4) | 592 | 1.3 (0.4) |
| 30–39 years | 3024 | 8.0 (0.4) | 960 | 8.1 (0.5) | 3024 | 198.2 (42.7) | 960 | 213.9 (50.1) | 3024 | 34.0 (7.2) | 960 | 36.7 (8.1) | 3024 | 1.4 (0.4) | 960 | 1.5 (0.5) |
| 40–49 years | 2192 | 8.1 (0.5) | 1112 | 8.2 (0.5) | 2192 | 210.9 (44.0) | 1112 | 221.3 (49.8) | 2192 | 36.4 (7.5) | 1112 | 38.2 (8.2) | 2192 | 1.5 (0.4) | 1112 | 1.6 (0.5) |
| 50–59 years | 960 | 8.2 (0.5) | 840 | 8.3 (0.5) | 960 | 229.8 (59.5) | 840 | 231.6 (42.2) | 960 | 38.3 (5.8) | 840 | 40.2 (7.2) | 960 | 1.6 (0.7) | 840 | 1.7 (0.4) |
| 60–69 years | 128 | 8.3 (0.5) | 80 | 8.4 (0.5) | 128 | 231.5 (33.8) | 80 | 257.4 (63.9) | 128 | 39.7 (10.1) | 80 | 44.9 (10.8) | 128 | 1.7 (0.6) | 80 | 2.1 (0.7) |
| Elementary | 8368 | 8.1 (0.5) | 3000 | 8.2 (0.5) | 8368 | 202.5 (44.4) | 3000 | 219.6 (50.6) | 8368 | 34.9 (6.8) | 3000 | 37.9 (8.4) | 8368 | 1.5 (0.5) | 3000 | 1.6 (0.5) |
| High school | 920 | 8.0 (0.4) | 584 | 8.0 (0.5) | 920 | 201.3 (38.9) | 584 | 203.6 (41.3) | 920 | 34.6 (8.0) | 584 | 35.4 (7.1) | 920 | 1.4 (0.4) | 584 | 1.5 (0.4) |
| Non PhA | 3928 | 8.3 (0.5) | 2128 | 8.4 (0.5) | 3928 | 237.6 (47.5) | 2128 | 243.1 (46.6) | 3928 | 40.8 (8.1) | 2128 | 41.9 (7.7) | 3928 | 1.8 (0.5) | 2128 | 1.9 (0.5) |
| Yes PhA | 5360 | 7.9 (0.4) | 1456 | 8.0 (0.4) | 5360 | 176.5 (19.8) | 1456 | 178.8 (20.3) | 5360 | 30.2 (3.4) | 1456 | 30.9 (3.5) | 5360 | 1.1 (0.2) | 1456 | 1.2 (0.2) |
| Non MD | 4120 | 8.2 (0.4) | 2144 | 8.3 (0.5) | 4120 | 232.8 (49.9) | 2144 | 241.5 (47.5) | 4120 | 39.9 (8.6) | 2144 | 41.6 (7.9) | 4120 | 1.7 (0.5) | 2144 | 1.8 (0.5) |
| Yes MD | 5168 | 7.8 (0.4) | 1440 | 7.9 (0.4) | 5168 | 178.0 (21.1) | 1440 | 180.4 (22.7) | 5168 | 30.5 (3.6) | 1440 | 31.4 (3.9) | 5168 | 1.1 (0.2) | 1440 | 1.2 (0.2) |
| Non smokers | 6320 | 8.0 (0.5) | 2408 | 8.1 (0.5) | 6320 | 199.1 (44.4) | 2408 | 204.4 (43.6) | 6320 | 34.0 (7.5) | 2408 | 35.3 (7.3) | 6320 | 1.4 (0.4) | 2408 | 1.5 (0.5) |
| Smokers | 2968 | 8.1 (0.5) | 1176 | 8.2 (0.5) | 2968 | 203.9 (46.3) | 1176 | 223.1 (51.1) | 2968 | 35.0 (8.0) | 1176 | 38.5 (8.6) | 2968 | 1.5 (0.5) | 1176 | 1.6 (0.5) |
| TyG High * | TyG-BMI High * | METS-IR High * | SPISE-IR High * | |||||||||||||
|---|---|---|---|---|---|---|---|---|---|---|---|---|---|---|---|---|
| Commerce | Industry | Commerce | Industry | Commerce | Industry | Commerce | Industry | |||||||||
| Men | n | % | n | % | n | % | n | % | n | % | n | % | n | % | n | % |
| 18–29 years | 3224 | 9.4 | 5248 | 11.0 | 3224 | 6.9 | 5248 | 11.3 | 3224 | 1.2 | 5248 | 3.4 | 3224 | 3.0 | 5248 | 5.9 |
| 30–39 years | 5768 | 16.1 | 8184 | 20.0 | 5768 | 14.0 | 8184 | 21.5 | 5768 | 4.3 | 8184 | 8.1 | 5768 | 6.4 | 8184 | 14.9 |
| 40–49 years | 6104 | 27.5 | 7360 | 33.5 | 6104 | 23.1 | 7360 | 31.0 | 6104 | 6.3 | 7360 | 11.5 | 6104 | 13.6 | 7360 | 22.8 |
| 50–59 years | 2664 | 36.0 | 4312 | 38.7 | 2664 | 35.4 | 4312 | 37.8 | 2664 | 11.1 | 4312 | 12.5 | 2664 | 20.1 | 4312 | 23.9 |
| 60–69 years | 400 | 46.0 | 720 | 49.1 | 400 | 44.2 | 720 | 46.5 | 400 | 20.0 | 720 | 22.1 | 400 | 28.0 | 720 | 29.1 |
| Elementary | 9512 | 23.3 | 9480 | 23.6 | 9512 | 19.4 | 9480 | 20.1 | 9512 | 6.4 | 9480 | 9.2 | 9512 | 11.7 | 9480 | 14.6 |
| High school | 8648 | 21.3 | 16,344 | 24.9 | 8648 | 21.6 | 16,344 | 24.7 | 8648 | 5.2 | 16,344 | 7.8 | 8648 | 9.8 | 16,344 | 12.3 |
| Non PhA | 9344 | 42.3 | 14,304 | 42.7 | 9344 | 35.2 | 14,304 | 38.6 | 9344 | 10.0 | 14,304 | 13.8 | 9344 | 18.8 | 14,304 | 21.8 |
| Yes PhA | 8816 | 1.2 | 11,520 | 2.0 | 8816 | 4.1 | 11,520 | 4.3 | 8816 | 1.3 | 11,520 | 2.2 | 8816 | 2.2 | 11,520 | 4.3 |
| Non MD | 10,184 | 38.3 | 15,440 | 39.5 | 10,184 | 34.8 | 15,440 | 39.2 | 10,184 | 9.5 | 15,440 | 13.2 | 10,184 | 17.2 | 15,440 | 22.0 |
| Yes MD | 7976 | 1.9 | 10,384 | 2.4 | 7976 | 4.6 | 10,384 | 5.3 | 7976 | 2.2 | 10,384 | 3.3 | 7976 | 3.5 | 10,384 | 4.7 |
| Non smokers | 12,808 | 19.7 | 16280 | 22.8 | 12,808 | 19.6 | 16,280 | 24.7 | 12,808 | 5.0 | 16,280 | 6.6 | 12,808 | 9.8 | 16,280 | 13.9 |
| Smokers | 5352 | 27.6 | 9544 | 28.7 | 5352 | 20.2 | 9544 | 25.8 | 5352 | 7.6 | 9544 | 10.0 | 5352 | 12.9 | 9544 | 14.9 |
| Women | n | % | n | % | n | % | n | % | n | % | n | % | n | % | n | % |
| 18–29 years | 2984 | 5.1 | 592 | 8.1 | 2984 | 7.0 | 592 | 9.5 | 2984 | 2.7 | 592 | 4.1 | 2984 | 4.0 | 592 | 4.2 |
| 30–39 years | 3024 | 7.7 | 960 | 8.1 | 3024 | 10.1 | 960 | 19.2 | 3024 | 3.7 | 960 | 8.3 | 3024 | 5.5 | 960 | 7.9 |
| 40–49 years | 2192 | 11.3 | 1112 | 13.7 | 2192 | 13.9 | 1112 | 20.1 | 2192 | 7.3 | 1112 | 7.9 | 2192 | 9.9 | 1112 | 10.8 |
| 50–59 years | 960 | 21.9 | 840 | 24.2 | 960 | 23.8 | 840 | 25.5 | 960 | 12.5 | 840 | 12.9 | 960 | 10.9 | 840 | 12.4 |
| 60–69 years | 128 | 24.5 | 80 | 26.4 | 128 | 25.8 | 80 | 30.1 | 128 | 15.5 | 80 | 17.6 | 128 | 15.8 | 80 | 17.2 |
| Elementary | 8368 | 9.9 | 3000 | 14.1 | 8368 | 12.3 | 3000 | 20.5 | 8368 | 5.4 | 3000 | 9.6 | 8368 | 7.5 | 3000 | 12.5 |
| High school | 920 | 4.3 | 584 | 9.6 | 920 | 8.7 | 584 | 12.3 | 920 | 2.6 | 584 | 4.1 | 920 | 4.4 | 584 | 5.5 |
| Non PhA | 3928 | 19.7 | 2128 | 20.1 | 3928 | 24.8 | 2128 | 28.9 | 3928 | 10.8 | 2128 | 12.5 | 3928 | 14.8 | 2128 | 17.8 |
| Yes PhA | 5360 | 3.2 | 1456 | 4.4 | 5360 | 5.5 | 1456 | 6.7 | 5360 | 2.5 | 1456 | 3.8 | 5360 | 2.8 | 1456 | 4.1 |
| Non MD | 4120 | 18.2 | 2144 | 19.2 | 4120 | 24.1 | 2144 | 26.8 | 4120 | 10.2 | 2144 | 11.8 | 4120 | 13.8 | 2144 | 16.5 |
| Yes MD | 5168 | 4.4 | 1440 | 5.1 | 5168 | 6.5 | 1440 | 8.1 | 5168 | 3.1 | 1440 | 4.9 | 5168 | 4.4 | 1440 | 5.6 |
| Non smokers | 6320 | 9.4 | 2408 | 13.6 | 6320 | 11.3 | 2408 | 11.8 | 6320 | 4.8 | 2408 | 5.4 | 6320 | 6.7 | 2408 | 7.5 |
| Smokers | 2968 | 9.7 | 1176 | 14.0 | 2968 | 12.3 | 1176 | 12.9 | 2968 | 5.7 | 1176 | 6.8 | 2968 | 7.3 | 1176 | 13.3 |
| Header | TyG High | TyG-BMI | METS-IR High | SPISE-IR High |
|---|---|---|---|---|
| OR (95% CI) | OR (95% CI) | OR (95% CI) | OR (95% CI) | |
| Women | 1 | 1 | 1 | 1 |
| Men | 2.59 (2.41–2.2.78) | 1.36 (1.27–1.1.46) | 0.84 (0.77–0.92) | 1.11 (1.07–1.15) |
| 18–29 years | 1 | 1 | 1 | 1 |
| 30–39 years | 1.06 (1.04–1.08) | 1.20 (1.15–1.25) | 1.33 (1.22–1.44) | 1.16 (1.12–1.20) |
| 40–49 years | 1.21 (1.16–1.26) | 1.30 (1.23–1.37) | 1.43 (1.31–1.55) | 1.25 (1.19–1.31) |
| 50–59 years | 1.56 (1.48–1.65) | 1.45 (1.37–1.54) | 1.51 (1.38–1.64) | 1.37 (1.28–1.47) |
| 60–69 years | 1.92 (1.66–2.19) | 1.94 (1.80–2.09) | 2.37 (1.95–2.79) | 1.96 (1.66–2.27) |
| Elementary | 1 | 1 | 1 | 1 |
| High school | 1.10 (1.07–1.14) | 1.15 (1.10–1.21) | 1.12 (1.10–1.15) | 1.15 (1.10–1.20) |
| Commerce | 1 | 1 | 1 | 1 |
| Industry | 1.23 (1.16–1.30) | 1.17 (1.12–1.23) | 1.37 (1.28–1.47) | 1.20 (1.14–1.26) |
| Yes physical activity | 1 | 1 | 1 | 1 |
| Non physical activity | 10.45 (9.25–11.66) | 12.33 (11.01–13.66) | 11.87 (10.27–13.48) | 8.31 (7.50–9.12) |
| Yes Mediterranean diet | 1 | 1 | 1 | 1 |
| Non Mediterranean diet | 4.23 (3.70–4.77) | 5.29 (4.80–5.79) | 5.22 (4.60–5.83) | 3.64 (3.19–4.10) |
| Non smokers | 1 | 1 | 1 | 1 |
| Smokers | 1.53 (1.46–1.61) | 1.13 (1.09–1.17) | 1.09 (1.04–1.14) | 1.09 (1.05–1.13) |
Disclaimer/Publisher’s Note: The statements, opinions and data contained in all publications are solely those of the individual author(s) and contributor(s) and not of MDPI and/or the editor(s). MDPI and/or the editor(s) disclaim responsibility for any injury to people or property resulting from any ideas, methods, instructions or products referred to in the content. |
© 2025 by the authors. Licensee MDPI, Basel, Switzerland. This article is an open access article distributed under the terms and conditions of the Creative Commons Attribution (CC BY) license (https://creativecommons.org/licenses/by/4.0/).
Share and Cite
Pilar Fernández-Figares Vicioso, M.; Riutord Sbert, P.; López-González, Á.A.; Ramírez-Manent, J.I.; del Barrio Fernández, J.L.; Herrero, M.T.V. Risk of Insulin Resistance: Comparison of the Commerce vs. Industry Sector and Associated Variables. Diseases 2025, 13, 150. https://doi.org/10.3390/diseases13050150
Pilar Fernández-Figares Vicioso M, Riutord Sbert P, López-González ÁA, Ramírez-Manent JI, del Barrio Fernández JL, Herrero MTV. Risk of Insulin Resistance: Comparison of the Commerce vs. Industry Sector and Associated Variables. Diseases. 2025; 13(5):150. https://doi.org/10.3390/diseases13050150
Chicago/Turabian StylePilar Fernández-Figares Vicioso, María, Pere Riutord Sbert, Ángel Arturo López-González, José Ignacio Ramírez-Manent, José Luis del Barrio Fernández, and María Teófila Vicente Herrero. 2025. "Risk of Insulin Resistance: Comparison of the Commerce vs. Industry Sector and Associated Variables" Diseases 13, no. 5: 150. https://doi.org/10.3390/diseases13050150
APA StylePilar Fernández-Figares Vicioso, M., Riutord Sbert, P., López-González, Á. A., Ramírez-Manent, J. I., del Barrio Fernández, J. L., & Herrero, M. T. V. (2025). Risk of Insulin Resistance: Comparison of the Commerce vs. Industry Sector and Associated Variables. Diseases, 13(5), 150. https://doi.org/10.3390/diseases13050150