Abstract
Background: Sarcopenic obesity, defined as the concurrent loss of muscle mass and adipose tissue accumulation, is associated with reduced physical function and poor health status in older adults. Although oral function can impact the overall health of older adults, its role in the development of sarcopenic obesity remains unclear. Herein, we aimed to examine the association between oral function and the incidence of sarcopenic obesity. Methods: This longitudinal cohort study included 597 independent older adults (aged ≥65 years) from Tamba-Sasayama, a rural region of Japan, who participated in academic studies between June 2016 and December 2023. Participants underwent surveys at least twice, with a minimum two-year interval. The participants were divided into four groups (robust, obese, sarcopenic, and sarcopenic obese) according to their health condition. Sarcopenic obesity was diagnosed based on the guidelines of the Japanese Working Group on Sarcopenic Obesity. The oral function was evaluated by assessing the number of remaining teeth, tongue pressure, occlusal force, masticatory performance, and oral diadochokinesis. Cox proportional hazards regression analysis evaluated the association between oral function and the incidence of sarcopenic obesity after adjusting for relevant confounders. Results: The sarcopenic obesity group was older, had lower skeletal muscle mass, and inferior physical function. This cohort also had the highest prevalence of hypertension and significantly fewer remaining teeth. The proportion of individuals with sarcopenic obesity was 1.7% of the total population, with 2.8% in the obesity group at baseline, and 8.0% of those were diagnosed with sarcopenia progressing to sarcopenic obesity. The Cox regression model revealed that reduced tongue pressure was significantly associated with an increased risk of sarcopenic obesity, with a hazard ratio of 0.906 (95% confidence interval: 0.829–0.990; p = 0.028), independent of other variables related to sarcopenia and obesity. Conclusions: Our findings suggest that oral function is associated with the incidence of sarcopenic obesity but not with that of sarcopenia or obesity alone.
1. Introduction
Sarcopenia and obesity are two major health concerns impacting the older population and have substantial implications for their overall health and quality of life. Sarcopenia is characterized by the age-related loss of muscle mass, strength, and physical performance [1,2]. In older adults, obesity is associated with an elevated risk of falls, reduced functionality, diminished quality of life, and increased mortality. It also increases the risk of cardiovascular diseases, metabolic disorders, cognitive impairment, and arthritis [3,4].
The interplay between obesity and skeletal muscles in the aging population is complex, with evidence suggesting both protective and deleterious effects. Although obesity is associated with impaired physical function and resistance to anabolic stimuli, it may also lead to greater muscle mass in weight-bearing muscles than in older, lean individuals [5,6].
The coexistence of sarcopenia and obesity leads to sarcopenic obesity, a condition that has garnered increasing attention owing to its profound effects on health outcomes [6,7,8]. Sarcopenic obesity is characterized by muscle weakness due to sarcopenia combined with the metabolic complications of obesity. These conditions exhibit a synergistic relationship, each exacerbating the progression [8]. Sarcopenic obesity is associated with a higher risk of cardiovascular disease, diabetes, and impaired physical function than either condition alone. Sarcopenic obesity involves a vicious cycle of cross-talk between adipose and muscle tissue, and increased white adipose tissue and local muscle fat infiltration leading to inflammatory adipokine secretion, inhibiting protein synthesis and inducing catabolism. Cytokine secretion by fat mass affects muscle tissue and other organs, such as the liver and white adipose tissue, inhibiting insulin signaling and increasing the risk of insulin resistance [9,10]. Additionally, peri-muscular fat plays a critical role in different phenotypes of sarcopenic obesity, influencing inflammatory pathways and metabolic dysfunction. Furthermore, hormone-related responses vary across phenotypes, which may contribute to the secretion of inflammatory adipokines and the modulation of cytokine effects [11]. The interaction between reduced muscle quality and enhanced adiposity increases health risks, particularly in older populations [12,13,14,15,16].
The impact of sarcopenia and obesity on oral health is mediated via distinct pathways. A notable association exists between sarcopenia and oral function, primarily attributed to the interaction between muscle mass and masticatory abilities [17,18]. Sarcopenia typically results in reduced masticatory muscle strength, leading to compromised food intake and nutritional deficiencies. Moreover, older individuals with sarcopenia exhibit an increased susceptibility to oral health complications, including periodontal disease and dental caries, owing to difficulties in maintaining adequate oral hygiene [19].
Obesity is strongly associated with chronic systemic inflammation, exacerbating the progression of periodontal disease [20,21]. In addition, individuals with obesity have a higher propensity for recurrent and severe periodontal diseases. This phenomenon is partially attributed to decreased salivary production [22], which compromises the natural cleansing mechanisms of the oral cavity and increases the risk of dental caries [23,24].
Although the individual effects of sarcopenia and obesity on oral health have been previously studied, the combined impact of sarcopenic obesity on oral health remains elusive. Given the established associations among sarcopenia, obesity, and oral health, examining the long-term implications of sarcopenic obesity on oral health outcomes is critical. However, longitudinal studies of sarcopenic obesity, its progression over time, and its relationship with oral health are limited. Considering that both sarcopenia and obesity contribute to physical limitations and adverse health outcomes that can affect oral well-being, it is reasonable to expect that the progression of sarcopenic obesity, which combines these two conditions, is linked to oral health deterioration.
In the cohort study, we aimed to investigate the longitudinal association between sarcopenic obesity and oral health. We hypothesized that oral function is independently associated with physical condition and function, contributing to the development of sarcopenic obesity.
2. Material and Methods
This study encompassed independent older adults (aged ≥65 years) from Sasayama, rural Tamba-Sasayama City, Hyogo Prefecture, Japan, who participated in academic studies between June 2016 and December 2023. This cohort was designated the Frail Elderly in the Tamba-Sasayama Area (FESTA) study. The study was conducted in accordance with the ethical standards established by the Ethics Committees of both Hyogo Medical University (approval number: Rinhi-0342) and Niigata University (Approval number: G2021-0027).
The recruitment process was executed by placing newspaper advertisements and posters at the Sasayama Medical Center and Hyogo Medical University, resulting in the voluntary participation of study subjects. To be eligible for participation, individuals were required to meet the following criteria: they had to be independent older adults aged ≥65 years, residing in the Tamba-Sasayama region of Hyogo Prefecture, capable of traveling to the Sasayama Medical Center via public transportation or private vehicle, and without cognitive impairment (MMSE score >22). From among 1016 participants, 597 surveyed at least twice at a minimum interval of two years were included in the analysis. Individuals who could not ambulate independently (except those using a cane) were excluded. Participants were provided with comprehensive information regarding the objectives and methodology of the study, and written informed consent was obtained before their participation.
2.1. Evaluation Items
Participants were required to provide information regarding their medical and smoking histories via a questionnaire. Blood pressure was measured using a fully automatic calibrated oscillator (BP-203 RVII, Colin Co., Kyoto City, Japan).
Body composition was assessed via bioelectrical impedance analysis (BIA) using an InBody 770 device (InBody Japan, Inc., Koto Ward, Tokyo, 136-0071, Japan). Body mass index (BMI), limb skeletal muscle mass (LBM), and percent body were determined using BIA (InBody Co., Seoul, Republic of Korea).
2.2. Diagnosis of Sarcopenic Obesity
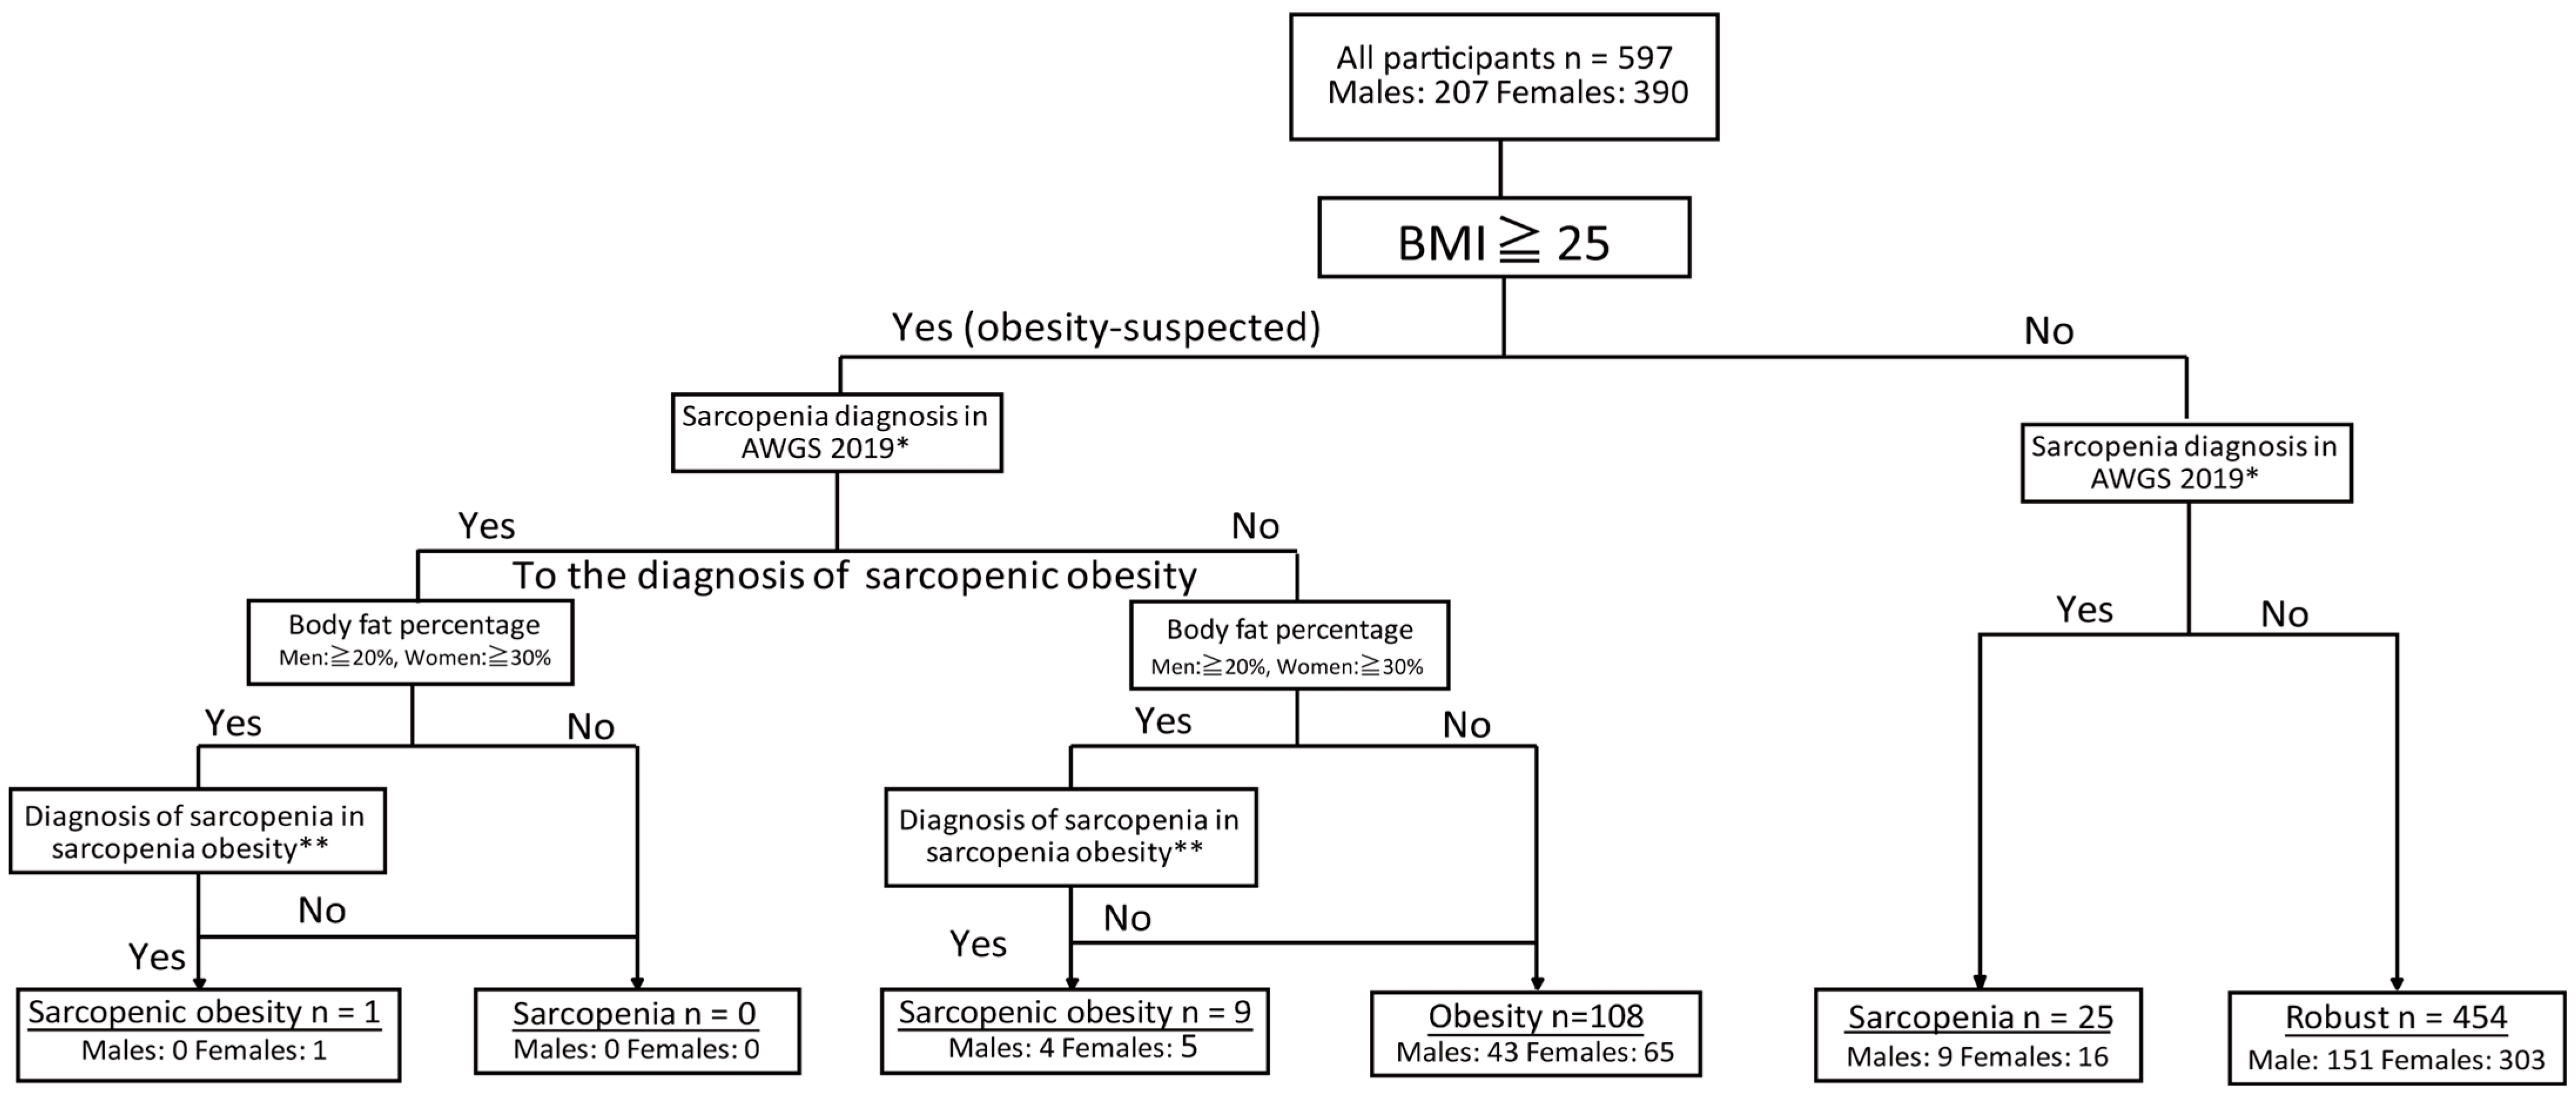
The participants were categorized into four groups based on their health status: robust, obese, sarcopenic, and sarcopenic obese. The classification method follows the flowchart depicted in Figure 1.

Figure 1.
Classification of participants with sarcopenic obesity. *: Low skeletal muscle mass (kg/m2) + low muscle strength or/and low physical function (diagnosis of sarcopenia [25]). **: Low skeletal muscle mass (kg/BMI) + low muscle strength or low physical function (diagnosis of sarcopenia obesity [26].
First, obesity screening was conducted according to the criteria established by the Japan Society for the Study of Obesity [26]. Individuals with a BMI of ≥25 kg/m2 were classified as “obesity-suspected”. Sarcopenic obesity was diagnosed based on the criteria established by the Japanese Society of Gerontology [26], in which obesity was determined by body fat percentage with thresholds set at ˃20% for males and ˃30% for females.
Sarcopenia was defined using the same diagnostic criteria as for sarcopenia alone, incorporating skeletal muscle mass, grip strength, and five-times-sit-to-stand-test (FTSST) performance. However, in the case of sarcopenic obesity, muscle mass was adjusted for BMI, and values of <0.789 for males and <0.512 for females were deemed to indicate low muscle mass [26]. Sarcopenic obesity was diagnosed when an individual met the criteria for both obesity and sarcopenia, as described above.
Sarcopenia was diagnosed based on the criteria set by the Asian Working Group for Sarcopenia (AWGS) [25], incorporating assessments of muscle strength (grip strength), physical function (FTSST performance), and muscle mass (height-adjusted appendicular skeletal muscle mass in kg/m2). Sarcopenia was identified in individuals who exhibited both reduced muscle strength and physical function, as well as low muscle mass. Muscle weakness was defined as grip strength of <28 kg in males and <18 kg in females, while a decline in physical function was indicated by an FTSST completion time exceeding 12 s [25]. Muscle mass was assessed using the skeletal muscle mass index (SMI), with values below 7.0 kg/m2 in males and 5.7 kg/m2 in females classified as having low muscle mass [25].
Based on these criteria, individuals with low muscle mass, reduced muscle strength, and physical function were diagnosed with severe sarcopenia. Those with low muscle mass and either reduced muscle strength or reduced physical function were diagnosed with “sarcopenia”. Both groups were jointly categorized as the sarcopenia group. Participants who did not meet the criteria for either obesity-suspected or sarcopenia were classified as the robust group.
In addition, sarcopenic obesity was further categorized into two distinct stages based on the disease severity. Stage I sarcopenic obesity was characterized by low muscle strength, reduced physical function, low muscle mass, and obesity. Stage II sarcopenic obesity was defined by a further decline in muscle strength and physical function, low muscle mass, obesity, and the presence of comorbidities. Comorbidities were defined as the presence of at least one chronic disease in individuals aged ≥70 years, including metabolic disorders, liver disease, kidney disease, heart disease, respiratory disease, gastric ulcer, osteoporosis, rheumatoid arthritis, thyroid disease, collagen diseases, or stroke, which are all associated with an increased likelihood of sarcopenic obesity [7,26].
2.3. Evaluation of Oral Function
The oral function was objectively evaluated by assessing the number of remaining teeth, tongue pressure, occlusal force, masticatory performance, and oral diadochokinesis (ODK). A comprehensive oral health assessment was performed by dental professionals who had received more than two hours of training and calibration prior to the survey. The examination was conducted under optimal lighting conditions, with the subject seated in a reclining chair. Participants who routinely wore dentures were assessed while wearing the dentures.
The number of remaining teeth was defined by third molars and roots, and implants, bridges, and dentures were excluded. Tongue pressure was measured twice using a JMS Tongue Pressure Measuring Device (JMS Co., Ltd., Hiroshima, Japan), and the highest value was recorded [27]. The occlusal force was quantified using an Occlusal Force Meter (GM10, Nagano Keiki, Tokyo, Japan) [28,29]. The maximum occlusal forces on the left and right sides were measured, and their sum was used in subsequent analysis [30,31]. Masticatory performance was evaluated using a standardized masticatory performance evaluation method (scoring method) using gummy jelly [31]. The participants chewed gummy jelly (UHA Mikakuto, Osaka, Japan) 30 times, followed by a visual evaluation of the expectorated fragments using a 10-level scale ranging from 0 to 9 [32]. Tongue motor function was evaluated using ODK. The articulatory velocity of /ta/ was measured using ODK measurement equipment (KENKOU-KUN Handy; Takei Scientific Instruments Co., Ltd., Niigata, Japan) [30].
2.4. Data Analysis
Data are presented as mean ± standard error (SE) for continuous variables. Differences between the two groups were assessed using the Student’s t-test. Comparisons among three or more groups were performed using one-way analysis of variance (ANOVA), followed by post hoc multiple comparisons. The Bonferroni correction was applied to adjust the p-values for multiple comparisons.
Categorical variables are presented as absolute numbers (n) and relative frequencies (%). Differences between categorical variables were analyzed using the chi-square or Fisher’s exact test, as appropriate, based on the expected cell counts.
We conducted Cox regression analysis using the incidence of sarcopenic obesity as the event and the time from baseline to follow-up as the time variable to determine whether oral function was an independent factor contributing to the development of sarcopenic obesity. The independent variable was the onset of sarcopenic obesity, and the explanatory variables were those showing a statistically significant difference between the health status groups in the cross-sectional analysis at baseline. The adjusted variables were sex, age, and health status at baseline (divided into four groups). Those with sarcopenic obesity at baseline were excluded from the analysis. We checked for multicollinearity between the explanatory variables and selected the variable with the highest significance level in cases of overlap. The final model was determined using a stepwise method (variable reduction Wald test) and multiple imputations. The criteria for adding and deleting variables were set at p < 0.05 and p < 0.10, respectively, with a maximum of 20 iterations.
For subgroup analyses, we conducted Cox regression analyses with sarcopenia onset as the event, targeting participants assigned to the robust or obese group at baseline, and examined factors contributing to the onset of sarcopenia. We also conducted a Cox regression analysis with obesity onset as the event, targeting participants in the robust or sarcopenia groups at baseline, and examined factors contributing to the onset of obesity. The subgroup analyses excluded participants with sarcopenic obesity at baseline or follow-up. Cox regression analysis of the subgroups was based on analysis of the onset of sarcopenic obesity.
Statistical significance was defined as a p-value of 0.05. All the statistical analyses were performed using SPSS, version 25.0.0 (IBM Corp., Armonk, NY, USA).
3. Results
Table 1 presents the participants’ characteristics.

Table 1.
Baseline and follow-up characteristics of participants.
This study included 597 participants (207 males and 390 females). The mean age was 72.8 ± 0.2 years, with males being slightly older (73.7 ± 0.4 years) than females (72.3 ± 0.3 years) (p = 0.003). Regarding obesity indicators, males had a higher mean BMI (23.2 ± 0.2 kg/m2) than females (22.2 ± 0.1 kg/m2) (p < 0.001). However, females had a higher body fat percentage (29.6 ± 0.3%) than males (23.1 ± 0.4%) (p < 0.001). Interestingly, a higher proportion of males (72.0%) had high body fat levels than females (48.7%) (p < 0.001).
Regarding sarcopenia markers, males had a higher SMI (0.868 ± 0.008 kg/BMI) than females (0.623 ± 0.005 kg/BMI) (p < 0.001). Males also had higher grip strength (35.4 ± 0.4 kg) than females (24.4 ± 0.7 kg) (p < 0.001).
At baseline, the distribution of sarcopenia and obesity categories was similar between both sexes, with 76.0% classified as robust, 18.1% as obese, 4.2% as sarcopenic, and 1.6% as sarcopenic obesity.
At follow-up, the mean age increased to 75.3 ± 0.2 years. The prevalence of sarcopenia and sarcopenic obesity showed sex-based differences (p = 0.046). Among male participants, 8.6% were classified as sarcopenic (including severe sarcopenia) and 2.9% as sarcopenic obese, compared with 5.4% and 1.0% among female participants, respectively. However, the differences between male and female participants were non-significant.
Table 2 shows the relationships between health conditions (robustness, obesity, sarcopenia, and sarcopenic obesity) and related factors.
Table 2.
The relationship between sarcopenic obesity and associated factors.
Significant age differences were detected between the groups (p < 0.001). Participants in the sarcopenia and sarcopenic obesity groups were older than those in the robust and obese groups. The mean age increased across all groups at follow-up, with the largest increase noted in the sarcopenia group (from 76.3 to 79.6 years). There were no significant sex differences between the groups at baseline or follow-up. Body composition metrics showed consistent patterns at baseline and follow-up. BMI and body fat percentage were significantly higher in the obese and sarcopenic obesity groups than in the robust and sarcopenia groups (p < 0.001). The SMI (kg/BMI) was the lowest in the sarcopenic obesity group at both the baseline and follow-up. Physical function measurements revealed notable differences. Grip strength was significantly lower in the sarcopenia group at baseline (p = 0.012) and follow-up (p = 0.001). The FTSST time was significantly longer in the sarcopenia and sarcopenic obesity groups at both baseline and follow-up (p < 0.001), with the gap widening at follow-up. The prevalence of hypertension was highest in the sarcopenic obesity group at baseline (70.0%) and follow-up (80.0%).
Participants in the sarcopenic obesity group had significantly fewer remaining teeth at baseline (p = 0.001). However, this difference was non-significant at follow-up. The obesity group exhibited the highest tongue pressure at both time points (p = 0.001).
Table 3 shows changes in health status between baseline and follow-up across four health states: robust, obesity, sarcopenia, and sarcopenic obesity.
Table 3.
Changes in health status between baseline and follow-up.
Most participants maintained their baseline health status during follow-up, particularly those classified as “robust” (89.9%) and “obesity” (76.9%). Some participants showed improvements; 18.5% of those with obesity at baseline were reclassified as robust at follow-up, 44.0% of participants with sarcopenia improved to robust, and 60.0% of participants with sarcopenic obesity were reclassified as obese.
Conversely, the health of some participants deteriorated; 4.2% of participants classified as robust became obese, 5.5% developed sarcopenia, and 1.9% of obese participants progressed to sarcopenia. Among participants with sarcopenic obesity at baseline, 10.0% improved and became robust, while 30.0% of participants remained sarcopenic obese at follow-up.
The McNemar–Bowker test (χ2 = 10.803, df = 6, p = 0.095) indicated no statistically significant changes in the overall distribution of health states between baseline and follow-up. During the follow-up period, most “robust” participants (408, 89.9%) maintained their health status, while 46 participants (10.1%) experienced deterioration. Among those with altered health status at baseline, 32 (22.4%) showed improved robustness.
Table 4 shows the results of examining the factors contributing to the occurrence of sarcopenic obesity based on the results of the prospective longitudinal analysis. After Cox regression analysis, four risk factors remained for the development of sarcopenic obesity. Males had a significantly higher risk of developing sarcopenic obesity than females (hazard ratio [HR] = 20.191, 95% confidence interval [CI]: 3.151–129.366, p = 0.002). As BMI increased, the risk of developing sarcopenic obesity also increased significantly (HR = 2.118, 95% CI: 1.554–2.886, p < 0.001). Furthermore, an increase in skeletal muscle mass significantly decreased the risk of sarcopenic obesity (HR = 0.661, 95% CI: 0.510–0.857, p = 0.002). Among oral functions, elevated tongue pressure slightly reduced the risk of sarcopenic obesity (HR = 0.906, 95% CI: 0.829–0.990, p = 0.028). The goodness of fit of the model was significant (-2 log-likelihood = 57.618, p < 0.001), and four significant predictors were identified from among the nine original variables.
Table 4.
Factors contributing to the occurrence of sarcopenic obesity, sarcopenia, and obesity.
Following the subclass analysis, three variables remained in the final model as risk factors for sarcopenia development. Males had a significantly higher risk of developing sarcopenia than females (HR = 31.231, 95% CI: 9.660–100.974, p < 0.001). Individuals exhibiting declining physical function (decline in grip strength or extension of the time to stand from a chair) had a significantly lower risk of developing sarcopenia (hazard ratio [HR] = 0.188, 95% CI: 0.065–0.543, p = 0.002). Furthermore, enhanced skeletal muscle mass significantly reduced the risk of developing sarcopenia (HR = 0.571, 95% CI: 0.469–0.695, p < 0.001). The goodness of fit of the model was significant (−2 log-likelihood = 286.929, p < 0.001).
The final model retained the two variables as risk factors for developing obesity. Males tended to have a higher risk of developing obesity than females, although the difference was non-significant (HR = 2.702, 95% CI: 0.830–8.801, p = 0.099). Elevated body fat percentage significantly increased the risk of developing obesity (hazard ratio [HR] = 1.192, 95% CI: 1.095–1.297, p < 0.001). These results were obtained using a stepwise reduction of variables (Wald test). The goodness of fit of the model was significant (−2 log-likelihood = 187.068, p < 0.001). Oral function variables were non-significant explanatory variables in the development of sarcopenia or obesity.
4. Discussion
In the current study, we aimed to elucidate the longitudinal relationship between sarcopenic obesity and oral function in independent older adults. Sex, body composition, and muscle mass were the most consistent predictors across outcomes. Additionally, tongue pressure was associated with the risk of sarcopenic obesity but was not a significant predictor of sarcopenia or obesity.
4.1. Characteristics of Sarcopenic Obesity
We showed that individuals with sarcopenic obesity were significantly older, exhibited higher body fat, and had poorer muscle function (longer FTSST times) than their robust or obese counterparts. These findings reinforce the notion that sarcopenic obesity is a more severe phenotype resulting from the interplay between sarcopenia and obesity. Furthermore, the high prevalence of comorbid conditions in this group, such as diabetes and hypertension, aligns with previously reported findings [33,34], underscoring the systemic impact of sarcopenic obesity on metabolic and cardiovascular health.
Prospective analyses revealed that males have a substantially higher risk of developing sarcopenic obesity than females. This may be due to sex-based differences in body composition [35], hormonal changes [36], lifestyle factors [37], or oral health behaviors [37]. These findings highlight the need for sex-specific interventions to mitigate sarcopenic obesity and its associated health risks.
For gender differences in sarcopenic obesity, previous studies have shown that aging in men is associated with decreased testosterone secretion, which induces skeletal muscle loss [38]. Reduced testosterone levels are also linked to increased visceral fat accumulation, as decreased physical activity and energy imbalance result in unused energy being stored as visceral fat. Furthermore, gender differences in dietary habits may contribute to the higher risk of sarcopenic obesity in men. Visceral fat secretes inflammatory cytokines, which may play a significant role in the development of sarcopenic obesity [6,21]. These sex-related differences may explain the higher hazard ratio observed for males in this study.
In addition, the prevalence of sarcopenic obesity revealed a slight decline over time, with some cases showing improvement or reclassification into obesity or robust categories, respectively. These trends suggest that targeted interventions focusing on weight management, physical activity, and oral health could reverse or stabilize the progression of sarcopenic obesity in older adults. Exercise interventions, such as resistance training and aerobic exercise, can effectively improve sarcopenic obesity [39]. Furthermore, while the relationship between sarcopenia, malnutrition, and oral frailty has been reported [40,41], reports have also suggested that declining masticatory function can hinder the consumption of meat and other foods high in protein, leading to a decrease in muscle mass [42]; hence, maintaining oral function may be effective in improving sarcopenic obesity.
4.2. Associations Between the Incidence of Sarcopenic Obesity and Oral Health
In this study, we confirmed the association between sarcopenic obesity and its development and oral function indices, such as tongue pressure and skeletal muscle mass. Accordingly, a decline in oral function may be associated with the development of sarcopenic obesity; however, the direction of causality remains unclear.
Inadequate nutrition could cause further muscle loss and metabolic abnormalities [43,44]. Specifically, subjects with sarcopenic obesity exhibited the lowest occlusal force and tongue pressure, which are important for chewing and overall oral health, and it was clear that occlusal force had some effect on the progression of sarcopenic obesity. Reduced tongue pressure observed in individuals with sarcopenic obesity may be attributed to several factors. Sarcopenia is associated with lower muscle quality, which can extend to the muscles involved in oral function, potentially reducing tongue pressure [45]. Chronic low-grade inflammation associated with obesity may affect muscle function, including mastication [46]. The loss of muscle mass, a well-known characteristic of sarcopenia, combined with increased fat mass in obesity, may negatively impact the strength of oral muscles [47].
The fact that tongue pressure contributes significantly to nutritional intake through its role in swallowing function and its relationship to systemic skeletal muscle strength makes it a more specific indicator than other oral function measures. Sarcopenic obesity in the elderly is characterized by the accumulation of visceral fat due to age-related loss of muscle mass and reduced physical activity. Previous cross-sectional studies have demonstrated a positive correlation between tongue pressure and total body skeletal muscle mass [48,49]. Furthermore, the tongue plays a critical role in transporting food masses during the feeding and swallowing process [50]. Considering that adequate tongue pressure supports normal nutrient intake and is positively associated with general skeletal muscle function and strength, it may be a specific factor in reducing the risk of developing sarcopenic obesity. Additionally, tongue pressure tends to be associated with sarcopenia more strongly than other oral function indicators, such as the number of teeth or swallowing ability [51]. This suggests that interventions focused solely on dental restoration or prosthetics may be insufficient. Instead, enhancing eating and swallowing functions, along with nutritional support, may be necessary to effectively prevent or manage sarcopenic obesity [52,53].
The relationship between sarcopenic obesity and reduced tongue pressure is likely bidirectional. Lower tongue pressure may lead to difficulties in eating, potentially resulting in a reduced intake of protein-rich foods and contributing to further muscle loss [45]. Conversely, the systemic effects of sarcopenic obesity may lead to reduced muscle strength in the oral system [46].
It is important to note that while our study found a significant association between tongue pressure and sarcopenic obesity, other oral function indicators, such as occlusal force and number of remaining teeth, were not identified as significant predictors in our final model. This finding suggests that the relationship between oral function and sarcopenic obesity may be complex and multifaceted, warranting further investigation [46].
4.3. Clinical Implications
Our findings suggest that promoting a balanced nutritional intake could potentially be a useful strategy for preventing or managing sarcopenic obesity. However, our study did not include direct nutritional interventions, and this approach remains a potential avenue for future research. It may be valuable in preventing sarcopenic obesity in older adults without reducing swallowing-related oral muscles while supporting the maintenance of skeletal muscle and physical functions and managing obesity. Additionally, continuously evaluating tongue pressure and monitoring longitudinal changes may be beneficial in delaying or reversing the progression of sarcopenic obesity.
4.4. Study Limitations
This study has several limitations. A potential limitation is the relatively small number of participants diagnosed with sarcopenic obesity at baseline (n = 10), which may reduce statistical power and affect generalizability. Additionally, the small sample size may increase the risk of false positives and false negatives, making it difficult to detect significant associations. Future studies with larger sample sizes and more diverse populations are warranted to confirm our results and provide a more comprehensive understanding of the relationship between oral function and sarcopenic obesity.
Furthermore, the study cohort was derived from a specific rural region in Japan, which may limit its generalizability to other populations with different lifestyles or healthcare access. The relatively short follow-up period may also hinder the detection of long-term associations between oral function and sarcopenic obesity. However, previous studies have shown that even shorter periods (3–6 months) can detect changes in body composition related to sarcopenic obesity, suggesting that our follow-up period of over two years is sufficient for this purpose [6].
Additionally, while we attempted to adjust for some potential confounding factors, such as age, sex, and health status, in our statistical models, residual confounding factors may still be present. Factors such as nutritional intake, medication use, and exercise habits could influence both oral function and the development of sarcopenic obesity. Since this study was conducted in Japan, the findings may not be fully applicable to Western populations or other Asian countries with different dietary patterns, exercise habits, and diagnostic criteria for sarcopenic obesity. To better understand these relationships and enhance generalizability, future research should incorporate detailed dietary assessments, such as food frequency questionnaires or dietary recalls, while also focusing on larger, more diverse populations with extended follow-up periods to address potential confounders and explore causative mechanisms. Furthermore, this study did not assess comprehensive oral health, particularly periodontal status. Severe periodontitis can cause systemic inflammation and exacerbate muscle deterioration associated with sarcopenic obesity. Future studies should include periodontal assessments to clarify the role of inflammation in this relationship.
5. Conclusions
Our study showed that sarcopenic obesity was independently associated with oral function, particularly tongue pressure. Although we did not detect a direct link between sarcopenia/obesity alone and oral function, the combination of sarcopenia and obesity appeared to be strongly associated with oral health. These findings suggest that preserving and enhancing tongue muscles, which are crucial for swallowing and other oral functions, could potentially play a role in delaying the development of sarcopenic obesity. However, further research is required to establish causality and explore the complex relationships between oral function, sarcopenia, and obesity.
Furthermore, our findings demonstrated that reduced tongue pressure was significantly associated with a decreased risk of developing sarcopenic obesity (HR = 0.906, 95% CI: 0.829–0.990, p = 0.028). These results suggest that tongue pressure assessment could be a valuable tool in routine geriatric evaluations, particularly for identifying individuals at risk of sarcopenic obesity. However, further research is needed to determine its validity as a definitive screening tool.
Future studies should explore intervention approaches combining nutritional guidance, resistance exercise, and tongue pressure training to improve muscle function. Additionally, developing a staging system for early sarcopenia detection and integrating oral health assessments into geriatric care may enhance diagnostic accuracy and health management.
Author Contributions
Conceptualization, Y.H. and K.S.; formal analysis, S.S. and S.Y.; data curation, S.S., Y.H. and K.T. (Kayoko Tamaki); data acquisition, S.S., S.Y., K.T. (Kana Tokumoto), H.H., H.K. (Hiromitsu Kishimoto), H.K. (Hiroshi Kusunoki), K.N., K.T. (Kayoko Tamaki) and K.H.; writing (original draft), S.S.; writing (review and editing), Y.H. and H.K. (Hiromitsu Kishimoto); supervision, H.K. (Hiromitsu Kishimoto) and K.S.; project administration, Y.H.; and funding acquisition, Y.H. All authors have read and agreed to the published version of the manuscript.
Funding
This study was supported in part by JSPS KAKENHI (grant number: 22K19496) (2022–2024), the National Center for Geriatrics and Gerontology (Choujyu 20-1, 21-18) (2022–2023), and Health Labour Sciences Research Grant (24FA1005) (2024) (Shinmura).
Institutional Review Board Statement
The study was conducted in accordance with the Declaration of Helsinki and approved by the ethics committee of Hyogo College of Medicine (approval no. Rinhi 0342, approval date: 23 May 2017) and Niigata University (Approval number: G2021-0027). All methods were carried out in accordance with the relevant guidelines and regulations.
Informed Consent Statement
Written informed consent has been obtained from all subjects involved in the study to publish this paper.
Data Availability Statement
Data supporting the findings of this study are available from the corresponding author upon reasonable request. However, the data are not publicly available due to privacy and ethical restrictions.
Acknowledgments
We would like to express our sincere gratitude to all the participants who took part in the FESTA study. We would also like to express our deep appreciation to the staff of the Department of Oral and Maxillofacial Surgery at Hyogo Medical University and the medical staff at Hyogo Medical University who cooperated with the FESTA study.
Conflicts of Interest
The authors declare no conflicts of interest. The funders had no role in the study design, data collection and analysis, manuscript preparation, or decision to publish this study.
References
- Choi, K.M. Sarcopenia and sarcopenic obesity. Korean J. Intern. Med. 2016, 31, 1054–1060. [Google Scholar] [CrossRef]
- Roh, E.; Choi, K.M. Health Consequences of Sarcopenic Obesity: A Narrative Review. Front. Endocrinol. 2020, 11, 332. [Google Scholar] [CrossRef]
- Gill, L.E.; Bartels, S.J.; Batsis, J.A. Weight Management in Older Adults. Curr. Obes. Rep. 2015, 4, 379–388. [Google Scholar] [CrossRef]
- van den Broek-Altenburg, E.; Atherly, A.; Holladay, E. Changes in healthcare spending attributable to obesity and overweight: Payer- and service-specific estimates. BMC Public Health 2022, 22, 962. [Google Scholar] [CrossRef]
- Morgan, P.T.; Smeuninx, B.; Breen, L. Exploring the Impact of Obesity on Skeletal Muscle Function in Older Age. Front. Nutr. 2020, 7, 569904. [Google Scholar] [CrossRef] [PubMed]
- Batsis, J.A.; Villareal, D.T. Sarcopenic obesity in older adults: Aetiology, epidemiology and treatment strategies. Nat. Rev. Endocrinol. 2018, 14, 513–537. [Google Scholar] [CrossRef] [PubMed]
- Donini, L.M.; Busetto, L.; Bischoff, S.C.; Cederholm, T.; Ballesteros-Pomar, M.D.; Batsis, J.A.; Bauer, J.M.; Boirie, Y.; Cruz-Jentoft, A.J.; Dicker, D.; et al. Definition and Diagnostic Criteria for Sarcopenic Obesity: ESPEN and EASO Consensus Statement. Obes. Facts 2022, 15, 321–335. [Google Scholar] [CrossRef] [PubMed]
- Liu, C.; Wong, P.Y.; Chung, Y.L.; Chow, S.K.; Cheung, W.H.; Law, S.W.; Chan, J.C.N.; Wong, R.M.Y. Deciphering the “obesity paradox” in the elderly: A systematic review and meta-analysis of sarcopenic obesity. Obes. Rev. 2023, 24, e13534. [Google Scholar] [CrossRef]
- Unger, R.H. Longevity, lipotoxicity and leptin: The adipocyte defense against feasting and famine. Biochimie 2005, 87, 57–64. [Google Scholar] [CrossRef]
- Lynch, G.M.; Murphy, C.H.; Castro, E.d.M.; Roche, H.M. Inflammation and metabolism: The role of adiposity in sarcopenic obesity. Proc. Nutr. Soc. 2020, 79, 435–447. [Google Scholar] [CrossRef]
- Alalwan, T.A. Phenotypes of Sarcopenic Obesity: Exploring the Effects on Peri-Muscular Fat, the Obesity Paradox, Hormone-Related Responses and the Clinical Implications. Geriatrics 2020, 5, 8. [Google Scholar] [CrossRef] [PubMed]
- Stephen, W.C.; Janssen, I. Sarcopenic-obesity and cardiovascular disease risk in the elderly. J. Nutr. Health Aging 2009, 13, 460–466. [Google Scholar] [CrossRef]
- Park, S.H.; Park, J.H.; Song, P.S.; Kim, D.K.; Kim, K.H.; Seol, S.H.; Kim, H.K.; Jang, H.J.; Lee, J.G.; Park, H.Y.; et al. Sarcopenic obesity as an independent risk factor of hypertension. J. Am. Soc. Hypertens. JASH 2013, 7, 420–425. [Google Scholar] [CrossRef]
- Baek, S.J.; Nam, G.E.; Han, K.D.; Choi, S.W.; Jung, S.W.; Bok, A.R.; Kim, Y.H.; Lee, K.S.; Han, B.D.; Kim, D.H. Sarcopenia and sarcopenic obesity and their association with dyslipidemia in Korean elderly men: The 2008-2010 Korea National Health and Nutrition Examination Survey. J. Endocrinol. Investig. 2014, 37, 247–260. [Google Scholar] [CrossRef]
- Kera, T.; Kawai, H.; Hirano, H.; Kojima, M.; Fujiwara, Y.; Ihara, K.; Obuchi, S. Differences in body composition and physical function related to pure sarcopenia and sarcopenic obesity: A study of community-dwelling older adults in Japan. Geriatr. Gerontol. Int. 2017, 17, 2602–2609. [Google Scholar] [CrossRef]
- Khadra, D.; Itani, L.; Tannir, H.; Kreidieh, D.; El Masri, D.; El Ghoch, M. Association between sarcopenic obesity and higher risk of type 2 diabetes in adults: A systematic review and meta-analysis. World J. Diabetes 2019, 10, 311–323. [Google Scholar] [CrossRef]
- Hatta, K.; Ikebe, K. Association between oral health and sarcopenia: A literature review. J. Prosthodont. Res. 2021, 65, 131–136. [Google Scholar] [CrossRef]
- Kugimiya, Y.; Iwasaki, M.; Ohara, Y.; Motokawa, K.; Edahiro, A.; Shirobe, M.; Watanabe, Y.; Taniguchi, Y.; Seino, S.; Abe, T.; et al. Association between sarcopenia and oral functions in community-dwelling older adults: A cross-sectional study. J. Cachexia Sarcopenia Muscle 2023, 14, 429–438. [Google Scholar] [CrossRef]
- Abe, T.; Tominaga, K.; Ando, Y.; Toyama, Y.; Takeda, M.; Yamasaki, M.; Okuyama, K.; Hamano, T.; Isomura, M.; Nabika, T.; et al. Number of teeth and masticatory function are associated with sarcopenia and diabetes mellitus status among community-dwelling older adults: A Shimane CoHRE study. PLoS ONE 2021, 16, e0252625. [Google Scholar] [CrossRef] [PubMed]
- Iwashita, M.; Hayashi, M.; Nishimura, Y.; Yamashita, A. The Link Between Periodontal Inflammation and Obesity. Curr. Oral Health Rep. 2021, 8, 76–83. [Google Scholar] [CrossRef] [PubMed]
- Reytor-González, C.; Parise-Vasco, J.M.; González, N.; Simancas-Racines, A.; Zambrano-Villacres, R.; Zambrano, A.K.; Simancas-Racines, D. Obesity and periodontitis: A comprehensive review of their interconnected pathophysiology and clinical implications. Front. Nutr. 2024, 11, 1440216. [Google Scholar] [CrossRef] [PubMed]
- Modéer, T.; Blomberg, C.C.; Wondimu, B.; Julihn, A.; Marcus, C. Association between obesity, flow rate of whole saliva, and dental caries in adolescents. Obesity 2010, 18, 2367–2373. [Google Scholar] [CrossRef] [PubMed]
- Roa, I.; Del Sol, M. Obesity, salivary glands and oral pathology. Colomb. Medica 2018, 49, 280–287. [Google Scholar] [CrossRef]
- Mohajeri, A.; Berg, G.; Watts, A.; Cheever, V.J.; Hung, M. Obesity and Dental Caries in School Children. J. Clin. Med. 2024, 13, 860. [Google Scholar] [CrossRef]
- Chen, L.K.; Woo, J.; Assantachai, P.; Auyeung, T.W.; Chou, M.Y.; Iijima, K.; Jang, H.C.; Kang, L.; Kim, M.; Kim, S.; et al. Asian Working Group for Sarcopenia: 2019 Consensus Update on Sarcopenia Diagnosis and Treatment. J. Am. Med. Dir. Assoc. 2020, 21, 300–307.e2. [Google Scholar] [CrossRef]
- Ishii, K.; Ogawa, W.; Kimura, Y.; Kusakabe, T.; Miyazaki, R.; Sanada, K.; Satoh-Asahara, N.; Someya, Y.; Tamura, Y.; Ueki, K.; et al. Diagnosis of sarcopenic obesity in Japan: Consensus statement of the Japanese Working Group on Sarcopenic Obesity. Geriatr. Gerontol. Int. 2024, 24, 997–1000. [Google Scholar] [CrossRef]
- Utanohara, Y.; Hayashi, R.; Yoshikawa, M.; Yoshida, M.; Tsuga, K.; Akagawa, Y. Standard values of maximum tongue pressure taken using newly developed disposable tongue pressure measurement device. Dysphagia 2008, 23, 286–290. [Google Scholar] [CrossRef]
- Hasegawa, Y.; Horii, N.; Sakuramoto-Sadakane, A.; Nagai, K.; Ono, T.; Sawada, T.; Shinmura, K.; Kishimoto, H. Is a History of Falling Related to Oral Function? A Cross-Sectional Survey of Elderly Subjects in Rural Japan. Int. J. Environ. Res. Public Health 2019, 16, 3843. [Google Scholar] [CrossRef]
- Hasegawa, Y.; Sakuramoto, A.; Sugita, H.; Hasegawa, K.; Horii, N.; Sawada, T.; Shinmura, K.; Kishimoto, H. Relationship between oral environment and frailty among older adults dwelling in a rural Japanese community: A cross-sectional observational study. BMC Oral Health 2019, 19, 23. [Google Scholar] [CrossRef] [PubMed]
- Thu Ya, M.; Hasegawa, Y.; Sta Maria, M.T.; Hattori, H.; Kusunoki, H.; Nagai, K.; Tamaki, K.; Hori, K.; Kishimoto, H.; Shinmura, K. Predicting cognitive function changes from oral health status: A longitudinal cohort study. Sci. Rep. 2024, 14, 24153. [Google Scholar] [CrossRef]
- Marito, P.; Hasegawa, Y.; Tamaki, K.; Sta Maria, M.T.; Yoshimoto, T.; Kusunoki, H.; Tsuji, S.; Wada, Y.; Ono, T.; Sawada, T.; et al. The Association of Dietary Intake, Oral Health, and Blood Pressure in Older Adults: A Cross-Sectional Observational Study. Nutrients 2022, 14, 1279. [Google Scholar] [CrossRef] [PubMed]
- Nokubi, T.; Yoshimuta, Y.; Nokubi, F.; Yasui, S.; Kusunoki, C.; Ono, T.; Maeda, Y.; Yokota, K. Validity and reliability of a visual scoring method for masticatory ability using test gummy jelly. Gerodontology 2013, 30, 76–82. [Google Scholar] [CrossRef]
- Nojiri, S.; Itoh, H.; Kasai, T.; Fujibayashi, K.; Saito, T.; Hiratsuka, Y.; Okuzawa, A.; Naito, T.; Yokoyama, K.; Daida, H. Comorbidity status in hospitalized elderly in Japan: Analysis from National Database of Health Insurance Claims and Specific Health Checkups. Sci. Rep. 2019, 9, 20237. [Google Scholar] [CrossRef] [PubMed]
- Aïdoud, A.; Gana, W.; Poitau, F.; Debacq, C.; Leroy, V.; Nkodo, J.A.; Poupin, P.; Angoulvant, D.; Fougère, B. High Prevalence of Geriatric Conditions Among Older Adults With Cardiovascular Disease. J. Am. Heart Assoc. 2023, 12, e026850. [Google Scholar] [CrossRef] [PubMed]
- Hwang, J.; Park, S. Gender-Specific Prevalence and Risk Factors of Sarcopenic Obesity in the Korean Elderly Population: A Nationwide Cross-Sectional Study. Int. J. Environ. Res. Public Health 2023, 20, 1140. [Google Scholar] [CrossRef]
- Du, Y.; Wang, X.; Xie, H.; Zheng, S.; Wu, X.; Zhu, X.; Zhang, X.; Xue, S.; Li, H.; Hong, W.; et al. Sex differences in the prevalence and adverse outcomes of sarcopenia and sarcopenic obesity in community dwelling elderly in East China using the AWGS criteria. BMC Endocr. Disord. 2019, 19, 109. [Google Scholar] [CrossRef]
- Cao, W.; Zhu, A.; Chu, S.; Zhou, Q.; Zhou, Y.; Qu, X.; Tang, Q.; Zhang, Y. Correlation between nutrition, oral health, and different sarcopenia groups among elderly outpatients of community hospitals: A cross-sectional study of 1505 participants in China. BMC Geriatr. 2022, 22, 332. [Google Scholar] [CrossRef]
- Rolland, Y.; Czerwinski, S.; Abellan Van Kan, G.; Morley, J.E.; Cesari, M.; Onder, G.; Woo, J.; Baumgartner, R.; Pillard, F.; Boirie, Y.; et al. Sarcopenia: Its assessment, etiology, pathogenesis, consequences and future perspectives. J. Nutr. Health Aging 2008, 12, 433–450. [Google Scholar] [CrossRef]
- Reiter, L.; Bauer, S.; Traxler, M.; Schoufour, J.D.; Weijs, P.J.M.; Cruz-Jentoft, A.; Topinková, E.; Eglseer, D. Effects of Nutrition and Exercise Interventions on Persons with Sarcopenic Obesity: An Umbrella Review of Meta-Analyses of Randomised Controlled Trials. Curr. Obes. Rep. 2023, 12, 250–263. [Google Scholar] [CrossRef]
- Tanaka, T.; Takahashi, K.; Hirano, H.; Kikutani, T.; Watanabe, Y.; Ohara, Y.; Furuya, H.; Tetsuo, T.; Akishita, M.; Iijima, K. Oral Frailty as a Risk Factor for Physical Frailty and Mortality in Community-Dwelling Elderly. J. Gerontol. Ser. A Biol. Sci. Med. Sci. 2018, 73, 1661–1667. [Google Scholar] [CrossRef]
- Iwasaki, M.; Motokawa, K.; Watanabe, Y.; Shirobe, M.; Inagaki, H.; Edahiro, A.; Ohara, Y.; Hirano, H.; Shinkai, S.; Awata, S. Association between Oral Frailty and Nutritional Status Among Community-Dwelling Older Adults: The Takashimadaira Study. J. Nutr. Health Aging 2020, 24, 1003–1010. [Google Scholar] [CrossRef]
- Takahara, M.; Shiraiwa, T.; Maeno, Y.; Yamamoto, K.; Shiraiwa, Y.; Yoshida, Y.; Nishioka, N.; Katakami, N.; Matsuoka, T.A.; Shimomura, I. Association of obesity, diabetes, and physical frailty with dental and tongue-lip motor dysfunctions in patients with metabolic disease. Obes. Res. Clin. Pract. 2021, 15, 243–248. [Google Scholar] [CrossRef] [PubMed]
- McGlory, C.; van Vliet, S.; Stokes, T.; Mittendorfer, B.; Phillips, S.M. The impact of exercise and nutrition on the regulation of skeletal muscle mass. J. Physiol. 2019, 597, 1251–1258. [Google Scholar] [CrossRef]
- Marshall, R.N.; Smeuninx, B.; Morgan, P.T.; Breen, L. Nutritional Strategies to Offset Disuse-Induced Skeletal Muscle Atrophy and Anabolic Resistance in Older Adults: From Whole-Foods to Isolated Ingredients. Nutrients 2020, 12, 1533. [Google Scholar] [CrossRef]
- Moynihan, P.J.; Teo, J.L. Exploring Oral Function, Protein Intake, and Risk of Sarcopenia: A Scoping Review. JDR Clin. Transl. Res. 2024, 9, 4–20. [Google Scholar] [CrossRef]
- Shirahase, R.; Watanabe, Y.; Saito, T.; Sunakawa, Y.; Matsushita, Y.; Tsugayasu, H.; Yamazaki, Y. A Cross-Sectional Study on the Relationship between Oral Function and Sarcopenia in Japanese Patients with Regular Dental Maintenance. Int. J. Environ. Res. Public Health 2022, 19, 5178. [Google Scholar] [CrossRef]
- Nakazawa, Y.; Kikutani, T.; Igarashi, K.; Yajima, Y.; Tamura, F. Associations between tongue strength and skeletal muscle mass under dysphagia rehabilitation for geriatric out patients. J. Prosthodont. Res. 2020, 64, 188–192. [Google Scholar] [CrossRef]
- Murakami, T.; Kamide, N.; Ando, M.; Hata, W.; Sakamoto, M. Association between tongue pressure and skeletal muscle mass and muscle function in community-dwelling older people without sarcopenia. Eur. Geriatr. Med. 2022, 13, 649–653. [Google Scholar] [CrossRef]
- Hori, K.; Taniguchi, H.; Hayashi, H.; Magara, J.; Minagi, Y.; Li, Q.; Ono, T.; Inoue, M. Role of tongue pressure production in oropharyngeal swallow biomechanics. Physiol. Rep. 2013, 1, e00167. [Google Scholar] [CrossRef] [PubMed]
- Chen, K.C.; Lee, T.M.; Wu, W.T.; Wang, T.G.; Han, D.S.; Chang, K.V. Assessment of Tongue Strength in Sarcopenia and Sarcopenic Dysphagia: A Systematic Review and Meta-Analysis. Front. Nutr. 2021, 8, 684840. [Google Scholar] [CrossRef]
- Shimizu, A.; Fujishima, I.; Maeda, K.; Wakabayashi, H.; Nishioka, S.; Ohno, T.; Nomoto, A.; Kayashita, J.; Mori, N.; The Japanese Working Group on Sarcopenic Dysphagia. Nutritional Management Enhances the Recovery of Swallowing Ability in Older Patients with Sarcopenic Dysphagia. Nutrients 2021, 13, 596. [Google Scholar] [CrossRef] [PubMed]
- Abe, S.; Kokura, Y.; Maeda, K.; Nishioka, S.; Momosaki, R.; Matsuoka, H.; Tomii, Y.; Sugita, S.; Shimizu, K.; Esashi, N.; et al. Effects of Undernutrition on Swallowing Function and Activities of Daily Living in Hospitalized Patients: Data from the Japanese Sarcopenic Dysphagia Database. Nutrients 2023, 15, 1291. [Google Scholar] [CrossRef] [PubMed]
- Huang, S.W.; Ku, J.W.; Lin, L.F.; Liao, C.D.; Chou, L.C.; Liou, T.H. Body composition influenced by progressive elastic band resistance exercise of sarcopenic obesity elderly women: A pilot randomized controlled trial. Eur. J. Phys. Rehabil. Med. 2017, 53, 556–563. [Google Scholar] [CrossRef]
Disclaimer/Publisher’s Note: The statements, opinions and data contained in all publications are solely those of the individual author(s) and contributor(s) and not of MDPI and/or the editor(s). MDPI and/or the editor(s) disclaim responsibility for any injury to people or property resulting from any ideas, methods, instructions or products referred to in the content. |
© 2025 by the authors. Licensee MDPI, Basel, Switzerland. This article is an open access article distributed under the terms and conditions of the Creative Commons Attribution (CC BY) license (https://creativecommons.org/licenses/by/4.0/).