Article

Blended Multi-Modal Deep ConvNet Features for Diabetic Retinopathy Severity Prediction

by
Jyostna Devi Bodapati
1,
Veeranjaneyulu Naralasetti
2,
Shaik Nagur Shareef
1,
Saqib Hakak
3,
Muhammad Bilal
4,
Praveen Kumar Reddy Maddikunta
5 and
Ohyun Jo
6,*
1
Department of CSE, Vignan’s Foundation for Science Technology and Research, Guntur 522213, India
2
Department of IT, Vignan’s Foundation for Science Technology and Research, Guntur 522213, India
3
Faculty of Computer Science, University of Northern British Columbia, Prince George, BC V2N 4Z9, Canada
4
Department of Computer and Electronics Systems Engineering, Hankuk University of Foreign Studies, Yongin-si 17035, Korea
5
School of Information Technology and Engineering, The Vellore Institute of Technology (VIT), Vellore 632014, India
6
Department of Computer Science, College of Electrical and Computer Engineering, Chungbuk National University, Cheongju 28644, Korea
*
Author to whom correspondence should be addressed.
Electronics 2020, 9(6), 914; https://doi.org/10.3390/electronics9060914
Submission received: 3 May 2020 / Revised: 25 May 2020 / Accepted: 28 May 2020 / Published: 30 May 2020
(This article belongs to the Special Issue Computational Intelligence in Healthcare)

Abstract

:
Diabetic Retinopathy (DR) is one of the major causes of visual impairment and blindness across the world. It is usually found in patients who suffer from diabetes for a long period. The major focus of this work is to derive optimal representation of retinal images that further helps to improve the performance of DR recognition models. To extract optimal representation, features extracted from multiple pre-trained ConvNet models are blended using proposed multi-modal fusion module. These final representations are used to train a Deep Neural Network (DNN) used for DR identification and severity level prediction. As each ConvNet extracts different features, fusing them using 1D pooling and cross pooling leads to better representation than using features extracted from a single ConvNet. Experimental studies on benchmark Kaggle APTOS 2019 contest dataset reveals that the model trained on proposed blended feature representations is superior to the existing methods. In addition, we notice that cross average pooling based fusion of features from Xception and VGG16 is the most appropriate for DR recognition. With the proposed model, we achieve an accuracy of 97.41%, and a kappa statistic of 94.82 for DR identification and an accuracy of 81.7% and a kappa statistic of 71.1% for severity level prediction. Another interesting observation is that DNN with dropout at input layer converges more quickly when trained using blended features, compared to the same model trained using uni-modal deep features.

1. Introduction

Diabetic Retinopathy (DR) is an adverse effect of Diabetes Mellitus (DM) [1] that leads to permanent blindness in humans. It is usually caused by the damage to blood vessels that provide nourishment to light-sensitive tissue called the retina. As per statistics [2], DR is the fifth leading cause for blindness across the globe. According to the World Health Organization (WHO), in 2013, around 382 million people were suffering from DR, and this number may rise to 592 million by 2025. It is possible to save many people from going blind if DR is identified in the early stages. Small lesions are formed in the eyes of DR-affected people and the type of lesions formed decides the level of severity of DR. Figure 1a shows types of lesions that include Micro Aneurysms (MA), exudates, hemorrhages, cotton wool spots, and improperly grown blood vessels on the retina.
DR can be categorized into five different stages [3]: no DR (Class 0), mild DR (Class 1), moderate DR (Class 2), severe DR (Class 3), and proliferative DR (Class 4). Sample retinal images with different severity levels of DR are shown in Figure 1b. Mild DR is the early stage during which the formation of Micro Aneurysms (MA) can be observed. As the disease progresses to moderate stage, swelling of blood vessels can be found, which leads to blurred vision. During the later non-proliferative DR (NPDR) stage, abnormal growth of blood vessels can be noticed. This stage is severe due to the blockage of a large number of blood vessels. Proliferative DR (PDR) is the advanced stage of DR; during this stage, retinal detachment along with large retinal break can be observed that leads to complete vision loss [4].
In traditional DR diagnosis approaches, manual grading of the retinal scan is required to identify the presence or absence of retinopathy. If DR is confirmed as positive, further diagnosis is recommended to identify severity level of the disease. This kind of diagnosis is quite expensive and time consuming as it demands human expertise. If DR identification is automated, then diagnosis of the disease becomes affordable to many people. In the recent past, several machine learning tools have been introduced to address this problem.
Early approaches to DR identification, where the presence or absence of DR is revealed, focuses on spotting the Hard Exudates (HEs). A dynamic threshold based Support Vector Machine (SVM) is used to segment HE in the retinal images [5]. Fuzzy C-means is used to detect HE and SVM is used to identify severity level of the disease to make the system more sophisticated [6]. SVM-based classifiers are adapted to find cotton wool spots in the retinal images.
With the introduction of deep learning, the focus of researchers has shifted from spotting HEs to MAs. A two-step CNN has been introduced to segment MAs in the given retinal scans [7]. Another CNN architecture that is trained using selective sampling approach is proposed to detect hemorrhages [8]. A max-out activation is introduced to improve the performance of a DNN model, for which DR is used as an application to find MA [9]. Recently, a bounding box based approach has been introduced to identify the region of interest in the retinal images [10]. Although many methods are available in the literature, they are either sub-optimal or complex. Hence, there is a need for a solution that is simple and robust.
The objective of this work is to design a simple and robust deep learning-based approach to recognize DR from the given retinal images. The major focus of this work is to obtain a better feature representation of the retinal images, which ultimately leads to a better model. To accomplish this, we propose uni- and multi-modal approaches. Initially, for the given retinal images, deep features are extracted from different pre-trained ConvNets such as VGG16, NASNet, Xception, and Inception ResNetV2. In the uni-modal approach, features extracted from a single pre-trained ConvNet gives the final feature representation. In the multi-modal approach, our idea is to blend the deep features extracted from multiple ConvNets to get the final feature representation. We propose different pooling-based approaches to blend multiple deep features. To check the efficiency of our feature representation, a Deep Neural Network (DNN) architecture is proposed for identification of DR (Task 1) and to recognize severity level of DR (Task 2). We observe that, in the multi-modal approach, blending deep features from Xception and Inception ResNet V2 outperforms others in both tasks. Another interesting observation is that there is a drop in the number of false positives, which is most desirable. Experimental studies on the benchmark APTOS 2019 dataset revealed that our blended feature representations trained using DNN model give superior performance compared to the existing methods.
The following are the major contributions of the proposed work:
  • Effectiveness of the uni-modal feature representation is verified.
  • A blended multi-modal feature representation approach is introduced
  • Different pool-based approaches are proposed to blend deep features.
  • A DNN architecture with dropout at the input layer is proposed to test the efficiency of the proposed uni-modal and blended multi-modal feature representations.
  • APTOS 2019 benchmark dataset was used to compare the performance of the proposed approach with existing models.

2. Related Work

Recently, machine learning models are very popular to solve various problems such as image classification [11], text processing [12], real-time fault diagnosis [13], and healthcare tasks [14,15]. It is very common to use ML algorithms to address disease prediction [16,17,18].
In this section, we report various conventional models available in the literature for the task of DR recognition. In [19], an easy to remember scientific approach is introduced for DR severity identification. In [20], the authors presented a hybrid classifier by using both GMM and SVM as an ensemble model to improve the accuracy of the model. The same approach has been modified by augmenting the feature set with shape, intensity, and statistics of the affected region [21]. A random forest-based approach is proposed in [22,23] and segmentation-based approaches are proposed in [24]. In [25], a genetic algorithm-based feature extraction method is introduced. Different shallow classifiers such as GMM, KNN, SVM, and AdaBoost have been analyzed [26] to differentiate lesions from non-lesions. A hybrid feature extraction based approach is used in [27].
In the next few lines, deep learning models available in the literature for the task of DR severity identification are introduced. A large dataset consisting of 1,28,175 retinal images is used and trained using deep CNN. In [28], data augmentation method is used to generate the data on CNN architecture. Fuzzy models are used in [29]; a hybrid model that is designed based on fuzzy logic, Hough Transform, and numerous extraction methods are implemented as part of their system. A combination of fuzzy C-means and deep CNN architectures are used in [30]. A Siamese convolutional neural network is used in [31] to detect diabetic retinopathy.
With the introduction of deep learning models, focus has shifted to deep feature-based models. In [32], used features extracted from different layers of pre-trained ConvNets such as VGG19 and further applied PCA and SVD on those features for dimension reduction [33] to avoid overfitting. In the case of former models, the model is not robust, and, in the latter case, the models are robust, but large datasets are needed to train them. A PCA based fire-fly model [34] along with deep neural network is used for DR detection in [35], and the UCI repository is used for the experiments.
The performance of any ML algorithm is subject to the features extracted from the given data. Conventional ML models need a separate algorithm (GIST, HOG, and SIFT) for feature learning and give a global or local representation of the images and the features. Features extracted in this process are known as handcrafted features. Until the entry of deep learning models, these handcrafted features were dominant and being widely used for feature extraction.

Deep ConvNets for Feature Extraction and Transfer Learning

Deep learning models [36,37,38] learn the essential characteristics of the input images. This exceptional capability of the deep models make them representation models, as they can represent the data efficiently and reduce the use of the additional feature extraction phase where features are handcrafted. Deeper layers of the CNN models can represent the entire given input more efficiently than the early layers.
The downside of the deep learning models is that they need enormous amounts of data for training, which is usually scarce for most real-time applications. This problem can be addressed by the introduction of transfer learning, where the knowledge gained by a deep learning model can be transferred to other models. To achieve this, deep pre-trained CNN models such as VGG16 and ResNet152 are available for transfer learning. Pre-trained models are the models that are trained on large amounts of data, and the weights updated during the training of the complex model can be applied to similar kinds of tasks.
There are different types of pre-trained models which are trained on large scale datasets, such as ImageNet that consists of more than a million images. Popular pre-trained deep CNN models such as VGG16, VGG19, ResNet152, InceptionV3, Xception, NASNet, Inception ResNet V2 and DarkNet are briefly described below:
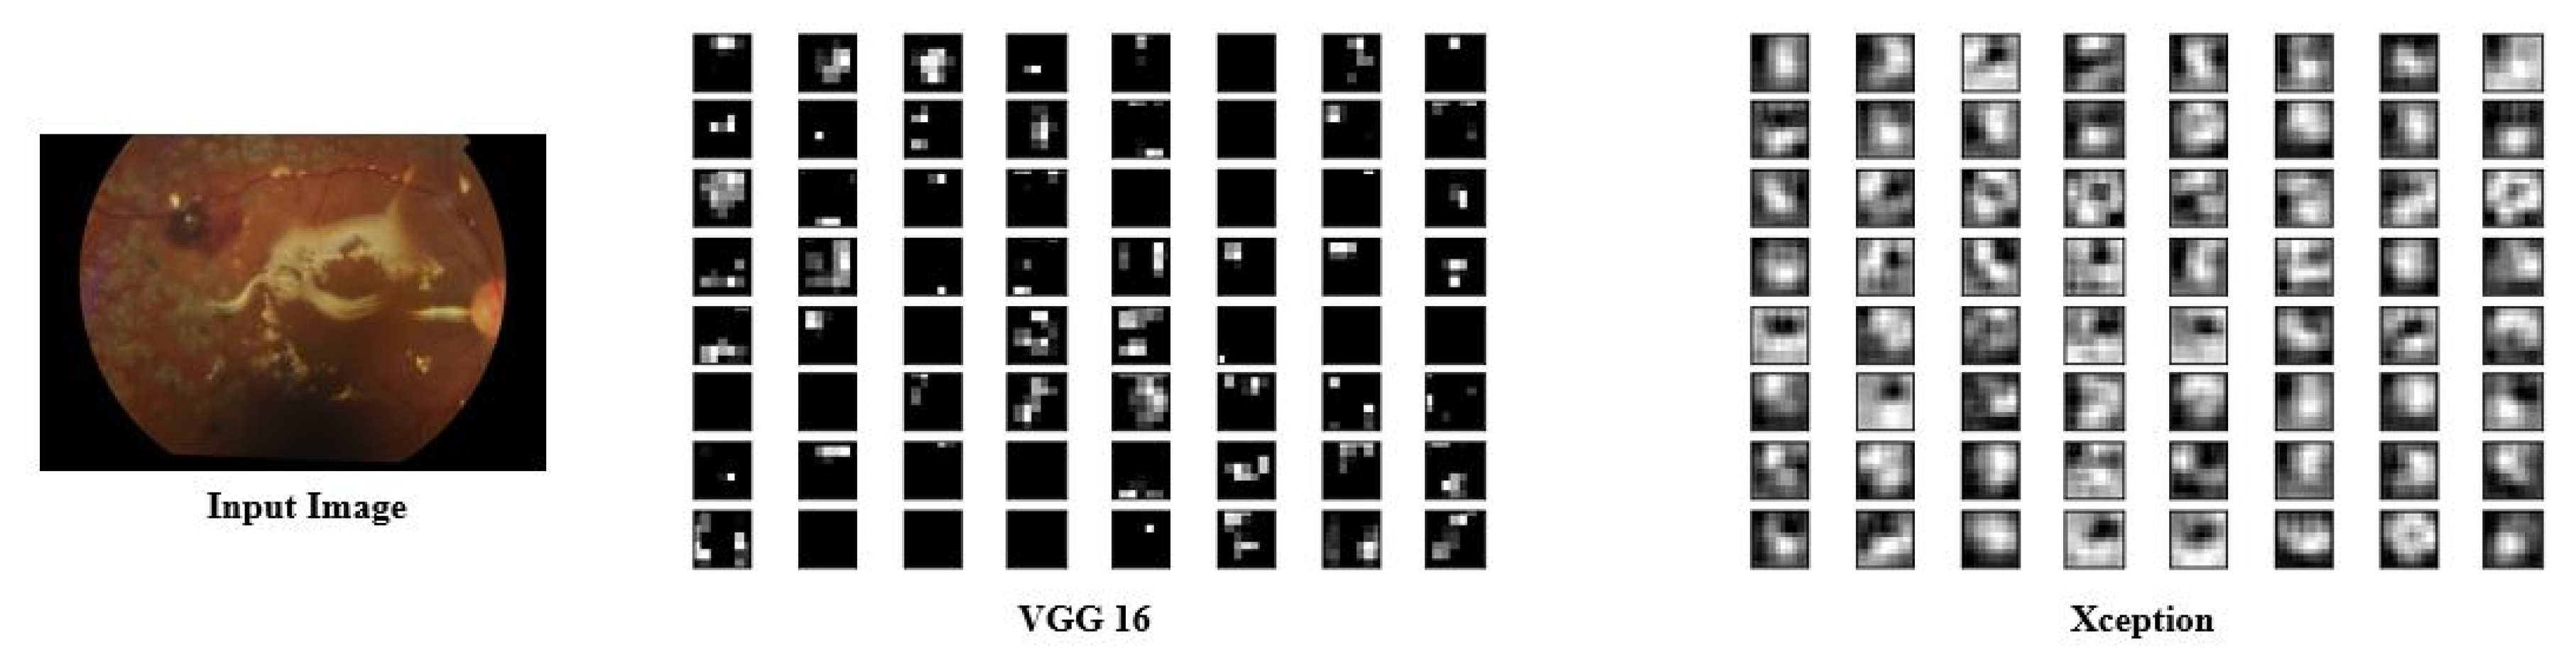
  • Visual Geometric Group (VGG 16): VGG16 is a deep ConvNet trained on 14 million images belonging to 1000 different classes and topped the leader board in ILSVR (ImageNet) challenge. In this architecture, 2 × 2 filters are used with stride 1 for convolution operation, and 2 × 2 filters with stride two and the same padding are used for max-pooling operation across the network. At the end of architecture, two fully connected dense layers of 4096 neurons are connected followed by soft-max layer.
  • Neural Architecture Search Network (NASNet): This is a special kind of deep CNN which searches for a better architectural building block on small datasets such as CIFAR10 and transfers it to larger datasets such as ImageNet. It has a better regularization mechanism called scheduled drop path, which significantly improves generalization.
  • Xception: Xception is another deep ConvNet architecture that supports depth-wise separable convolution operations and outperformed ResNet and InceptionV3 in the ILSVR challenge.
  • Inception ResNetV2: This is popularly known as InceptionV4, as it combines two different architectures: InceptionV3 and ResNet152. It has both inception and residual connections, which boost the performance of the model.
Deep neural networks give excellent performance only when trained with extensive data. If the data used to train are not sufficient, then the DNN models tend to overfit. Deep, convolutional neural networks are introduced in [39] for the task of scalable image recognition. Xception, a deep CNN, is developed using depth-wise separable convolutions to improve the performance [40]. A flexible architecture is defined in [41], which can search for a better convolutional cell with better regularization mechanism. All these models are trained on ImageNet Dataset for ILSVR challenge.
Our objective is to create a robust and efficient model to recognize DR with limited datasets and with limited computational resources. To achieve our objective of creating a robust model with small datasets, we seek the help of transfer learning and use various pre-trained ConvNets to extract deep features. We use the knowledge of these models to extract the most prominent features of color fundus images. A deep neural network with dropout introduced at early layers is trained to detect and classify the severity levels of diabetic retinopathy. As we introduced dropout at the input layer, deep neural network is immune to overfitting.

3. Proposed Methodology

In this work, our objective is to develop a robust and efficient model to automate DR diagnosis. We focus on the extraction of deep features that are most descriptive and discriminate, which ultimately improves the performance of DR recognition. To get an optimal representation, features are extracted from multiple pre-trained CNN architectures and are blended using pooling-based approaches. These final representations are used to train a deep neural network with a dropout at the input layer. The proposed model has three different modules: feature extraction, model training, and evaluation module.

3.1. Feature Extraction

Performance of any machine learning model is highly influenced by the feature representations and the same is applicable to models used for DR recognition. With this motivation, we propose two different approaches (uni-modal and multi-modal) to extract optimal features from the given retinal images.
In the proposed work, initial representations of the retinal images are obtained from the pre-trained VGG16, NASNet, Xception Net, and Inception ResNetV2. As each of the pre-trained models expects input images of varying sizes, the given retinal images are reshaped according to the input dimensions accepted by these models. For example, when VGG16 is used, images are reshaped to 224 × 224 × 3. These reshaped retinal images are fed to the pre-trained models after removing the soft-max layer and freezing the rest of the layers. Activation outputs from the penultimate layers form the basis for the proposed feature extraction module. For each retinal image, deep features are extracted from the pre-trained ConvNets and the details are as follows:
  • Each of the first (fc1) and second (fc2) fully connected layers of VGG16 produces a feature vector of 4096 dimensions.
  • The final global average pooling layer of NASNet, Xception, and InceptionResNetV2 gives feature vectors of size 4032, 2048, and 1536, respectively.
Figure 2 gives the architectural details of the pre-trained VGG16, NASNet, Xception, and InceptionResNetV2 and pointers are marked at the feature extraction layers. These features form the input to the proposed uni-modal and blended multi-modal approaches to obtain the optimal feature representations of the retinal images.

3.2. Uni-Modal Deep Feature Extraction

In this approach, deep features are extracted from the final layers of one of the pre-trained ConvNets (VGG16, NASNet, Xception, or ResNet V2) to get the global representation of the retinal images. These deep features are fed to classification models for DR identification and recognition. We propose to use DNN architecture with a dropout at the input layer for DR identification and classification. Figure 3 gives the details of different stages involved in DR recognition process that uses uni-modal deep ConvNet features.

3.3. Blended (Multi-Modal) Deep Feature Extraction

Unlike uni-modal approaches, multi-modal approaches use deep features extracted from multiple ConvNets and are blended using fusion techniques. The features obtained from different pre-trained models provide a different representation of the retinal images as they follow different architectures and are trained on different datasets. A stronger representation can be obtained by blending features from multiple ConvNets, as features of one ConvNet complement the features from other ConvNets involved in the process.
We propose various pooling approaches to fuse the deep features extracted from multiple pre-trained ConvNets. The final blended deep features provide better descriptive and discriminate representation of the retinal images. These blended features are fed to the classification models for DR identification or severity recognition. Figure 4 gives the details of different stages involved in DR recognition process that uses blended multi-modal deep ConvNet features. The proposed blended multi-modal feature extraction module uses features from both the fully connected layers of VGG16 (fc1 and fc2) and global average poling layer of Xception as input. The rationale behind choosing features of VGG16 and Xception over the others is two fold. In VGG16, each feature map of the final convolution block learns the presence of different lesions from the retinal images. Xception Net learns correlations across the 2D space; as a result, each feature map provides the comprehensive representation of the entire retinal scan. Figure 5 visualizes the feature maps obtained from the final convolution blocks of VGG16 and Xception models when a retinal image is passed to these models.

Approaches to Blend Deep Features from Multiple ConvNets

In this work, two different pooling-based approaches (1D pooling and cross pooling) are proposed to fuse multi-modal deep features that are extracted from VGG16 (fc1 and fc2) and Xception. 1D pooling is used to select prominent local features from each region of VGG16, whereas cross pooling allows aggregating the prominent features obtained by 1D pooling with global representation of Xception.
1D pooling-based fusion takes one feature vector U as input and produces another feature vector U ^ , where U R d 1 , U ^ R d 2 , and d 2 d 1 . U ^ is a reduced representation of U, where U = { u 1 , u 2 u d 1 } and U ^ = { u ^ 1 , u ^ 2 u ^ d 2 } . Each feature element u ^ i , of the output vector U ^ , is computed using one of the following three approaches:
1 D Max pooling : u ^ i = m a x ( u i 2 , u i 2 + 1 ) i { 1 , 2 d 2 }
1 D Min pooling : u ^ i = m i n ( u i 2 , u i 2 + 1 ) ; i { 1 , 2 d 2 }
1 D Average pooling : u ^ i = m e a n ( u i 2 , u i 2 + 1 ) ; i { 1 , 2 d 2 }
1 D Sum pooling : u ^ i = u i 2 + u i 2 + 1 ; i { 1 , 2 d 2 }
In cross pooling-based feature fusion, two different feature vectors X and Y are passed as input and another feature vector Z is produced, where X , Y , Z R d . Each feature element z i , of the output vector Z, is computed using one of the following three approaches:
Cross Max pooling : z i = m a x ( x i , y i ) i { 1 , 2 d }
Cross Min pooling : z i = m i n ( x i , y i ) i { 1 , 2 d }
Cross Average pooling : z i = m e a n ( x i , y i + 1 ) i { 1 , 2 d }
Cross Sum pooling : y i = x i + y i i { 1 , 2 d }
1D pooling is applied independently on features extracted from fc1 and fc2 layers of VGG16. Then, the cross pooling approach is applied on the resultant pooled features. This feature vector is merged with the features extracted from the Xception using cross pooling. Fusion module produces deep blended features, which are used to train the proposed DNN model. Figure 6 shows the proposed architecture of the deep feature fusion approach used to blend features from different ConvNets. As the final feature vector is a blended version of the local and global representations of the retinal images, it provides strong features. Algorithm 1 gives the sequence of steps involved in the blended multi-modal feature fusion-based DR recognition.
Algorithm 1: Blended multi-modal deep feature fusion based DR recognition task.
Input: Let D T r and D T s t be the train and test datasets of fundus images, respectively, where
     D T r = { ( x i , y i ) i = 1 N T r } and D T s t = { ( x i ) i = 1 N T s t } . x i represents ith color fundus image in the
    dataset and y i is the severity level of DR associated with x i . In the case of DR
    identification task, y i { 0 , 1 } , whereas, in the case of DR severity classification, task
     y i { 0 , 1 , 2 , 3 } .
Output: y i for each x i D T s t
Step 1: Preprocess each image x i in the dataset.
Step 2: Feature Extraction
  For each preprocessed image x i three different features ( V i , U i , W i ) are extracted.
    V i Features extracted from fc1 layer of VGG16
    U i Features extracted from fc2 layer of VGG16
    W i Features extracted from global avg pool layer of Xception  
  Where V i d 1 , U i d 2 and W i d 3
Step 3: Deep feature fusion
    Apply feature feature fusion on the deep features extracted from each image
     V ^ i m a x ( V i 2 , V i 2 + 1 ) ; i { 1 , 2 d 1 } (1D max pooling)
     U ^ i m a x ( U i 2 , U i 2 + 1 ) ; i { 1 , 2 d 2 } (1D max pooling)
     U V ^ i ( V ^ i + U ^ i ) 2 ; i { 1 , 2 d 2 } (Average Cross pooling)
     x ^ i ( U V ^ ^ i + W i ) 2 ; i { 1 , 2 d 3 } (Average Cross pooling)
     x ^ i : blended feature vector corresponding to x i
Step 4: Model Training
  Training dataset is prepared using the blended features D T r = { ( x ^ i , y i ) } i = 1 N T r
  Train a deep neural network (DNN) using D T r
Step 5: Model evaluation
  Test dataset is prepared using the blended features D T s t = { ( x ^ i ) } i = 1 N T s t
  Evaluate the performance of D T s t using the DNN trained in Step 4

3.4. Model Training and Evaluation

During this phase, we trained the ML model with deep blended pre-trained features. We preferred to use Deep Neural Network (DNN) model for training. For DR identification task, as it is a simple binary classification task, a DNN with two hidden layers with 256 and 128 units, respectively, with ReLU activation was used.
For DR severity classification task, a DNN with three hidden layers with 512, 256, and 128 units, respectively, using ReLU activation was used. For both the DNNs with the input layer, we applied 0.2 dropout to avoid the model from overfitting. This helped the model to become robust. Figure 7 represents the architecture of proposed approach for model training and evaluation.

4. Experimental Results

In this section, we provide details of experimental studies that were carried out to understand the efficiency of the proposed blended multi-modal deep features representation.

4.1. Dataset Summary

For the experimental studies, the APTOS 2019 kaggle benchmark dataset available as part of the blindness detection challenge was used [42]. This is a large dataset of retinal images taken using fundus photography under a variety of imaging conditions. The images are graded manually on a scale of 0 to 4 (0, no DR; 1, mild; 2, moderate; 3, severe; and 4, proliferative DR) to indicate different severity levels.
Table 1 gives the number of retinal images available in the dataset under each level of severity. We can observe that the dataset has an imbalance with more normal images and very few images in Class 3. In all experiments, 80% of the data were used for training and the remaining 20% were used for validation.

4.2. Performance Measures

For the evaluation of the proposed model, we report different measures: accuracy, precision, recall, and F1 score. In addition, we used an additional metric called lappa statistic to compare an observed accuracy with an expected accuracy. Kappa Statistic is calculated as
Kappa Score = ( Observed Accuracy Expected Accuracy ) ( 1 Expected Accuracy )
Observed accuracy is defined as the number of samples that are correctly classified. Expected accuracy is defined as the accuracy that a classifier would be expected to achieve, which is directly related to the number of examples of each class, along with the number of examples that the predicted value satisfied with the correct label.

4.3. DR Identification and Severity Level Prediction

The experiments carried out in this work were divided into two different tasks. In Task 1, presence or absence of DR was identified, whereas, in Task 2, the severity level was predicted for the given retinal image.

4.3.1. Task 1—DR Identification

In this task, given the DR image of a diabetic patient, we need to check whether the person is affected by retinopathy or not. DR identification is a binary classification task, thus binary cross entropy loss was used to measure the loss, and Adam optimizer was used to optimize the objective function. The dataset contains images belonging to five different classes, as shown in Table 1, and is not suitable for binary classification task. Merging all the DR-affected images into a single class gives 1857 positively labeled images and the remaining 1805 normal images are labeled as negative.

4.3.2. Task 2—Severity Level Prediction

The objective of Task 1 is to identify the presence or absence of DR, given a retinal image. While treating the DR-affected patients, mere identification of DR would not be sufficient and understanding the level of severity would be helpful for better treatment. Hence, we treat severity level identification as a separate task that categorizes the given retinal image into one of the five severity levels. Categorical cross entropy loss was used to represent loss and Adam optimizer was used to optimize the objective function.

4.4. Experimental Studies to Show the Representative Nature of Uni-Modal Features for Task 1

This experiment was carried out to understand how efficiently retinal images are represented using uni-modal features that are directly obtained from single pre-trained ConvNet. Models such as VGG16, Xception, NASNET, and ResNetV2 were considered to extract uni-modal features. For classification, models such as Naïve Bayes classifier, logistic regression, decision tree, k-Nearest Neighborhood (KNN) classifier, Multi Layered Perceptron (MLP), Support Vector Machine (SVM), and Deep Neural Network (DNN) were used.
Table 2 and Table 3 show the performance of DR identification task using different ML models when the retinal images are represented with the features extracted from the first fully connected layer (fc2) of VGG16 and Xception, respectively. Based on these results, we concluded that DNN outperforms the rest of the ML models irrespective of the models. Hence, we decided to use DNN model alone in the rest of the experiments.
Table 4 shows the representative power of uni-modal features that are extracted from different pre-trained models. It is clear from the results that the performance of the DNN model varies depending on the uni-modal features used. This experiment gives a clue that each pre-trained model extracts a different set of features from retinal images. The features extracted from Xception yield better performance in terms of accuracy for the diabetic retinopathy identification task. A nominal difference in terms of accuracy and kappa score can be observed between the models trained using different uni-modal features.
To better understand the representative nature of different uni-modal features, loss and number of epochs taken to converge by the DNN models are reported in Table 5. We can observe that the model trained using VGG16-Fc1 reaches minimum loss compared to the rest of the models. In terms of convergence, Xception takes only 16 epochs, whereas the Inception ResNetV2 outperforms the other models.
To summarize the experiments on DR identification task, features extracted from Xception, VGG16-fc2, and Inception ResnetV2 yields the same accuracy with nominal differences. However, models trained on the VGG16-fc1 features give better kappa scores compared to others. We can also observe that models trained on the VGG16-fc2 features give better performance in terms of precision, recall, and F1 scores. Regardless of the type of uni-modal features used, DNN consistently outperforms the rest of the models, especially in terms of kappa scores. The reason for the superior performance of the models trained using VGG16 and Xception features is that these models are good at extracting the lesion information that is useful to discriminate the DR-affected images from those that are not affected.

4.5. Experimental Studies to Show the Representative Nature of Uni-Modal Features for Task 2

We ran a set of experiments to understand the nature of uni-modal features for severity prediction of DR. Task 2 is more challenging compared to Task 1 as it involves multiple classes. DNN model with dropout at the input layer was used with different uni-modal features.
Based on the results reported in Table 6, we can observe the same trend that was observed in Task 1. The scores obtained for Task 2 show the complexity of severity prediction. The model trained on VGG-16+fc1 features shows superior performance to rest of the models. The same can be observed in terms of all the metrics.
In Table 7, it is clear that, among all the pre-trained features, VGG16-fc1 yields superior performance with minimum loss. However, Xception converges in fewer epochs compared to other models.

4.6. Performance Evaluation of the Proposed Blended Multi-Modal Features

A clue from the experiments on uni-modal features is that different uni-modal features extract different sets of features from the retinal images. If we can use multiple deep features extracted from different models, they complement each other and help to improve the scores. To benefit from more than one set of uni-modal features, we propose a blended multi-modal feature representation. This section is dedicated to show the representative power of the proposed feature representation with an application to DR identification and severity level prediction.
In addition, we applied the proposed pooling methods to blend the features from multiple pre-trained models. Initially, we blended features from the first and second fully connected layers of VGG16. Then, we extended this to the fusion of three different features from fc1 and fc2 layers of VGG16 and Xception.

4.6.1. Blended Multi-Modal Deep Features for Task 1

We experimented on the effect of blending deep features extracted from multiple pre-trained models on DR identification task. In addition, we verified the proposed maximum, sum, and average pooling approaches to blend multiple deep features.
In Table 8, we can observe that average pooling based fusion works better for DR Detection compared to other models. Using average fusion the models trained on multi-modal features leads to superior performance in terms of accuracy and kappa static. In addition, the model converges more quickly, in less than 50 epochs, and attains minimum loss. The accuracy obtained by model trained using multi-modal features is significantly better compared with to those trained on uni-modal features.

4.6.2. Blended Multi-Modal Deep Features for Task 2

From the previous experiments, we understand that the models trained on multi-modal features give better performance compared to those trained on uni-modal features in the context of DR identification which is simple binary task. To understand that the proposed blended performs efficiently for more complex multi-class classification task, we applied the proposed feature representation for the severity prediction task shown in Table 9.
In Table 10, we can see that average pooling based fusion of multiple deep features works better for diabetic severity prediction. Compared to the blended features from VGG16-fc1 and VGG16-fc2, the blended features from VGG16-fc1, VGG16-fc2, and Xception gives better representation. For severity prediction as well, the model that uses average pooling approach for fusion converges more quickly with better accuracy and kappa score when compared with the other approaches for fusion.

4.7. Comparison of Proposed Blended Feature Extraction with Existing Methods

In this experiment, we showed the effectiveness of the proposed DNN with dropout at the input layer trained using the proposed blended multi-modal deep feature representation and with the existing models in the literature for DR prediction. We compared the proposed model with the performances of the models used in [43,44]. In Table 10, we can see that the proposed method gives an accuracy of 80.96%, which is significantly better than existing models in the literature. When compared to the existing models, the proposed DNN model is simple with only three hidden layers with 512, 256 and 128 units each hidden layer. The confusion matrix in Figure 8 shows the mis-classifications produced by the proposed model when applied for DR severity prediction task. In the figure, we can see that most of the proliferate DR type images are predicted as moderate.
As the final feature vector is a blended version of the local and global representations of the retinal images the final representation provides strong features. The reason for improvement in the performance of the proposed model is that each feature map of the final convolution block of VGG16 learns the presence of different lesions from the retinal images and Xception Net comprehensive representation of the entire retinal scan. When we combine the deep features from VGG16 and Xception gives a compact representation that gives the wholistic representation of DR images.

5. Conclusions

The major objective of this work is to acquire a compact and comprehensive representation of retinal images as the feature representations extracted from retinal images significantly influence the performance of DR prediction. Initially, we extract features from deep pre-trained VGG16-fc1, CGG16-fc2 and Xception models. VGG16 model learns the lesions and Xception learns the global representation of the images. Then, the features from multiple ConvNets are blended to get final prominent representation of color fundus images. The final representation is obtained by pooling the representations from VGG16 and Xception features. A DNN model was trained using these blended features for the task of diabetic retinopathy severity level prediction. The proposed DNN model with dropout at the input avoids overfitting and converges more quickly. Our experiments on benchmark APTOS 2019 dataset showed the superiority of the proposed model when compared to the existing models. Among the proposed pooling approaches, average pooling used to fuse the features extracted from the penultimate layers of multiple pre-trained ConvNets gives better performance with minimum loss in fewer epochs compared to others.

Author Contributions

Conceptualization, J.D.B.; methodology, S.N.S.; software, S.H.; validation, M.B., P.K.R.M. and O.J.; formal analysis, O.J.; investigation, P.K.R.M.; resources, J.D.B.; writing—original draft preparation, J.D.B. and V.N.; writing—review and editing, V.N.; visualization, S.N.S.; supervision, M.B.; project administration, S.H.; funding acquisition, O.J. All authors have read and agreed to the published version of the manuscript.

Funding

This work was supported by the National Research Foundation of Korea (NRF) grant funded by the Korea government (MSIT) under Grant NRF-2018R1C1B5045013.

Conflicts of Interest

The authors declare no conflict of interest.

References

  1. Cheung, N.; Rogers, S.L.; Donaghue, K.C.; Jenkins, A.J.; Tikellis, G.; Wong, T.Y. Retinal arteriolar dilation predicts retinopathy in adolescents with type 1 diabetes. Diabetes Care 2008, 31, 1842–1846. [Google Scholar] [CrossRef] [PubMed] [Green Version]
  2. Flaxman, S.; Bourne, R.; Resnikoff, S.; Ackland, P.; Braithwaite, T.; Cicinelli, M.; Das, A.; Jonas, J.; Keeffe, J.; Kempen, J.; et al. Global causes of blindness and distance vision impairment 1990-2020: A systematic review and meta-analysis. Lancet Glob. Health 2017, 5, e1221–e1234. [Google Scholar] [CrossRef] [Green Version]
  3. Gulshan, V.; Peng, L.; Coram, M.; Stumpe, M.C.; Wu, D.; Narayanaswamy, A.; Venugopalan, S.; Widner, K.; Madams, T.; Cuadros, J.; et al. Development and validation of a deep learning algorithm for detection of diabetic retinopathy in retinal fundus photographs. JAMA 2016, 316, 2402–2410. [Google Scholar] [CrossRef] [PubMed]
  4. Williams, R.; Airey, M.; Baxter, H.; Forrester, J.M.; Kennedy-Martin, T.; Girach, A. Epidemiology of diabetic retinopathy and macular oedema: A systematic review. Eye 2004, 18, 963–983. [Google Scholar] [CrossRef] [PubMed] [Green Version]
  5. Long, S.; Huang, X.; Chen, Z.; Pardhan, S.; Zheng, D. Automatic detection of hard exudates in color retinal images using dynamic threshold and SVM classification: Algorithm development and evaluation. BioMed Res. Int. 2019, 2019, 3926930. [Google Scholar] [CrossRef]
  6. Haloi, M.; Dandapat, S.; Sinha, R. A Gaussian scale space approach for exudates detection, classification and severity prediction. arXiv 2015, arXiv:1505.00737. [Google Scholar]
  7. Noushin, E.; Pourreza, M.; Masoudi, K.; Ghiasi Shirazi, E. Microaneurysm detection in fundus images using a two step convolution neural network. Biomed. Eng. Online 2019, 18, 67. [Google Scholar]
  8. Grinsven, M.; Ginneken, B.; Hoyng, C.; Theelen, T.; Sanchez, C. Fast convolution neural network training using selective data sampling. IEEE Trans. Med. Imaging 2016, 35, 1273–1284. [Google Scholar] [CrossRef]
  9. Haloi, M. Improved microaneurysm detection using deep neural networks. arXiv 2015, arXiv:1505.04424. [Google Scholar]
  10. Srivastava, R.; Duan, L.; Wong, D.W.; Liu, J.; Wong, T.Y. Detecting retinal microaneurysms and hemorrhages with robustness to the presence of blood vessels. Comput. Methods Programs Biomed. 2017, 138, 83–91. [Google Scholar] [CrossRef]
  11. Bodapati, J.D.; Veeranjaneyulu, N. Feature Extraction and Classification Using Deep Convolutional Neural Networks. J. Cyber Secur. Mobil. 2019, 8, 261–276. [Google Scholar] [CrossRef]
  12. Bodapati, J.D.; Veeranjaneyulu, N.; Shaik, S. Sentiment Analysis from Movie Reviews Using LSTMs. Ingénierie des Systèmes d’Information 2019, 24, 125–129. [Google Scholar] [CrossRef]
  13. Zhuo, P.; Zhu, Y.; Wu, W.; Shu, J.; Xia, T. Real-Time Fault Diagnosis for Gas Turbine Blade Based on Output-Hidden Feedback Elman Neural Network. J. Shanghai Jiaotong Univ. (Sci.) 2018, 23, 95–102. [Google Scholar] [CrossRef]
  14. Xia, T.; Song, Y.; Zheng, Y.; Pan, E.; Xi, L. An ensemble framework based on convolutional bi-directional LSTM with multiple time windows for remaining useful life estimation. Comput. Ind. 2020, 115, 103182. [Google Scholar] [CrossRef]
  15. Moreira, M.W.; Rodrigues, J.J.; Korotaev, V.; Al-Muhtadi, J.; Kumar, N. A comprehensive review on smart decision support systems for health care. IEEE Syst. J. 2019, 13, 3536–3545. [Google Scholar] [CrossRef]
  16. Gadekallu, T.R.; Khare, N.; Bhattacharya, S.; Singh, S.; Maddikunta, P.K.R.; Srivastava, G. Deep neural networks to predict diabetic retinopathy. J. Ambient Intell. Humaniz. Comput. 2020. [Google Scholar] [CrossRef]
  17. Patel, H.; Singh Rajput, D.; Thippa Reddy, G.; Iwendi, C.; Kashif Bashir, A.; Jo, O. A review on classification of imbalanced data for wireless sensor networks. Int. J. Distrib. Sens. Netw. 2020, 16, 1550147720916404. [Google Scholar] [CrossRef]
  18. Reddy, G.T.; Reddy, M.P.K.; Lakshmanna, K.; Rajput, D.S.; Kaluri, R.; Srivastava, G. Hybrid genetic algorithm and a fuzzy logic classifier for heart disease diagnosis. Evol. Intell. 2019, 13, 185–196. [Google Scholar] [CrossRef]
  19. Wu, L.; Fernandez-Loaiza, P.; Sauma, J.; Hernandez-Bogantes, E.; Masis, M. Classification of diabetic retinopathy and diabetic macular edema. World J. Diabetes 2013, 4, 290. [Google Scholar] [CrossRef]
  20. Akram, M.U.; Khalid, S.; Khan, S.A. Identification and classification of microaneurysms for early detection of diabetic retinopathy. Pattern Recognit. 2013, 46, 107–116. [Google Scholar] [CrossRef]
  21. Akram, M.U.; Khalid, S.; Tariq, A.; Khan, S.A.; Azam, F. Detection and classification of retinal lesions for grading of diabetic retinopathy. Comput. Biol. Med. 2014, 45, 161–171. [Google Scholar] [CrossRef] [PubMed]
  22. Casanova, R.; Saldana, S.; Chew, E.Y.; Danis, R.P.; Greven, C.M.; Ambrosius, W.T. Application of random forests methods to diabetic retinopathy classification analyses. PLoS ONE 2014, 9, e98587. [Google Scholar] [CrossRef] [PubMed]
  23. Verma, K.; Deep, P.; Ramakrishnan, A. Detection and classification of diabetic retinopathy using retinal images. In Proceedings of the 2011 Annual IEEE India Conference, Hyderabad, India, 16–18 December 2011; pp. 1–6. [Google Scholar]
  24. Welikala, R.; Dehmeshki, J.; Hoppe, A.; Tah, V.; Mann, S.; Williamson, T.H.; Barman, S. Automated detection of proliferative diabetic retinopathy using a modified line operator and dual classification. Comput. Methods Programs Biomed. 2014, 114, 247–261. [Google Scholar] [CrossRef] [PubMed] [Green Version]
  25. Welikala, R.A.; Fraz, M.M.; Dehmeshki, J.; Hoppe, A.; Tah, V.; Mann, S.; Williamson, T.H.; Barman, S.A. Genetic algorithm based feature selection combined with dual classification for the automated detection of proliferative diabetic retinopathy. Comput. Med. Imaging Graph. 2015, 43, 64–77. [Google Scholar] [CrossRef] [Green Version]
  26. Roychowdhury, S.; Koozekanani, D.D.; Parhi, K.K. DREAM: Diabetic retinopathy analysis using machine learning. IEEE J. Biomed. Health Inform. 2013, 18, 1717–1728. [Google Scholar] [CrossRef]
  27. Mookiah, M.R.K.; Acharya, U.R.; Martis, R.J.; Chua, C.K.; Lim, C.M.; Ng, E.; Laude, A. Evolutionary algorithm based classifier parameter tuning for automatic diabetic retinopathy grading: A hybrid feature extraction approach. Knowl. Based Syst. 2013, 39, 9–22. [Google Scholar] [CrossRef]
  28. Porter, L.F.; Saptarshi, N.; Fang, Y.; Rathi, S.; Den Hollander, A.I.; De Jong, E.K.; Clark, S.J.; Bishop, P.N.; Olsen, T.W.; Liloglou, T.; et al. Whole-genome methylation profiling of the retinal pigment epithelium of individuals with age-related macular degeneration reveals differential methylation of the SKI, GTF2H4, and TNXB genes. Clin. Epigenet. 2019, 11, 6. [Google Scholar] [CrossRef]
  29. Rahim, S.S.; Jayne, C.; Palade, V.; Shuttleworth, J. Automatic detection of microaneurysms in colour fundus images for diabetic retinopathy screening. Neural Comput. Appl. 2016, 27, 1149–1164. [Google Scholar] [CrossRef]
  30. Dutta, S.; Manideep, B.; Basha, S.M.; Caytiles, R.D.; Iyengar, N. Classification of diabetic retinopathy images by using deep learning models. Int. J. Grid Distrib. Comput. 2018, 11, 89–106. [Google Scholar] [CrossRef]
  31. Zeng, X.; Chen, H.; Luo, Y.; Ye, W. Automated diabetic retinopathy detection based on binocular Siamese-like convolutional neural network. IEEE Access 2019, 7, 30744–30753. [Google Scholar] [CrossRef]
  32. Mateen, M.; Wen, J.; Song, S.; Huang, Z. Fundus image classification using VGG-19 architecture with PCA and SVD. Symmetry 2019, 11, 1. [Google Scholar] [CrossRef] [Green Version]
  33. Reddy, G.T.; Reddy, M.P.K.; Lakshmanna, K.; Kaluri, R.; Rajput, D.S.; Srivastava, G.; Baker, T. Analysis of Dimensionality Reduction Techniques on Big Data. IEEE Access 2020, 8, 54776–54788. [Google Scholar] [CrossRef]
  34. Bhattacharya, S.; Kaluri, R.; Singh, S.; Alazab, M.; Tariq, U. A Novel PCA-Firefly based XGBoost classification model for Intrusion Detection in Networks using GPU. Electronics 2020, 9, 219. [Google Scholar] [CrossRef] [Green Version]
  35. Gadekallu, T.R.; Khare, N.; Bhattacharya, S.; Singh, S.; Reddy Maddikunta, P.K.; Ra, I.H.; Alazab, M. Early Detection of Diabetic Retinopathy Using PCA-Firefly Based Deep Learning Model. Electronics 2020, 9, 274. [Google Scholar] [CrossRef] [Green Version]
  36. Jindal, A.; Aujla, G.S.; Kumar, N.; Prodan, R.; Obaidat, M.S. DRUMS: Demand response management in a smart city using deep learning and SVR. In Proceedings of the 2018 IEEE Global Communications Conference (GLOBECOM), Abu Dhabi, UAE, 9–13 December 2018; pp. 1–6. [Google Scholar]
  37. Vinayakumar, R.; Alazab, M.; Srinivasan, S.; Pham, Q.V.; Padannayil, S.K.; Simran, K. A Visualized Botnet Detection System based Deep Learning for the Internet of Things Networks of Smart Cities. IEEE Trans. Ind. Appl. 2020. [Google Scholar] [CrossRef]
  38. Alazab, M.; Khan, S.; Krishnan, S.S.R.; Pham, Q.V.; Reddy, M.P.K.; Gadekallu, T.R. A Multidirectional LSTM Model for Predicting the Stability of a Smart Grid. IEEE Access 2020, 8, 85454–85463. [Google Scholar] [CrossRef]
  39. Simonyan, K.; Zisserman, A. Very deep convolutional networks for large-scale image recognition. arXiv 2014, arXiv:1409.1556. [Google Scholar]
  40. Chollet, F. Xception: Deep learning with depthwise separable convolutions. In Proceedings of the 2017 IEEE Conference on Computer Vision and Pattern Recognition (CVPR), Honolulu, HI, USA, 21–26 July 2017; pp. 1251–1258. [Google Scholar]
  41. Zoph, B.; Vasudevan, V.; Shlens, J.; Le, Q.V. Learning transferable architectures for scalable image recognition. In Proceedings of the 2018 IEEE/CVF Conference on Computer Vision and Pattern Recognition, Salt Lake City, UT, USA, 18–23 June 2018; pp. 8697–8710. [Google Scholar]
  42. APTOS 2019. Available online: https://www.kaggle.com/c/aptos2019-blindness-detection (accessed on 30 December 2019).
  43. Gargeya, R.; Leng, T. Automated identification of diabetic retinopathy using deep learning. Ophthalmology 2017, 124, 962–969. [Google Scholar] [CrossRef]
  44. Kassani, S.H.; Kassani, P.H.; Khazaeinezhad, R.; Wesolowski, M.J.; Schneider, K.A.; Deters, R. Diabetic Retinopathy Classification Using a Modified Xception Architecture. In Proceedings of the 2019 IEEE International Symposium on Signal Processing and Information Technology (ISSPIT), Ajman, UAE, 10–12 December 2019; pp. 1–6. [Google Scholar]
Figure 1. Samples of DR-affected fundus images: (a) types of lesions formed; and (b) levels of severity.
Electronics 09 00914 g001
Figure 2. Architectures of various pre-trained models along with an indication of layers from which features are extracted.
Electronics 09 00914 g002
Figure 3. Stages involved in uni-modal deep feature based DR recognition.
Electronics 09 00914 g003
Figure 4. Stages involved in blended deep feature based DR recognition.
Electronics 09 00914 g004
Figure 5. Visualization of the feature maps of the final convolution blocks of VGG16 and Xception models on passing retinal image as input.
Electronics 09 00914 g005
Figure 6. Approaches for fusion of features extracted from Deep ConvNets.
Electronics 09 00914 g006
Figure 7. Training and Evaluation of DNN model for identification and recognition of DR.
Electronics 09 00914 g007
Figure 8. Confusion matrix for the severity prediction task.
Electronics 09 00914 g008
Table 1. Dataset summary of APTOS 2019 dataset.
Severity Level# Samples
Class 0 (Normal)1805
Class 1 (Mild Stage)370
Class 2 (Moderate Stage)999
Class 3 (Severe Stage)193
Class 4 (Proliferative Stage)295
Total3662
Table 2. Performance of ML algorithms on Task 1 using features from fc2 layer of VGG16.
ModelAccuracyPrecisionRecallF1 ScoreKappa Statistic
Logistic Regression97.1397979794.27
KNN95.3696959590.73
Naive Bayes77.0882777654.45
Decision Tree91.2791919182.52
MLP96.4597969692.91
SVM (linear)96.5897979793.17
SVM (RBF)96.8697979793.73
DNN97.3298989894.63
Table 3. Performance of ML algorithms on Task 1 using features from Xception.
ModelAccuracyPrecisionRecallF1 ScoreKappa Statistic
Logistic Regression96.4596969693
KNN95.596959591
Naive Bayes82.9584838365.9
Decision Tree87.5988888875.17
MLP9696969691.89
SVM (linear)96.1896969692.36
SVM (RBF)97.497979794.82
DNN97.4197979794.82
Table 4. Task 1 performance using DNN trained on different uni-modal features.
ModelAccuracyPrecisionRecallF1 ScoreKappa Statistic
VGG16-fc197.2797989795.12
VGG16-fc297.3298989894.63
NASNet97.1497979794.27
Xception97.4197979794.82
Inception ResNetV297.3497979794.54
Table 5. Task 1: Comparison of DNN model (trained on uni-modal features) in terms of loss and number of epochs when trained on different uni-modal features.
Model# EpochsLossAccuracy
VGG16-fc1650.002497.27
VGG16-fc2670.013997.32
NASNet370.031097.14
Xception160.021397.41
Inception ResNet V2190.081597.34
Table 6. Task 2 performance using DNN trained on different uni-modal features.
Type of Uni-Modal FeaturesAccuracyPrecisionRecallF1 ScoreKappa Statistic
VGG16-fc180.0680818070.02
VGG16-fc279.8179807968.88
NASNET76.475767563.87
Xception78.9978797867.67
Inception ResNetV279.7378787867.67
Table 7. Task 2: Comparison of DNN model (trained on uni-modal features) in terms of loss and number of epochs when trained on different uni-modal features.
Model# EpochsLossAccuracy
VGG16-fc1760.362380.06
VGG16-fc2790.398679.81
NASNet370.561276.39
Xception230.417578.99
Inception ResNet V2890.38279.73
Table 8. DNN with blended multi-modal features with different fusions for Task 1.
ModalitiesPoolingAccuracyKappa StatisticEpochsLoss
VGG16-fc1 and VGG16-fc2Max-pooling96.1291.89680.0352
Avg-pooling97.3994.61510.0293
Sum-pooling95.591640.0419
VGG16-fc1, VGG16-fc2 and XceptionMax-pooling96.8592.6690.0314
Avg-pooling97.9294.93430.0201
Sum-pooling96.192.31560.0396
Table 9. DNN with blended multi-modal features with different fusions for Task 2.
ModalitiesPoolingAccuracyKappa StatisticEpochsLoss
VGG16-fc1 and VGG16-fc2Maximum78.0666.87720.4176
Average80.3469.21620.2987
Sum76.865.64680.5693
VGG16-fc1, VGG16-fc2 and XceptionMaximum79.2567.29740.3986
Average80.9670.9540.2619
Sum77.1266.42610.4782
Table 10. Comparison of Proposed method using with existing methods.
ModelAccuracy
DR detection using Deep Learning [43]57.2%
DR Classification Using Xception [44]79.59
DR Classification Using InceptionV3 [44]78.72
DR Classification Using MobileNet [44]79.01
DR Classification Using ResNet50 [44]74.64
Blended features + DNN (proposed)80.96

