Article

A Novel Approach for the Automatic Estimation of the Ciliated Cell Beating Frequency

1
National Research Council, Institute of Intelligent Industrial Technologies and Systems for Advanced Manufacturing, 70126 Bari, Italy
2
Department of Computer Science, University of Bari, 70125 Bari, Italy
3
Department of Clinical and Experimental Medicine, University of Foggia, 71122 Foggia, Italy
*
Author to whom correspondence should be addressed.
Electronics 2020, 9(6), 1002; https://doi.org/10.3390/electronics9061002
Submission received: 31 May 2020 / Revised: 10 June 2020 / Accepted: 12 June 2020 / Published: 15 June 2020

Abstract

:
The qualitative and quantitative evaluation of nasal epithelial cells is interesting in chronic infectious and inflammatory pathologies of the nose and sinuses. Among the cells of the population of the nasal mucosa, ciliated cells are particularly important. In fact, the observation of these cells is essential to investigate primary ciliary dyskinesia, a rare and severe disease associated with other serious diseases such as respiratory diseases, situs inversus, heart disease, and male infertility. Biopsy or brushing of the ciliary mucosa and assessment of ciliary function through measurements of the Ciliary Beating Frequency (CBF) are usually required to facilitate diagnosis. Therefore, low-cost and easy-to-use technologies devoted to measuring the ciliary beating frequency are desirable. We have considered related works in this field and noticed that up to date an actually usable system is not available to measure and monitor CBF. Moreover, performing this operation manually is practically unfeasible or demanding. For this reason, we designed BeatCilia, a low cost and easy-to-use system, based on image processing techniques, with the aim of automatically measuring CBF. This system performs cell Region of Interest (RoI) detection basing on dense optical flow computation of cell body masking, focusing on the cilia movement and taking advantage of the structural characteristics of the ciliated cell and CBF estimation by applying a fast Fourier transform to extract the frequency with the peak amplitude. The experimental results show that it offers a reliable and fast CBF estimation method and can efficiently run on a consumer-grade smartphone. It can support rhinocytologists during cell observation, significantly reducing their efforts.

1. Introduction

Medical treatments and diagnostic methods have been deeply influenced by the technological advancements achieved in recent decades. Thanks to the numerous studies in the field of computer vision applied to the medical and biomedical fields, additional tools are available to specialists to support them in their tasks [1,2,3,4,5,6,7], improving acquisition, transmission, and analysis of digital images and signals [8,9,10]. In many cases, the basic techniques of these tools require segmentation and contour extraction that are challenging tasks in several application fields [11,12,13,14,15,16,17], and in particular in the medical field [18,19]. Many studies have been conducted in the segmentation and classification of cells from digital images, such as in the case of nasal cytology, which is gaining increasing importance in the diagnosis of nasal diseases [20,21,22]. This fields involves studying the nasal mucosa cells, with the aim of identifying cellular variations in the epithelium, which are often exposed to acute or chronic irritation and inflammation caused by viruses, bacteria, or fungi. Recent studies have proposed automatic extraction and classification of the cells of the nasal mucosa based on digital images from a microscopic slide [23,24].
Among the cells of the nasal mucosa population, ciliated cells form 80% of the epithelium in the upper airways and are particularly important. The qualitative evaluation of ciliated cells is also essential in investigating the Primary Ciliary Dyskinesia (PCD) [25]. Dyskinesia refers to the abnormal and uncoordinated movement of cell cilia. In humans, ciliated cells are 15 to 20 nm long and generally beat with a frequency of up to 16 Hz, but the normal frequency can change in response to infections, temperature, age, or generally speaking, in the case of inflammation or infections in the upper airway [26]. Regularly, these cells beat with a constant, smooth pattern, allowing an effective mucociliary clearance. Biopsy or brushing of the ciliary mucosa and the assessment of ciliary function through measurements of the Ciliary Beating Frequency (CBF) are usually required to make a diagnosis. Interesting insights into ciliated cells and the CBF are reported in Appendix A.
The CBF cannot be properly analyzed with the naked eye, due to its high oscillatory motion; therefore, many techniques have been proposed to overcome this limitation in recent decades. The earliest proposed techniques were based on photo-electric effects [27], photodiodes [28], and stroboscopes [29,30]. Successively, CBF analysis became accurate with the use of high-speed video cameras [31,32], however the implemented procedures were semi-automatic and CBF was manually obtained. The first automated CBF measuring technique, called Sisson–Ammons Video Analysis (SAVA) and based on image analysis, was developed in 2003 by Sisson et al. [33]. It automatically analyzes the whole image for each frame. Its main drawback is that SAVA is very time-consuming, because it analyzes many blocks for each video frame. In [34], the authors describe a method devoted to CBF measurement based on the fast Fourier transform (FFT); they acquire the images with an iPhone camera and then perform the analysis on a desktop system. This study was conducted on ciliary cells extracted from a rabbit’s tracheal samples. This technique requires the manual selection of the Regions of Interest (RoIs), and the authors concluded that “locating the RoIs with a single beating cell is not only challenging but also crucial”, hence an improvement of RoI selection strategies is desirable.
Other studies [35,36] have exploited pixel intensity variations in order to determine CBF; however, although effective, their performance depends on the experimental settings for acquiring videos, which are subject to particularly binding conditions. In [37,38], the authors showed that motile areas and the CBF can be determined through the optical flow (OF), which is defined as the “motion of the imaging surface in changing brightness for 2-D images according to the real motion of an object in the 3-D space” [39]. However, it has been shown that the image quality and frequency resolution (sampling frequency or number of frames captured) are key factors that must be taken into consideration to accurately estimate CBF [36,38,39,40].
To the best of our knowledge, tools measuring CBF proposed in the literature show practical limits, as we have highlighted above, or are based on expensive technologies in real cases. As a matter of fact, the domain experts, when not supported by specialized laboratories, can only describe the ciliated epithelium in a qualitative way. For these reasons, it is worthwhile investing in research to design affordable systems capable of measuring CBF in a short time frame, reducing manual interventions. In this regard, this study is focused on achieving a reliable, low-cost, high performing, and fully automated system called BeatCilia. This system can acquire and process images through a smartphone, using visual computing algorithms, thus overcoming the limitations of RoI-based methods. BeatCilia is a fully automated system and its performance is independent of the user experience. A further benefit of systems such as this one is the possibility of sending clinical data directly to an electronic health record (EHR) and sharing them with care providers [41,42,43].

2. Materials and Methods

2.1. Sample Collection and Preparation

The dataset collected in this work included 10 videos acquired by a Nikon Eclipse 600 (1000× magnification) microscope equipped with a camera model MD6iS (Sony IMX236 sensor), with a spatial resolution of 1920 × 1080 pixels and a temporal resolution of 30 frames per second (fps). Videos were recorded with the aim of testing the proposed CBF automatic extraction algorithm in different scenarios, taking into account the following variables:
  • Video background noise level, for which we marked three noise levels, as shown in Figure 1;
  • The presence of single or multiple cells in a single frame;
  • In-place movement of the cell body, which may affect the automatic estimation of the CBF. We labeled this as “weak” if the cell body was almost immotile, “discrete” (resp. “high”, “very high”) if it was slightly (resp. highly, very highly) vibrating in-place.
Table 1 shows the details of the different scenarios considered with the dataset. In particular, cilia 1 and 2 both have clean backgrounds, but only the first one is related to ciliated cells with stable bodies. Cilia 3 has either background noise or an unstable cell body. Cilia 4, which is the worst-case scenario, has a spoiled background and a fast-paced moving body. Videos from Cilia 5 to Cilia 10 contain different scenarios that are a combination of the four previously described ones. Figure 1 shows an example of frames captured from the dataset.
We will show that our system is capable of handling all of these situations, without requiring a full zoomed-in scene of the beating cilia.

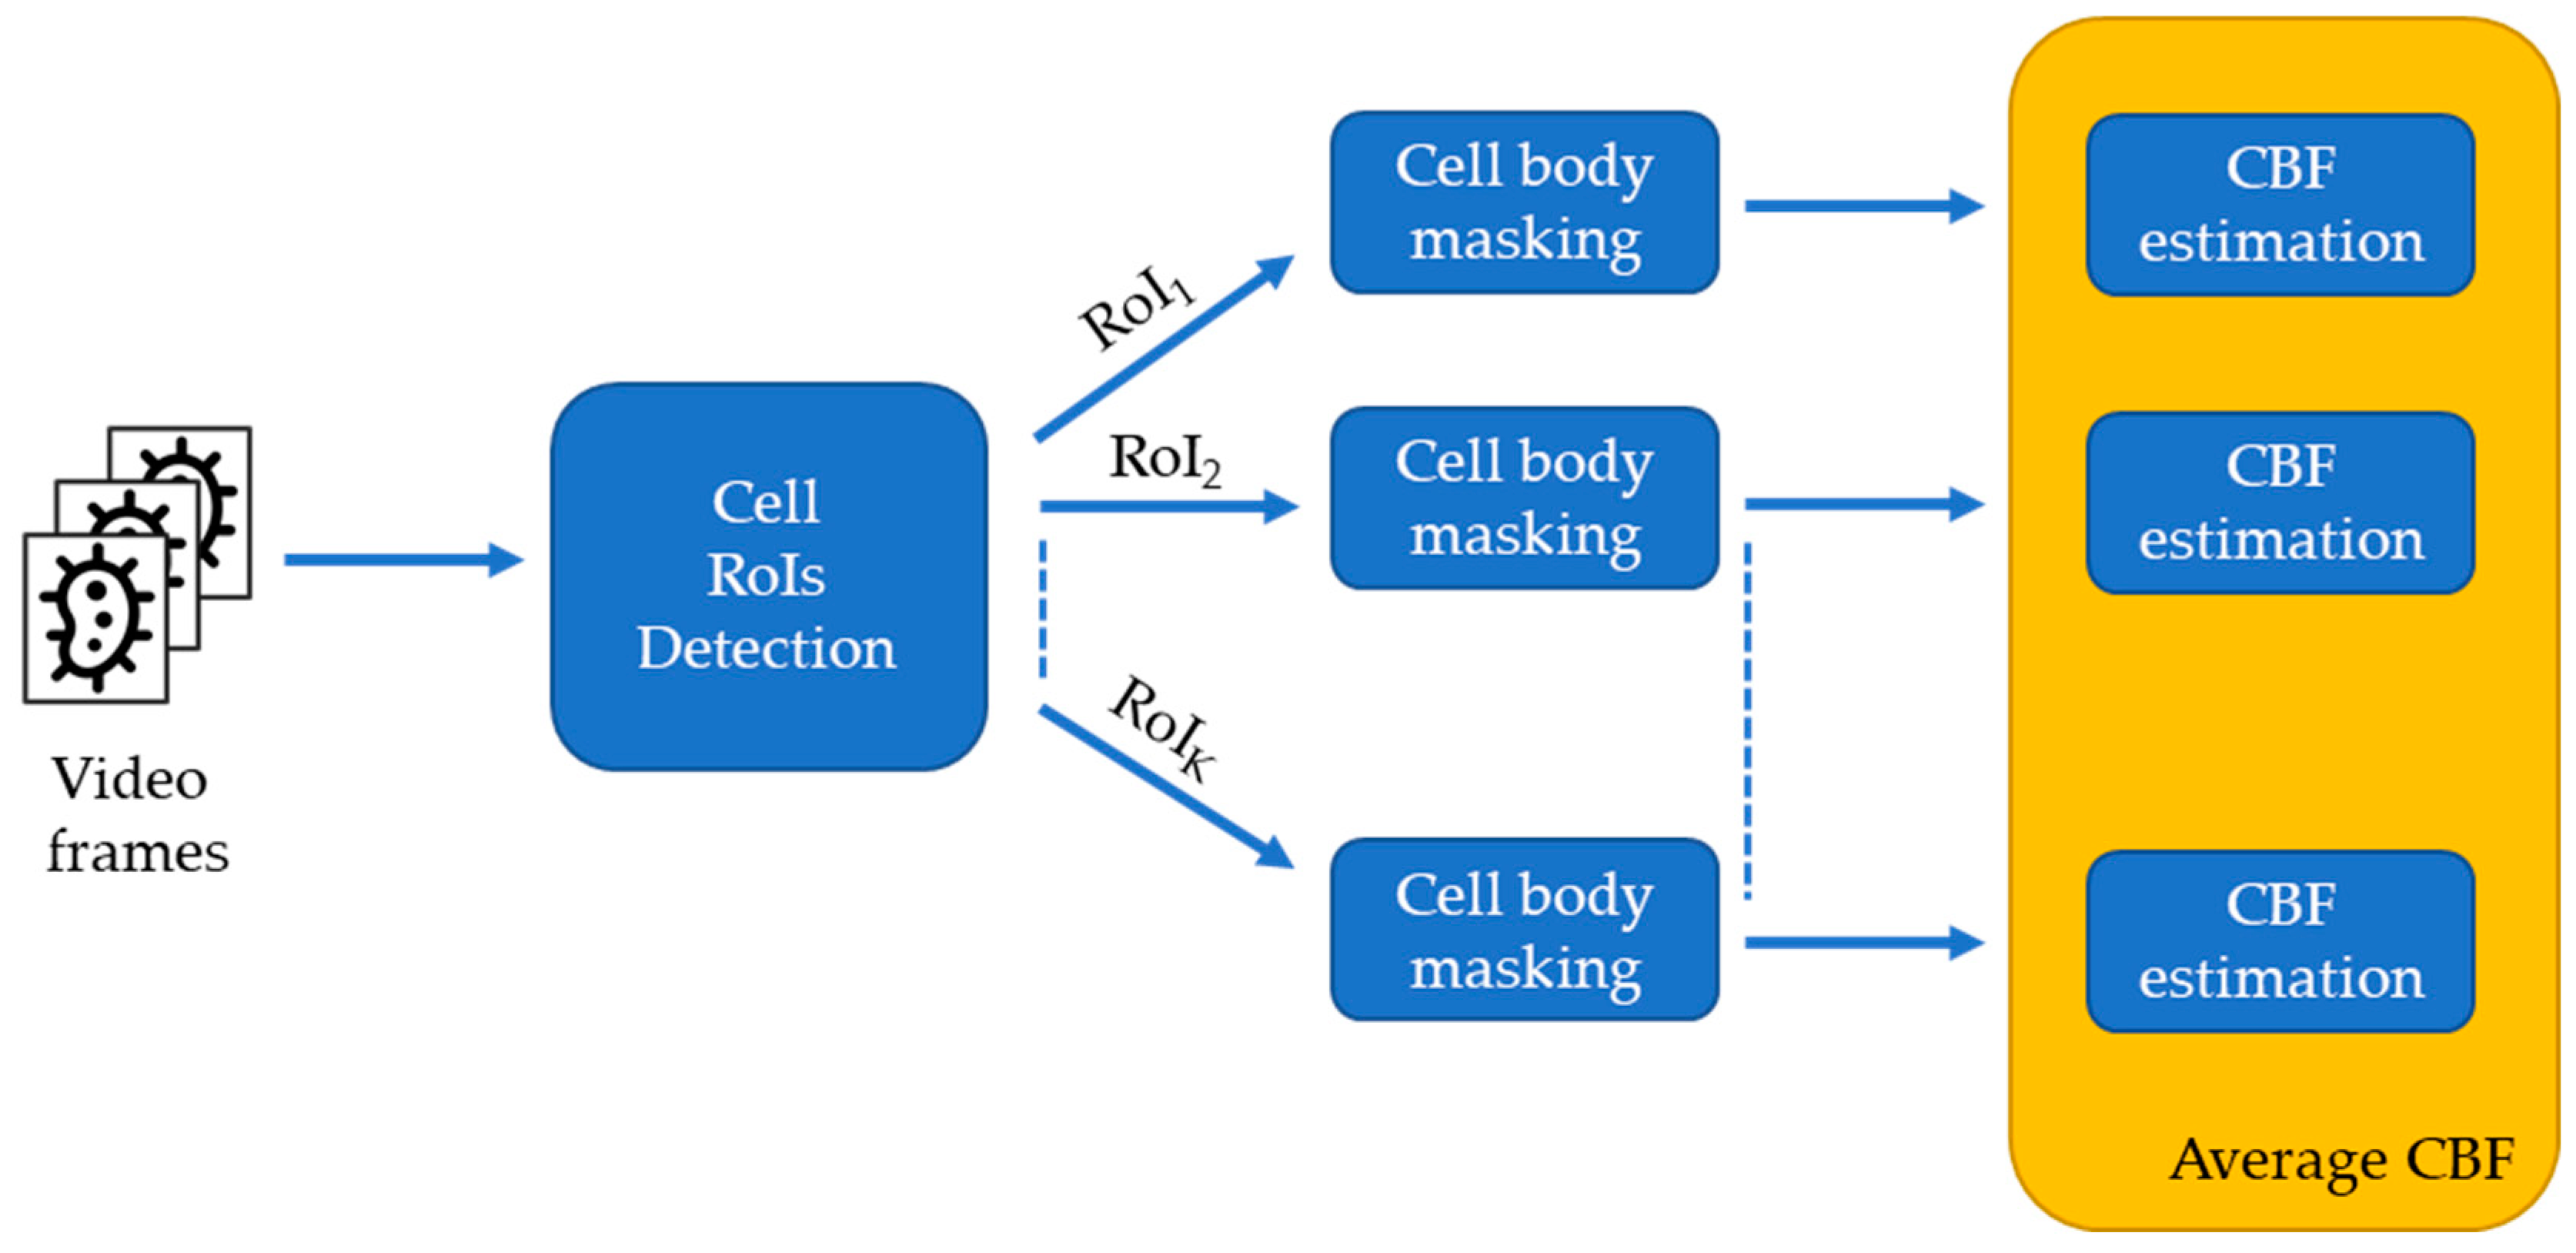
2.2. BeatCilia System Description

In this section, a description of BeatCilia will be given in detail, describing the image processing and computer vision techniques used. Figure 2 shows a brief overview of the building blocks of the system, which takes a video as the input and returns the CBF:
  • Cell RoI detection, devoted to the detection of regions of interest, i.e., small portions of the image that depict the cilia or the whole cell area;
  • Cell body masking, which acts as a fine-tuning step for each of the RoIs detected in the previous step. The aim is to highlight only cilia, explicitly excluding pixels belonging to the cell body;
  • CBF estimation, aimed at measuring the beating frequency for each automatically detected ciliated cell.

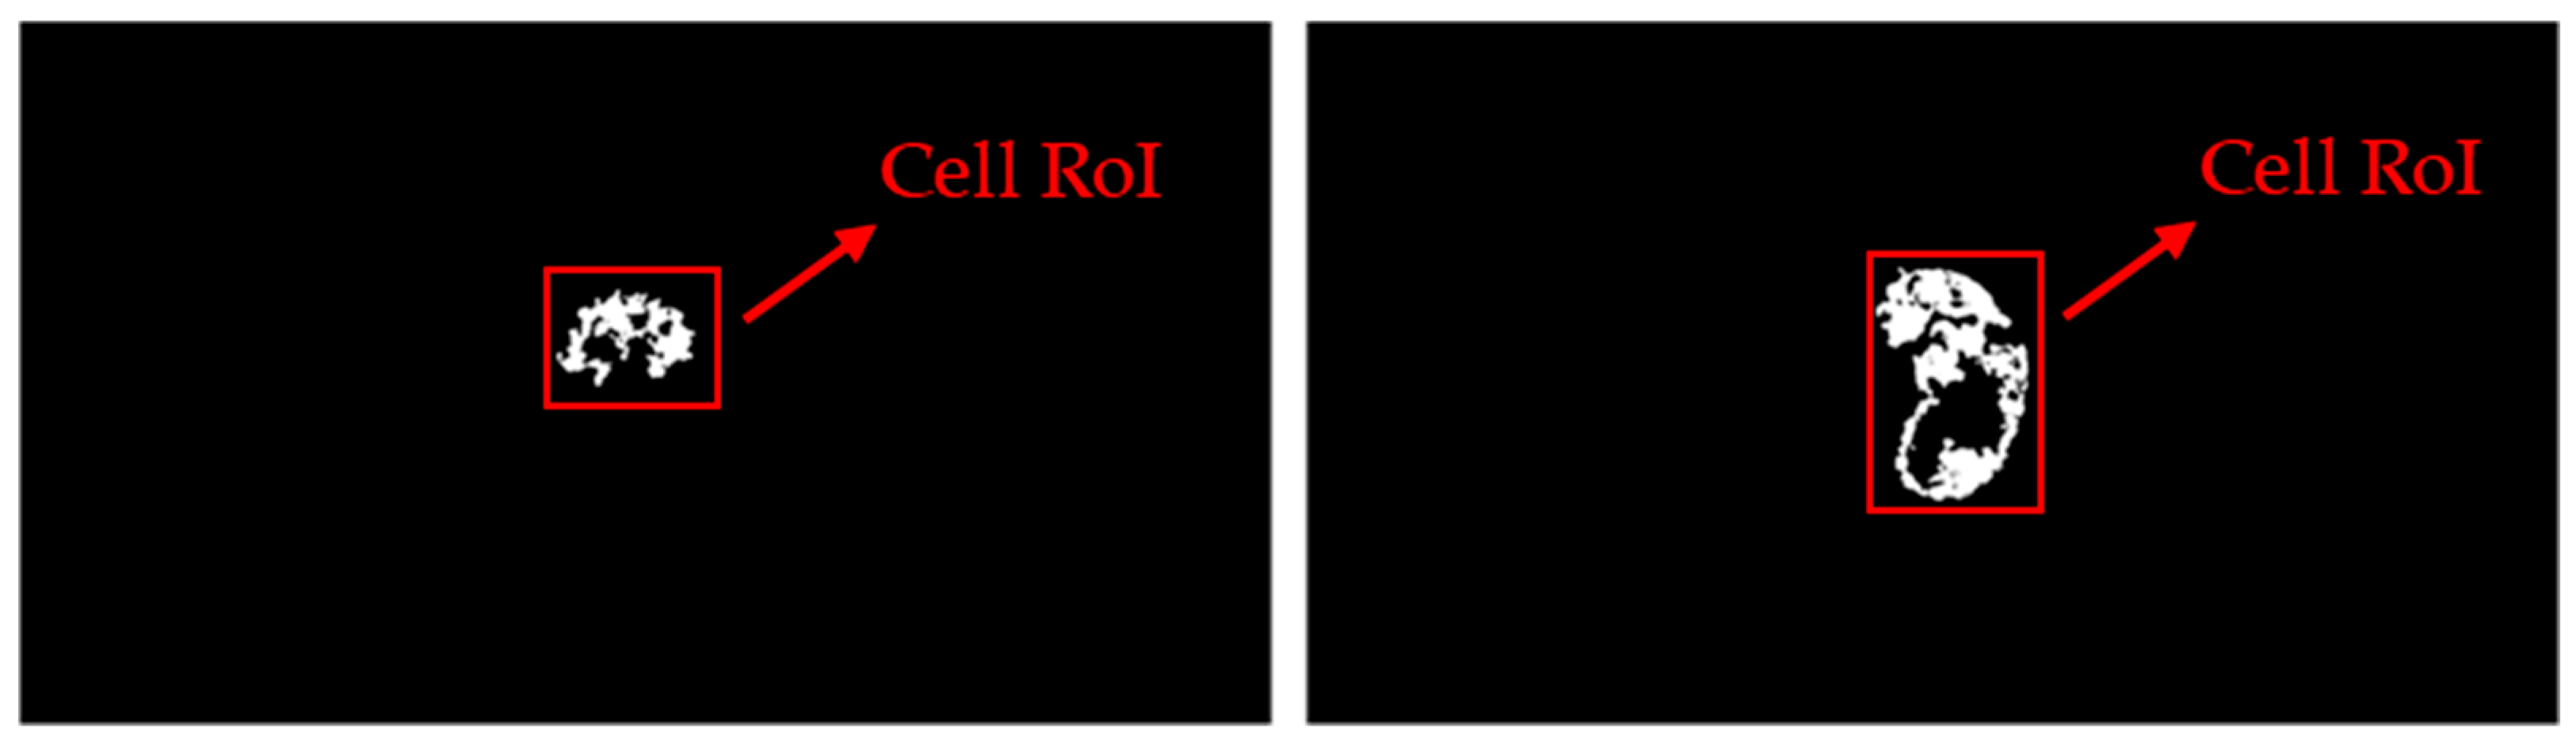
2.2.1. Cell RoI Detection

This step was essential for excluding user intervention, regardless of the presence of single or multiple cells in the video frames. Hence, the following operations were performed:
  • Grayscale conversion and equalization using the Contrast Limited Adaptive Histogram Equalization (CLAHE) algorithm [44] to enhance the contrast and sharpness;
  • Dense optical flow computation;
  • Optical flow magnitude thresholding and morphological filtering;
  • RoI detection.
Let If be a generic grayscale image in frame index f and N be the number of frames in a video. The detection of the cells is performed using a dense Optical Flow (OF) algorithm [45], applied on two subsequent frames OF(It−1, It) for t = 1,…, N and then thresholding the optical flow magnitude image with a binary threshold τ. Then, this binary mask is processed by a morphological opening operation, also known as area opening, using a size 3 elliptic structuring element in order to remove small blobs. Finally, cell RoI detection takes place using a connected component analysis. Figure 3 shows an insight into this step, in which it is immediately clear that the detected cell RoI can be smaller or larger, depending on the actual movement of the whole cell.

2.2.2. Cell Body Masking

The results in Figure 3 highlight the need for a fine-tuning of the cell RoI in order to consider only the pixels belonging to the cilia. In fact, the identified cell RoI can comprise both the cilia and cell body, whose contribution in terms of movement can significantly alter the CBF estimation.
The key aspects of the effectively designed cell body masking method—and consequently a fundamental innovative aspect of our approach—were based on two intrinsic characteristics of ciliated cells:
  • The darkness of the basal body, a streak where cilia are anchored to, which marks the boundary between cilia and the cell body;
  • A strong white glow that surrounds the cytoplasm and stops right below the dark basal body, a visual effect due to the presence of the cell body, which has its own thickness.
Cilia were identified by masking the cell body. To perform this task, cell body contours were estimated by exploiting the white glow around them. Then, the cell contour was found by masking all of the pixels with an intensity lower than the threshold, which were computed using the algorithm in [46]. Finally, the convex hull was computed to identify the approximation of the cell body (i.e., the minimum filling polygon), and consequently to blacken it. This masking process was iteratively applied to all of the RoIs. Figure 4 shows an example of cell body masking.

2.2.3. CBF Estimation

CBF estimation was then performed by applying a fast Fourier transform [47] on the entire time series frames to analyze the signal in the frequency domain. A high-pass filter was applied to remove the fundamental frequency. The CBF was finally estimated by detecting the peak of the amplitude spectrum of the signal. When multiple cells were detected, the average CBF value was returned.

3. Experiments and Results

In order to effectively test and discuss the methodology described in the previous section, three experiments were designed:
  • The first experiment was a preliminary test of the proposed method. It was run on ad-hoc video simulations, which reproduced a constant beating pattern;
  • The second experiment run on the videos included in our dataset was performed to validate the approach in a real case scenario;
  • Finally, we compared the execution times of BeatCilia running on multiple platforms (including a smartphone) and showed our results compared to those achieved by a couple of previous studies (only partially compatible with our system, as they did not use the same facilities).
The software was written in MATLAB and C++ for the desktop platform, whilst Kotlin was used for mobile software.
The first experiment aimed to prove that analyzing the variation of pixel intensities over time. Applying a Fourier transform to them was an effective and efficient way of extracting the beating frequency. To perform this task, simulated signals were used to emulate both single and multiple cell contexts, as well as the presence of noise (Table 2).
The simulated videos had a spatial resolution of 200 × 200 pixels. In particular, S1 shows a squared patch of 50 × 50 pixels, whose grayscale values beat regularly and without any additional noise, as expressed by the following equation:
Y ( t ) = i · sin ( 2 · π · f · t )
The parameters can be explained as follows:
  • i stands for the required pixel intensity assigned to the square patch;
  • f is the square patch frequency, in hertz;
  • t represents the time (in seconds), in our experiment ranging from 0 to N.
S2 is similar to S1, with the difference that the number of beating squares is increased. S3 reproduces a more realistic signal, for which both a Gaussian filter and white noise are applied. The equation used to simulate this behavior is the following:
Y ( t ) = i 1 · sin ( 2 · π · f 1 · t ) + i 2 · sin ( 2 · π · f 2 · t )
The last column of Table 2 shows that by using simulated data, the proposed methodology is able to extract the beating frequency for both clean and noisy signals. A remark should be given about the practical importance of removing the fundamental frequency from the signal before evaluating the CBF (based on a peak detector), in order to avoid the presence of useless peaks (as shown in Figure 5). Moreover, it is worth noting that the effects of the added noise can be seen as multiple small peaks at different frequencies and reduced amplitudes corresponding to the real peaks.
In order to validate the proposed approach, a second experiment was conducted on real ciliated cell videos taken from the dataset described in Section 2.1. The resulting estimated CBFs were compared with a ground truth value that has been manually determined by an expert. This experiment has three different goals:
  • Testing the effectiveness of the cell RoI detection;
  • Testing the cell body masking;
  • comparing BeatCilia results with the ground truth.
The parameters required to run the tests were experimentally tuned using a subset of the frames taken from the videos as a training set. In particular, dense optical flow parameters were set to:
  • The number of pyramid layers = 3;
  • The size of each layer = 0.5;
  • Number of computing iterations = 3;
  • The size of the pixel neighborhood = 5;
  • The averaging filter size = 15.
The binary threshold τ was set to 17, while the structuring element used to perform the morphological opening had a size 3 ellipse.
Figure 6 shows the qualitative results of BeatCilia intermediate steps applied to a frame of the “cilia 1” video of our dataset. In particular, an equalized frame is shown in Figure 6a, where the white glow around the ciliated cell and details of the sharpening effects introduced by the equalization are immediately noticeable. Figure 6b shows the binary mask obtained by filtering the optical flow magnitude. Morphological filtering operations to remove small blobs are shown in Figure 6c, leading to the identification of the area containing ciliated cells, i.e., the cell RoI. Finally, the cell body is masked with the convex hull, as reported in Figure 6d, leaving only ciliated cells inside the region of interest (cell body masking operation).
Figure 7 shows the masked ciliated cells extracted automatically under different operative conditions. The regions of interest were captured from cilia 2, cilia 3, and cilia 4, and are shown to demonstrate the capability of the proposed system to correctly mask the cell body and highlight the cilia independently from the cell rotation and shape. In particular, Figure 7a shows a single cell with a modestly vibrating body and an almost clean background. Figure 7b shows a single cell with discrete body movement, along with a spoiled background. Figure 7c shows the worst case scenario: a scene with a noisy background in which multiple cells are recorded, but only one of them is actually beating. Figure 7d–f include some examples of intersections over unions (IoUs). All the cases in our experiments were similar to these. It is worth noting that the cilia remained greatly unmasked in all situations.
Figure 8 shows a graphical representation of BeatCilia outputs in a multiple-cell scenario with a spoiled background (cilia 4). In order to exclude false positives and stationary areas, every detected ROI with a CBF less than 1 Hz was automatically excluded from the results.
Finally, Table 3 reports the CBF estimation for the videos in the dataset. In particular, BeatCilia was able to estimate the CBF, with an average absolute error of 0.075 Hz. In more detail, the absolute error was less than 0.082 Hz in all cases, except for the video of cilia 3, in which only 2.88 s of video recording (86 frames) was available, containing one cell that beat at only 1 Hz. In the other cases, more frames were available to estimate higher CBFs. A scatter plot is also reported in Figure 9 (correlation coefficient = 0.996).
Finally, we measured the execution time of BeatCilia on multiple platforms (including a mid-range smartphone) and compared our results with those achieved in [34,38]. The test consisted of repeating the whole process multiple times for each video in the dataset, keeping track of the execution times for each run. As for the desktop environment, tests were run on a PC equipped with an Intel Core i7-4710HQ CPU (quad-core, 4.5 GHz) with 16 GB of RAM and Windows 10 operating system. As for the mobile system, BeatCilia was tested on a Xiaomi Redmi 7 with a Snapdragon 610 (quad-core, 1.7 GHz) CPU and 4 GB of RAM, running Android 9.
Figure 10 shows the histogram of the elapsed time per frame of MATLAB implementation on the desktop (green bar), C++ implementation on the desktop (yellow bar), and Android implementation on the smartphone (blue bar). It is immediately noticeable that the running time for C++ outperforms MATLAB, being almost 8× faster due to it being optimized. Figure 10 shows that BeatCilia can efficiently run on a consumer-grade smartphone, effectively supporting the specialists by reducing their efforts, as well as giving reliable CBFs.
Table 4 shows a comparison of BeatCilia with the systems proposed in [34] and [38], based on the following characteristics:
  • Platform: Shows the platforms on which the system is available;
  • Frame size: The size of the processed video frames; (*) authors do not specify the resolution they used;
  • Elapsed time per frame: Average time (in seconds) required to process a single frame. For BeatCilia, we chose the worst case, represented by cilia 10. For [38], the value was computed from the total running time declared in the paper. Here, [34] is marked as not available because the authors declare a running time of “minutes”;
  • Wide microscopic field: Shows whether the system can process wide microscopic field images or if it requires that the scene is manually zoomed on a single ciliated beating cilia;
  • Single- or multiple-cell CBF: Whether the system is capable to estimate CBF for multiple cells in the scene;
  • RoI selection method: Whether the system requires manual interaction to select RoIs or to set any parameter.
BeatCilia took up to 0.023 s (0.058 for the mobile implementation) to process each full-HD frame, while the method from [38] took about 0.056 s on 256 × 192 frames. This factor made a noticeable difference to long videos, especially in mobile environments. Moreover, experiments in this paper were carried out on a laptop processor that was slower (much slower in the case of the smartphone we used) than in other studies and with half of the RAM [38], a crucial factor for video processing applications. In [34,38], experiments were not carried out on a mobile platform.

4. Conclusions and Future Works

The proposed system has been proven to be effective in different scenarios, processing videos of single or multiple cells with or without noisy backgrounds. Its effectiveness allows rhinocytologists more flexibility in cell observation and video capturing, allowing lower zoom requirements, and thus providing reliable CBF estimation without a fully zoomed-in scene for the beating cilia. Its capability to automatically detect the cells in confusing scenarios, focusing on cilia through the masking of the cell body, is the key factor that make BeatCilia actually valuable. To our knowledge, this is the first time that two intrinsic characteristics of ciliated cells—namely the darkness of the basal body and the white glow around the cytoplasm—have been exploited in an automated system to identify the cilia. Moreover, the algorithm was designed to be as lightweight as possible, in order to be implemented on a mobile device. A comparison with other systems confirmed that the main goals of BeatCilia, such as efficiency, were achieved. Since it can also be run on a smartphone, specialists could significantly reduce diagnosis and monitoring times, whilst assuring high-quality results. Future directions of research will be aimed at investigating a possible correlation between the elapsed time and background noise level, which were not significant in this case, considering that the three noise classes were qualitatively defined and large noise variability was observed inside each class. Furthermore, the elapsed time can also be influenced by the number of cells identified in the video. Both factors will be taken into consideration. Finally, in-depth tests of BeatCilia on a larger scale, including clinical experimentation, will be performed.

Author Contributions

Conceptualization, V.R., M.S., and G.D.; data curation, M.C.; formal analysis, V.R. and M.S.; investigation, R.M. and M.S.; methodology, M.S. and M.G.; project administration, R.M.; resources, M.G. and M.S.; Software, M.S.; validation, V.R. and G.D.; writing—original draft, V.R. and M.S.; writing—review and editing, M.S., M.G., M.C., G.D., and R.M. All authors have read and agreed to the published version of the manuscript.

Funding

This research received no external funding.

Conflicts of Interest

The authors declare no conflict of interest.

Appendix A. The Ciliated Epithelium

The qualitative and quantitative evaluation of nasal epithelial cells is interesting in chronic infectious or inflammatory pathologies of the nose and sinuses, where it allows evaluation of the quality of the sampling and the epithelial repercussion of the pathology (secretory hyperplasia, squamous metaplasia). Viral rhinological infections have a specific cytological profile (ciliocitoforia) [48]. The hair cells detach and present important alterations of the eyelashes and their internal structures. The Papanicolau staining technique makes this aspect clearly visible, which can persist for more than 1 week, depending on the viral agent responsible.
The ciliated epithelium is a pseudostratified one, where all the cells touch the basal lamina. This may be confused with a stratified epithelium, since while observing it with a microscope, each cell seems to belong to a different level, even if in reality they are not overlapping but staggered. In this epithelium, it is possible to observe ciliated cells with different shapes, including round or tapered shapes. Every ciliated cell consists of a cell body, containing the nucleus, the ciliary apparatus, and the basal body, the region where cilia lay their foundations.
A recent study has shown that healthy ciliated cells have a streak above the nucleus, called the hyperchromatic supranuclear stria [49]. This can be considered as the representation of the Golgi complex, where all the elementary proteins that cilia are made of, such as dynein, are created and then carried out to the basal body. In humans, ciliated cells are 15 to 20 nm long and generally beat with a frequency up to 16 Hz. The normal frequency can change in response to infections, temperature, age, or generally speaking, in case of inflammation or infections in the upper airway [26]. The frequency of the beating cell is called the ciliary beat frequency (CBF). Regularly, these cells beat with a constant, smooth pattern, allowing effective mucociliary clearance. Mucociliary clearance is the first-line defense that our organism exploits (put in place) to protect itself from allergens, pathogens, and pollutants: Microscopic cilia on the surface of epithelium cells regularly beat and move the mucus away, clearing the airways. Nonetheless, the cilia oscillatory motion can be easily impaired, and this altered movement is called dyskinetic movement. Ciliary dyskinesia can be subdivided into two major categories—primary ciliary dyskinesia (PCD) and secondary ciliary dyskinesia (SCD).
PCD is an inherited disease that impairs the rhythmic and pattern-like cilia movement, turning it into irregular vibrating movement. This altered movement consequently impairs the mucociliary clearance; cilia cannot effectively move the mucus anymore. For instance, Kartagener syndrome is a PCD disease. In this extreme situations, although very rare (1:100.000), the altered cilia movement changes the native location of the organs (right side of the heart and left side of the liver), apart from with chronic sinusitis. This is typically due to genetic mutations. The diagnostic test can be performed with saccharin inhalation, but is not suitable for everyone, particularly for young children, as the patient must remain still during the test.
SCD can be described as a temporary cilia impairment, possibly caused by allergies, drugs, or pollutants. It is temporary because as soon as the infection passes away, the ciliary beating frequency returns to its original value.
Furthermore, a prolonged decrease of CBF can trigger other irritations in the upper airways. A weak mucociliary clearance can be observed in smokers too, where the extended contact with compounds such as hydrogen cyanide, acrolein, formaldehyde, ammonia, and phenols in tobacco impairs the CBF [50]. Studies [51,52] have shown than an impaired CBF can also be observed in patients affected by cystic fibrosis and chronic obstructive pulmonary disease, where thickened mucous inhibits ciliary motion.
Since an altered CBF can warn a patient something happening in the airways, monitoring of this can be used to determine the effectiveness of upper-airway treatments. Therefore, CBF is a key factor used to determine and monitor respiratory health conditions and to diagnose other severe pathologies.

References

  1. Dimauro, G.; Caivano, D.; Bevilacqua, V.; Girardi, F.; Napoletano, V. VoxTester, software for digital evaluation of speech changes in Parkinson disease. In Proceedings of the 2016 IEEE International Symposium on Medical Measurements and Applications, MeMeA 2016, Benevento, Italy, 15−18 May 2016. [Google Scholar] [CrossRef]
  2. Bevilacqua, V.; Brunetti, A.; Trotta, G.F.; Dimauro, G.; Elez, K.; Alberotanza, V.; Scardapane, A. A Novel Approach for Hepatocellular Carcinoma Detection and Classification Based on Triphasic CT Protocol. In Proceedings of the IEEE Congress on Evolutionary Computation 2017, San Sebastian, Spain, 5−8 June 2017. [Google Scholar] [CrossRef]
  3. Dimauro, G.; di Nicola, V.; Bevilacqua, V.; Caivano, D.; Girardi, F. Assessment of Speech Intelligibility in Parkinson’s Disease Using a Speech-To-Text System. IEEE Access 2017, 5. [Google Scholar] [CrossRef]
  4. Rubaiat, S.Y.; Rahman, M.M.; Hasan, M.K. Important Feature Selection & Accuracy Comparisons of Different Machine Learning Models for Early Diabetes Detection. In Proceedings of the 2018 International Conference on Innovation in Engineering and Technology (ICIET), Dhaka, Bangladesh, 27−28 December 2018; pp. 1–6. [Google Scholar] [CrossRef]
  5. Dimauro, G.; Caivano, D.; Girardi, F. A New Method and a Non-Invasive Device to Estimate Anemia Based on Digital Images of the Conjunctiva. IEEE Access 2018, 6, 46968–46975. [Google Scholar] [CrossRef]
  6. Dimauro, G.; Baldari, L.; Caivano, D.; Colucci, G.; Girardi, F. Automatic Segmentation of Relevant Sections of the Conjunctiva for Non-Invasive Anemia Detection. In Proceedings of the 3rd International Conference on Smart and Sustainable Technologies (SpliTech 2018), Split, Croatia, 26–29 June 2018; ISBN 978-953290083-5. [Google Scholar]
  7. Hasan, M.K.; Aziz, M.H.; Zarif, M.I.I.; Hasan, M.; Hashem, M.M.A.; Guha, S.; Love, R. HeLP ME: Recommendations for Non-invasive Hemoglobin Level Prediction in Mobile-phone Environment. JMIR mHealth uHealth 2020. [Google Scholar] [CrossRef]
  8. Dimauro, G.; Impedovo, S.; Pirlo, G.; Salzo, A. RNS architectures for the implementation of the ‘diagonal function. Inf. Process. Lett. 2000, 73, 189–198. [Google Scholar] [CrossRef]
  9. Dimauro, G.; Impedovo, S.; Modugno, R.; Pirlo, G.; Stefanelli, R. Residue-to-binary conversion by the “quotient function”. IEEE Trans. Circuits Syst. II Analog Digit. Signal Process. 2003, 50, 488–493. [Google Scholar] [CrossRef]
  10. Valueva, M.; Valuev, G.; Semyonova, N.; Lyakhov, P.; Chervyakov, N.; Kaplun, D.; Bogaevskiy, D. Construction of Residue Number System Using Hardware Efficient Diagonal Function. Electronics 2019, 8, 694. [Google Scholar] [CrossRef] [Green Version]
  11. Reno, V.; Dimauro, G.; Labate, G.; Stella, E.; Fanizza, C.; Cipriano, G.; Carlucci, R.; Maglietta, R. A SIFT-based software system for the photo- identification of the Risso’s dolphin. Ecol. Inform. 2019, 50, 95–101. [Google Scholar] [CrossRef]
  12. Maglietta, R.; Bruno, A.; Reno, V.; Dimauro, G.; Stella, E.; Fanizza, C.; Bellomo, S.; Cipriano, G.; Tursi, A.; Carlucci, R. The promise of machine learning in the Risso’s dolphin Grampus griseus photo- identification. In Proceedings of the IEEE International Workshop on Metrology for the Sea, Bari, Italy, 8–10 October 2018. [Google Scholar] [CrossRef]
  13. Maglietta, R.; Milella, A.; Caccia, M.; Bruzzone, G. A vision-based system for robotic inspection of marine vessels. Signal Image Video Process. 2018, 3, 471–478. [Google Scholar] [CrossRef]
  14. Maglietta, R.; Reno, V.; Cipriano, G.; Fanizza, C.; Milella, A.; Stella, E.; Carlucci, R. DolFin: An innovative digital platform for studying Risso’s dolphins in the Northern Ionian Sea (North-eastern Central Mediterranean). Sci. Rep. 2018, 8, 17185. [Google Scholar] [CrossRef]
  15. Bevilacqua, V.; Dimauro, G.; Marino, F.; Brunetti, A.; Cassano, F.; Di Maio, A.; Nasca, E.; Trotta, G.F.; Girardi, F.; Ostuni, A.; et al. A novel approach to evaluate blood parameters using computer vision techniques. In Proceedings of the 2016 IEEE International Symposium on Medical Measurements and Applications (MeMeA), Benevento, Italy, 15–18 May 2016. [Google Scholar] [CrossRef]
  16. Maglietta, R.; Renò, V.; Caccioppoli, R.; Seller, E.; Bellomo, S.; Santacesaria, F.C.; Colella, R.; Cipriano, G.; Stella, E.; Hartman, K.; et al. Convolutional Neural Networks for Risso’s dolphins identification. IEEE Access 2020. In Press. [Google Scholar] [CrossRef]
  17. Renò, V.; Losapio, G.; Forenza, F.; Politi, T.; Stella, E.; Fanizza, C.; Hartman, K.; Carlucci, R.; Dimauro, G.; Maglietta, R. Combined Color Semantics and Deep Learning for the Automatic Detection of Dolphin Dorsal Fins. Electronics 2020, 9, 758. [Google Scholar] [CrossRef]
  18. Maglietta, R.; Amoroso, N.; Bruno, S.; Chincarini, A.; Frisoni, G.; Inglese, P.; Tangaro, S.; Tateo, A.; Bellotti, R. Random Forest Classification for Hippocampal Segmentation in 3D MR Images. In Proceedings of the 2013 12th International Conference on Machine Learning and Applications, Miami, FL, USA, 4–7 December 2013; pp. 264–267. [Google Scholar] [CrossRef]
  19. Maglietta, R.; Amoroso, N.; Boccardi, M.; Bruno, S.; Chincarini, A.; Frisoni, G.B.; Inglese, P.; Redolfi, A.; Tangaro, S.; Tateo, A.; et al. The Alzheimer Disease Neuroimaging Initiative Automated hippocampal segmentation in 3D MRI using random undersampling with boosting algorithm. Pattern Anal. Appl. 2016, 19, 579–591. [Google Scholar] [CrossRef] [PubMed] [Green Version]
  20. Gelardi, M. Atlas of Nasal Cytology for the Differential Diagnosis of Nasal Diseases; Edi Ermes: Milan, Italy, 2012; ISBN 9781467530354. [Google Scholar]
  21. Gelardi, M.; Iannuzzi, L.; Quaranta, N.; Landi, M.; Passalacqua, G. Nasal cytology—Pratical aspects and clinical relevance. Clin. Exp. Allergy 2016, 46, 785–792. [Google Scholar] [CrossRef] [PubMed]
  22. Gelardi, M. Citologia Nasale. Available online: http://www.citologianasale.eu/citologia.htm (accessed on 12 June 2020).
  23. Dimauro, G.; Girardi, F.; Gelardi, M.; Bevilacqua, V.; Caivano, D. Rhino-Cyt: A System for Supporting the Rhinologist in the Analysis of Nasal Cytology. In Proceedings of the 14th Intelligent Computing Theories and Application, Wuhan, China, 15–18 August 2018. [Google Scholar] [CrossRef]
  24. Dimauro, G.; Ciprandi, G.; Deperte, F.; Girardi, F.; Ladisa, E.; Latrofa, S.; Gelardi, M. Nasal cytology with deep learning techniques. Int. J. Med. Inform. 2019. [Google Scholar] [CrossRef] [PubMed]
  25. Caruso, G.; Gelardi, M.; Passali, G.C.; de Santi, M.M. Nasal scraping in diagnosing ciliary dyskinesia. Am. J. Rhinol. 2007, 21, 702–705. [Google Scholar] [CrossRef] [PubMed]
  26. Lemieux, B.; Chen, J.J.; Jing, J.C.; Chen, Z.; Wong, B.J.F. Measurement of ciliary beat frequency using Doppler optical coherence tomography. Int. Forum Allergy Rhinol. 2015, 5, 1048–1054. [Google Scholar] [CrossRef] [Green Version]
  27. Yager, J.; Chen, T.M.; Dulfano, M.J. Measurement of frequency of ciliary beats of human respiratory epithelium. Chest 1978, 73, 627–633. [Google Scholar] [CrossRef]
  28. Teichtahl, H.; Wright, P.L.; Kirsner, R.L. Measurement of in vitro ciliary beat frequency: A television-video modification of the transmitted light technique. Med. Biol. Eng. Comput. 1986, 24, 193–196. [Google Scholar] [CrossRef]
  29. Gray, J. The mechanism of ciliary movement.—VI. Photographic and stroboscopic analysis of ciliary movement. Proc. R. Soc. B Biol. Sci. 1930, 107, 313–332. [Google Scholar]
  30. Coste, A.; Millepied, M.C.; Chapelin, C.; Reinert, P.; Poron, F.; Boucherat, M.; Escudier, E. Incidence of primary ciliary dyskinesia in children with recurrent respiratory diseases. Ann. Otol. Rhinol. Laryngol. 1997, 106, 854–858. [Google Scholar] [CrossRef]
  31. Schipor, I.; Palmer, J.N.; Cohen, A.S.; Cohen, N.A. Quantification of ciliary beat frequency in sinonasal epithelial cells using differential interference contrast microscopy and high-speed digital video imaging. Am. J. Rhinol. 2006, 20, 124–127. [Google Scholar] [CrossRef] [PubMed]
  32. O’Callaghan, C.; Sikand, K.; Chilvers, M.A. Analysis of ependymal ciliary beat pattern and beat frequency using high speed imaging: Comparison with the photomultiplier and photodiode methods. Cilia 2012, 1, 8. [Google Scholar] [CrossRef] [PubMed] [Green Version]
  33. Sisson, J.H.; Stoner, J.A.; Ammons, B.A.; Wyatt, T.A. All-digital image capture and whole-field analysis of ciliary beat frequency. J. Microsc. 2003, 211, 103–111. [Google Scholar] [CrossRef] [PubMed]
  34. Chen, J.J.; Lemieux, B.T.; Wong, B.J. A Low-Cost Method of Ciliary Beat Frequency Measurement Using iPhone and MATLAB: Rabbit Study. Otolaryngol. Head Neck Surg. 2016, 155, 252–256. [Google Scholar] [CrossRef] [PubMed]
  35. Mantovani, G.; Pifferi, M.; Vozzi, G. Automated software for analysis of ciliary beat frequency and metachronal wave orientation in primary ciliary dyskinesia. Eur. Arch. Oto-Rhino-Laryngol. 2010, 267, 897–902. [Google Scholar] [CrossRef] [PubMed]
  36. Smith, C.; Djakow, J.; Free, R.C.; Djakow, P.; Lonnen, R.; Williams, G.; Pohunek, P.; Hirst, R.A.; Easton, A.J.; Andrew, P.W.; et al. CiliaFA: A research tool for automated, high-throughput measurement of ciliary beat frequency using freely available software. Cilia 2012, 1, 14. [Google Scholar] [CrossRef] [Green Version]
  37. Kim, W.; Han, T.H.; Kim, H.J.; Park, M.Y.; Kim, K.S.; Park, R.W. An automated measurement of ciliary beating frequency using a combined optical flow and peak detection. Healthc. Inform. Res. 2011, 17, 111–119. [Google Scholar] [CrossRef] [Green Version]
  38. Puybareau, E.; Talbot, H.; Pelle, G.; Louis, B.; Papon, J.; Coste, A.; Najman, L. A regionalized automated measurement of ciliary beating frequency. In Proceedings of the 2015 IEEE 12th International Symposium on Biomedical Imaging, New York, NY, USA, 16–19 April 2015; pp. 528–531. [Google Scholar]
  39. Meste, O.; Brau, F.; Guyon, A. Robust estimation of the motile cilia beating frequency. Med. Biol. Eng. Comput. 2015, 53, 1025–1035. [Google Scholar] [CrossRef]
  40. Dimauro, G. A new image quality metric based on human visual system. In Proceedings of the 2012 IEEE International Conference on Virtual Environments Human-Computer Interfaces and Measurement Systems (VECIMS), Tianjin, China, 2–4 July 2012; pp. 69–73. [Google Scholar] [CrossRef]
  41. Gigantesco, A.; Giuliani, M. Quality of life in mental health services with a focus on psychiatric rehabilitation practice. Ann. Ist. Super Sanità 2011, 47, 363–372. [Google Scholar] [CrossRef]
  42. Dimauro, G.; Caivano, D.; Girardi, F.; Ciccone, M.M. The Patient Centered Electronic Multimedia Health Fascicle—EMHF. In Proceedings of the 2014 IEEE Workshop on Biometric Measurements and Systems for Security and Medical Applications (BIOMS), Rome, Italy, 17 October 2014; ISBN 9781479951758. [Google Scholar] [CrossRef]
  43. Dimauro, G.; Girardi, F.; Caivano, D.; Colizzi, L. Personal Health E-Record Toward an enabling Ambient Assisted Living Technology for communication and information sharing between patients and care providers. In Ambient Assisted Living; Springer: Cham, Switzerland, 2018; ISBN 9783030059200. [Google Scholar] [CrossRef]
  44. Pizer, S.M.; Amburn, E.P.; Austin, J.D.; Cromartie, R.; Geselowitz, A.; Greer, T.; Romeny, B.M.T.H.; Zimmerman, J.B. Adaptive histogram equalization and its variations. Comput. Vis. Graph. Image Process. 1987, 39, 355–368. [Google Scholar] [CrossRef]
  45. Farnebäck, G. Two-Frame Motion Estimation Based on Polynomial Expansion. In Proceedings of the Scandinavian Conference on Image Analysis, Halmstad, Sweden, 29 June−2 July 2003. [Google Scholar]
  46. Alamri, S.S.; Kalyankar, N.V.; Khamitkar, S.D. Image Segmentation by Using Threshold Techniques. arXiv Comput. Vis. Pattern Recognit. 2010. [Google Scholar]
  47. Brigham, E.O.; Morrow, R.E. The fast Fourier transform. IEEE Spectr. 1967, 4, 63–70. [Google Scholar] [CrossRef]
  48. Gelardi, M.; Ciprandi, G. Ciliocytophthoria of nasal epithelial cells after viral infection: A sign of suffering cell. Acta Biomed. 2019, 90. [Google Scholar] [CrossRef]
  49. Gelardi, M.; Cassano, P.; Cassano, M.; Fiorella, M.L. Nasal cytology: Description of a hyperchromatic supranuclear stria as a possible marker for the anatomical and functional integrity of the ciliated cell. Am. J. Rhinol. 2003, 17, 263–268. [Google Scholar] [CrossRef] [PubMed]
  50. Stanley, P.J.; Wilson, R.; Greenstone, M.A.; Macwilliam, L.; Cole, P.J. Effect of cigarette smoking on nasal mucociliary clearance and ciliary beat frequency. Thorax 1986, 41, 519–523. [Google Scholar] [CrossRef] [PubMed] [Green Version]
  51. Regnis, J.A.; Robinson, M.; Bailey, D.L.; Cook, P.; Hooper, P.; Chan, H.K.; Gonda, I.; Bautovich, G.; Bye, P.T. Mucociliary clearance in patients with cystic fibrosis and in normal subjects. Am. J. Respir. Crit. Care Med. 1994, 150, 66–71. [Google Scholar] [CrossRef] [PubMed]
  52. Smaldone, G.C.; Foster, W.M.; O’Riordan, T.G.; Messina, M.S.; Perry, R.J.; Langenback, E.G. Regional impairment of mucociliary clearance in chronic obstructive pulmonary disease. Chest 1993, 103, 1390–1396. [Google Scholar] [CrossRef]
Figure 1. Example of different background noise levels from our dataset (a,b) level 1; (c) level 2; (d) refers to level 3.
Electronics 09 01002 g001
Figure 2. Block diagram of the logical pipeline of the developed system. Video frames are the input, then cell RoIs. Detection takes place, followed by cell body masking. The final step is the CBF estimation. The average CBF is computed if more than one cell is detected in the microscopic field.
Electronics 09 01002 g002
Figure 3. The results of cell recognition based on optical flow. cilia 1 (left), and cilia 2 (right).
Electronics 09 01002 g003
Figure 4. An example of cell body masking on ilia 2: (a) the cell RoI; (b) the cell body mask, with the outcome of the convex hull; and (c) the image after the cell body masking operation. In this way, beating cilia are isolated and the masked pixels are not used to compute the beating frequency.
Electronics 09 01002 g004
Figure 5. Example of the Fourier transform from simulation S3, with evidence (orange) of the frequency peak (14 Hz) and the fundamental frequency (0 Hz).
Electronics 09 01002 g005
Figure 6. Steps of BeatCilia from the “cilia 1” video: (a) an equalized frame; (b) result of the dense optical flow; (c) cell RoI detection; (d) cell body masking.
Electronics 09 01002 g006
Figure 7. Examples of masked ciliated cells sampled from the dataset under different operative conditions: (a) cilia 2; (b) cilia 3; (c) cilia 4. The intersections over unions (IoUs) are shown (df), scored measuring 0.84, 0.67, and 0.60, respectively.
Electronics 09 01002 g007
Figure 8. A graphical representation of the results obtained from cilia 4. This figure emphasizes the robustness of the proposed algorithm using optical flow; in fact, even with noisy and multiple objects scenarios, as above, this method is able to correctly identify the ROIs containing the beating cilia. The cluster of cells in the center and left-most part of the frame is completely stationary, whilst the CBF of the right-most beating cell is 3.5294 Hz.
Electronics 09 01002 g008
Figure 9. Scatter plot of CBF Estimation versus Ground truth.
Electronics 09 01002 g009
Figure 10. Histogram showing a comparison of the three different implementations. Each test was repeated 3 times.
Electronics 09 01002 g010
Table 1. Recap of the dataset with evidence of the different scenarios involved.
NameDuration (s)Frame CountBackground Noise LevelCells PresenceCell Body Movement
Cilia 12.9871SingleWeak
Cilia 24.561361SingleDiscrete
Cilia 32.88862SingleDiscrete
Cilia 42.86853MultipleHigh
Cilia 510.043011SingleVery High
Cilia 64.851352MultipleWeak
Cilia 72.83851MultipleDiscrete
Cilia 82.43731SingleWeak
Cilia 93.1931MultipleWeak
Cilia 102.56773MultipleWeak
Table 2. Recap of simulated beating patterns for experiment number 1. The simulated beating frequency and the estimated one are identical.
Simulation N.N. of Beating ObjectsNoiseBeating Frequency (Hz)Estimated Peak Frequency (Hz)
S11No7.007.00
S21–3No8.008.00
S31–3Yes14.0014.00
Table 3. Estimated CBF and absolute error for all the videos in our dataset. The ground truth CBF was measured by an expert by reproducing the videos in slow motion and manually counting how many times the cilia came back to a certain spot. The resulting number was then divided by the length of the video in seconds.
VideoGround Truth CBF (Hz)Estimated CBF (Hz)Absolute Error (Hz)
Cilia 12.1002.0690.031
Cilia 22.0001.9850.015
Cilia 31.0001.3950.395
Cilia 43.5003.5290.029
Cilia 55.4505.3820.068
Cilia 63.3303.3480.018
Cilia 74.2804.2350.045
Cilia 82.5002.4660.034
Cilia 91.9001.9360.036
Cilia 101.2501.1690.081
Table 4. Comparison of BeatCilia with the systems proposed in [34,38].
SystemPlatformFrame Size (px)Elapsed Time per Frame
(s)
Wide Microscopic FieldSingle/Multiple-Cell CBFRoI Selection Method
BeatCiliaMobile1920 × 10800.058YesMultipleNo
BeatCiliaDesktop C++1920 × 10800.023YesMultipleNo
BeatCiliaDesktop MATLAB1920 × 10800.247YesMultipleNo
[34]DesktopiPhone 6 (*)N/ANoSingleYes
[38]Desktop256 × 1920.056NoSingleNo

