Article

Design and Power Management of a Secured Wireless Sensor System for Salton Sea Environmental Monitoring

Department of Electrical and Computer Engineering, San Diego State University, San Diego, CA 92182, USA
*
Author to whom correspondence should be addressed.
Electronics 2020, 9(4), 544; https://doi.org/10.3390/electronics9040544
Submission received: 4 February 2020 / Revised: 17 March 2020 / Accepted: 20 March 2020 / Published: 25 March 2020
(This article belongs to the Special Issue Embedded Devices in IoT)

Abstract

:
An embedded system composed of commercial off the shelf (COTS) peripherals and microcontroller. The system will collect environmental data for Salton Sea, Imperial Valley, California in order to understand the development of environmental and health hazards. Power analysis of each system features (i.e. Central Processing Unit (CPU) core, Input/Output (I/O) buses, and peripheral (temperature, humidity, and optical dust sensor) are studied. Software-based power optimization utilizes the power information with hardware-assisted power gating to control system features. The control of these features extends system uptime in a field deployed finite energy scenario. The proposed power optimization algorithm can collect more data by increasing system up time when compared to a Low Power Energy Aware Processing (LEAP) approach. Lastly, the 128 bit Advanced Encryption Standard (AES) algorithm is applied on the collected data using various parameters. A hidden peripheral requirement that must be considered during design are also noted to impact the efficacy of this method.

1. Introduction

Over the last several decades the Salton Sea region has been negatively impacted by climate, agricultural practices, and reduced water flow [1]. This can be seen in the decline of the lake’s water level and increase in salinity. The reduced water levels expose new lakebed. The composition of particles in this newly exposed lakebed, known as the playa, is strongly tied to the ambient particulate matter composition [2]. Wind erosion acting on this playa aids in the production of hazardous fine dust pollutants [1]. This imposes a potential health hazard for those in the nearby regions by increasing their risk and exposure to deadly diseases like West Nile Virus, chronic obstructive pulmonary disease, emphysema, and cancer [3]. These health risks are not just a result of the environment but also a failure to act. This lack of action has grounds to constitute as state-corporate crime [4] and thus it is in the best interest of multiple parties to combat the degradation of this salt lake environment. Monitoring this environment lays the foundation for further studies on the change that is taking place.
A system that has the potential to monitor these changes would need to withstand extremes up 50 °C, 90% humidity, water surface temperature up to 33 °C and as low as 14 °C [5]. Constant monitoring in these conditions along with the remote location are impractical for live human subject. In contrast, many commercial off the shelf (COTS) components are rated to operate within those parameters. Popular COTS sensors are commonly built around Arduino based board to generate a proof of concept [6]. The goal of this system will be to maximize the number of data points collected on a finite amount of stored battery energy. The implementation is considered successful if the composite system power consumption can be minimized without sacrificing system utility.

Related Work

In this section several systems that monitor environmental conditions and quality via various sensors are shown. Followed up environmental monitoring conditions that utilize energy harvesting and power controlling techniques to prolong the operating lifetime of remote, finite energy sensor systems [7,8,9,10,11].
A system designed to monitor water quality and fish behavior has been introduced by Parra et al. [7]. Through this system a cost-effective way to monitor an aquatic environment is shown. Arduino based microcontroller and commercial sensors are showcased to effectively monitor select water, tank, and feeding parameter. The architecture discussed deals with reducing energy consumption in the wireless sensor network. A technique to further reduce energy consumption for an aquatic system is shown by Hu [8]. This technique factors in the measured conditions of the environment to determine an appropriate sampling rate. The sampling interval is dynamic and show potential to save energy compared to a fixed rate sampling system. Hu elaborates that the energy savings brought about by reducing sample quantity outweighs the required of additional energy cost to update the sampling rate dynamically. Since environmental sensor systems may be deployed in off-the-grid location and not easily accessible location, they would need to operate on finite amounts of energy without human support. Many energy harvesting techniques available for such systems are discussed by Prauzek at al [9] and differentiates the difference between ambient energy and externally emitted energy sources. Groundwork is laid for environmental wireless sensor networks to utilize existing energy in their deployed location to enhance their energy sustainability. Various storage devices are explored as well and energy harvesting-storage topologies are highlighted. The environment and the limited energy challenge are also addressed by Engmann et al. [12] and they call for the use of efficient energy management and energy harvesting. The techniques analyzed by Engmann et al. expand across wireless sensor networks and seek to prolong the lifetime of the energy hungry nodes. Simulations to achieve efficient energy consumption are discussed for multiple layers of the network. Techniques to harvest solar energy, vibration energy, and radio energy from the environment are highlighted. Storage techniques and wireless transmission of energy is also proposed to distribute energy across devices in the network. The papers discussed so far have introduced excellent ways to manage energy for wireless sensor networks, harvest energy for the wireless sensor networks and monitor the environment with such network. However, a lower level analysis is required as well. Techniques shown by Prauzek at al [10] can improve energy harvesting by adding an awareness of stored energy via observing the state of charge and considering future available energy for harvesting. This is done by having an adaptive, energy harvesting-aware sensing strategy developed by the differential evolution of fuzzy controller. A low-cost Internet of Things (IoT) based weather monitoring system is proposed by Rao et al. [13] to monitor specific environment parameters, execute analysis on collected data, and making the data available to the end user via Wi-Fi protocol. The Arduino based microcontroller (MCU) hosts 4-tier architectural model to pull temperature, humidity, light intensity, and CO levels from the environment. Another Arduino based embedded system is proposed by Djajadi and Wijanarko [11]. This system monitors the environment for establishing a measurement of quality and sustainability for human life. The paper delves down into the sensor level of monitoring in order to develop a customizable system capable of hosting multiple sensor device configurations specific to the user’s intended need. Low Power Energy Aware Processing (LEAP) has been introduced by McIntire, Ho, Yip, Singh, Wu, and Kaiser as a combined hardware-software architecture to incorporate power awareness into task scheduling. Awareness is implemented by monitoring energy dissipation of the sensors and subsystem and scheduling the tasks between multiple processors to control power consumption [14].
The environmental monitor shown by Parra et al. is a good representation of the size, scope, and power management of our system, we would like to incorporate similar smart energy saving algorithms to more aspects than the sending of information. We built a system similar in intend and seek to add sensor power management and data security. Prauzek et al. energy harvesting sources, storage devices, and system topologies lay excellent groundwork for building a deployable environmental monitoring system. This paper will attempt to incorporate the intent of this paper into a physical embedded system. Hu’s techniques to control sampling intervals to save energy are useful for our system. We expand from this by applying various device on and off time to enhance the energy efficiency of our entire monitoring system. Instead of using measured environment as a factor to control sampling rate, energy storage will be focused upon. Prauzek, Kromer, Rodway, and Musilek’s introduced method of differential evolution of fuzzy controller is complex for or intended scope. However, we build an architecture that pulls from this concept by creating a forward-thinking scheduling logic with respect to energy and energy harvesting. Techniques by Engmann et al. shows excellent potential for energy management. The analysis was done on a network of nodes. We seek to incorporate these concepts to a single node and attached peripherals. The systems proposed by Rao et al. and Djajadi and Wijanarko provide excellent representation in scope, cost, and intent of our project. We will seek to incorporate technique introduced by the previous authors on our system as well as add a data security feature that would help secure the IoT enabled system.
Our introduced method builds upon the above works by approximating the stored energy remaining and energy harvesting availability. The approximations are inputs to a decision-making algorithm that will control system software and hardware features. This method will contrast LEAP architecture by utilizing a single processor on a single board. The solitary unit will be built around the Cortex-M4F powered Arduino-based Teensy 3.5 as it contains an integral SD card slot to accommodate data storage as well as plenty I/O pins for a multitude of sensor. The soft side of this architecture will continue with the LEAP concept and add status checks to energy storage and energy harvesting prior to task scheduling and incorporate these finding into the scheduling decision making.
Lastly, security of the system is considered. Specifically, the security of the collected data. We tested the impact of Cipher Block Chained (CBC) 128-bit Advanced Encryption Standard (AES) with Base64 encoding has on system power. AES encryption was selected as it has been shown to be successfully implemented on an Arduino-based board and had desirable characteristics such as low memory usage and an efficient use of time [15]. This allows an Arduino based system to add encryption and decryption without absorbing large amounts of memory that is crucial for the primary functions. The efficient use of time ensure that encryption also does not occupy a significant amount of time in place of the systems primary function as well.
In this paper we will introduce the COTS hardware that comprises our system and provide power analysis of these hardware. Then select system software features and their power consumptions are discussed as well. A logic architect is then proposed to manage the power of the overall system. Simulation results are then analyzed to compare the effectiveness of this power management. The implication of encryption is discussed last as an option for data security. Finally, conclusions are drawn based on the findings.

2. Materials and Methods

Since the composite system can consist of n device, each with their own in current drawn and voltage vn overall power can be easily summed by Formula (1). Further simplification can occur as all device on the system are connected to the same USB 5-volt rail; v1 = v2 = v3 = vn = vUSB = 5 V simplifies Equation (1) from power as a function of n-voltages and n-currents into Formula (2): a weighted function of current.
A power function representing the composite system of MCU and peripherals can be represented by Equation (1) for each device n, voltage vn and current in. Since every device in this system is supplied by the same USB 5-volt rail ergo v1 = v2 = v3 = vn = vUSB = 5 V. We can compare total power, Ptotal, as a function of current (2).
P t o t a l = v 1 i 1 + v 2 i 2 + v 3 i 3 + + v n i n ,
    P t o t a l = 5 v × ( i 1 + i 2 + i 3 + + i n ) ,
The MSP430F1611 used in the energy management application processor (EMAP) of the LEAP architecture provides power rail control that this Teensy 3.5 system lacks [14]. We rectify this by pairing output pins with discrete COTS MOSFETs, i.e. one transistor for each peripheral for maximal granularity. When used in the configuration displayed in Figure 1, the MCU can close and open the connection between the voltage rail and the peripheral device.
The FQP27P06 transistor selected for power gating has a few key characteristics, i.e. low drain-source voltage, low on resistance at source-gate voltage of 4.5 V–5 V [17]. These are key characteristic as many peripherals used have a 3.3 V–5.0 V supply voltage requirement and we seek to avoid taking away minimal amount of supply voltage headroom from the peripheral devices.
The Serial Peripheral Interface (SPI), universal asynchronous receiver-transmitter (UART), an Inter-Integrated Circuit (I2C) communication protocols are commonly used to communicate between the MCU and peripheral sensor. However, these communication links are not always used and can be shut down until necessary. By either terminating each protocol individually, or altogether we study the overall impact these protocols have on total system power. To isolate this impact, the test was run without peripheral devices and without sending data via the communication.
The merging of these hardware and software techniques occurs via programmed logic executed by the system on-board MCU. Environmental and stored battery energy conditions are observed and then checked against power thresholds to determine an appropriate task scheduling profile as shown in Figure 2. These profile and thresholds are malleable and defined by the user; thus, it should be noted that the performance is highly dependent on the designers’ thresholds and the current status of the environment.

2.1. Hardware

Two peripheral sensors were chosen as subject to study the impeding effects of our selected MOSFET in the power gating configuration. With respect to the overall system Table 1 shows identical voltage and current measures for “ON”/connect and “OFF”/disconnected conditions by means of short/open circuit or transistor operation. Note that the 54 mA observed in the off/disconnected states reflect the idle current of the MCU.
These observations show that power gating our peripherals are as effective as physically opening or shorting the connections to the supply voltage rail. Further testing on other devices yielded similar patterns. Implementing this feature only occupied a single digital pin and negligible amount of memory. Thus, power gating peripherals on this microcontroller system yield effective power control of attached peripheral sensors.
An issue worth noting is the anomalies and cautions observed when we tested the Global Positioning System (GPS) device and dust sensor. The GPS when shut off via the method above still showed 0.40 V at the device supply. This may be due to its internal regulation. Techniques to rectify this are not explored. The dust sensor datasheet indicated that a 4.5 V–5.5 V input voltage is required for operation [18,19]. The MOSFET’s drain source voltage drop from the systems 5 V supply rail to the peripheral device only has a maximum allowance of 0.5 V before the input voltage to the dust sensor falls below specifcation. In our test 4.84 V was measured at the device voltage input as shown in Table 2.
Further cautions that we observed do not impact hardware compatibility but instead impact energy efficiency. GPS have satellite lock on times that can exceed minutes and are dependent on satellite availability and reliable communications. Another sensor we tested was a dust sensor [20] that contained optical element. We observed that this sensor needed more than ten minutes of idle time before readings stabilized. This is due to calibration of optical component critical in the dust measuring process. Devices whose performance are initial time-variant must be accounted for. A power gated cycle that is larger than each sensor predatory period is require for meaningful data collection. Failure to do so will lead to negligent data collection and thus yield-less power consumption.

2.2. Software

Except for I2C, we observe a reduction in current drawn when a communication protocol is terminated by coded function calls. See Table 3.
Multiple communication buses exist but the numbers included are for an absolute shutdown of all UART, or SPI, or I2C communications. A total of 7 mA (12.96%) of current can be reduced by shutting down communication protocols when not in use. When needed again these communications can be start back up without the need of a reboot. Thus, this method will not impede normal operating behaviors when used as intended.
Matching a feature of the LEAP architecture, clock speed reduction is also a feature that can be used to manage power consumption. Observing idle current drawn across multiple clock speed yields Figure 3.
When paired with a real time clock (RTC) hibernation cycles can be scheduled during no sampling periods. The most significant reduction of current drawn is 53.81mA, as shown in Table 4.
Encryption and decryption were applied to raw text files saved on an SD card. The procedure started with a raw data text file to be processed and saved into an encrypted data text file. Decryption is then applied and saved as a new decrypted text file. When deemed successful, the raw data and decrypted text files are identical in content. Using an open source software library [21] and manipulating variables such as system clock speed, size of text file, encryption key length, and initialization vector length; we were able to observe the resulting changes in task runtime and overall system current drawn. In order to isolate the impact of this security feature from other techniques and devices discussed earlier; no power manipulating techniques were conducted other than those required to test encryption and decryption. No additional hardware was added to the composite system other than those required to test encryption and decryption.

3. Results

The resulting data collected is analyzed in a theoretical application and with respect to encryption. The impact of each feature is then elaborated into applicable information for designers and any caveats to be considered are also discussed.

3.1. Theoretical Application
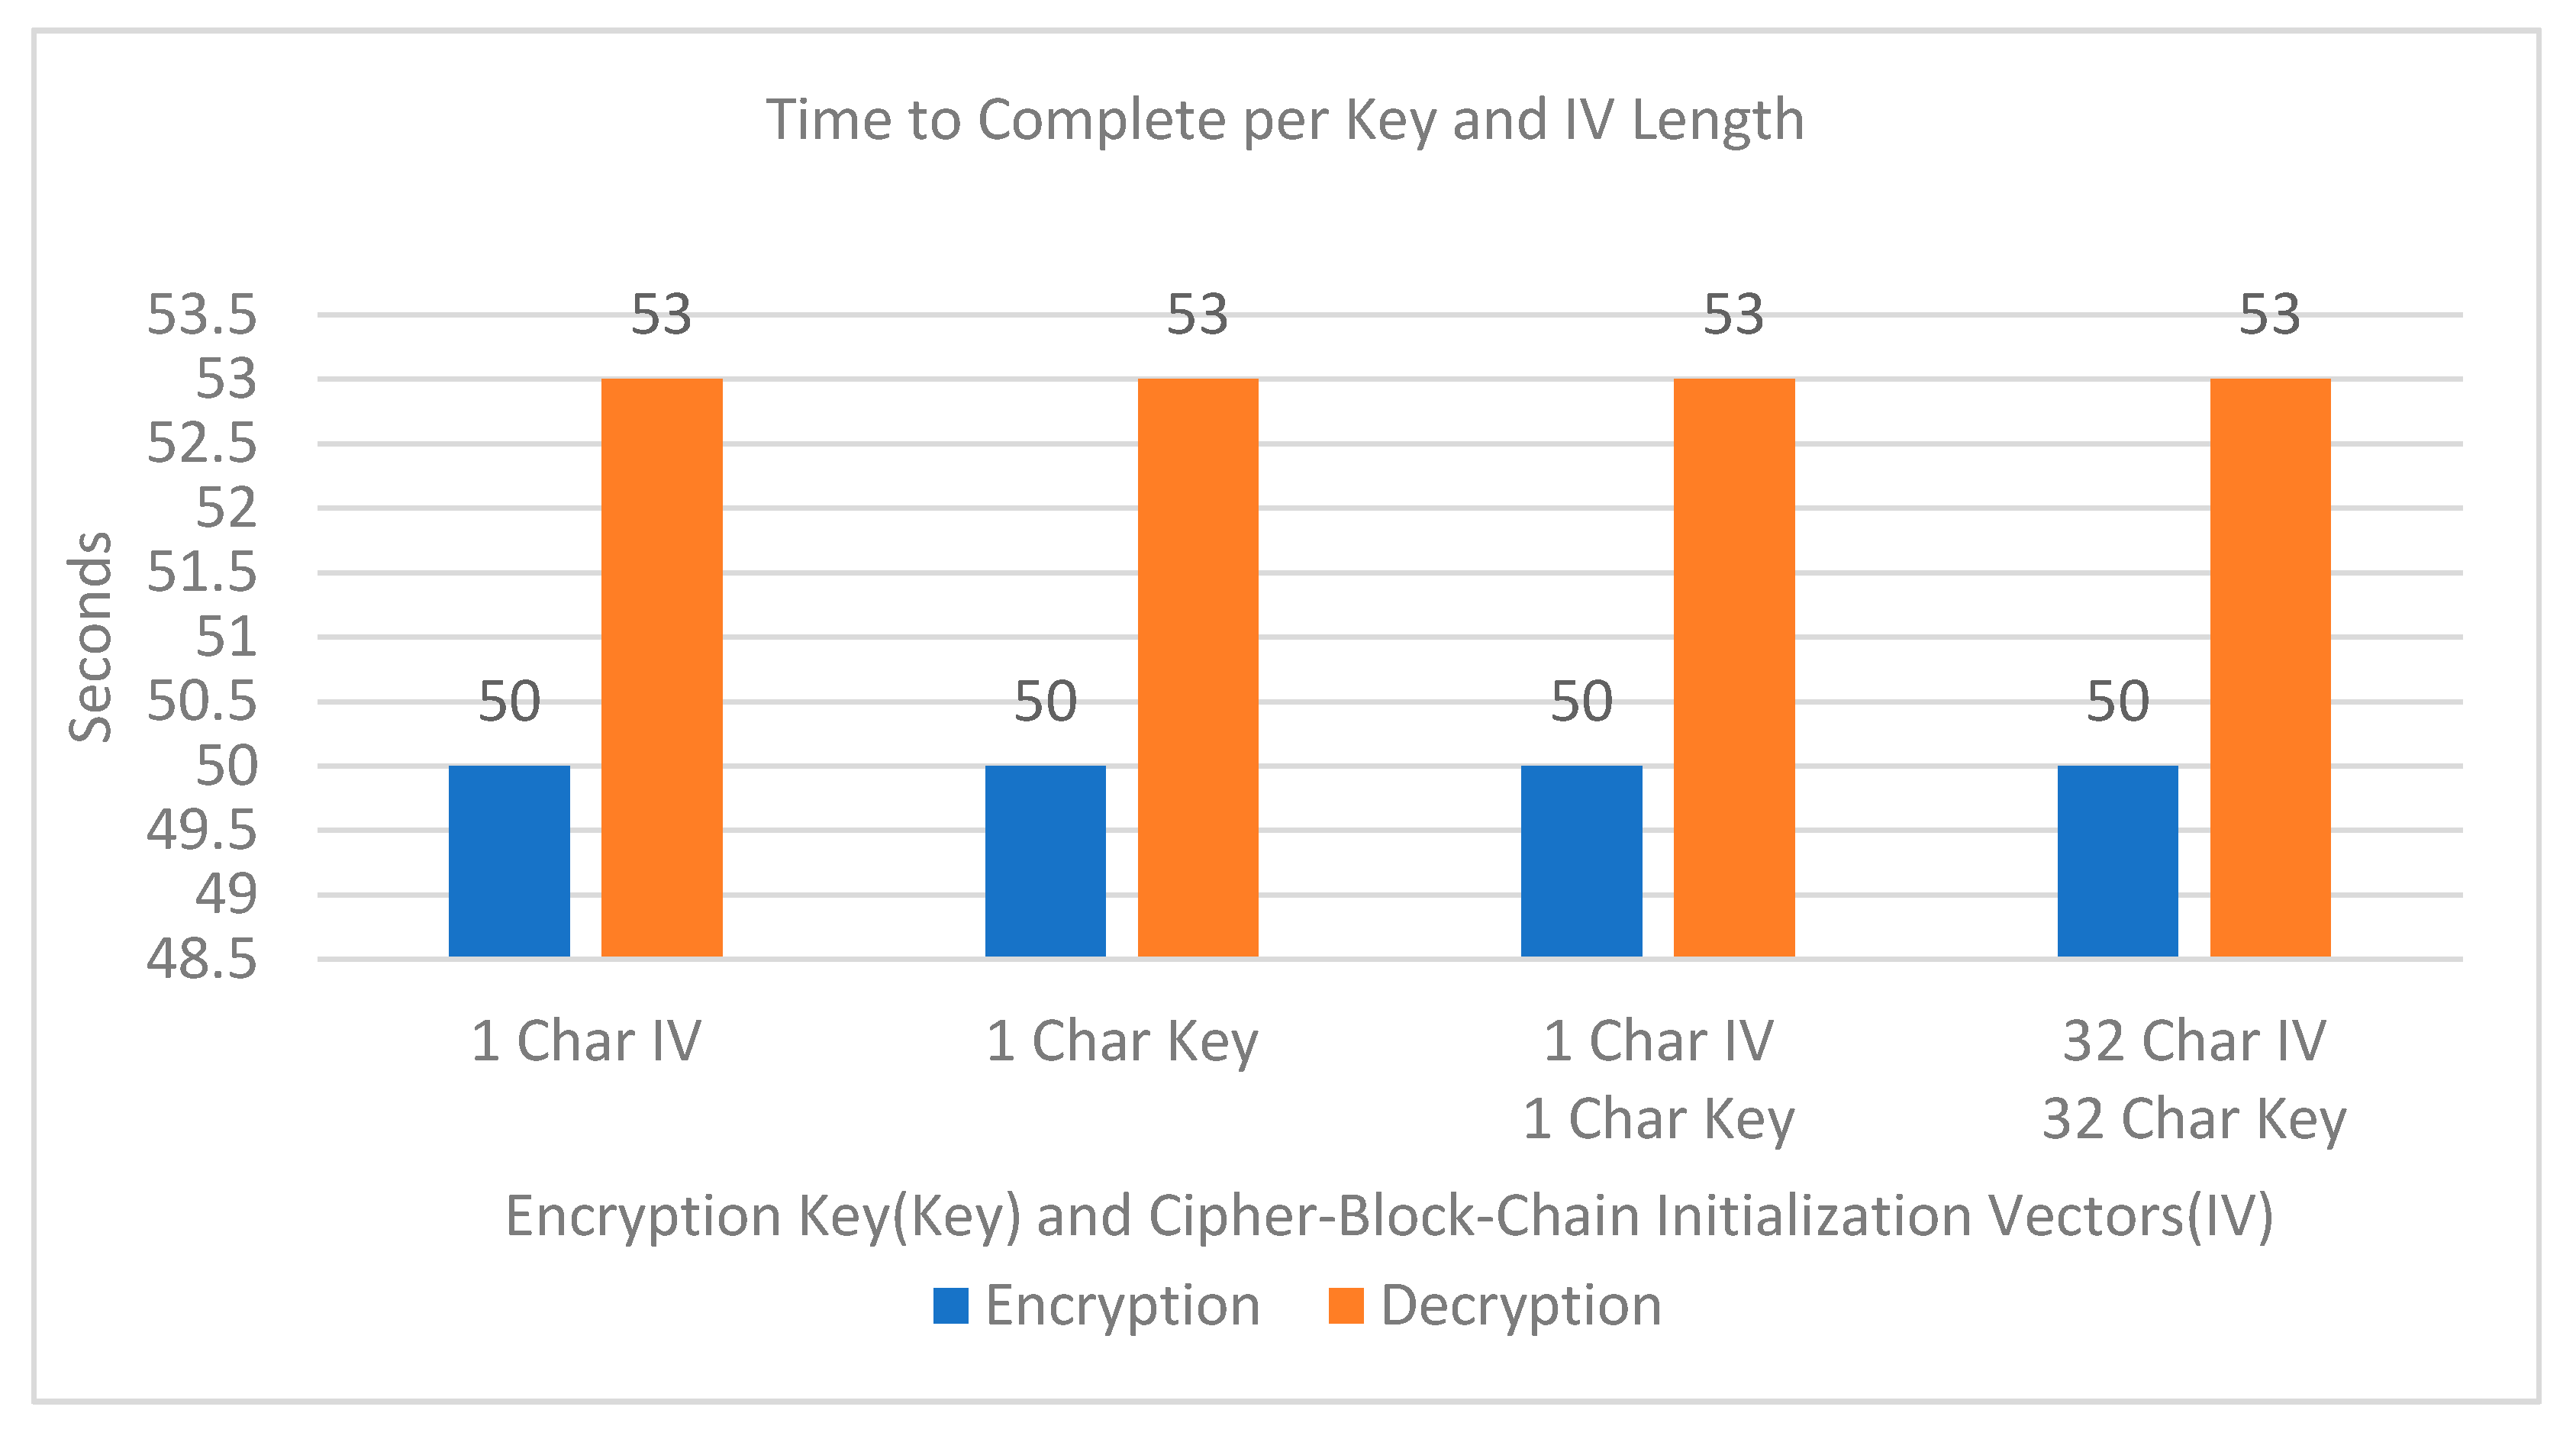
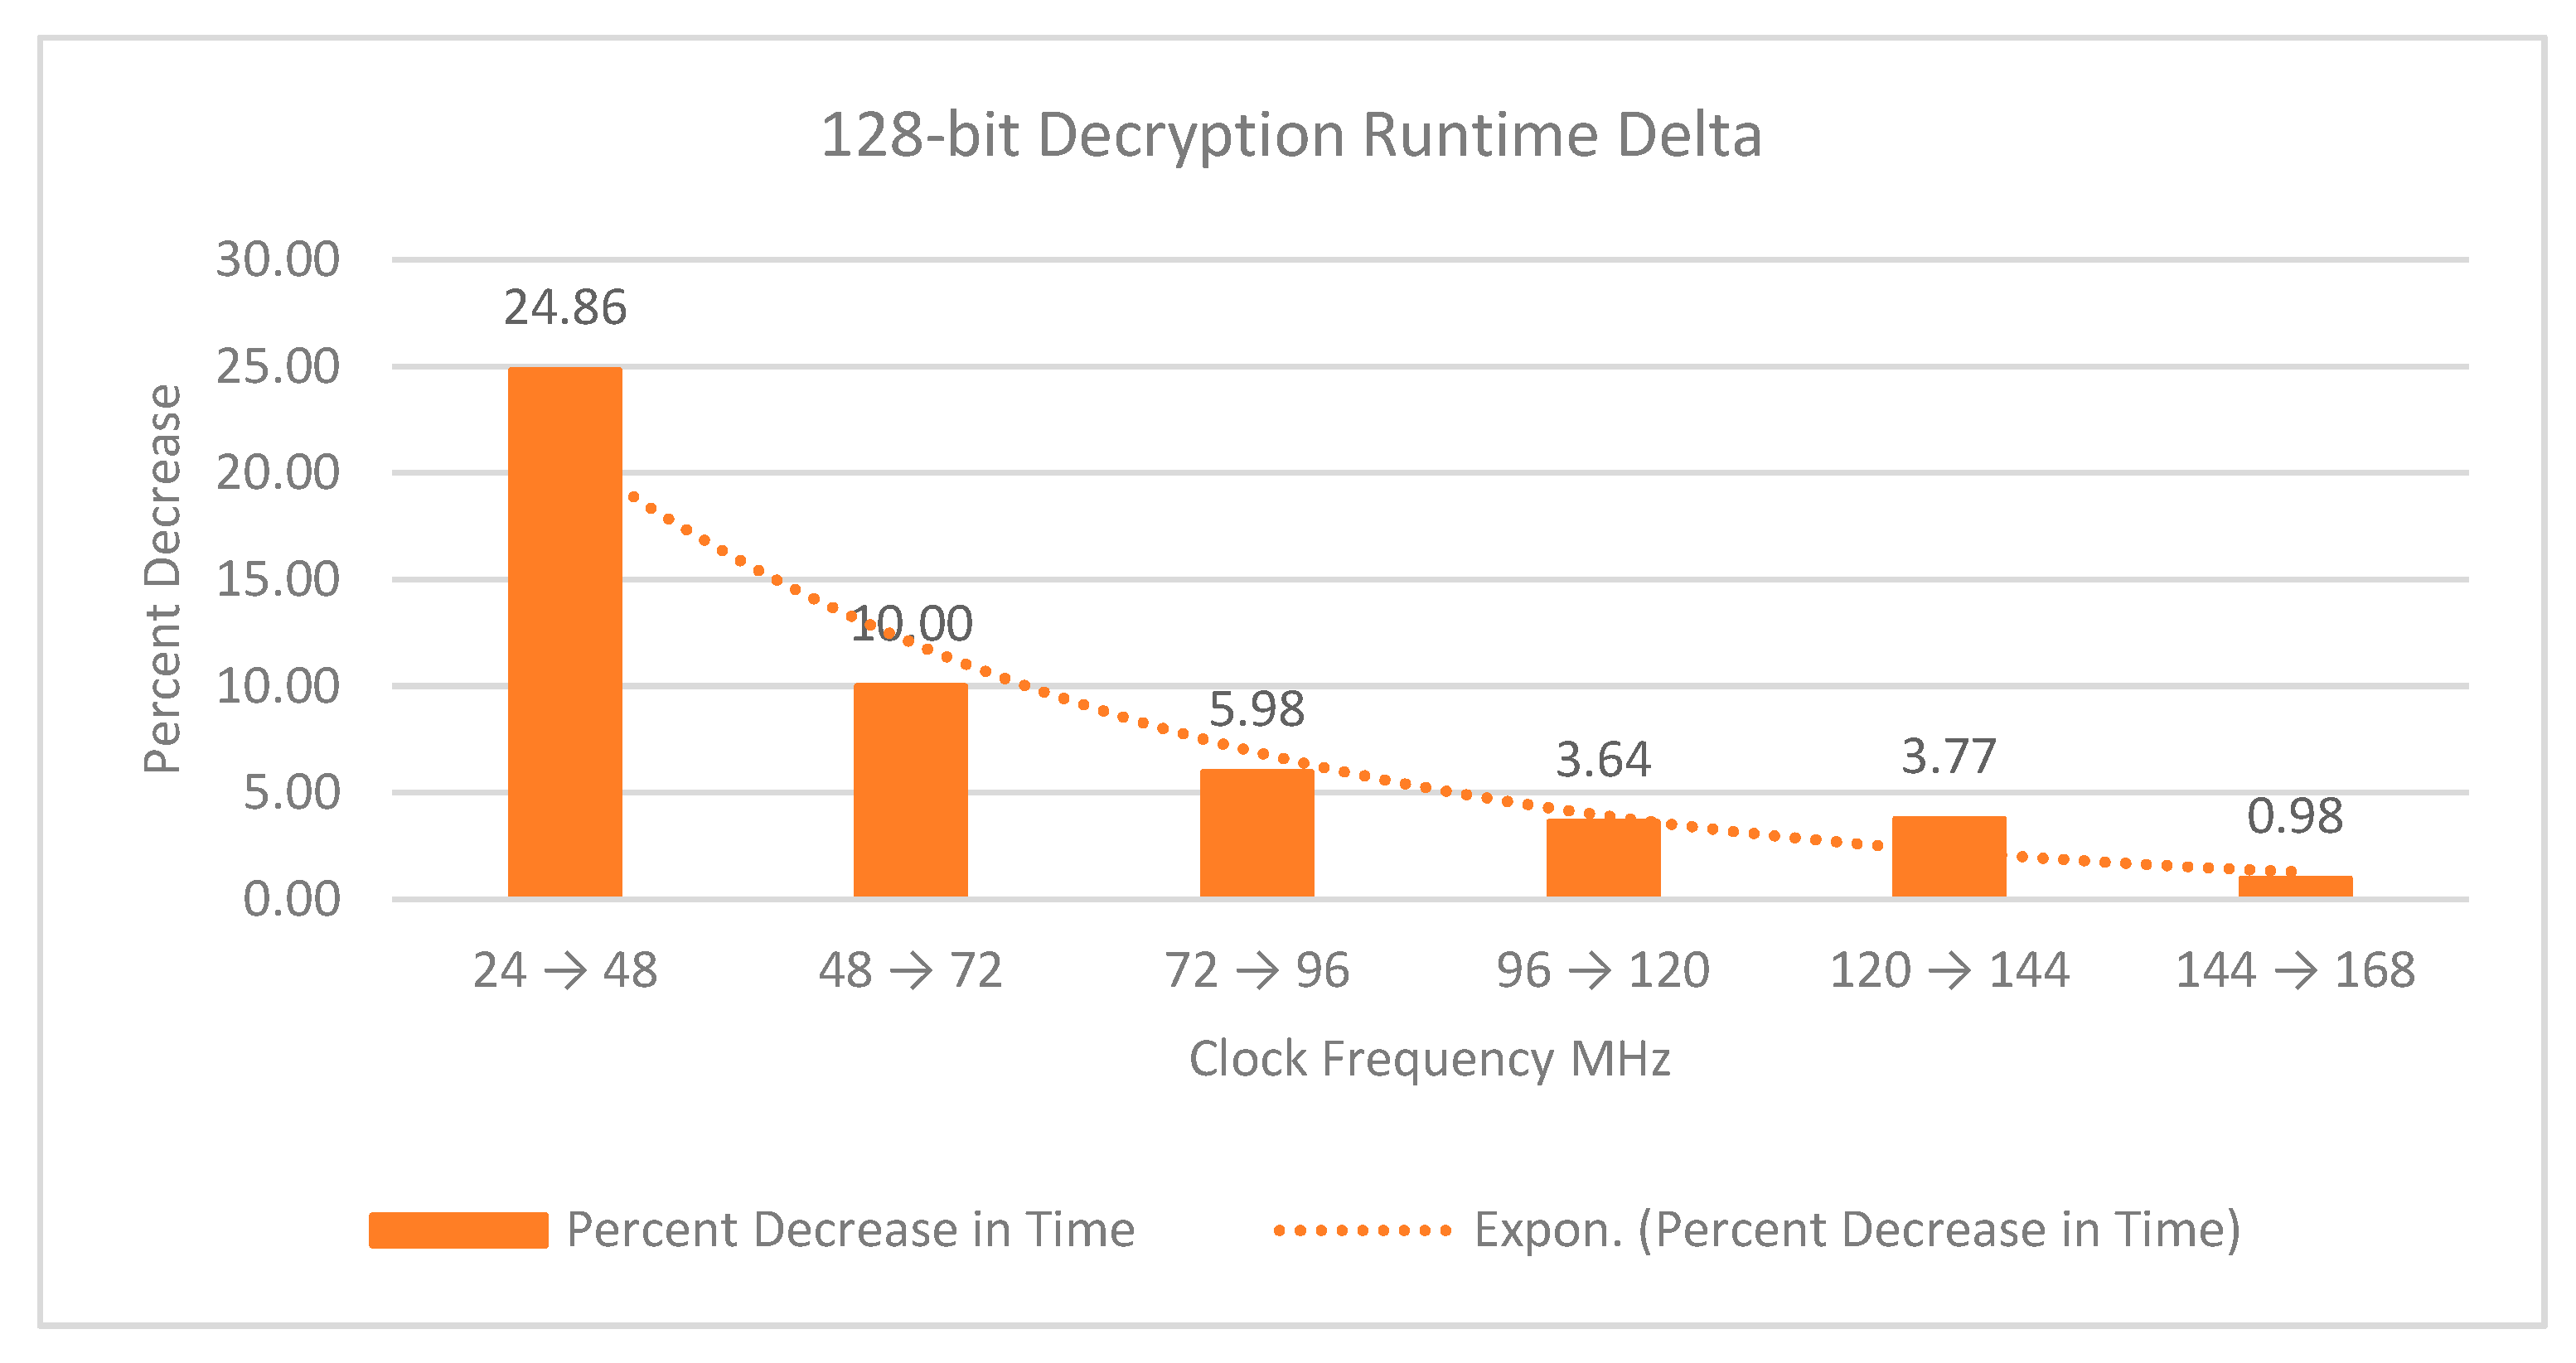
In order to compare this architectures performance with LEAP a mockup scenario is run. Supplied by a 1000 mA-hour stored energy, loaded with environmental sensors, and tasked to sample the environment hourly we compare the amount of remaining stored energy over the number of sampled taken. The same method used in formulas (1) and (2) can be applied to charge in Equation (3):
Total system charge Q consumed per device an overtime tn:
Q t o t a l = a 1 t 1 + a 2 t 2 + a 3 t 3 + .     .     . + a n t n ,
The simulation used will track the overall power used over set time interval. The number of samples acquired per run is known and is also tracked with time. The composite system’s energy consumption is then computed and reduced against the remaining available stored energy plus energy injected into storage via harvesting. Each simulation run is profiled to act in a manner representative of a system running in an unoptimized (default) manner, in a LEAP like manner, and in the manner of our power aware architecture.
The simulated results comparing our system and the LEAP system are graphed in Figure 4. An unoptimized system is included to represent one that continuously runs and contains no management or logic that can control power consumption based on system power or stored energy data.
In Figure 4 it is clear that both our proposed and LEAP systems fare much better off than an ‘dumb’ system. Furthermore, our system makes critical decisions at the 26th and 42nd data point. At these points our system decides to terminate the use of the most power-hungry devices. These decision and actions lead to our system to complete 42 (84%) more sampling runs that the LEAP system. However, these decisions are not without drawbacks. The user must acknowledge prior to deployment is that sample diversity is sacrificed for temporal quantity.

3.2. Security

The first set of performance data collected explored the impact of system clock frequency on the task runtime and system current drawn. For consistency these results only include data for a text file size of 1024 Kilobytes. Figure 5 below illustrates graphs that incorporate runtime, current and power for each clock speed. It can be observed from Figure 5a that the benefit of shorter runtime by running the system clock frequency started to diminish from a 96 MHz onwards, yielding minimal runtime saving. The maximum runtime saving is achieved from 24 MHz to 48 MHz. Figure 5b shows the approximately linear relation in the current drawn by the system with various frequencies. Figure 5c shows the total energy consumed under each frequency setting, which again shows linear relationship. Based on these data, user can select the desired runtime to encrypt sensor data based on the absolute performance required, by prioritizing either on minimal run-time or energy consumption.
In order to understand these changes more; we analyze the relative change, in percentage, that occurs when incrementing the clock frequency by 24 MHz, as shown in Figure 6. Further analysis on the marginal runtime change in Figure 6a, and the marginal energy consumption change in Figure 6b, if a user changes from a lower clock frequency to a higher frequency. Figure 6a shows the reduction in runtime is essentially an exponential function, rendering the significant runtime reduction skewed towards the lowest frequency. Figure 6b shows the energy consumption is basically incrementally linear but have different fluctuations (3% to 7%) with each frequency step change. Patterns seen in Figure 6 show the diminishing returns for runtime reduction with each increment but a consistent, incremental relation in term of energy consumption with respect to clock frequency change.
Based on these trends the increase in energy of increasing clock speed averages around 5.76% for each iteration while the most varying factor is runtime. This analysis allows us to easily construct a cost-benefit analysis of runtime vs power to be used for designers or in decision making systems like the power aware logic architecture described earlier. It should be noted that data for decryption was also collected and similar trends were observed as shown in Appendix A.
Further design considerations must be taken account when looking at text file size to be encrypted and overall throughput in bye per second that this system can generate. Our findings in Figure 7 show that with varying file size the bytes per second throughput remained constant which implies that a doubling in file size lead to a near doubling in encryption and decryption time. This analysis allows designers and decision-making algorithms to estimate power consumption as a function of text file size as the throughput remained consistent with each doubling of the text file size. We also note that the system’s throughput peaks at about 18–19 kiloBytes per second. This indicated a saturation of the data lines used to process the encryption and decryption. Our initial assumption is a saturation of the SPI bus data rate, however further testing is needed to confirm this.
Our attempts to study the performance change by varying the encryption key and/or the initialization vector (IV) yielded no significant change. Thus, further scrutinous testing needs to be done. Until then we accept that the complexity (by character length) of the user specified key or IV has no noticeable impact on this system. Figure 8 shows completion time of encrypting and decrypting of a 512 KB ay 120 MHz with key and IV lengths tested for character length of 1 and character length of 32.

4. Discussion

Controlling hardware connected devices and software features of a microcontroller based embedded system in the manner introduced in this paper can extent the data collection uptime of a deployed system powered by a finite amount of stored battery energy. This sensor system does so by analyzing potential energy harvesting and current stored energy to decide future task scheduling. The temporal quantity of the data collected can be significantly increased at the cost of sample diversity. There are several considerations that must be taken in order to maximize the effectiveness of this system.
The addition encryption allows this remote device to securely transmit and offload data to another device. Designer can use runtime and power trends to tune desirable energy consumption characteristics of the system. Furthermore, encryption and decryption based on data file size shows constant throughput trends; thus, energy consumption can be consistently predicted prior to execution. These trends can allow designers and decision-making system budget system power as a function of energy consumed by each hardware, software, and security feature.
We would like to see future work developed in adding more complex and diverse energy harvesting system to further extend operating lifetime similar to those introduced by Engmann et al. [12]. Extending the application of these sensors and methods onto a single board computer (SBC) running a small real time operating system for power analysis and comparison is desired. Algorithms too complex for an MCU can be implemented on SBCs, such as predictive techniques introduced by Preauzek, Kromer, Rodway, and Musilek [10]. Further, this system lacks the depth of a network system and thus Internet of Things (IoT) and Wireless Sensor Network (WSN) communication concepts can be applied to this system in detail.
Concluding this paper, we hope to establish a foundation integrating embedded hardware, energy harvesting techniques, power monitoring and controlling architecture, and security for a wireless sensor system deployed in a remote location with extreme temperature such as the Salton Sea.

Author Contributions

Conceptualization, K.D. and Y.-K.T.; methodology, K.D. and Y.-K.T.; software, K.D.; validation, K.D. and Y.-K.T.; formal analysis, K.D. and Y.-K.T.; investigation, K.D. and Y.-K.T.; resources, Y.-K.T.; data curation, K.D.; writing—original draft preparation, K.D. and Y.-K.T.; writing—review and editing, K.D. and Y.-K.T.; visualization, K.D.; supervision, Y.-K.T.; project administration, Y.-K.T.; funding acquisition, Y.-K.T. All authors have read and agreed to the published version of the manuscript.

Funding

This research was supported by Sustainable Energy Center, San Diego State University Imperial Valley, and San Diego State University UGP funds.

Acknowledgments

Thank you to Sophia Chanel for being my persistent youthful energy and forcing a healthy work life balance by letting me know when to take breaks. Thank you Master Oogway Jr. for paving the tempo of this journey. This constantly reminded me to live in the moment and humble myself when plans get hectic.

Conflicts of Interest

The authors declare no conflict of interest.

Appendix A

Performance of Decrypting 1024 KB in pair with the encryption performance discussed.
Figure A1. Time to complete decryption with various clock frequency.
Electronics 09 00544 g0a1
Figure A2. Current drawn to decrypt 1024KB text file with various clock frequency.
Electronics 09 00544 g0a2
Figure A3. Energy consumed to complete decryption with various clock frequency.
Electronics 09 00544 g0a3
Figure A4. Relative change in decryption run time with respect to clock frequency change.
Electronics 09 00544 g0a4
Figure A5. Relative change in system power during decryption with respect to clock frequency change.
Electronics 09 00544 g0a5

References

  1. State of California Department of Water Resources, California Natural Resources Agency, California Department of Fish and Wildlife, Salton Sea Management Program Phase 1: 10-Year Plan. Available online: http://www.socalwaterdialogue.org/calendar/papers/2017/June/3_SaltonSeaManagementProgram.pdf (accessed on 21 March 2020).
  2. Frie, A.L.; Dingle, J.H.; Ying, S.C.; Bahreini, R. The effect of a receding saline Lake (the Salton Sea) on airborne particulate matter composition. Environ. Sci. Technol. 2017, 51, 8283–8292. [Google Scholar] [CrossRef] [PubMed]
  3. Bradley, T.; Yanega, G. The Ecological Future of the Salton Sea. Available online: https://pacinst.org/publication/ecology-and-future-salton-sea/ (accessed on 21 March 2020).
  4. Lawrence, D.K. Toxic Blowing Dust and Mounting Social Harms: Understanding Slow Violence at the Salton Sea as a State-Corporate Crime and Environmental Injustice. Northern Arizona University M.S. thesis 2019. [Google Scholar]
  5. Randy. Home > Blog > The Wandering Minds > How Hot Is Salton Sea? Available online: https://www.saltonseawalk.com/how-hot-is-salton-sea/ (accessed on 21 March 2020).
  6. Wendt, Z. Introducing the Top 10 Dev Boards of 2018. Available online: https://www.arrow.com/en/research-and-events/videos/the-top-10-development-platforms-dev-kits-2018 (accessed on 4 March 2019).
  7. Parra, L.; Sendra, S.; García, L.; Lloret, J. Design and deployment of low-cost sensors for monitoring the water quality and fish behavior in aquaculture tanks during the feeding process. Sensors 2018, 18, 750. [Google Scholar] [CrossRef] [Green Version]
  8. Hu, S. Dynamic monitoring based on wireless sensor networks of IoT. In Proceedings of the 2015 International Conference on Logistics, Informatics and Service Sciences (LISS), Barcelona, Spain, 27–29 July 2015. [Google Scholar]
  9. Prauzek, M.; Konecny, J.; Borova, M.; Janosova, K.; Hlavica, J.; Musilek, P. Energy Harvesting Sources, Storage Devices and System Topologies for Environmental Wireless Sensor Networks: A Review. Sensors 2018, 18, 2446. [Google Scholar] [CrossRef] [PubMed] [Green Version]
  10. Prauzek, M.; Krömer, P.; Rodway, J.; Musilek, P. Differential evolution of fuzzy controller for environmentally-powered wireless sensors. Appl. Soft Comput. 2016, 48, 193–206. [Google Scholar] [CrossRef]
  11. Djajadi, A.; Wijanarko, M. Ambient environmental quality monitoring using IoT sensor network. Internetworking Indones. J. 2016, 8, 41–47. [Google Scholar]
  12. Engmann, F.; Katsriku, F.A.; Abdulai, J.D.; Adu-Manu, K.S.; Banaseka, F.K. Prolonging the lifetime of wireless sensor networks: A review of current techniques. Wirel. Commun. Mob. Comput. 2018. [CrossRef] [Green Version]
  13. Rao, B.S.; Rao, K.S.; Ome, N. Internet of Things (IoT) based weather monitoring system. Int. J. Adv. Res. Comput. Commun. Eng. 2016, 5, 312–319. [Google Scholar]
  14. McIntire, D.; Ho, K.; Yip, B.; Sing, A.; Wu, W.; Kaiser, J.W. The Low Power Energy Aware Processing (LEAP) Embedded Networked Sensor System’. In Proceedings of the 5th International Conference on Information Processing in Sensor Networks, Nashville, TN, USA, 19–21 April 2006. [Google Scholar]
  15. Ismat, T. Comparative Analysis of AES Algorithms and Implementation of AES in Arduino Dhaka. Available online: http://dspace.bracu.ac.bd/xmlui/handle/10361/4889 (accessed on 21 March 2020).
  16. Diaz, K.; Teh, Y.K. Power Optimization of Arduino-Based Sensor System for Salton Sea Environmental Monitoring. In Proceedings of the 2019 IEEE 62nd International Midwest Symposium on Circuits and Systems (MWSCAS), Dallas, TX, USA, 4–7 August 2019. [Google Scholar]
  17. ON Semiconductor. FQP27P06 60 V P-Channel MOSFET. Available online: https://www.onsemi.com/pub/Collateral/FQP27P06-D.PDF (accessed on 21 March 2020).
  18. GPS Schematic. Available online: http://wiki.seeedstudio.com/Grove-GPS/#version (accessed on 4 March 2020).
  19. Ultra High Sensitivity and Low Power GPS Receiver Module. Available online: https://www.mouser.com/datasheet/2/744/Seeed_113020003-1217502.pdf (accessed on 21 March 2020).
  20. Shinyei. Particle Sensor Model PPD42NS. Available online: https://www.shinyei.co.jp/stc/eng/products/optical/ppd42nj.html (accessed on 21 March 2020).
  21. Matej Sychra, Thinx-Aies-Lib. GitHub Repository. Available online: https://github.com/suculent/thinx-aes-lib/tree/master (accessed on 21 March 2020).
Figure 1. Power gated peripherals controlled by MCU [16].
Electronics 09 00544 g001
Figure 2. Reduction in clock frequency results in a reduction in current drawn [16].
Electronics 09 00544 g002
Figure 3. System Power Aware Logic Flow [16].
Electronics 09 00544 g003
Figure 4. Power aware optimization runs the most data collection cycles [16].
Electronics 09 00544 g004
Figure 5. (a) Runtime in seconds for each clock frequency scenario shows runtime diminishing returns per increase in clock speed; (b) each current drawn in amps shows a plateauing trend for each increment in clock frequency; (c) the resulting energy consumed in joules or each increment in clock frequency shows a diminishing growth.
Electronics 09 00544 g005
Figure 6. Relative decrease in runtime and increase in power for each iteration of increasing clock frequency: (a) percent decrease in runtime shows diminishing returns as further increases in clock frequency cease to yield significant reduction in runtimes; (b) percent increase in power shows consistent change. A preference of operating at 72 MHZ and/or 144 MHZ is developed as these frequencies yield the lowest relative increase in energy over the next slower frequency.
Electronics 09 00544 g006
Figure 7. Performance with varying file size yields predictable outcomes: (a) a doubling in file size consistently yielded a near doubling in runtime; (b) bytes per second remains near constant for all file size tests with exception of smallest file size.
Electronics 09 00544 g007
Figure 8. Time to complete encryption/decryption remained the same regardless of key or IV length.
Electronics 09 00544 g008
Table 1. Selected voltage characteristics of GPS and dust sensors [16].
ConditionE-1612-UB GPSPPD42NS Dust Sensor
Direct Connection93 mA–103 mA134 mA
MOS-ON Connect93 mA–103 mA134 mA
Direct Disconnected54 mA Integrally regulated54 mA
MOS-OFF Disconnected54 mA54 mA
Table 2. Selected voltage characteristics of GPS and dust sensors [16].
Vin = 5 VE-1612-UB GPSPPD42NS Dust Sensor
VDD, NMOS-ON4.94 V4.84 V
VDD, NMOS-OFF0.70 V0.00 V
Specified Voltage Input Range3.3 V [18,19]
Integrally regulated
4.5 V–5.5 V [20]
Table 3. Terminating Communication Protocol [UART, SPI, I2C] [16].
CommunicationLiveStoppedDifference
UART54 mA53 mA−1 mA
SPI54 mA48 mA−6 mA
I2C54 mA48 mA0 mA
Total54 mA47 mA−7 mA
Table 4. Selected voltage characteristics of GPS and dust sensors [16].
StateCurrent DrawnDifference
Awake54 mAN/A
Sleep2 mA−52 mA
Deep Sleep0.370 mA−53.63 mA
Hibernate0.190 mA−53.81 mA

