Article

Robustness of Rhythmic-Based Dynamic Hand Gesture with Surface Electromyography (sEMG) for Authentication

Graduate School of Information Science and Technology, Osaka University, Osaka 565-0871, Japan
*
Author to whom correspondence should be addressed.
Electronics 2020, 9(12), 2143; https://doi.org/10.3390/electronics9122143
Submission received: 30 October 2020 / Revised: 9 December 2020 / Accepted: 11 December 2020 / Published: 14 December 2020
(This article belongs to the Special Issue Recent Advances in Cryptography and Network Security)

Abstract

:
Authentication has three basic factors—knowledge, ownership, and inherence. Biometrics is considered as the inherence factor and is widely used for authentication due to its conveniences. Biometrics consists of static biometrics (physical characteristics) and dynamic biometrics (behavioral). There is a trade-off between robustness and security. Static biometrics, such as fingerprint and face recognition, are often reliable as they are known to be more robust, but once stolen, it is difficult to reset. On the other hand, dynamic biometrics are usually considered to be more secure due to the constant changes in behavior but at the cost of robustness. In this paper, we proposed a multi-factor authentication—rhythmic-based dynamic hand gesture, where the rhythmic pattern is the knowledge factor and the gesture behavior is the inherence factor, and we evaluate the robustness of the proposed method. Our proposal can be easily applied with other input methods because rhythmic pattern can be observed, such as during typing. It is also expected to improve the robustness of the gesture behavior as the rhythmic pattern acts as a symbolic cue for the gesture. The results shown that our method is able to authenticate a genuine user at the highest accuracy of 0.9301 ± 0.0280 and, also, when being mimicked by impostors, the false acceptance rate (FAR) is as low as 0.1038 ± 0.0179.

1. Introduction

Authentication is the process of verifying the identity of an individual. An authentication system has to be usable (able to accept genuine user) and secure (able to reject impostors) [1]. For an authentication system to be usable, the method of authentication has to be robust (should be consistent throughout different conditions) and convenient (available and easy to use). To create a perfect authentication system is near impossible because there are trade-offs between the usability and the security. For example, fingerprint authentication has high usability due to its convenience and ability to correctly recognize the user most of the time; however, if the fingerprint is stolen, it can also be used by other impostors to be recognized as the genuine user without fail, thus compromising the security. But, by combining different authentication methods together, the usability can be maintained, while improving the security at the same. This is also known as multi-factor authentication. And to improve the convenience and security, biometrics should be recommended to be applied in part of the multi-factor authentication.
There are three basic factors in authentication: knowledge factor, ownership factor, and inherence factor [2,3,4]. Knowledge factor is something that the user knows (e.g., password or PIN); ownership factor is something that the user has (e.g., ID card or key); inherence factor is something that the user is or does (e.g., fingerprint or behavior). Most knowledge and ownership factor-based authentication methods are categorized as traditional authentication [5], whereas inherence factor-based methods are known as biometric authentication. Biometrics are the measurements of a human’s physical and behavioral characteristics.
Both traditional and biometric authentications are currently being used in digital security systems, but there is no doubt that biometric authentications have been gaining popularity in its implementation in mobile devices [5], electronic banking and payment [6,7], and biometric passport [8,9].
Traditional authentications, such as password-based, token-based, and key-based, are still commonly used due to their conveniences and familiarity of use.
  • Password-based—Convenient due to its availability (e.g., keyboard, touchscreen) but can sometimes be difficult to memorize and easily attacked by impostors.
  • Token-based—It is unique and changes over time, at the same time making it inconvenient as it can only be used once and requires new access the next time.
  • Key-based—Unlike token-based, it does not change; and unlike password, it does not require memorization. But, it is inconvenient as it needs to be carried around either in physical or digital form.
Biometric authentication methods, as compared to traditional authentication methods, is much more convenient since it is something that is always on the user. Biometrics can be broken down into two main categories-static biometrics (something that the user is) and dynamic biometrics (something that the user does).
  • Static biometrics—Something that is unique on a person, i.e., fingerprint, iris, etc. It is robust, convenient, and require no memorization. But, once it is stolen, it cannot be easily reset.
  • Dynamic biometrics—Person’s behavior, gait, gesture, etc. May require some memorization but after some repetitions and getting used to it, it can be embedded in the muscle memory [10]. It is considered to be less robust as it changes over time depending on the person’s behavior, but it can be an advantage as it can be difficult for impostors to mimic.
Based on the aforementioned, every authentication method has its advantages and disadvantages. Therefore, multi-factor authentication is used to improve the security. Multi-factor authentication is the combination of two or more factors in authentication. Examples of multi-factor authentications are password-token-based authentication (knowledge and ownership) [4,11], keystroke dynamics (knowledge and inherence) [12,13], etc. To increase conveniences, multi-factor authentication today usually incorporates inherence factor as it is something that always readily available for the user as it is part of the user or what the user does. And within the inherence factor, static biometrics are most likely to be favorable due to its robustness over that of dynamic biometrics. But, this robustness can be a double-edged sword because, as mentioned before, once static biometrics information is stolen, it is difficult to reset, thus making the multi-factor authentication less secure since the false acceptance rate (FAR) of a stolen static biometrics is closed to 100% [14].
In this paper, we proposed rhythmic-based dynamic hand gesture using surface electromyography (sEMG). It is a combination of knowledge factor (rhythm) and inherence factor (gesture behavior). This method can be easily performed anywhere, physically hidden, and difficult to steal or mimic due to difference in behavior. But, because of the changes in dynamic gesture due to time, environment, etc., it could have a low degree of robustness. Thus, in this paper, we will be evaluating the robustness of rhythmic-based dynamic hand gesture in different scenarios, over a period of time, and on gesture mimicking.

2. Methodology

2.1. Equipment and Technology

EMG is a technique for evaluating skeletal muscle activity. Our method of producing rhythmic pattern is by contracting and relaxing the forearm muscle, thus EMG is suitable technique as it can easily pick up the changes in the muscular activity during the performace of the rhythmic hand gesture. The equipment used for our experiment is an sEMG wearable device—Myo Armband [15]. The Myo Armband consists of eight EMG sensors circulating around a flexible band. The advantages of this device over traditional EMG device is that it uses dry electrode as opposed to wet electrode or needle electrode, which can be invasive [16] or cause skin irritation [17], and it also requires less preparation as compared to the others [18]. Due to the Myo Armband wearability, it can be easily strapped onto the forearm, and vice versa. The Myo Armband sensor is only capable of measuring muscular activity at a sampling frequency of 200 Hz, which is considered low [19,20]. But, due to the simplicity of the gestures performed for our experiment, the sampling frequency of the Myo Armband has shown to be sufficient. As compared to the camera method of tracking hand gesture, sEMG has quite a few advantages over it. First, a camera has a viewing limitation—this can be the field of view angle and also depth view. It also has difficulty in distinguishing each finger when they are being stacked together or behind one another, perpendicular from the view point of the camera [21]. Time-sequential EMG signal is two-dimensional (1D-signal and time), whereas time-sequential image (x-axis, y-axis, and time) is three-dimensional or four-dimensional (if 3D sensor is used that includes z-axis); thus, EMG signal processing may require less computational power as compared to that of image processing. And since sEMG is a wearable device, it is much more convenient to be performed anywhere and can be physically hidden while performing the gesture.
As for data processing and analysis, Python programming language, signal processing, and neural network has been used. The neural network used for our data analysis is TensorFlow Keras.

2.2. Comparison with Other Biometrics Modalities
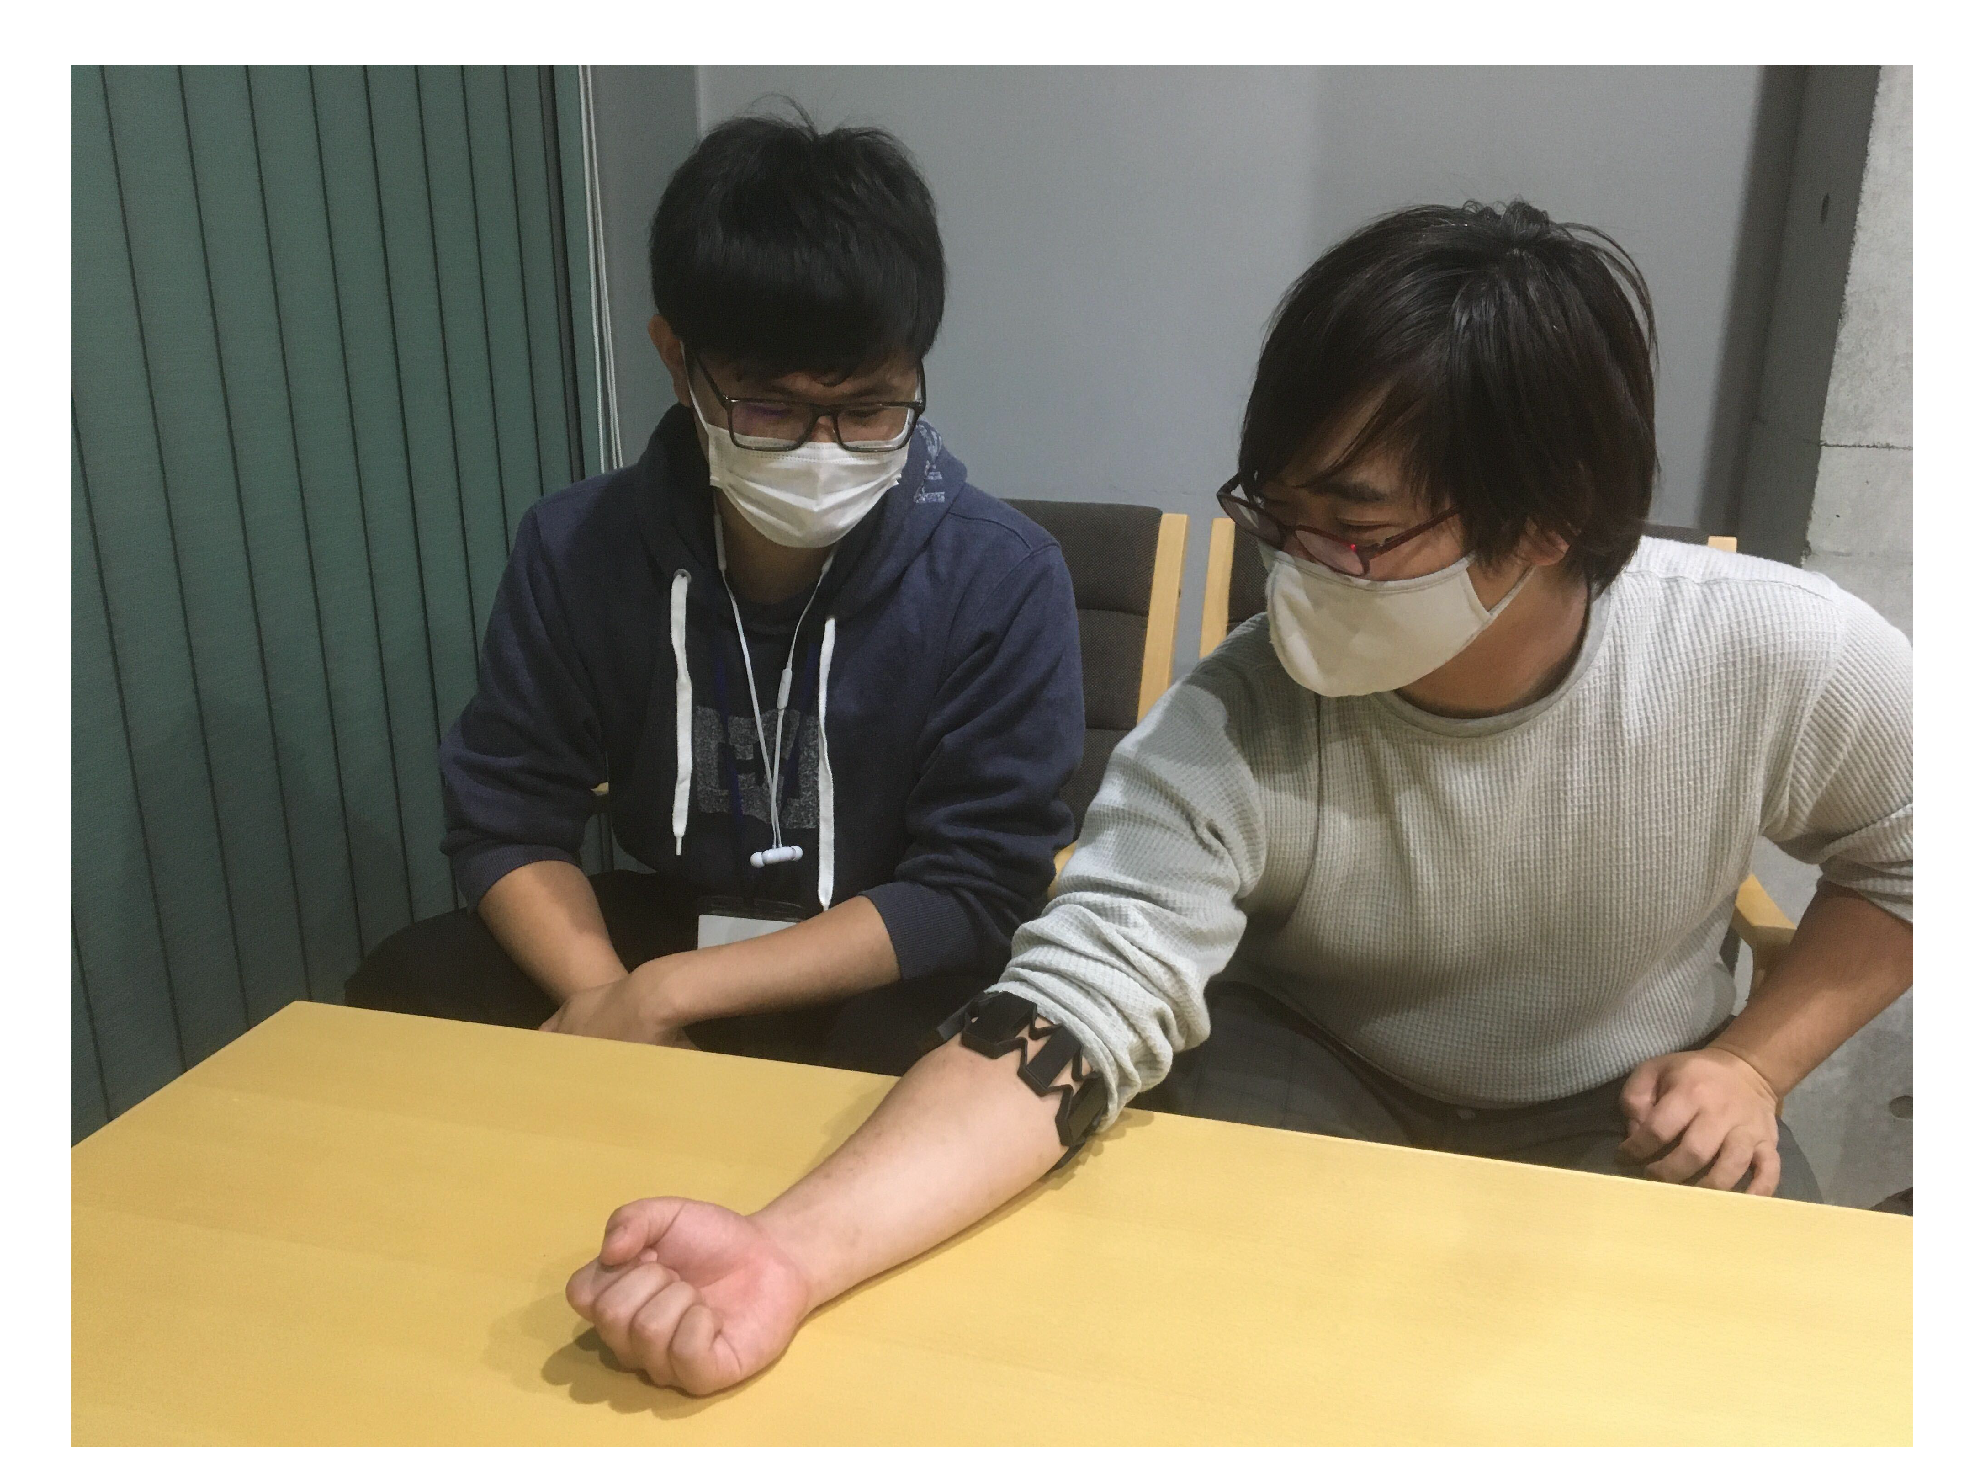
Table 1 shows the comparisons between different types of biometrics. Fingerprint and face recognition are static; thus, the time required to perform is very short, which can be 1 s or less, whereas gait and hand gestures are dynamic, which requires the user to perform the gesture within an amount of time. Gait requires longer time as compared to hand gesture due to the requirement of gait limit cycle stability [22], which could take few seconds to minutes to perform. As for hand gesture, it depends on how long the gesture an individual wants to use (similar to an individual deciding on length of password), but it is usually around 1 to 5 s.
Failure to Acquire (FTA) is when the biometrics data failed to be detected, captured or processed [23,24]. This can happen a lot with a fingerprint due to skin condition (e.g., dirt, water, peeling of skin). Face recognition also has a high rate of FTA due to facial accessories, such as mask, sunglasses, etc. Though recent research has been trying to solve the current problem with mask wearing by cropping and verifying the top part of the face, this can reduce some important attributes in face recognition, such as the nose and mouth, and increases the risk and simplicity of theft [25,26]. Gait can also easily affected by the clothes that the user wear, as well as the surface for the gait to be performed on [27]. Camera-based hand gesture has a medium rate of FTA as it is less likely to occur on the user but instead on the equipment itself which is the camera sensor. The camera sensor has a limited field of angle and can be easy obstructed by another object or even the user’s own finger when performing the gesture [21]. Our method has a low FTA rate as it is mostly being affected by the body fat level—the higher the body fat level, the lower the bioelectrical activity [28,29].
Biometrics are prone to theft, mimic, and impersonation. A fingerprint cannot be easily observed, but it can still be stolen. A fingerprint requires contact with the sensor, which can leave latent prints [30,31]. Face recognition can be observed and easily captured with a camera. Gait- and camera-based hand gestures are both observable but, because of the behavior in the gesture, it requires some training to mimic. As for our method, the gesture only requires small movement from the hands, which can be difficult to observe and can even hidden away while performing (e.g., performing in pocket).
Static biometrics can be more convenient than dynamic biometrics in terms of gesture performing speed which is almost instantaneously, unlike dynamic biometrics, which requires user to perform a certain movement or gesture performance in a certain amount of time. But, static biometrics are unchangeable [2,31,32] and not resettable, which makes them vulnerable to attack once they are stolen. Due to the ever changing in behavior, it will take an amount of effort to mimic an individual dynamic biometrics. Even if an impostor successfully mimicked an individual dynamic biometrics, it can be easily reset.
Lastly, the data required for static biometrics is less than that of dynamic biometrics. A fingerprint has a smaller surface area, thus producing smaller data from 200 bytes to less than a megabyte [33]; face recognition can vary from few kilobytes to few megabytes, depending on how compressed it is and whether it is a 2D or 3D mapping of the face. Dynamic biometrics can be small in size for each data (i.e., a few kilobytes for an EMG signal), but, since they do not stay constant, a large amount of data is required to be trained in the system. Moreover, it requires frequent updates (adding of new data) due to the changing of behavior, which could add up to few megabytes or even gigabytes at times, unlike that of static biometrics, where one recorded data can be adequate to authenticate for a very long period of time due to its unchanging nature.

2.3. Data Capturing

A total of 13 male participants, ranging between the age of 22 and 29, participated in our experiment. Participants suffering from physical disabilities, pain, and diseases causing potential neural damage, systemic illnesses, language problems, hearing or speech disorders, and mental disorders were excluded. The experiment was performed once every week for four weeks. In every session, the participants have been asked to perform their gesture 10 times in each scenario. In between the 10 gestures, that is, after 5 gestures, the device would be taken off and reattached onto the forearm. The refitting (taking off and then putting on again) of the device can change the position of the device on the forearm and the amount of contact of the sensors with the skin, which can affect the strength of the EMG signal.
Each participant was instructed to create and perform a rhythmic hand gesture which they are more familiar with. This is to ensure that the participants can easily memorize their gesture and also less variation in terms of their rhythmic tempo in the gesture [34]. The rhythm gesture can be performed by contracting the muscle of the forearm by clenching the fist (tightening the fingers towards the palm with force) and relaxing the fist (relaxing the fingers), as shown in Figure 1. Each beat of the rhythm will be performed by clenching the fist.
In this experiment, we set three different scenarios for the gesture to be performed in—sitting, standing, and walking. This is to reflect and simulate the common scenarios of an individual interacts with their electronic device. Although sitting and standing may seem similar in terms of being stationary and not moving, as shown in Figure 2, people tend to bend their elbow when seated on a chair, which contracts the muscles in the forearm, as opposed to that while standing, where the arm is in a straight and relaxed posture. This may change the performance behavior of an individual. Walking, basically, will have a sudden spike in the signal due to the vibration or arm swinging while walking.
Each participant was also instructed to mimic a different participant’s gesture each week (excluding participant # 1 who mimicked 2 different participants gestures each week due to the odd number of participants). Each participant will be mimicking 4 different participants’ gestures overall, except participant # 1 who mimicked 8 different participants’ gestures. The genuine user visually performed their gesture in front of the impostor, as shown in Figure 3. This is to simulate that the impostor has clearly seen how the gesture is being performed visually.

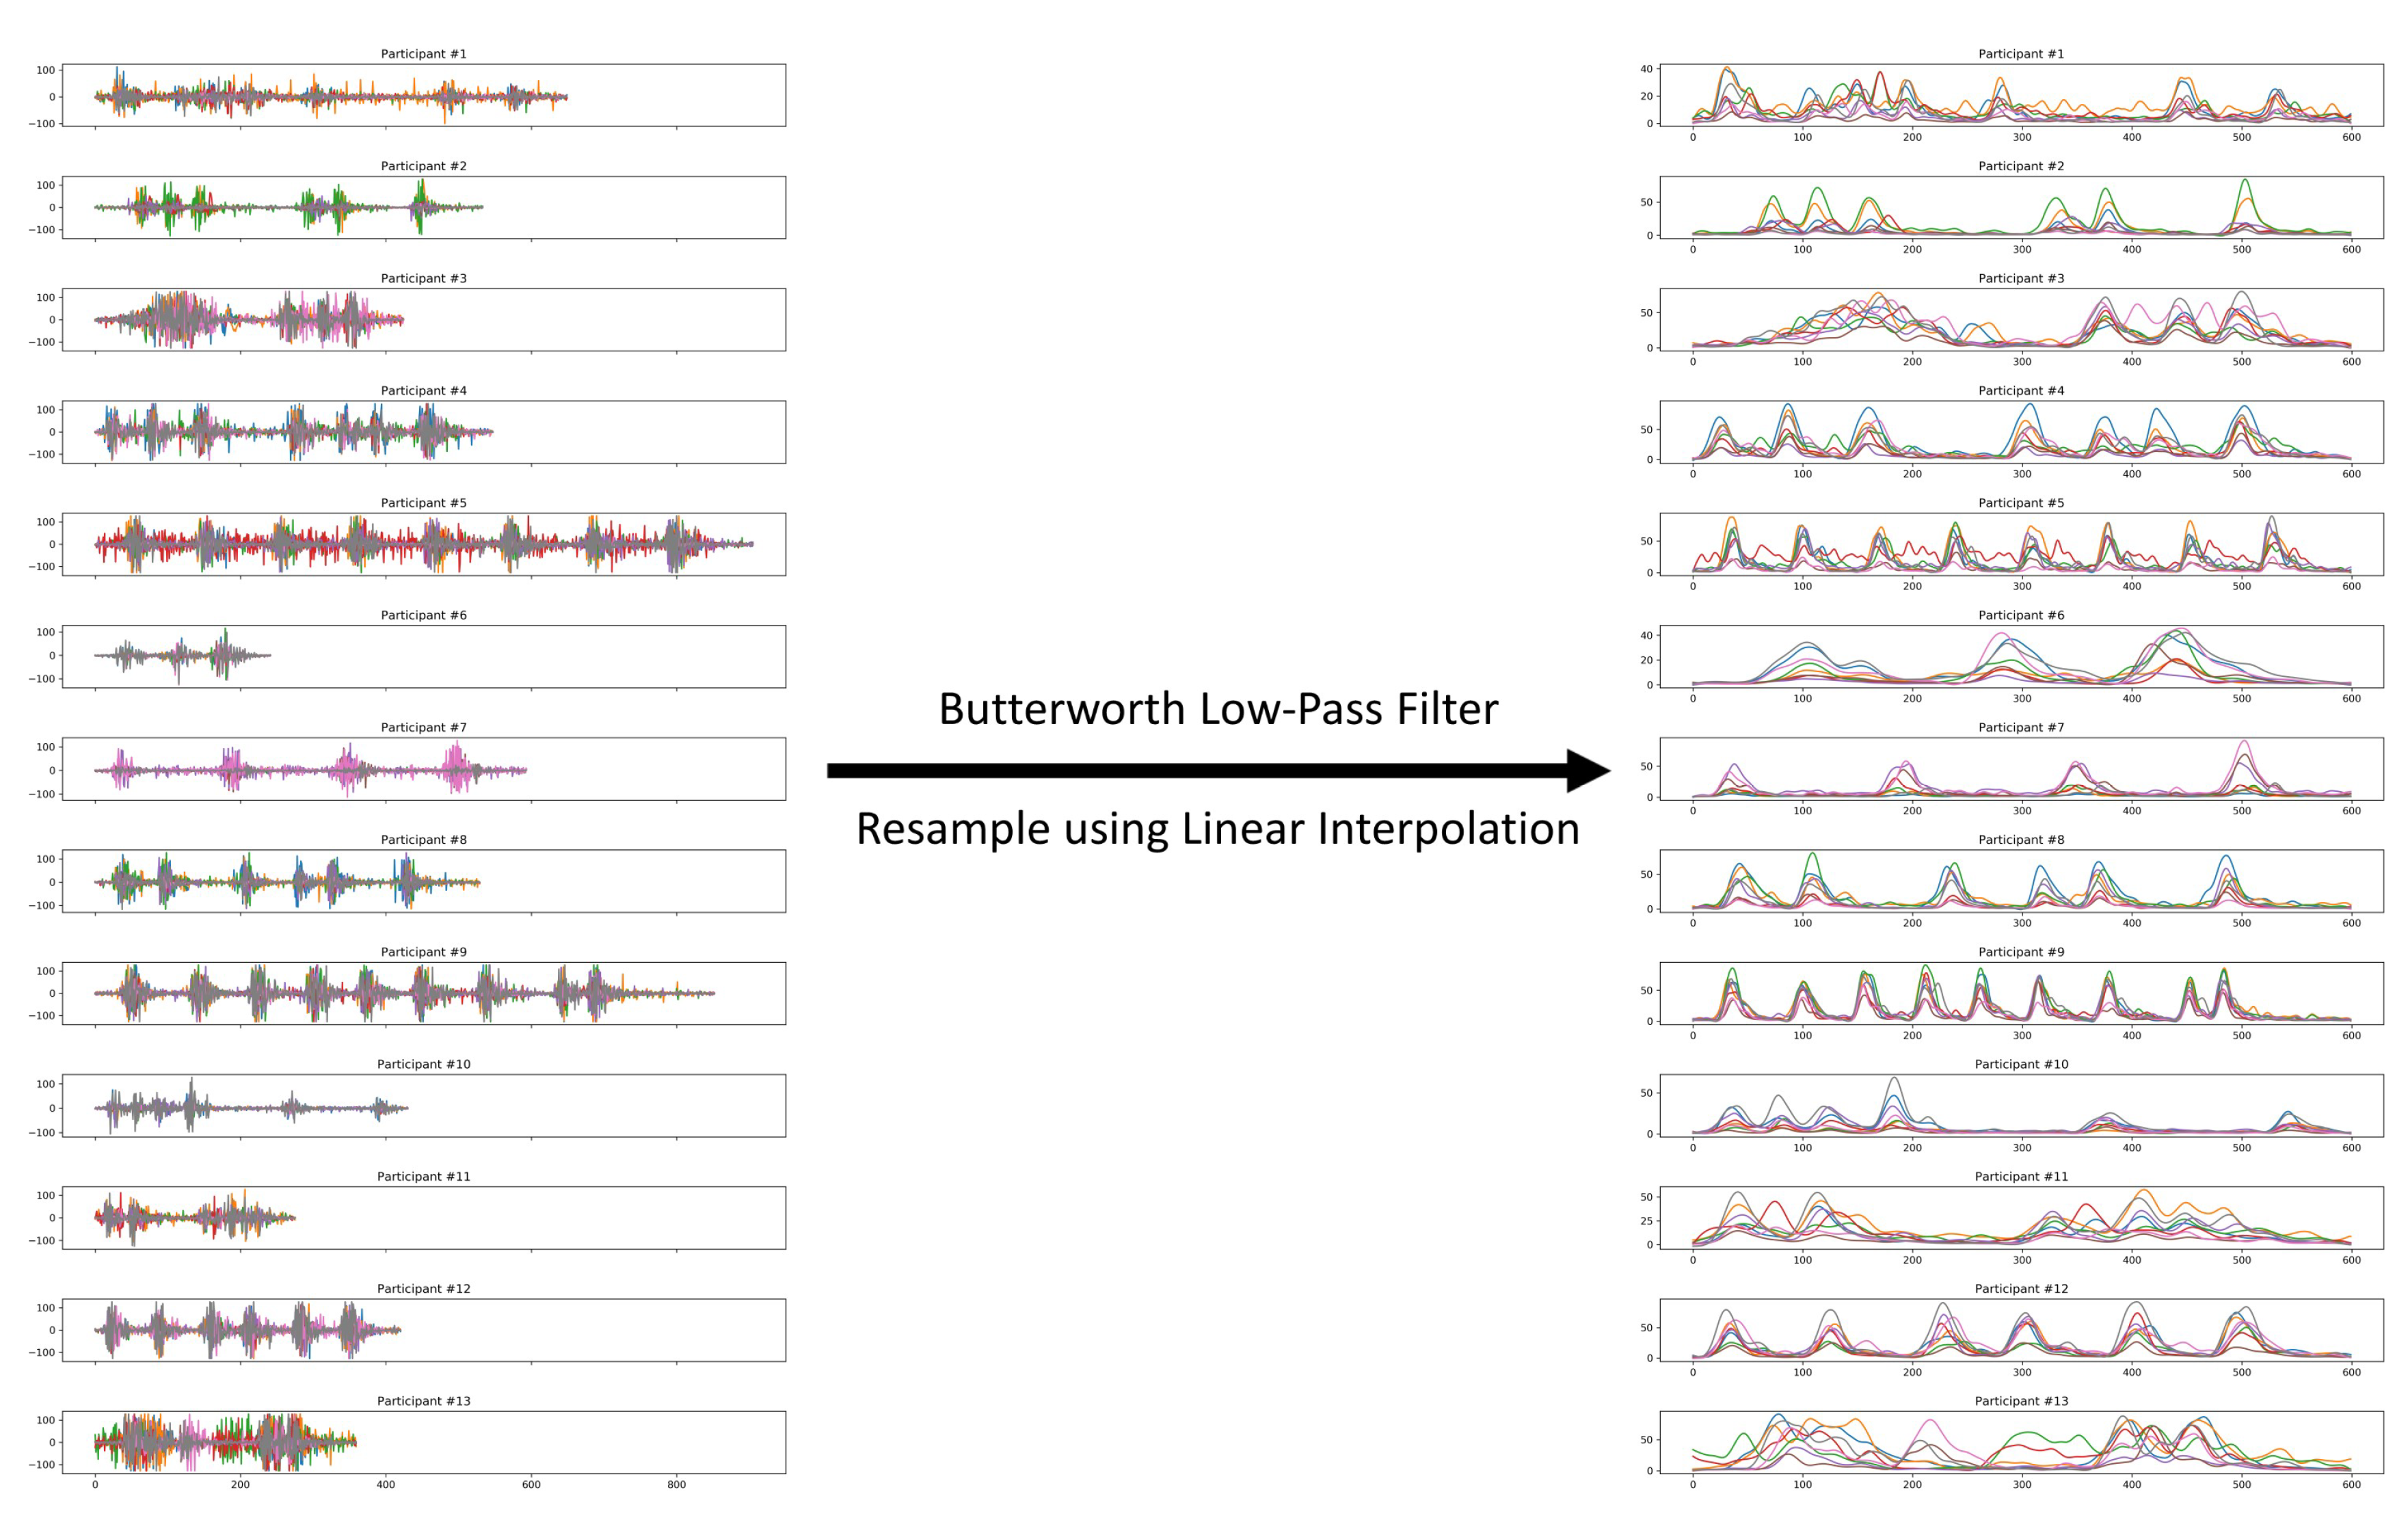
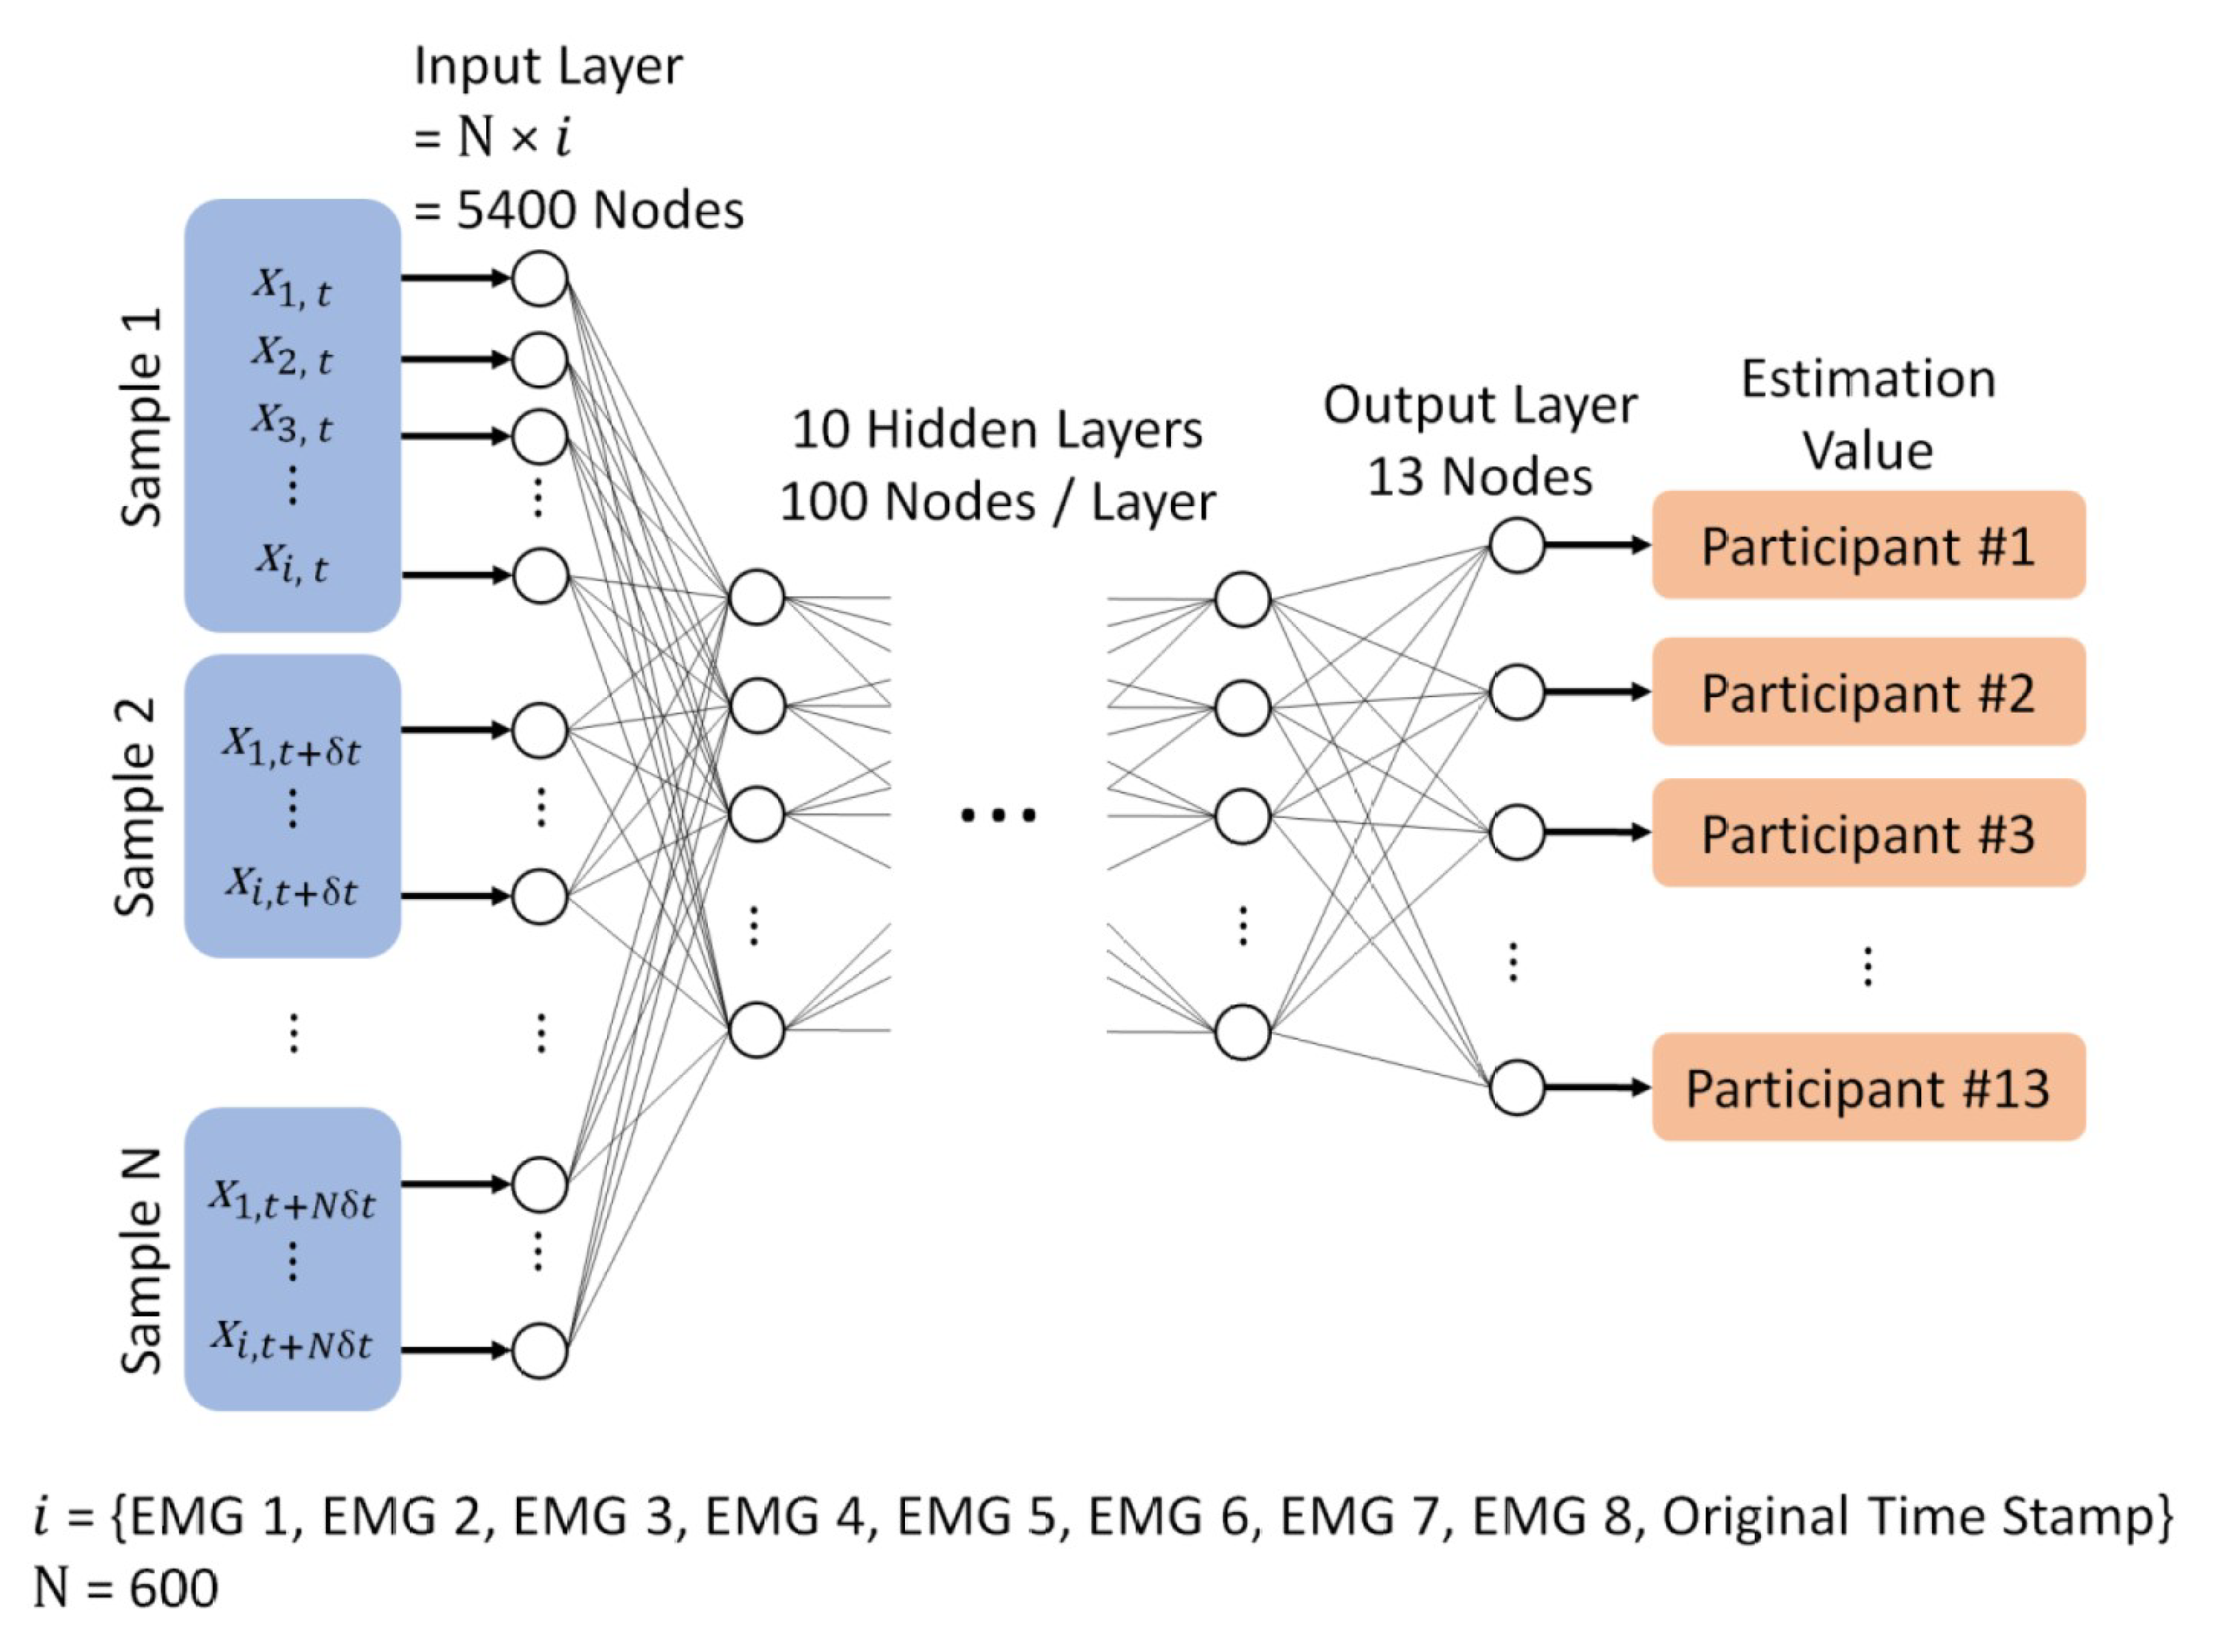
2.4. Data Processing and Analyzing

The gestures were recorded once with each fitting, which makes it about five continuous gestures in each recording. The continuous gestures have small pauses in between each other. This allows the separation of each gesture with more ease. After splitting the gestures, the EMG signals were filtered using second-order Butterworth low-pass filter with 10 Hz cutoff. Although other research on EMG has been using higher sampling rate in filtering, we found out that, in our research, the applied low-pass filter has been sufficient to output the shape of the gesture, as shown in Figure 4. Next, resampling using linear interpolation was applied due to the imbalance in the sampling numbers in every gesture. All gestures were resampled to 600 samples. Similar to the sample size, the window size and sliding rate were set to 600 samples.
Instead of distributing the signal into chunks using smaller window size and sliding rate of one sample, we opted to process the signal as one complete gesture because smaller window size with one sample sliding rate can cause mismatch as different gestures can have similar sections, as shown in Figure 5.
The neural network from the TensorFlow Keras Sequantial model was used to predict the result. The setup of the neural network is 9 inputs, which are the 8 different channels of the EMG sensors and the original timestamp of each gesture, 10 hidden layers with 100 nodes for each layer, and 20 epochs. The output is an estimation of which gesture belongs to which participant. The estimation is then compared with the real value to confirm the estimation.
We consider a set of weights as coefficient values of a digital filter. It means that a well-learned neural network using our data set is expected to have coefficient values of finite impulse response (FIR) filter in order to judge “who is who”. The benefit of the time-order array design is to obtain time-space features in the training phase, as well as easy to achieve real-time processing. Basic design of data structure, given the obtained EMG signal, is arranged in time-order, as shown in the blue box (left side) of Figure 6.
Because the experiment was done in multiple sessions, the fitting of the EMG device, which affects the EMG sensors’ location, was always different. To overcome the inconsistent physical location of the EMG sensors that occurs after the refitting the device, we proposed a virtual rotation in algorithm. This is done by rotating the EMG input of the neural network, as shown in Figure 7. The virtual rotation also serves as extra training data.
Finally, the results will be evaluated with confusion matrix, accuracy, false acceptance rate (FAR), and false rejection rate (FRR). The equations of accuracy, FAR, and FRR are explained in (1), (2), and (3) respectively:
A c c u r a c y = T r u e A c c e p t a n c e T o t a l O n e s D a t a T o t a l P a r t i c i p a n t s ,
F A R = F a l s e A c c e p t a n c e F a l s e A c c e p t a n c e + T r u e R e j e c t i o n ,
F A R = F a l s e R e j e c t i o n F a l s e R e j e c t i o n + T r u e A c c e p t a n c e .

3. Results

To test out the robustness of rhythmic-based dynamic hand gesture with sEMG, different conditions have been analyzed. The different conditions are:
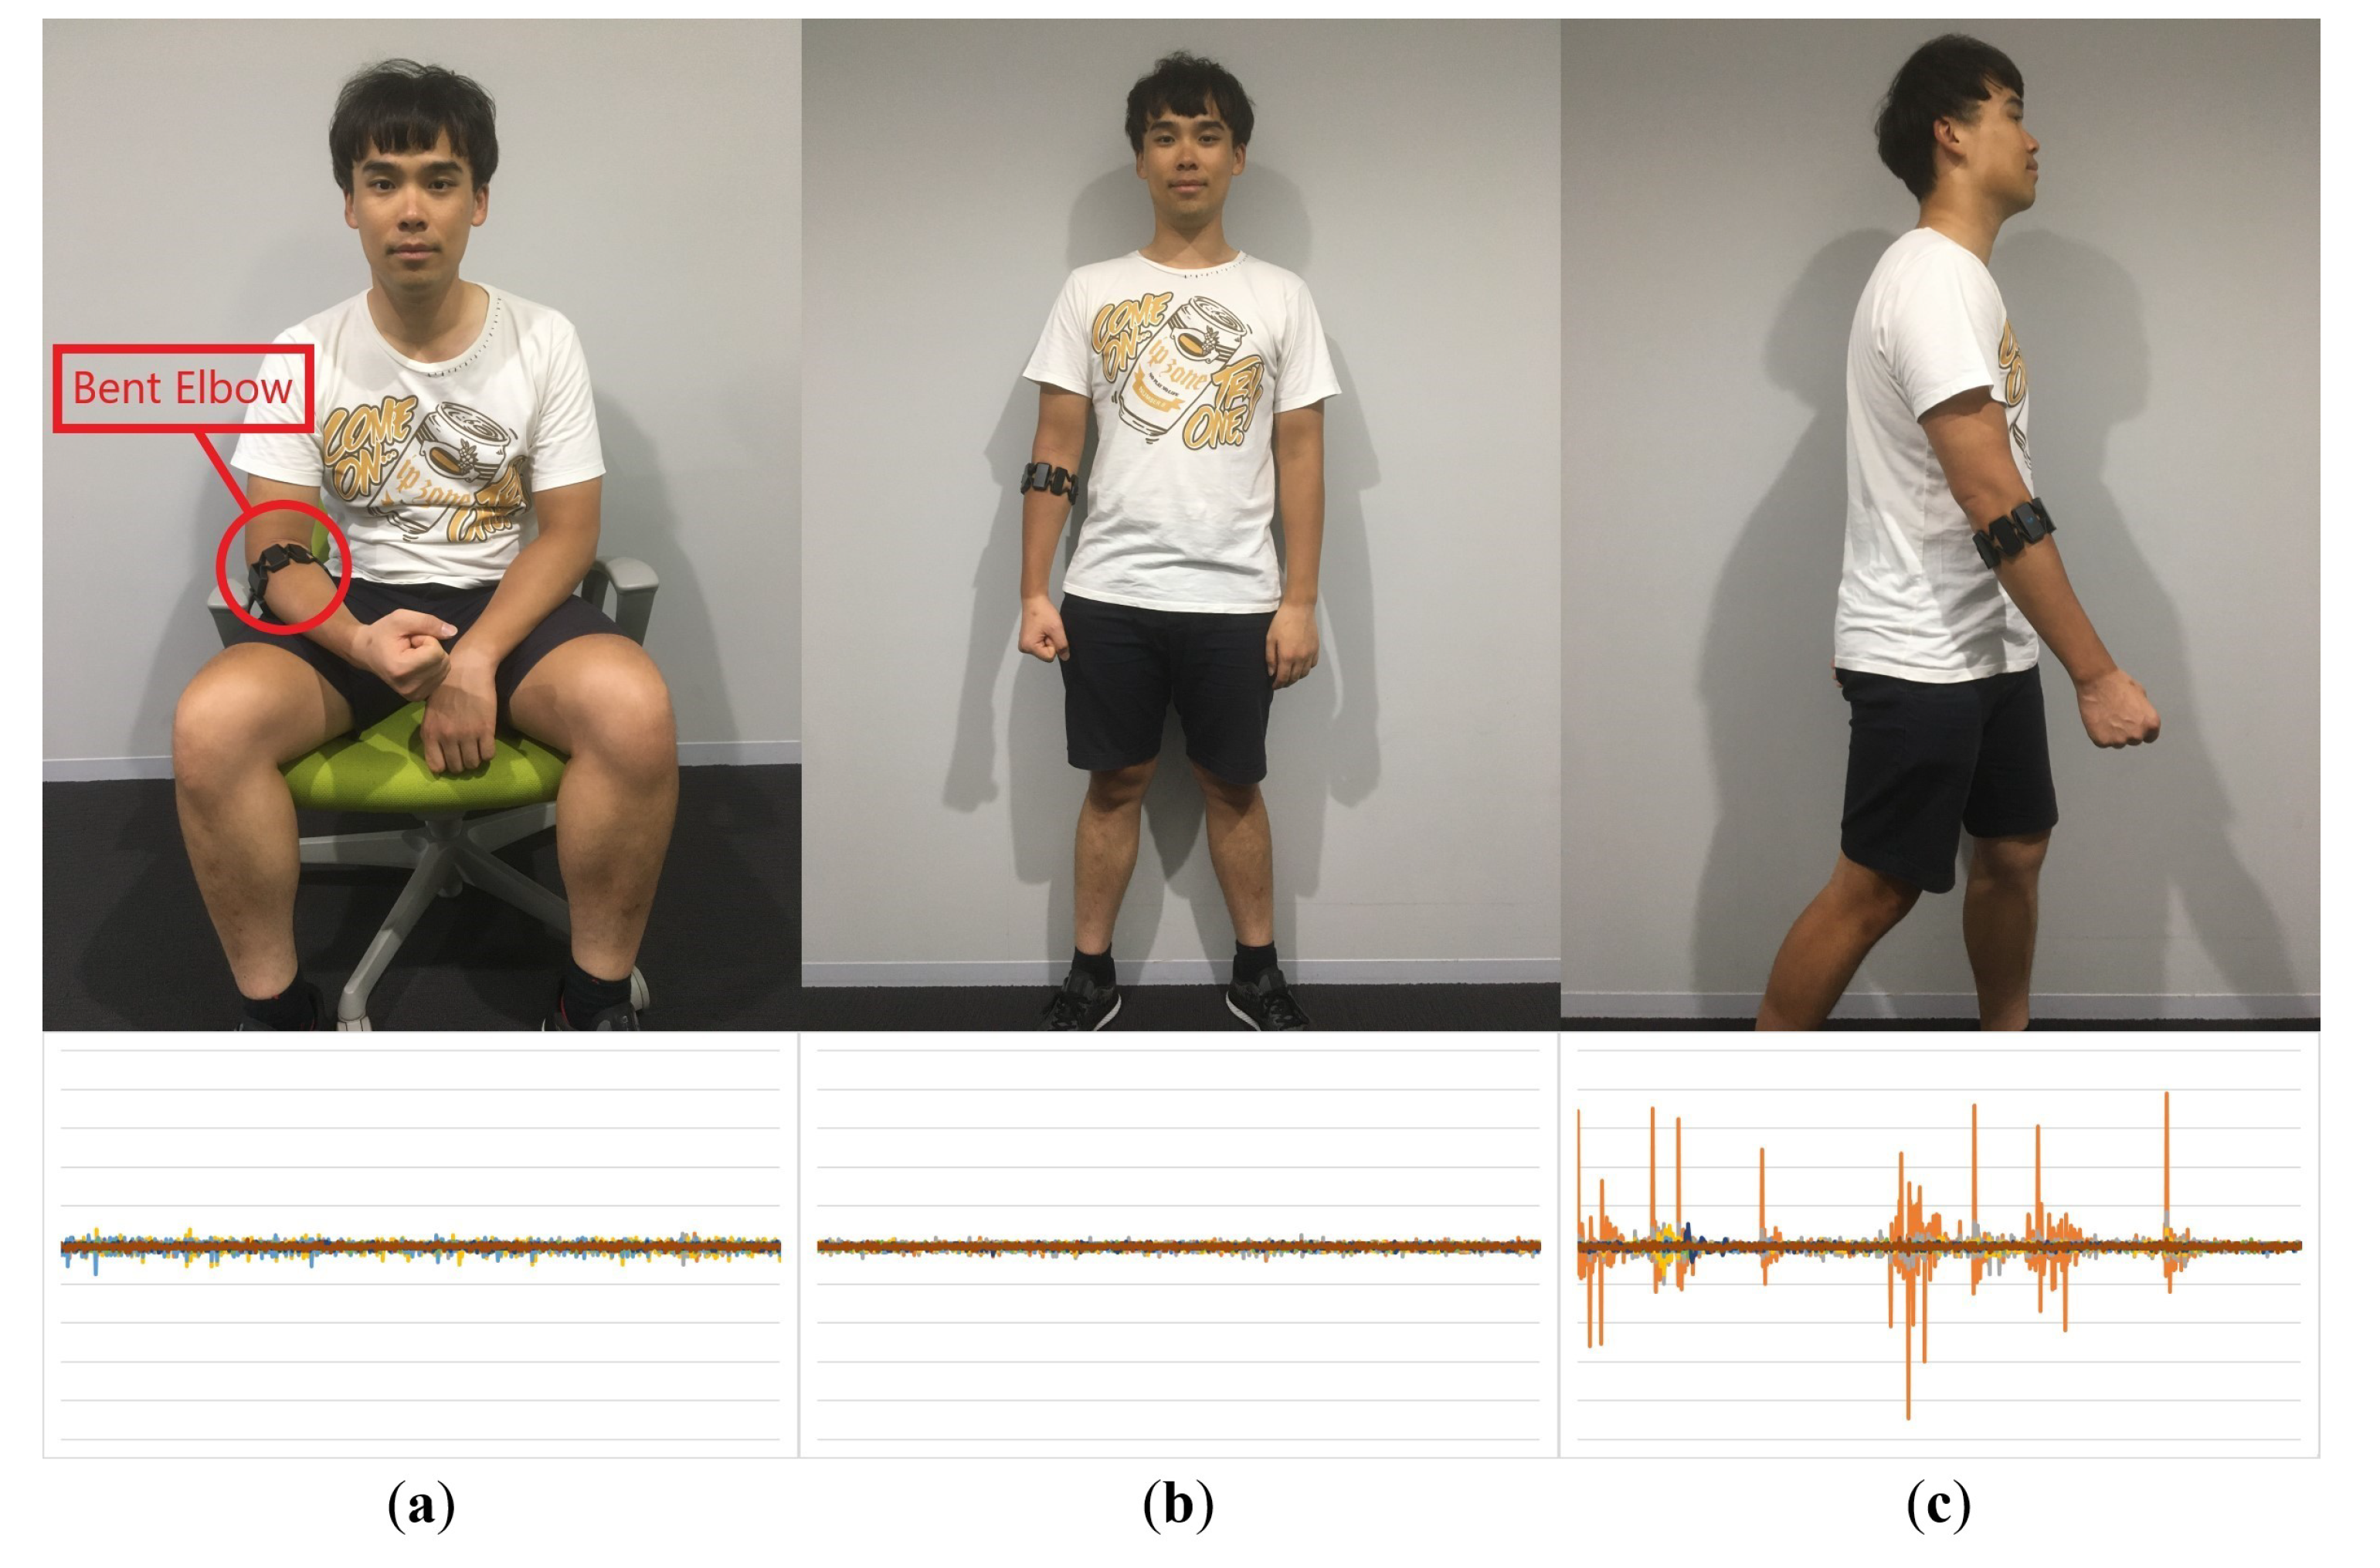
  • training data set consists of different scenario as that of the testing data set (i.e., sitting scenario for training, either standing or walking scenario for testing),
  • comparisons between single fitting and multiple fittings,
  • comparisons between no rotation and virtual rotation, and
  • mimicking other participants gestures.
The speed of validation on each gesture data is up to 2 ms. Though it is slower than fingerprint validation, which can be validated in less than 100 μs [35,36], it can be very similar to face recognition, with recognition speed of 2.4 ms [37]. In normal use, it is fast enough to be indiscernible by users.

3.1. Different Scenario Training and Testing

Figure 8 shows the results of one scenario training with a different scenario testing. The methodology of evaluating this experiment is splitting the data into different scenarios in training and testing. Every training and testing data set for each participant consists of 1 scenario × 8 fittings × 5 gestures:
  • Training = Sitting scenario; Testing = Standing scenario.
  • Training = Sitting scenario; Testing = Walking scenario.
  • Training = Standing scenario; Testing = Sitting scenario.
  • Training = Standing scenario; Testing = Walking scenario.
  • Training = Walking scenario; Testing = Sitting scenario.
  • Training = Walking scenario; Testing = Standing scenario.
Blue bars show the training of sit scenario and testing of stand and walk scenarios; orange bars show the training of stand scenario and testing of sit and walk scenarios; grey bars show the training of walk scenario and testing of sit and stand scenarios. The accuracy, FAR, and FRR are summarized in Table 2 of Section 3.5.

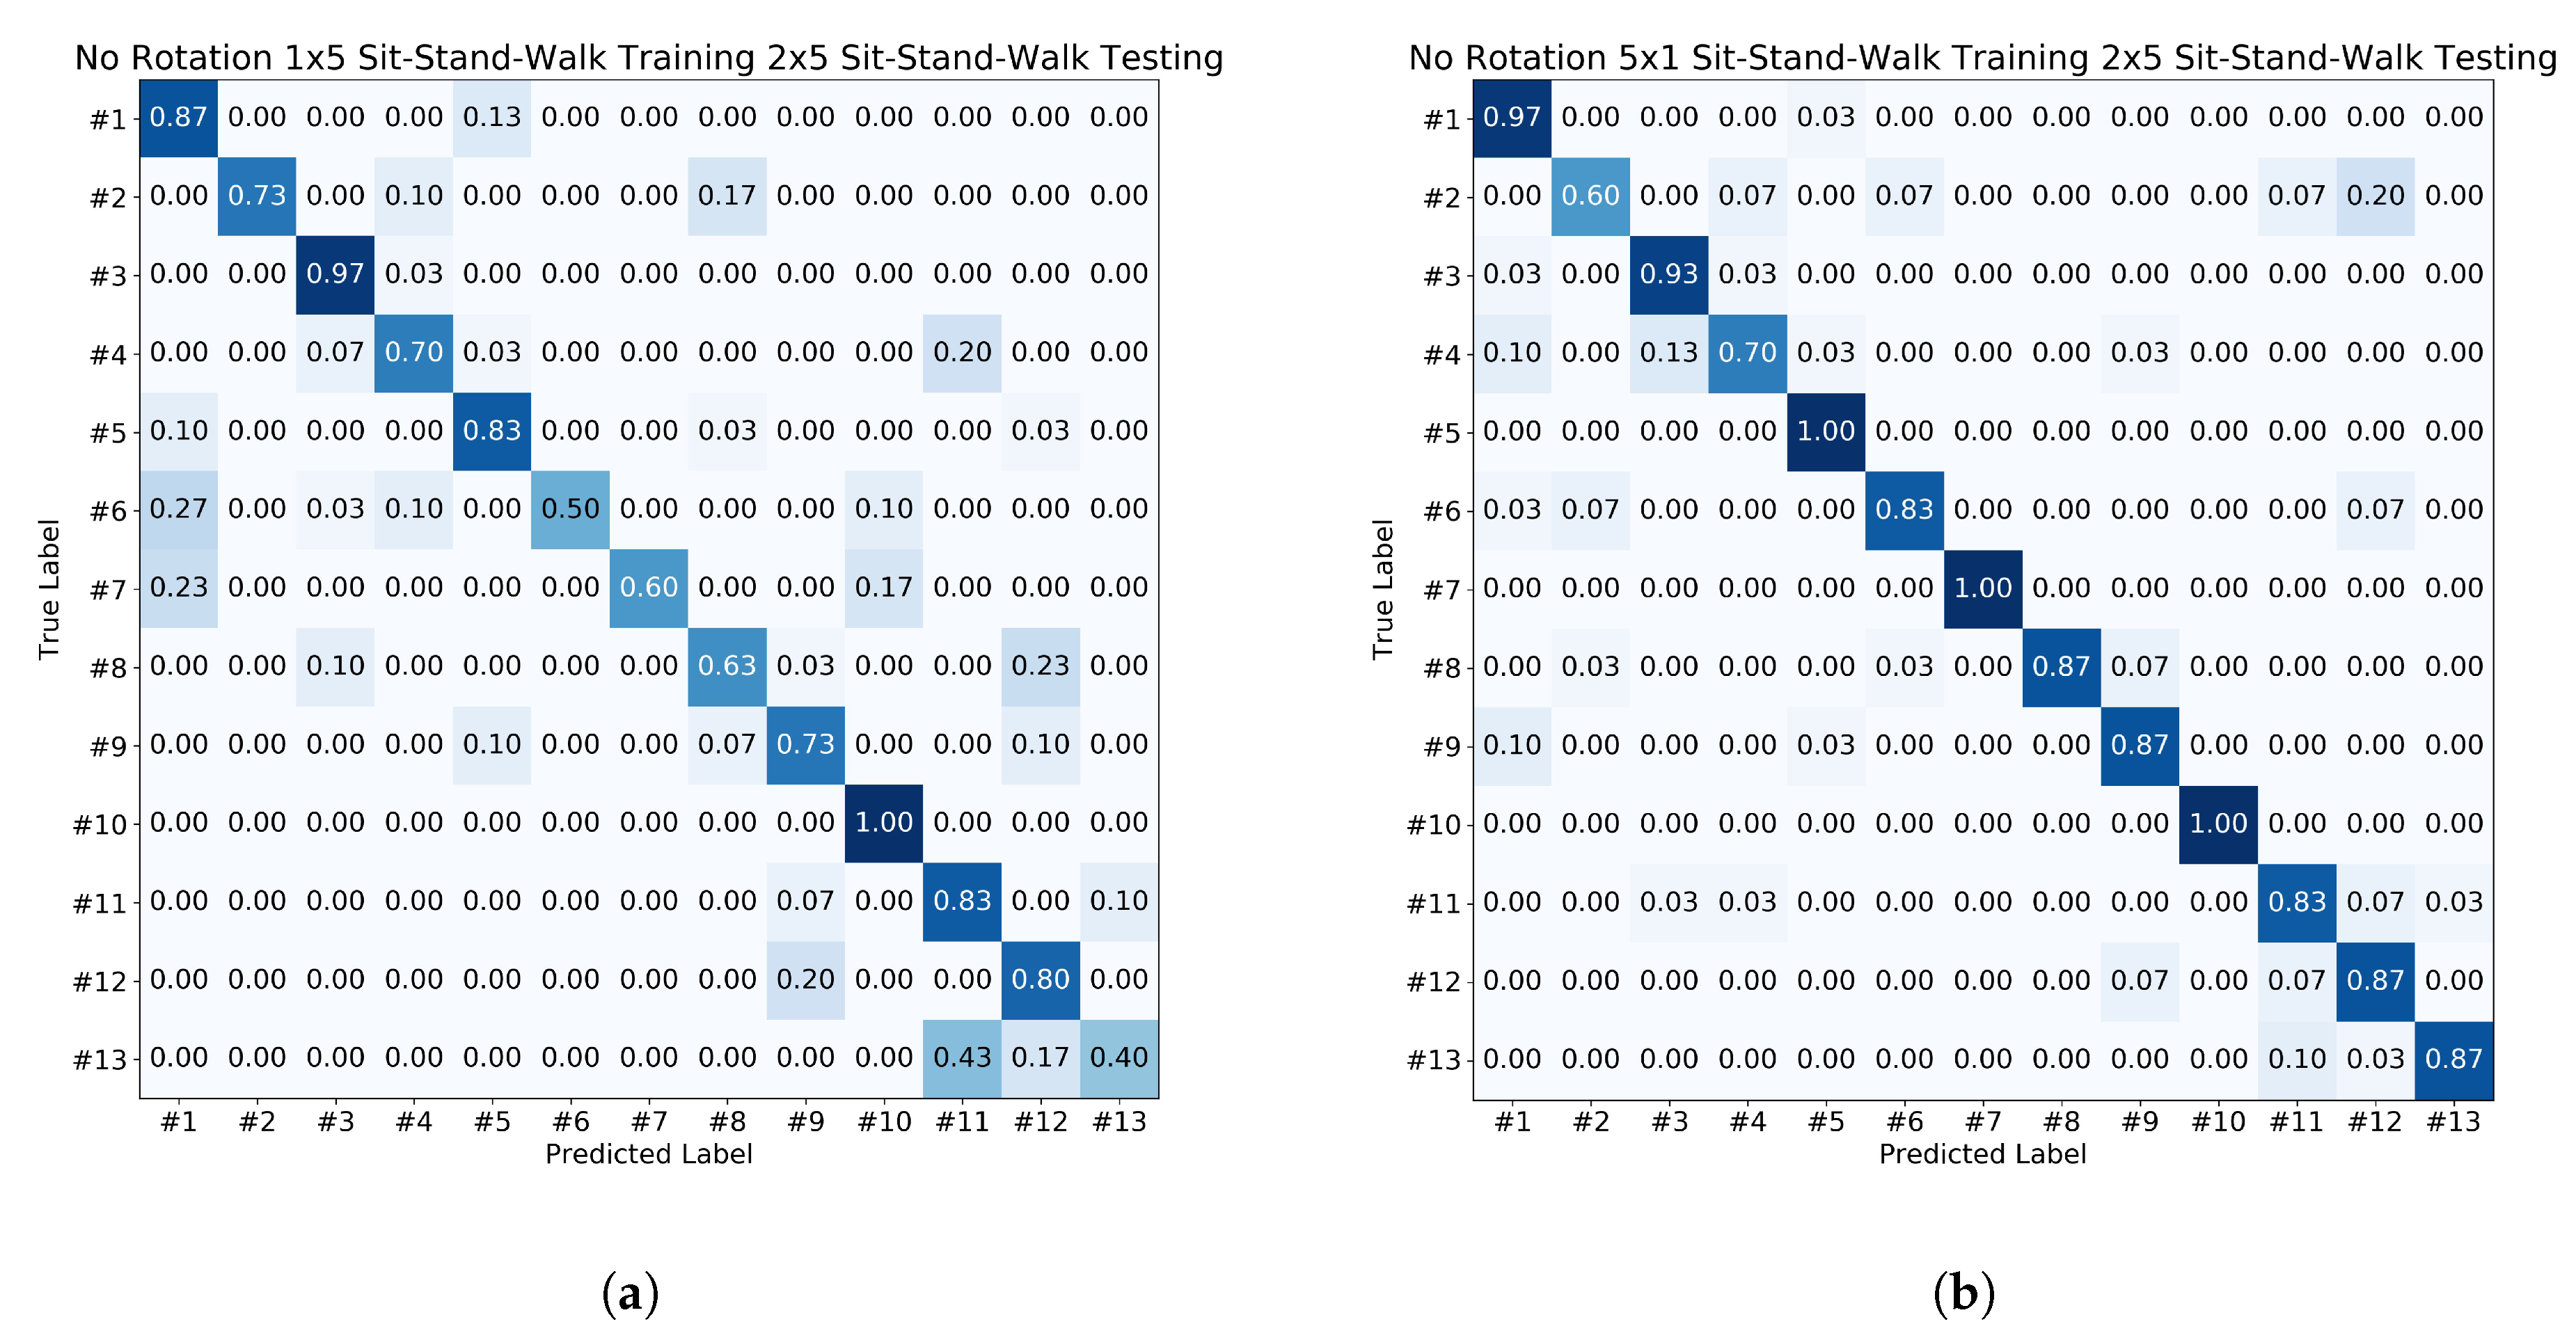
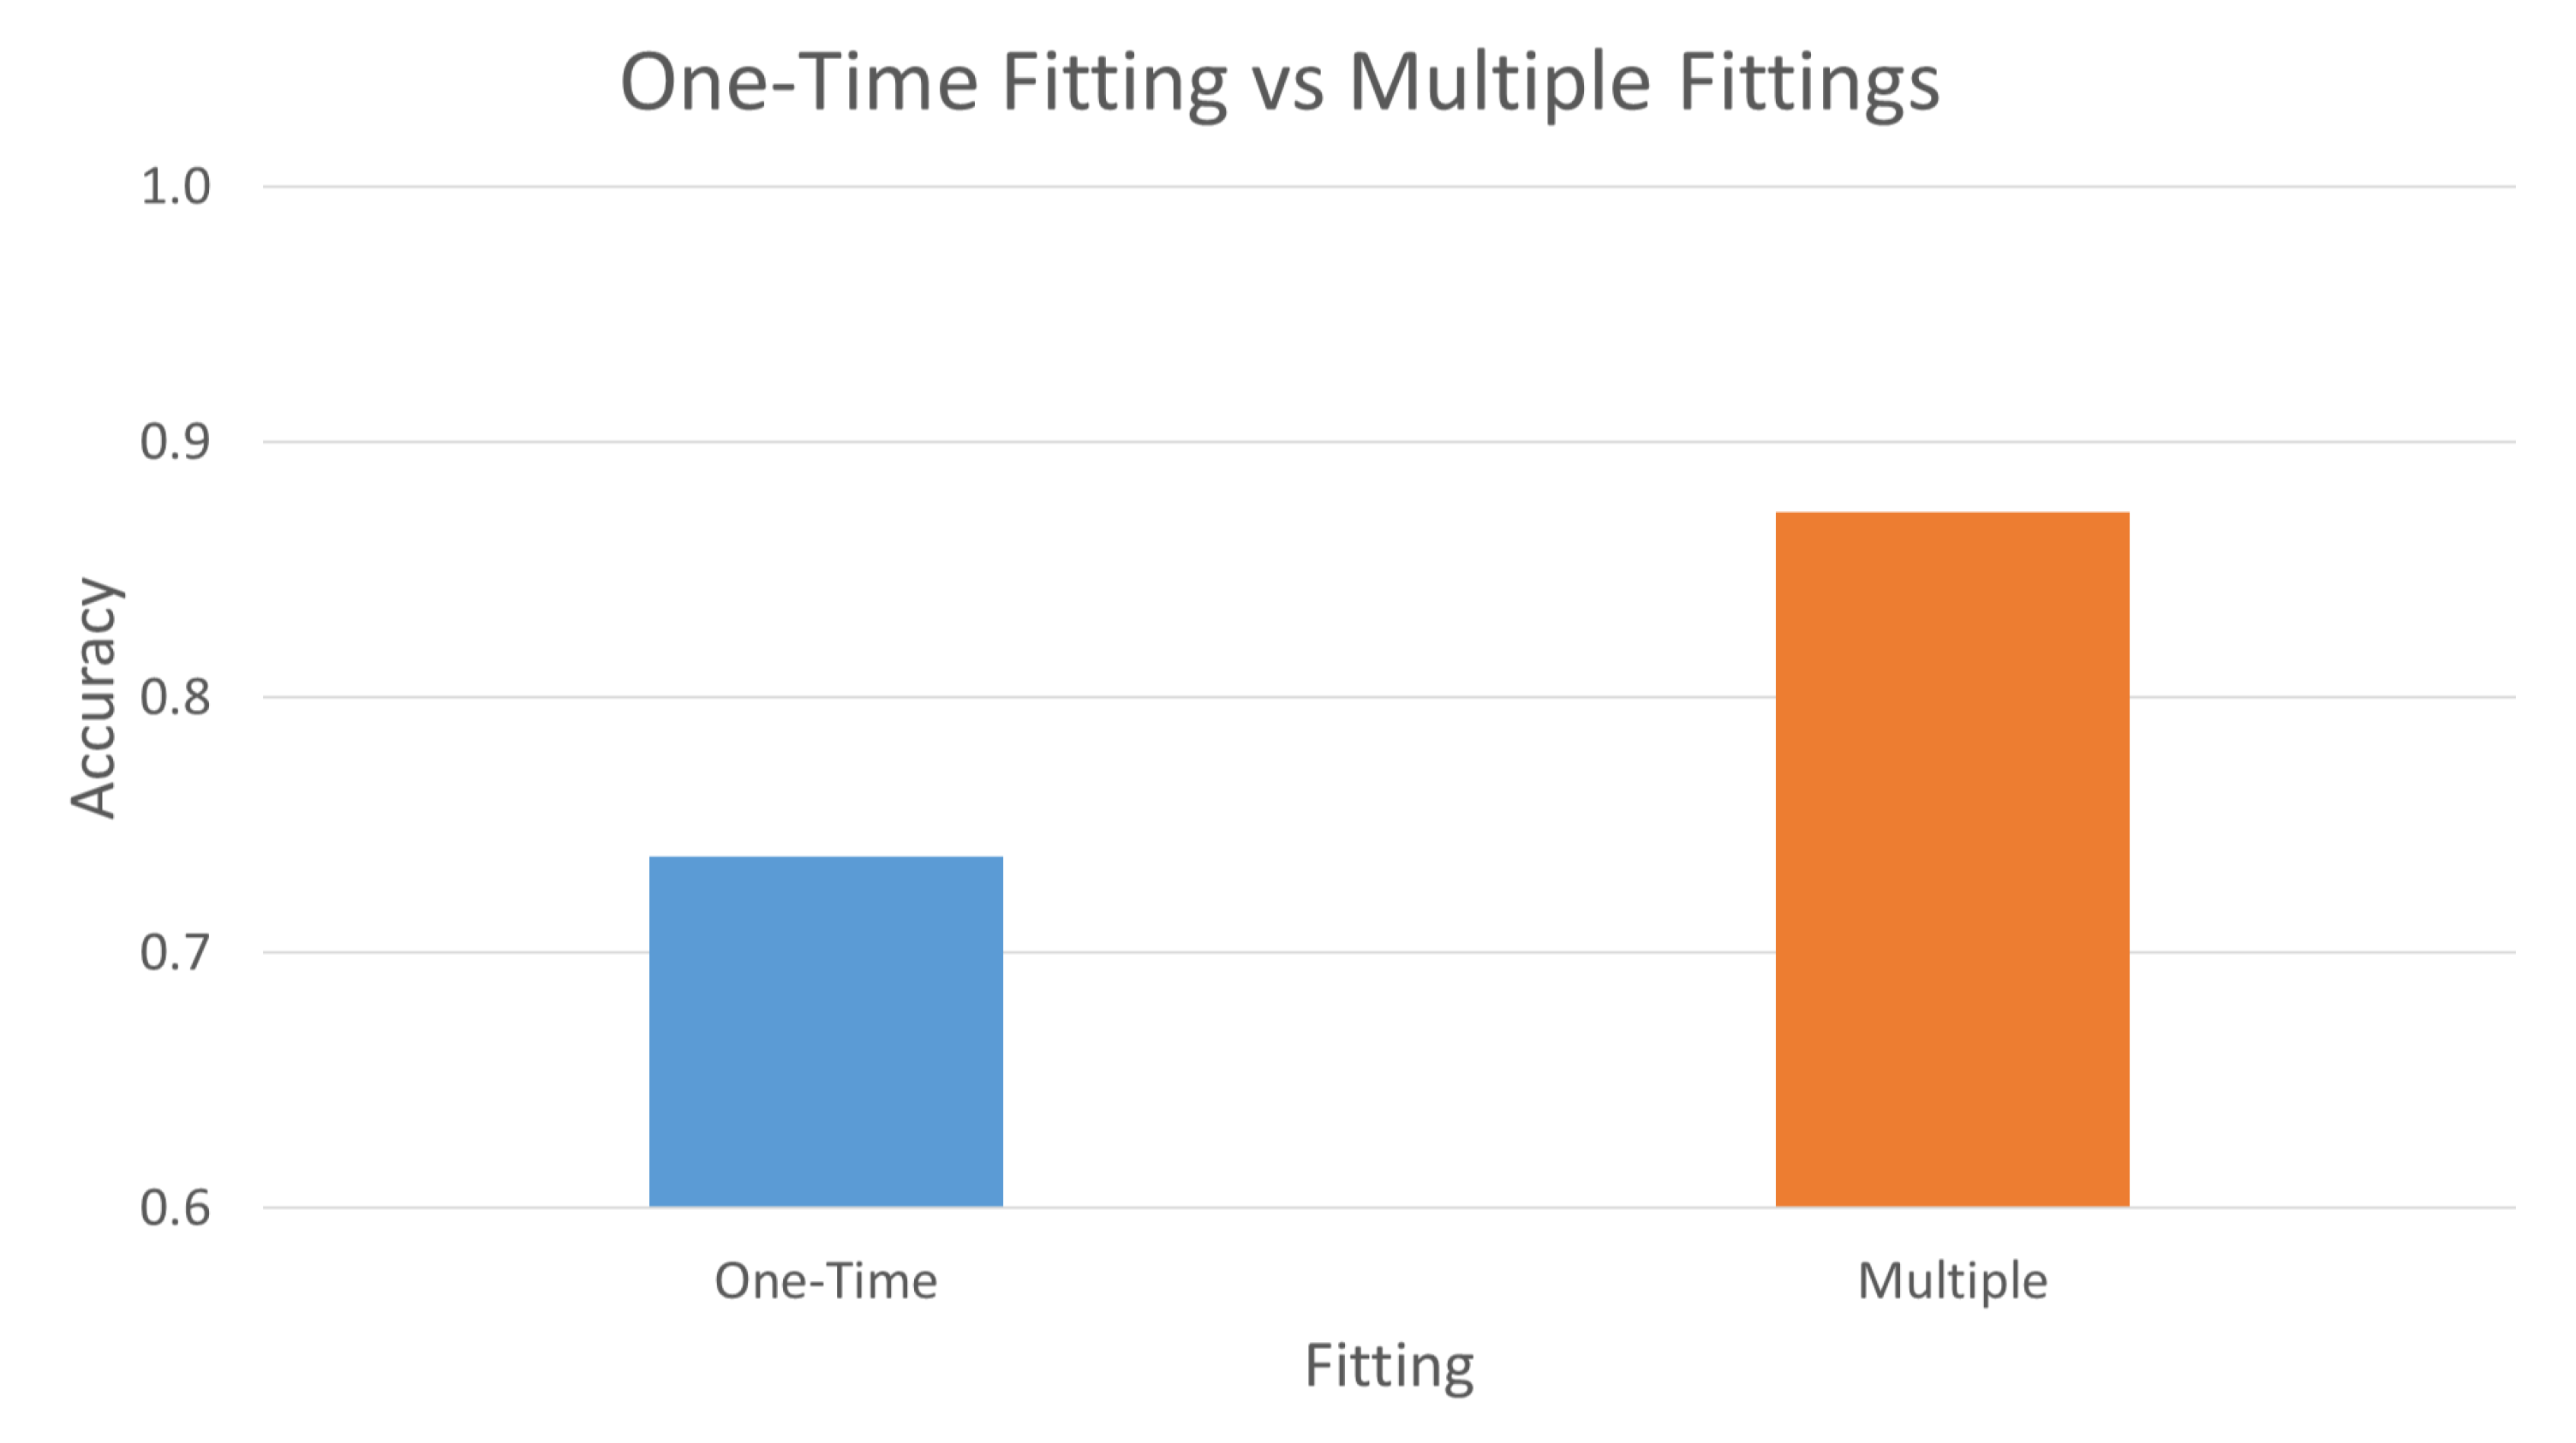
3.2. One-Time Fitting with Multiple Similar Gestures versus Multiple Fittings with Single Similar Gesture

Figure 9 and Figure 10 show the comparison of one-time fitting with multiple similar gesture and multiple fitting with single similar gesture. The one-time fitting with multiple similar gesture training data set consists of 3 scenarios × 1 fitting × 5 gestures, i.e., participant fits the Myo Armband once and performs the gesture 5 times, whereas the multiple fitting with a single similar gesture training data set consists of 3 scenarios × 5 fittings × 1 gesture, i.e., participant puts on the Myo Armband and performs the gesture once and then refits—takes off and puts on—the Myo Armband and repeats the gesture again once; this repetition is done 5 times. Both testing data set consists of 3 scenarios × 2 fittings × 5 gestures. The accuracy, FAR, and FRR are summarized in Table 2 of Section 3.5.

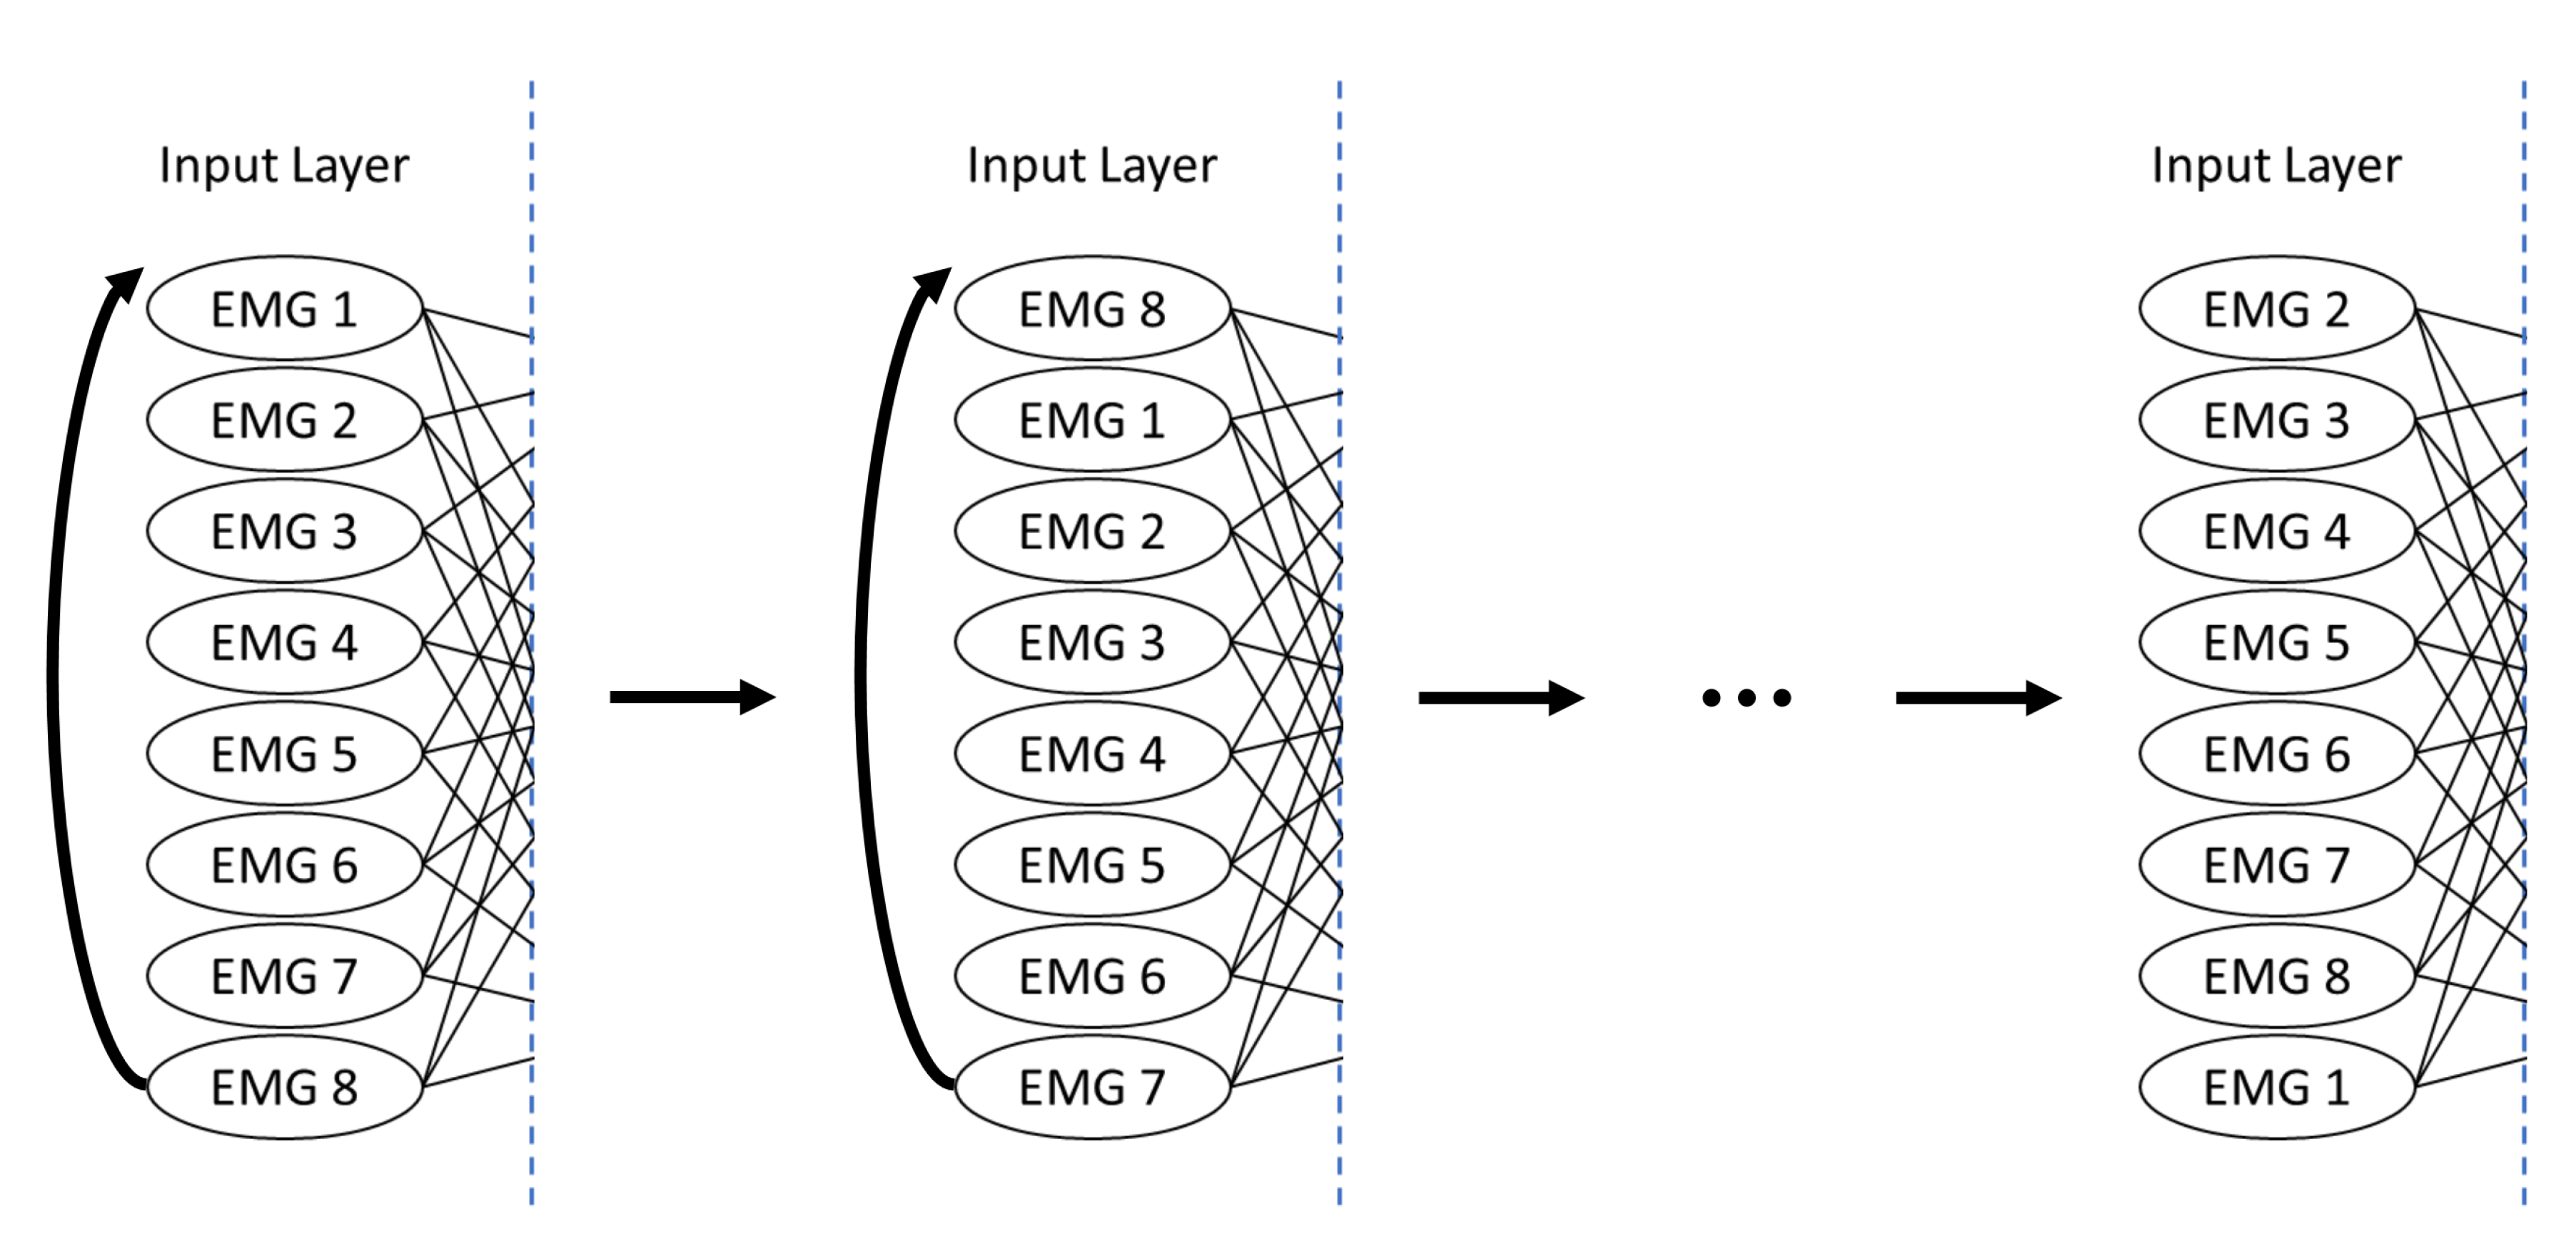
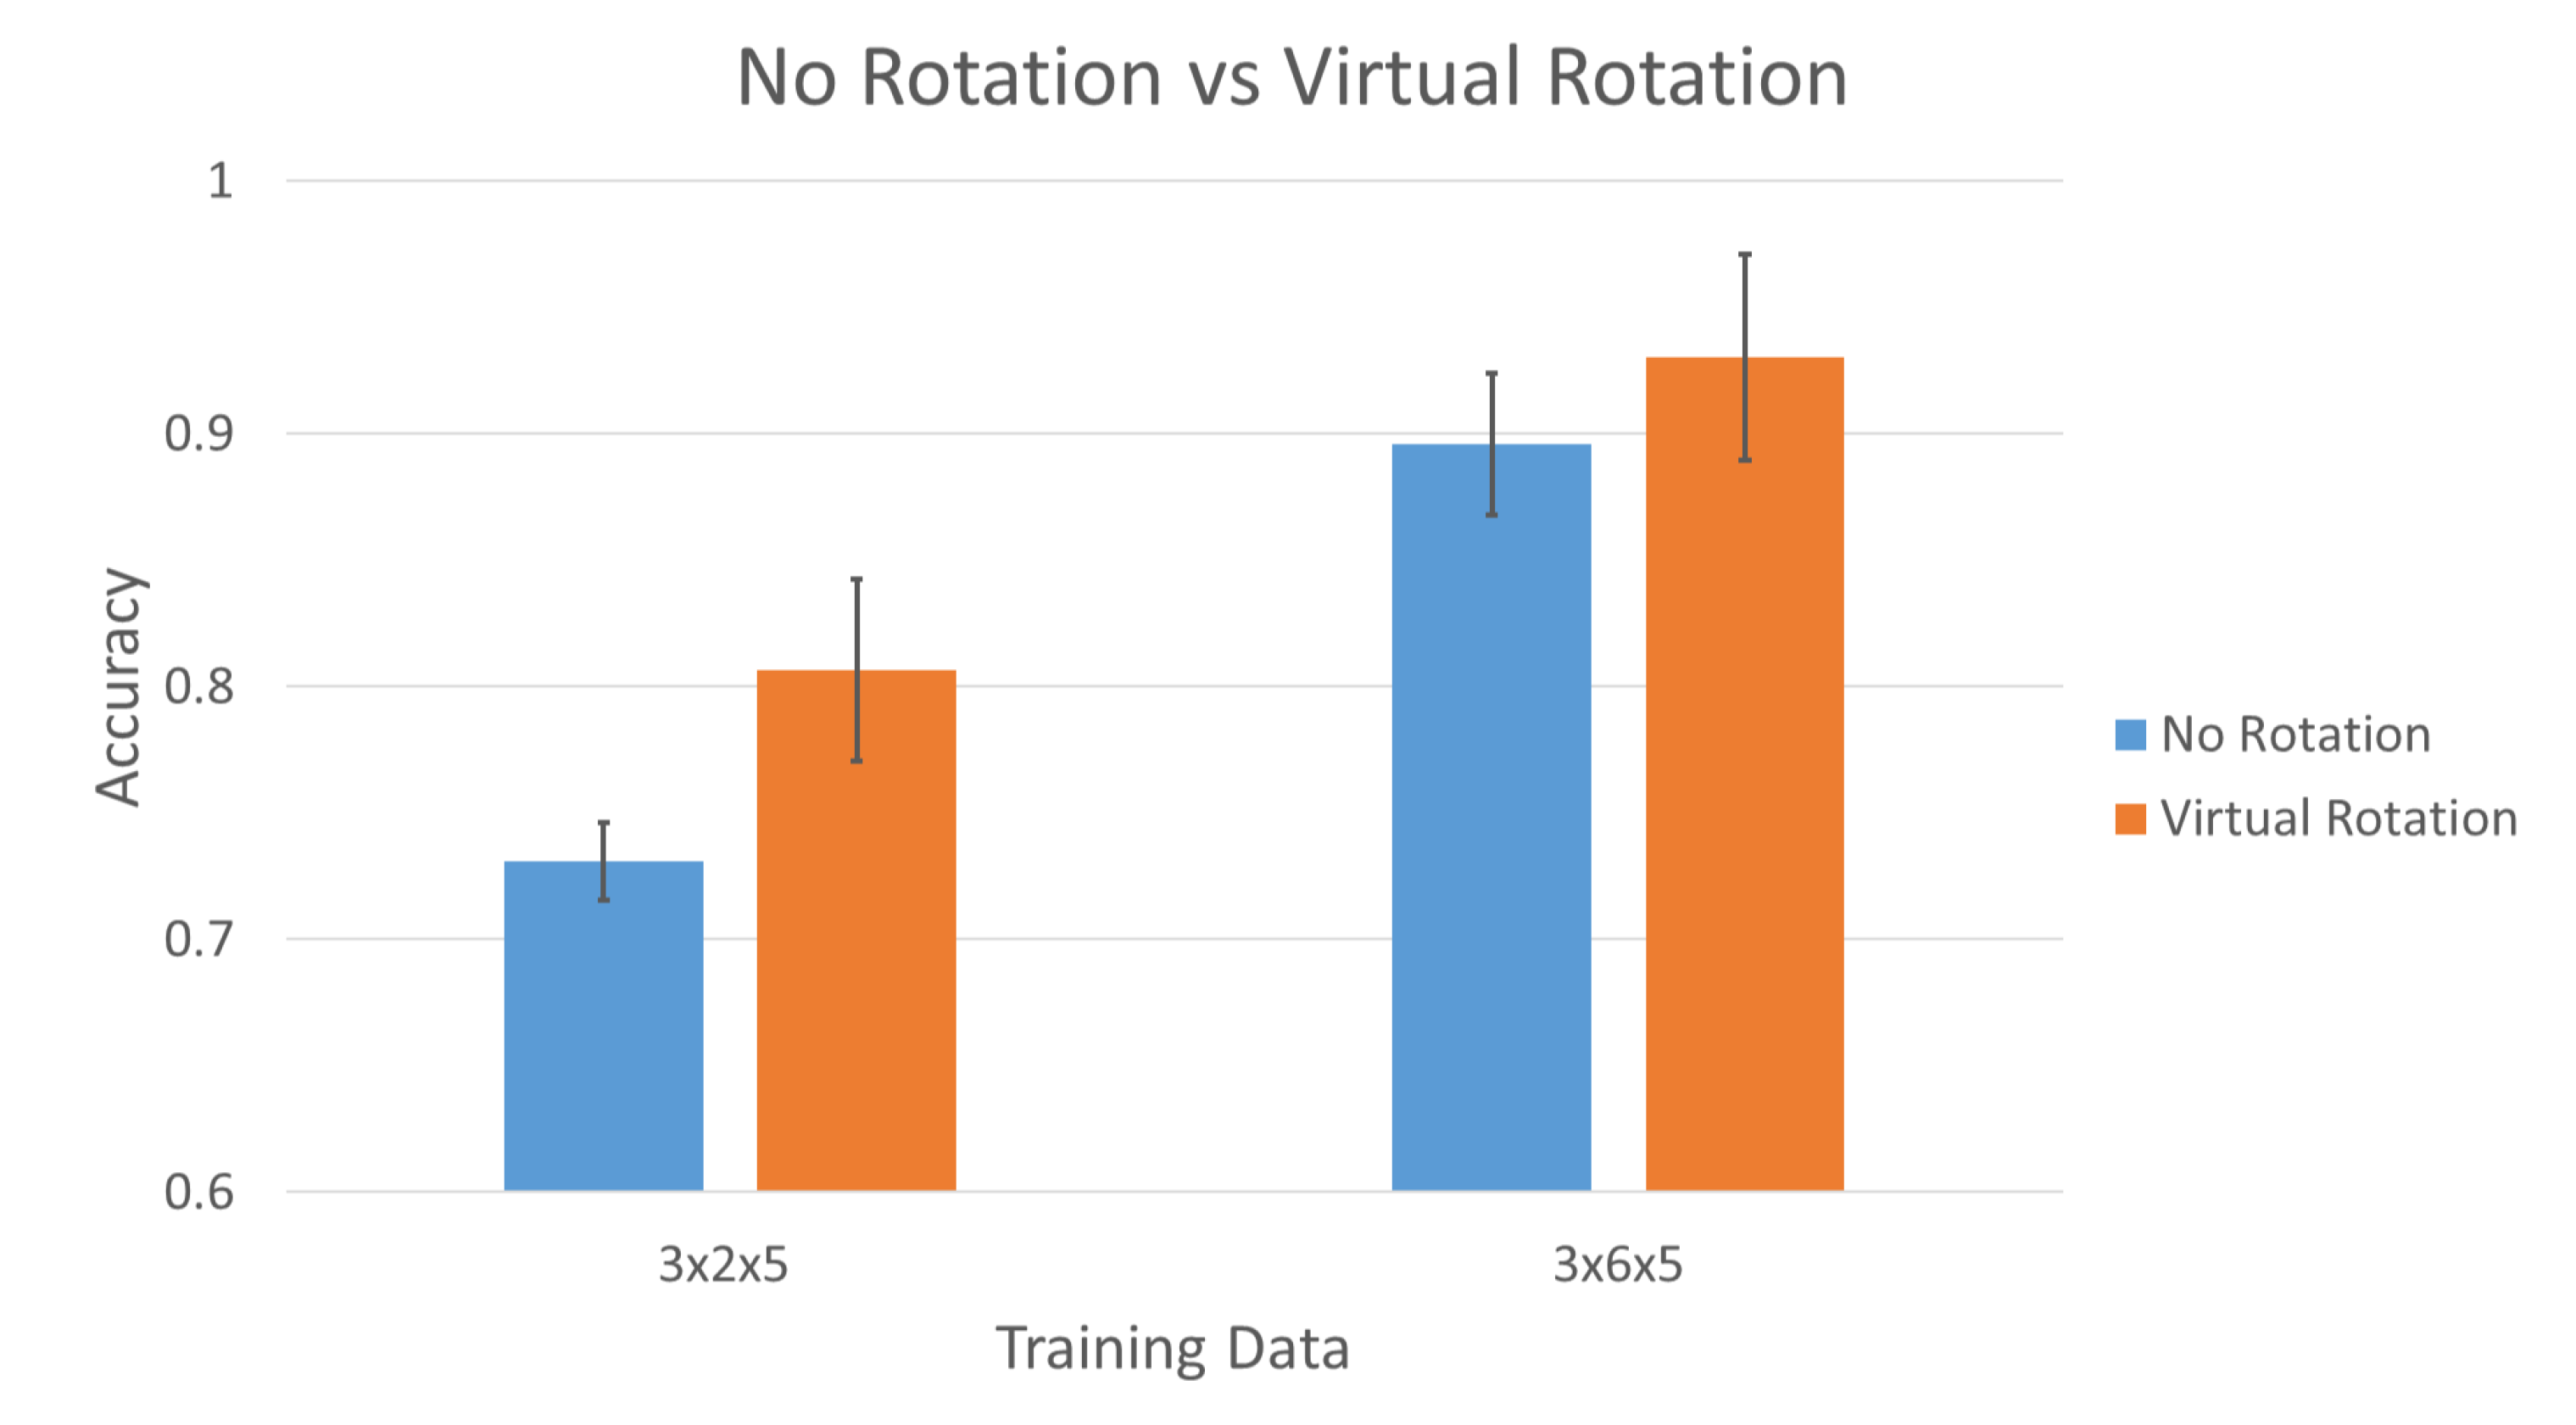
3.3. Virtual Rotation versus No Rotation

Figure 11 show the comparison of non-rotation training data versus virtually rotation training data. The training data set of the bars on the left consist of 3 scenarios × 6 fittings × 5 gestures, whereas the training data set of the bars on the right consist of 3 scenarios × 6 fittings × 5 gestures × 8 rotations. Both testing data sets consist of 3 scenarios × 2 fittings × 5 gestures. The data was trained with k-fold cross validation without overlapping. Cross validation was used to check the independence of the data. The non-rotation training data (blue bars) uses 2-fold cross validation:
  • Training = Session 1; Testing = Session 2.
  • Training = Session 2; Testing = Session 1.
The virtually rotation training data (orange bars) uses 4-fold cross validation:
  • Training = Session 2,3,4; Testing = Session 1.
  • Training = Session 1,3,4; Testing = Session 2.
  • Training = Session 1,2,4; Testing = Session 3.
  • Training = Session 1,2,3; Testing = Session 4.
Both non-rotation and virtually rotation includes all 13 participants data. The average accuracy, FAR, and FRR are summarized in Table 2 of Section 3.5.

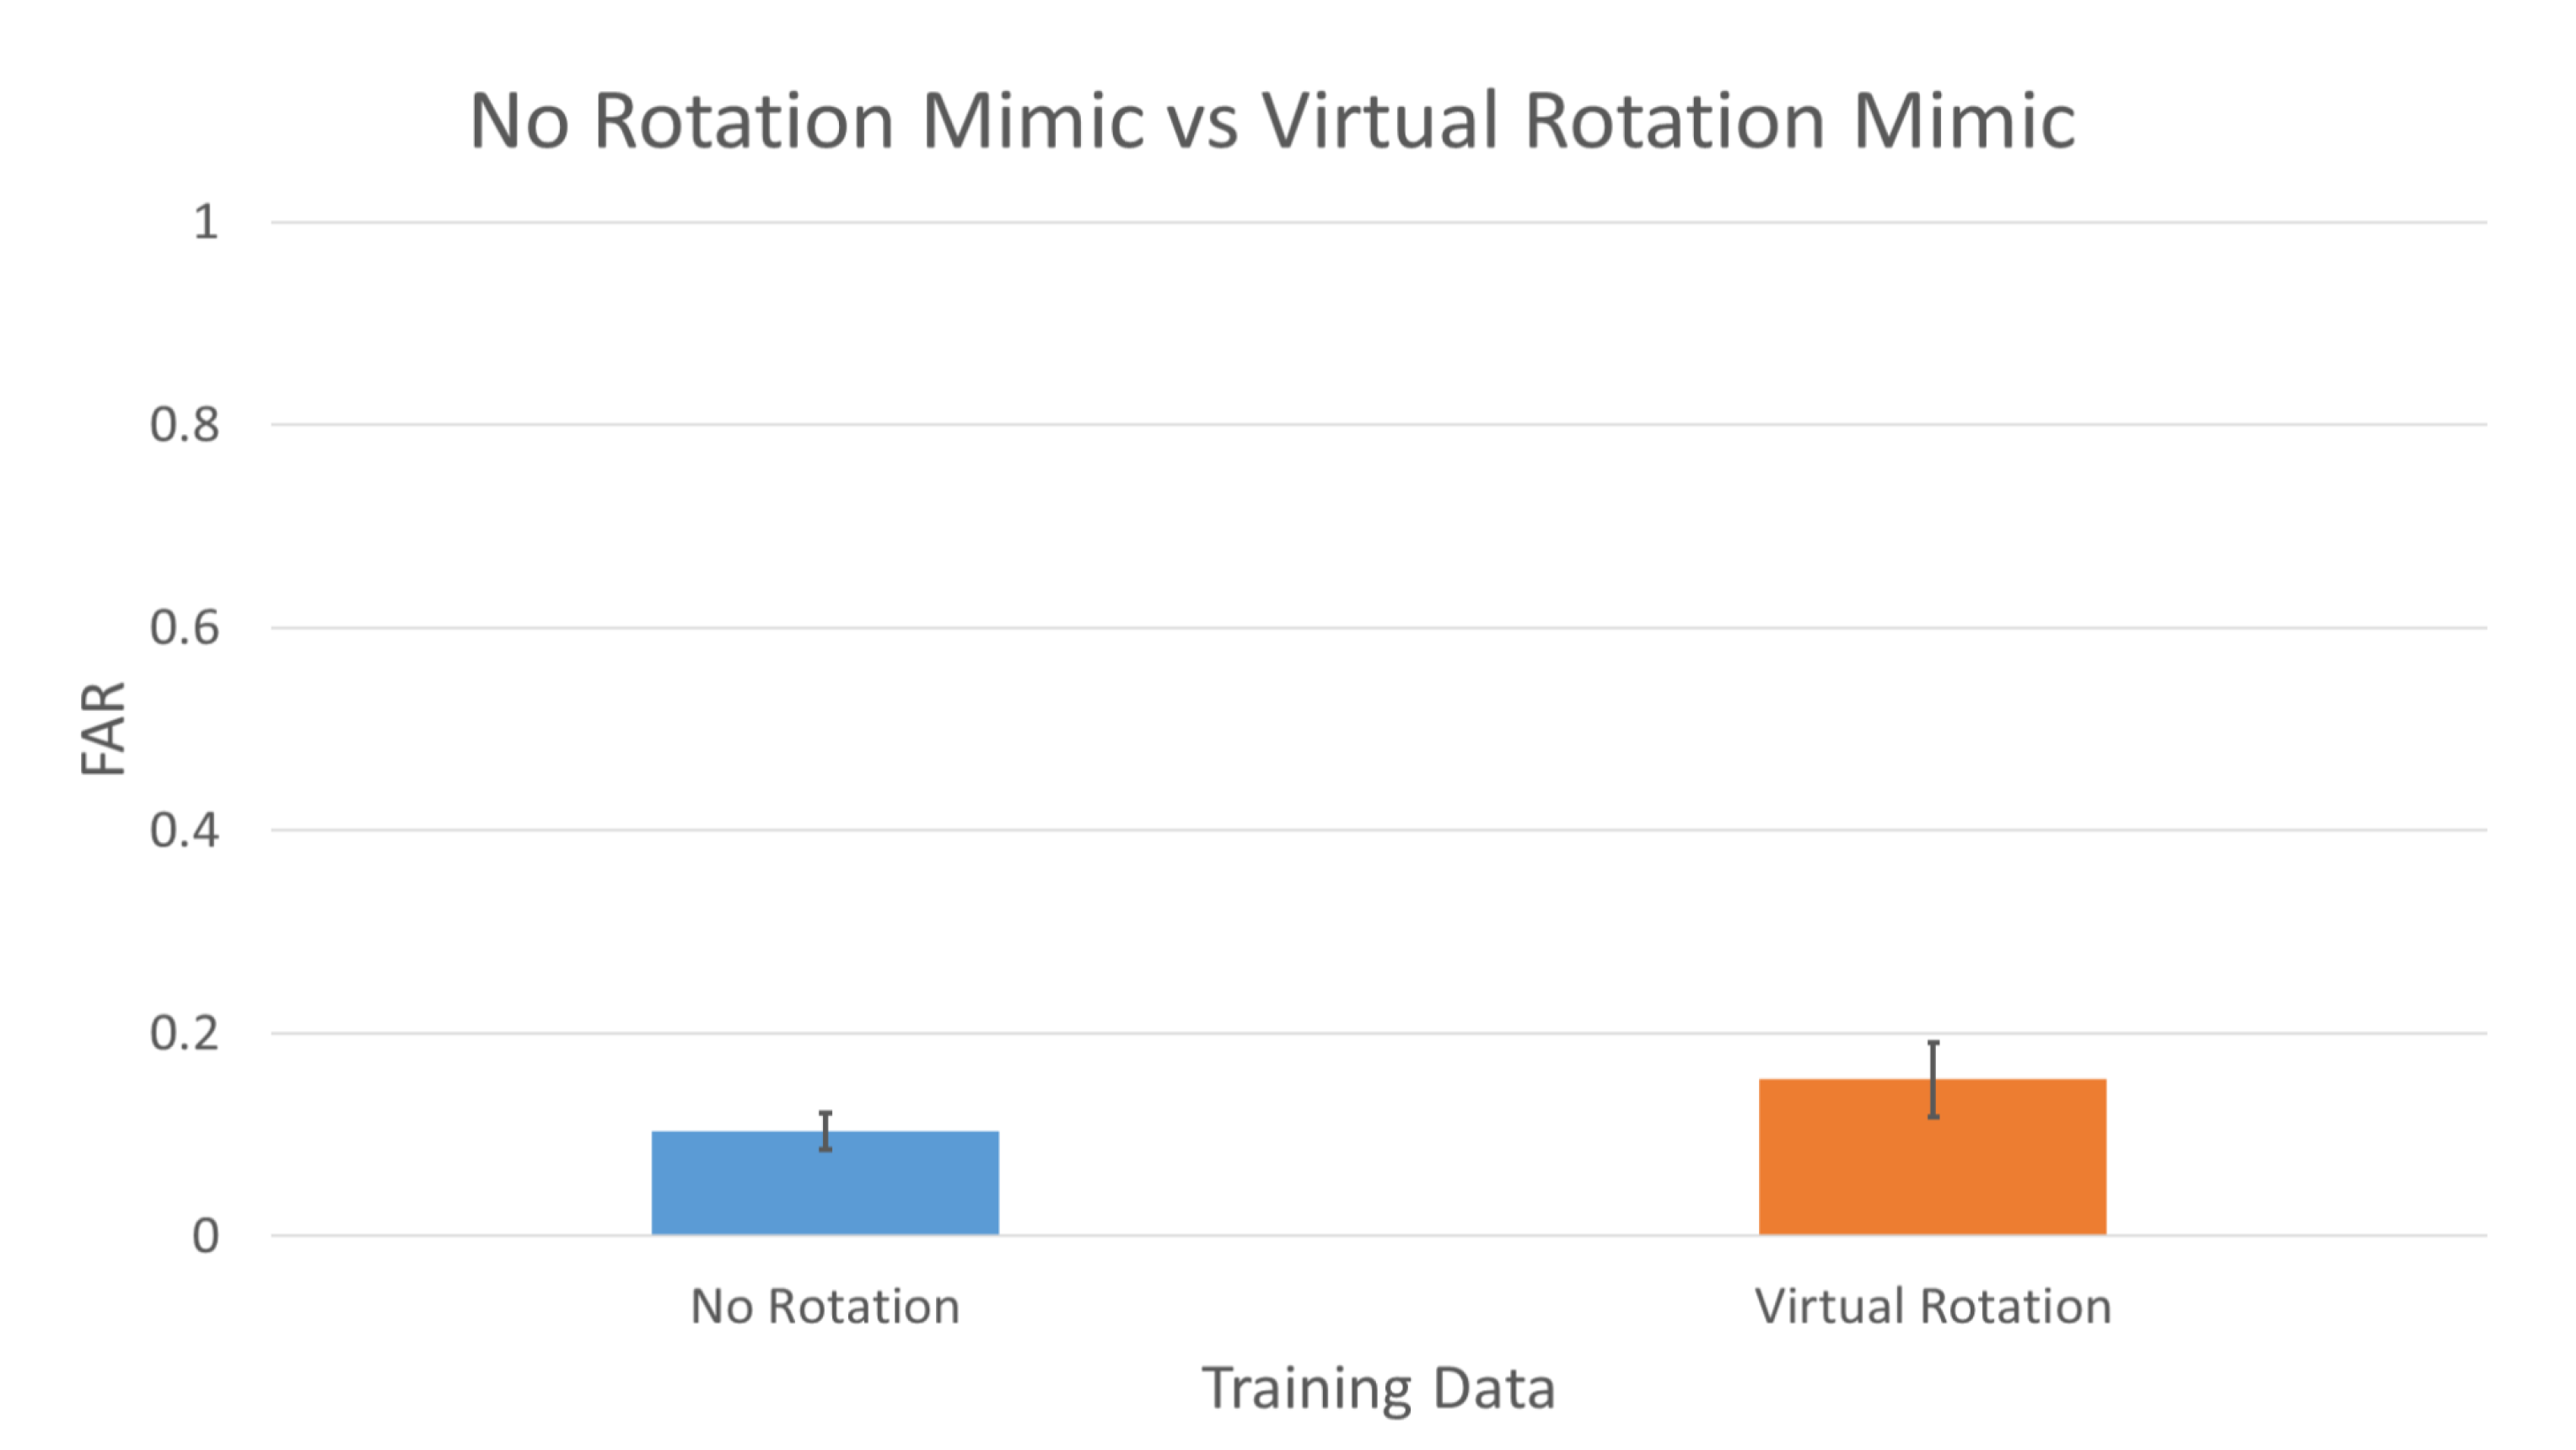
3.4. Virtual Rotation Mimic versus No Rotation Mimic

Figure 12 shows the results of participants mimicking other participants gestures. The analysis on this experiment is different from all the aforementioned experiments. Instead of authenticating genuine users, this experiment is to identify how many impostors were able to successfully authenticate as genuine users using their mimicking data. We will be using FAR – impostors being falsely authenticated as genuine users to analyze the results. The training data set consists of genuine user’s 3 scenarios × 8 fittings × 5 gestures and impostor’s 4 participants’ gesture × 3 scenarios × 1 fitting × 5 gestures (This excludes participant # 1 where there are 8 other participants’ gestures instead of 4.). Each genuine user’s data was mimicked by the impostor for 4 times. The testing data set consists of impostor’s 4 participants’ gestures × 1 fitting × 5 gestures (This excludes participant # 1 where there are 8 other participants’ gestures instead of 4). Both datasets were applied with 4-fold cross validation:
  • Training = All Genuine User Data + Impostors Mimic Data 2,3,4;
    Testing = Impostors Mimic Data 1.
  • Training = All Genuine User Data + Impostors Mimic Data 1,3,4;
    Testing = Impostors Mimic Data 2.
  • Training = All Genuine User Data + Impostors Mimic Data 1,2,4;
    Testing = Impostors Mimic Data 3.
  • Training = All Genuine User Data + Impostors Mimic Data 1,2,3;
    Testing = Impostors Mimic Data 4.
Blue bar shows the FAR with no rotation in the training data, whereas the orange bar shows the FAR with virtual rotation in the training data. Lower FAR indicates higher result. The average FAR is summarized in Table 2 of Section 3.5. As we are only trying to find out how many impostors were able to be authenticated as genuine users, there are no genuine users’ data in the testing phase; therefore, accuracy and FRR are omitted in the analysis.

3.5. Summary of Results

Table 2 shows the summary of the results of Section 3.1, Section 3.2, Section 3.3 and Section 3.4. The analysis of the results will be discussed in detail in Section 4.

4. Discussion

Table 2 shows the summary of the results. The first part of the table is the summary of Section 3.1, the second part is the summary of Section 3.2, the third part is the summary of Section 3.3, and the last part of the table is the summary of Section 3.4. The robustness of rhythmic-based dynamic hand gesture with sEMG can be analyzed by referring to the accuracy, where higher accuracy denotes higher robustness.
In Figure 8 and the first part of Table 2, it can be seen that different scenarios can have different accuracies, especially while in motion (walking), due to the difference in behavior. But, even with the differences, the accuracy is still 0.8692 at its lowest. This proves that intrapersonal difference is smaller than that of interpersonal difference in terms of different scenarios. With more training data and combination of scenarios in the training data, the difference can be less significant. This can be seen in Section 3.3 and the third part of the table, where all scenarios are trained together.
Section 3.2 and the second part of Table 2 shows that more training data does not necessary increase accuracy. This depends on the data being added into the training data set. This can be seen in Figure 9 and Figure 10, and the second part of the table, where the fitting of the EMG device plays a significant role in the effect of accuracy. Even though both training data have the same amount of data, the different fitting gesture yields higher results than multiple gestures in one fitting.
Section 3.3 Virtual rotation improves the accuracy especially when there are lesser training data. This can be seen in Figure 7 and the third part of Table 2 when training data is at 3 × 2 × 5, where the average accuracy are 0.7308 ± 0.0154 and 0.8066 ± 0.0361 respectively. The improvement will reduce as the training data increases as shown in Figure 7 and the third part of Table 2 when training data is at 3 × 6 × 5, with the average accuracy of 0.8960 ± 0.0280 and 0.9301 ± 0.0406 respectively.
Section 3.4 focuses on mimicking gesture to find out whether our method is able to detect the impostors trying to mimic genuine user’s gesture. Due to the unchangeable nature of static biometrics, once it is stolen or forged, it cannot be reset, which will lead to a high FAR [32,38,39], and higher FAR indicates lower result. But, in dynamic biometrics, even when an impostor tries to mimic another individual’s gesture, the system is able to differentiate whether the gesture belongs to the genuine user or the impostor due to the difference in behavior. This can be seen in our result shown in Figure 12 and the last part of Table 2. Our method has an FAR of as low as 0.1038 ± 0.0179 when no virtual rotation is implemented in the training data. It outperforms that of stolen or forged static biometrics, which can be seen in Reference [38], where forged fingerprint has a FAR of more than 0.67. In addition, the user has the choice to change their behavior or gesture even after their data has been successfully compromised, unlike static biometrics, which are unchangeable. Interestingly, when virtual rotation is implemented, it increases in FAR to 0.1545 ± 0.0365. The virtual rotation increases the threshold, which increases the accuracy or true acceptance rate (TAR), thus authenticating genuine user correctly, but, at the same time, increases the FAR, thus authenticating impostors as genuine user, which is a common trade off.
A suggestion of using the virtual rotation is during the cold start, where training data is insufficient. After sufficient amount of training data has been collected, the virtual rotation seems to be insignificant in terms of increasing the TAR; thus, it should be removed to decrease the FAR.
For future work, we plan to capture more data in a longer period of time (more than 6 months). With the data, we will then be split each individual’s data into chunks based on time order to be trained and test. This is to evaluate and analyze if there are any changes in the behavior over those periods of time. In addition, by doing so, we will be able to predict the past and the present gesture data. This can also be used to create impostor’s data without actual impostor’s data (i.e., the genuine user’s past gesture data will be considered as no longer the genuine data and thus rejects any data that is being predicted as the past gesture data).

5. Materials

Our project is available online at https://github.com/wong-alex/robustness-rhythmic.

6. Conclusions

In this paper, we have shown that rhythmic-based dynamic hand gesture with sEMG is robust in different conditions and scenarios. Non-motion and motion scenarios do show some differences, but the system was able to correctly authenticate the genuine user at an accuracy of 0.8692 and above. Due to the different position of the sensors in each fitting, more data of different fittings should be trained to increase the accuracy, which has been shown in our experiment from 0.7377 to 0.8723. However, if there is insufficient data, virtual rotation can be implemented to increase the TAR; however, be wary of the trade-off, where the FAR will also increase. Thus, once sufficient training data is obtained, virtual rotation has to be removed. Lastly, our method has shown a low FAR of 0.1038 ± 0.0179, even when genuine user’s gesture has been mimicked by impostors. Because of the simplicity and robustness of rhythmic-based dynamic hand gesture, it can be easily applied with, and help to improve, other authentication methods.

Author Contributions

A.M.H.W. is the main designer and writer of the research, M.F. and T.M. are responsible for supervision and reviewing the manuscript. All authors have read and agreed to the published version of the manuscript.

Funding

This work was supported by JSPS KAKENHI Grant-in-Aid for Scientific Research(A) Grant Number 19H01121.

Conflicts of Interest

The authors declare no conflict of interest.

Abbreviations

The following abbreviations are used in this manuscript:
EMGelectromyography
sEMGsurface electromyography
FARfalse acceptance rate
FRRfalse rejection rate
TARtrue acceptance rate

References

  1. Liu, C.; Clark, G.D.; Lindqvist, J. Where Usability and Security Go Hand-in-Hand: Robust Gesture-Based Authentication for Mobile Systems. In Proceedings of the 2017 CHI Conference on Human Factors in Computing Systems, New York, NY, USA, 6–11 May 2017; pp. 374–386. [Google Scholar] [CrossRef] [Green Version]
  2. Ometov, A.; Bezzateev, S.; Mäkitalo, N.; Andreev, S.; Mikkonen, T.; Koucheryavy, Y. Multi-Factor Authentication: A Survey. Cryptography 2018, 2, 1. [Google Scholar] [CrossRef] [Green Version]
  3. Harini, N.; Padmanabhan, T.R. 2CAuth: A New Two Factor Authentication Scheme Using QR-Code. Int. J. Eng. Technol. 2013, 5, 1087–1094. [Google Scholar]
  4. Abhishek, K.; Roshan, S.; Kumar, P.; Ranjan, R. A Comprehensive Study on Multifactor Authentication Schemes. In Advances in Intelligent Systems and Computing; Springer: Berlin, Germany, 2013; Volume 177, pp. 561–568. [Google Scholar] [CrossRef]
  5. Ogbanufe, O.; Kim, D.J. Comparing Fingerprint-Based Biometrics Authentication versus Traditional Authentication Methods for e-Payment. Decis. Support Syst. 2018, 106, 1–14. [Google Scholar] [CrossRef]
  6. Porubsky, J. Biometric Authentication in M-Payments: Analysing and Improving End-Users’ Acceptability. Master’s Thesis, Luleå University of Technology, Luleå, Sweden, 2020. [Google Scholar]
  7. Normalini, M.K.; Ramayah, T. Biometrics Technologies Implementation in Internet Banking Reduce Security Issues? Procedia Soc. Behav. Sci. 2012, 65, 364–369. [Google Scholar] [CrossRef] [Green Version]
  8. Porwik, P. The Biometric Passport. The Technical Requirements and Possibilities of Using. In Proceedings of the 2009 International Conference on Biometrics and Kansei Engineering, Cieszyn, Poland, 25–28 June 2009; pp. 65–69. [Google Scholar] [CrossRef]
  9. Malík, D.; Drahansk, M. Anatomy of Biometric Passports. J. Biomed. Biotechnol. 2012, 2012, 490362. [Google Scholar] [CrossRef]
  10. Zaharis, A.; Martini, A.; Kikiras, P.; Stamoulis, G. User Authentication Method and Implementation Using a Three-Axis Accelerometer. Lect. Notes Inst. Comput. Sci. Soc. Telecommun. Eng. 2010, 45, 192–202. [Google Scholar] [CrossRef]
  11. O’Gorman, L. Comparing Passwords, Tokens, and Biometrics for User Authentication. Proc. IEEE 2003, 91, 2021–2040. [Google Scholar] [CrossRef]
  12. Janakiraman, R.; Sim, T. Keystroke Dynamics in a General Setting. Lect. Notes Comput. Sci. 2007, 4642, 584–593. [Google Scholar] [CrossRef] [Green Version]
  13. Ho, J.; Kang, D.K. Sequence Alignment of Dynamic Intervals for Keystroke Dynamics Based User Authentication. In Proceedings of the 2014 Joint 7th International Conference on Soft Computing and Intelligent Systems (SCIS) and 15th International Symposium on Advanced Intelligent Systems, Kitakyushu, Japan, 3–6 December 2014; pp. 1433–1438. [Google Scholar] [CrossRef]
  14. Wong, A.M.H.; Furukawa, M.; Ando, H.; Maeda, T. Dynamic Hand Gesture Authentication Using Electromyography (EMG). In Proceedings of the 2020 IEEE/SICE International Symposium on System Integration (SII), Honolulu, HI, USA, 12–15 January 2020; pp. 300–304. [Google Scholar] [CrossRef]
  15. Visconti, P.; Gaetani, F.; Zappatore, G.A.; Primiceri, P. Technical Features and Functionalities of Myo Armband: An Overview on Related Literature and Advanced Applications of Myoelectric Armbands Mainly Focused on Arm Prostheses. Int. J. Smart Sens. Intell. Syst. 2018, 11, 1–25. [Google Scholar] [CrossRef] [Green Version]
  16. Merletti, R.; Farina, A. Analysis of Intramuscular Electromyogram Signals. Philos. Trans. R. Soc. A Math. Phys. Eng. Sci. 2009, 367, 357–368. [Google Scholar] [CrossRef]
  17. Schofield, J.R. Electrocardiogram Signal Quality Comparison Between a Dry Electrode and a Standard Wet Electrode over a Period of Extended Wear. Master’s Thesis, Cleveland State University, Cleveland, OH, USA, 2012. [Google Scholar]
  18. Laferriere, P.; Lemaire, E.D.; Chan, A.D.C. Surface Electromyographic Signals Using Dry Electrodes. IEEE Trans. Instrum. Meas. 2011, 60, 3259–3268. [Google Scholar] [CrossRef]
  19. Ives, J.C.; Wigglesworth, J.K. Sampling Rate Effects on Surface EMG Timing and Amplitude Measures. Clin. Biomech. 2003, 18, 543–552. [Google Scholar] [CrossRef]
  20. Phinyomark, A.; Scheme, E. A Feature Extraction Issue for Myoelectric Control Based on Wearable EMG Sensors. In Proceedings of the IEEE Sensors Applications Symposium (SAS), Seoul, Korea, 12–14 March 2018; pp. 1–6. [Google Scholar] [CrossRef]
  21. Wong, A.M.H.; Kang, D.K. Stationary Hand Gesture Authentication Using Edit Distance on Finger Pointing Direction Interval. Sci. Program. 2016, 2016, 427980. [Google Scholar] [CrossRef]
  22. Kuo, A.D.; Donelan, J.M. Dynamic Principles of Gait and Their Clinical Implications. Phys. Ther. 2010, 90, 157–174. [Google Scholar] [CrossRef] [Green Version]
  23. El-abed, M.; Charrier, C.; Rosenberger, C. Evaluation of Biometric Systems. In New Trends and Developments in Biometrics; Yang, J., Xie, S.J., Eds.; IntechOpen: London, UK, 2012; pp. 149–169. [Google Scholar] [CrossRef] [Green Version]
  24. Roslan, N.I.; Salimin, N.; Idayu Mat Roh, N.S.; Anini Mohd Rashid, N. Possible Conditions of FTE and FTA in Fingerprint Recognition System and Countermeasures. In Proceedings of the 2018 4th International Conference on Computer and Information Sciences (ICCOINS), Kuala Lumpur, Malaysia, 13–14 August 2018; pp. 1–5. [Google Scholar] [CrossRef]
  25. Hariri, W. Efficient Masked Face Recognition Method during the COVID-19 Pandemic. Research Square. 2020. Available online: https://www.researchsquare.com/article/rs-39289/v2 (accessed on 12 December 2020).
  26. Anwar, A.; Raychowdhury, A. Masked Face Recognition for Secure Authentication. arXiv 2020, arXiv:2008.11104. [Google Scholar]
  27. Connor, P.; Ross, A. Biometric Recognition by Gait: A Survey of Modalities and Features. Comput. Vis. Image Underst. 2018, 167, 1–27. [Google Scholar] [CrossRef]
  28. Bartuzi, P.; Tokarski, T.; Roman-Liu, D. The Effect of the Fatty Tissue on EMG Signal in Young Women. Acta Bioeng. Biomech. 2010, 12, 87–92. [Google Scholar]
  29. Ptaszkowski, K.; Wlodarczyk, P.; Paprocka-Borowicz, M. The Relationship between the Electromyographic Activity of Rectus and Oblique Abdominal Muscles and Bioimpedance Body Composition Analysis—A Pilot Observational Study. Diabetes Metab. Syndr. Obes. Targets Ther. 2019, 12, 2033–2040. [Google Scholar] [CrossRef] [Green Version]
  30. Marasco, E.; Ross, A. A Survey on Antispoofing Schemes for Fingerprint Recognition Systems. ACM Comput. Surv. 2014, 47. [Google Scholar] [CrossRef]
  31. Ducray, B. Authentication by Gesture Recognition: A Dynamic Biometric Application. Ph.D. Thesis, Royal Holloway, University of London, London, UK, 2017. [Google Scholar]
  32. Hitchcock, D.C. Evaluation and Combination of Biometric Authentication. Master’s Thesis, University of Florida, Gainesville, FL, USA, 2003. [Google Scholar]
  33. Engelsma, J.J.; Cao, K.; Jain, A.K.; Fellow, L. Learning a Fixed-Length Fingerprint Representation. IEEE Trans. Pattern Anal. Mach. Intell. 2019. [Google Scholar] [CrossRef] [Green Version]
  34. Niwa, M.; Okada, S.; Sakaguchi, S.; Azuma, K.; Iizuka, H.; Ando, H.; Maeda, T. Detection and Transmission of “Tsumori”: An Archetype of Behavioral Intention in Controlling a Humanoid Robot. In Proceedings of the 20th International Conference on Artificial Reality and Telexistence (ICAT), University of South Australia, Adelaide, Australia, 1–3 December 2010; pp. 193–196. [Google Scholar]
  35. Peralta, D.; Triguero, I.; Sanchez-Reillo, R.; Herrera, F.; Benitez, J.M. Fast Fingerprint Identification for Large Databases. Pattern Recognit. 2014, 47, 588–602. [Google Scholar] [CrossRef]
  36. Sanchez, A.J.; Romero, L.F.; Tabik, S.; Medina-Pérez, M.A.; Herrera, F. A First Step to Accelerating Fingerprint Matching Based on Deformable Minutiae Clustering. Lect. Notes Comput. Sci. 2018, 11160, 361–371. [Google Scholar] [CrossRef] [Green Version]
  37. Qu, X.; Wei, T.; Peng, C.; Du, P. A Fast Face Recognition System Based on Deep Learning. In Proceedings of the 2018 11th International Symposium on Computational Intelligence and Design (ISCID), Hangzhou, China, 8–9 December 2018; Volume 1, pp. 289–292. [Google Scholar] [CrossRef]
  38. Matsumoto, T.; Matsumoto, H. Impact of Artificial Gummy Fingers on Fingerprint Systems. Opt. Secur. Counterfeit Deterrence Tech. 2002, 4677, 275–289. [Google Scholar]
  39. Yang, W.; Wang, S.; Hu, J.; Zheng, G.; Valli, C. Security and Accuracy of Fingerprint-Based Biometrics: A Review. Symmetry 2019, 11, 141. [Google Scholar] [CrossRef] [Green Version]
Figure 1. Rhythmic gesture by relaxing (left) and clenching (right) the fist.
Electronics 09 02143 g001
Figure 2. The scenarios used during the performance of the gesture: (a) Sitting scenario. (b) Standing scenario. (c) Walking scenario.
Electronics 09 02143 g002
Figure 3. Genuine user showing their rhythmic gesture to the impostor visually for mimicking.
Electronics 09 02143 g003
Figure 4. Samples of the raw signal (left) and processed signal (right) after being filtered using Butterworth low-pass filter and then resampled using linear interpolation.
Electronics 09 02143 g004
Figure 5. Two different gestures but with similar section, which can cause mismatching.
Electronics 09 02143 g005
Figure 6. The computational data.
Electronics 09 02143 g006
Figure 7. Virtual rotation of the 8 channels of electromyography (EMG) sensors in the neural network.
Electronics 09 02143 g007
Figure 8. Different training scenario with different testing scenario.
Electronics 09 02143 g008
Figure 9. The confusion matrices shown are: (a) 3 scenarios × 1 fitting × 5 gestures; (b) 3 scenarios × 5 fittings × 1 gesture.
Electronics 09 02143 g009
Figure 10. One-time fitting of Myo Armband versus multiple fittings of Myo Armband.
Electronics 09 02143 g010
Figure 11. Different training scenarios with different testing scenarios.
Electronics 09 02143 g011
Figure 12. Different training scenarios with different testing scenarios.
Electronics 09 02143 g012
Table 1. Comparisons between different types of biometrics.
Static BiometricsDynamic Biometrics
ComparisonsFingerprintFace RecognitionGaitCamera-Based Hand GestureRhythmic Hand Gesture with EMG
Gesture Performing TimeShort—1 s or lessShort—1 s or lessLong—few seconds to minutesMedium—1 to 5 sMedium—1 to 5 s
Failure to Acquire (FTA)High due to skin conditionHigh due to facial accessoriesHigh due to types of clothesMedium due to field of angle and obstructionLow but can be affected by body fat
Prone to MimickingMedium as it leaves latent printsEasy as it can be observedEasy to observe but require trainingEasy to observe but require trainingDifficult as it has little cues
ResettableNoNoYesYesYes
Amount of DataSmall—few kilobytesMedium—kilobytes to megabytesLarge—up to gigabytes with frequent updatesLarge—up to gigabytes with frequent updatesLarge—up to gigabytes with frequent updates
Table 2. Summary of the results.
TrainingTestingRotationCross ValidationAccuracyFARFRR
(Scenarios × Fittings × Gestures)
Sit × 8 × 5Stand × 8 × 5NoNo0.93600.00570.0640
Sit × 8 × 5Walk × 8 × 5NoNo0.86920.01110.1308
Stand × 8 × 5Sit × 8 × 5NoNo0.91380.00780.0862
Stand × 8 × 5Walk × 8 × 5NoNo0.88310.00990.1169
Walk × 8 × 5Sit × 8 × 5NoNo0.88690.00980.1131
Walk × 8 × 5Stand × 8 × 5NoNo0.89900.00850.1010
3 × 1 × 53 × 2 × 5NoNo0.73770.02170.2623
3 × 5 × 13 × 2 × 5NoNo0.87230.01060.1277
3 × 2 × 53 × 2 × 5No20.7308 ± 0.01540.0224 ± 0.00130.2692 ± 0.0154
3 × 2 × 53 × 2 × 5Yes20.8066 ± 0.03610.0161 ± 0.00300.1934 ± 0.0361
3 × 6 × 53 × 2 × 5No40.8960 ± 0.02800.0087 ± 0.00230.1041 ± 0.0280
3 × 6 × 53 × 2 × 5Yes40.9301 ± 0.04060.0058 ± 0.00340.0698 ± 0.0407
Genuine + ImpostorMimic
3 × 8 × 5 + 3 × 1 × 51 × 1 × 5No4N/A0.1038 ± 0.0179N/A
3 × 8 × 5 + 3 × 1 × 51 × 1 × 5Yes4N/A0.1545±0.0365N/A
Publisher’s Note: MDPI stays neutral with regard to jurisdictional claims in published maps and institutional affiliations.

