Article

Electromyography Pattern Likelihood Analysis for Flexion-Relaxation Phenomenon Evaluation

Department of Information Engineering (DII), Università Politecnica delle Marche, 60131 Ancona, Italy
*
Author to whom correspondence should be addressed.
Electronics 2020, 9(12), 2046; https://doi.org/10.3390/electronics9122046
Submission received: 26 October 2020 / Revised: 24 November 2020 / Accepted: 28 November 2020 / Published: 2 December 2020

Abstract

:
The myoelectric activity of the back muscles can be studied to evaluate the flexion-relaxation phenomenon and find differences between electromyography patterns on different subjects. In this paper, we propose an algorithm able to provide a myoelectric silence evaluation based on the data acquired from a wireless body sensor network consisting of surface electromyography sensors in association with a wearable inertial measurement unit. From the study group was chosen a gold standard subject, a healthy control with the best regular patterns, as a reference to find a first validity range. Through the subsequent iterations, the range was modified to include the other healthy subjects who showed muscle relaxation according to the previous ranges. Through this likelihood analysis, we want to compare patterns on different channels, identified by the electromyography root mean squared values, to study and find with iterations a validity range for the myoelectric activity silence identification and classification. The proposed algorithm was tested by processing the data collected in an acquisition campaign conducted to evaluate the flexion-relaxation phenomenon on the back muscles of subjects with and without lower back pain. The results show that the submitted method is significant for the clinical assessment of electromyography activity patterns to evaluate which are the subjects that have patterns near or far from the gold standard. This analysis is useful both for prevention and for assessing the progress of subjects with low back pain undergoing physiotherapy.

1. Introduction

Relaxation of the erector spinae occurs during the trunk full-flexion phase when the bending movement from standing is performed. This flexion-relaxation (FR) has traditionally been assessed by observing and analyzing surface electromyography (sEMG) signals when the subject bends toward a maximum voluntary flexion (MVF). Such a phenomenon, referred to as the flexion-relaxation phenomenon (FRP), typically manifests in healthy subjects and is often absent or disrupted (sEMG activity persists) in individuals reporting lower back pain (LBP) [1]. Surface electromyography is a non-invasive technique for assessing muscle activity that has played a major role in understanding the function of trunk muscles in healthy subjects and LBP patients during specific postures and movements [2]. The sEMG signal is composed by a summation of tissue-filtered signals generated by a number of concurrently active motor units, and it is very complex [3]. The generated motor unit action potentials (MUAPs) recorded on the skin surface vary in amplitude, duration, and frequency content [4].
Voluntary trunk flexion-extension (FE) is a symmetrical movement and could be used to reflect differences in neuromuscular control between sides. The symmetry index (SI) reflects the difference between the activation patterns of the trunk muscles. This index is important to find a muscle imbalance, and it can be used in the static position of the full-flexion phase during the flexion-relaxation test. Moreover, asymmetry is frequently mentioned as an important risk factor for the development of LBP problems [5,6].
The electromyographic signal amplitude has often been used to assess whether the level of muscle activity is abnormal in patients with pain [7,8], but the interpretation of the various results have conflicts. In fact, some studies have identified uni- and/or bi-lateral deviations in muscular activity in back muscles of patients with LBP compared with control subjects [9,10,11,12,13,14], whereas others have failed to identify differences in sEMG activity in paraspinal muscles of patients with LBP [15,16,17]. The sEMG signal is highly variable, and it is dependent on many factors such as the electrodes’ application and placement, perspiration and temperature, muscle fatigue, contraction velocity and muscle length, cross-talk from nearby muscles, activity in other synergists and antagonists, subcutaneous fat thickness, and a slight variation in task execution [18]. To reduce this variability, in the literature, sEMG normalization is used, where the sEMG activity is not expressed in absolute terms (μV), but as the activation percentage compared to the muscle’s activity during an isometric maximum voluntary contraction of the desired muscle. Normalization facilitates the comparison of sEMG signals across muscles, between subjects, or between the same subject over time [18].
As defined for gait analysis by Halim et al., there are statistical methods or discrete measurement methods, but it is not possible to recommend the best method considering various factors such as the subjects involved, the joint of interest, and the purpose of the study [19].
To date, we need to better understand the sEMG patterns of the longissimus and multifidus muscles and the differences observed between LBP subjects and healthy controls. In order to explore the differences in patterns and bilateral trunk muscle activation between patients with lower back pain and healthy controls, this study investigates the RMS sEMG values during the flexion-extension test. In our previous studies, bilateral trunk muscle activation’s were collected by surface electromyography (sEMG) during the trunk full-flexion phase evaluated using sEMG sensors and an inertial measurement unit (IMU) [20,21]. The objectives of this study were to provide full-flexion sEMG patterns of trunk muscles using 25 subjects (healthy and LBP patients) during the flexion–extension movement and find the RMS validity range (defined by an upper and lower cut-off value) to establish FRP presence (if the value is inside the range) or absence (if the value is outside the range).
In this study, we focus on the sEMG patterns during the full-flexion phase also called in the literature MVF (maximum voluntary flexion). To distinguish normal from abnormal patterns, we can calculate the RMS value of the sEMG signal during this phase and compare it with a cut-off reference threshold value (or better, as we can see later a validity range). Neblett et al. tried to answer the question about what is the best sEMG measure of lumbar flexion-relaxation to distinguish chronic lower back pain patients (CLBP) from healthy controls [22]. In their first study, the cut-off RMS value was quantified as 3.2 μV [23]. This threshold value was also used by Alison et al. [24]. Then, as a result of further empirical investigation and the inclusion of additional control subjects, three-point five microvolts was determined to be the best cutoff point for determining flexion-relaxation, placing the electrodes vertically on the left and right erector spinae muscles at L3 (approximately 2 cm from the midline) [25]. Other authors have reported similar sEMG cut-off levels, ranging from 2.0 μV to 3.5 μV [26,27,28], depending on the muscle sites being measured and the assessment procedure or biofeedback training protocol utilized (for example, Neblett et al. used a frequency response of 20–500 Hz and an averaging factor of 0.5 s for signal smoothing [22], while we use a passband filter between 30 and 450 Hz [21,29,30,31]). Alison et al. concluded that although visual inspection, threshold, or ratio methods performed well and may be appropriate for either biomechanical or clinical research, the threshold method provided the optimal trade-off among performance, consistency, and feasibility [24]. However, in the literature, sometimes, it is not clear how the threshold values were defined (for example, theTHR1 reported by Alison). Therefore, we propose a new technique to identify the threshold range and classify the FRP presence/absence in each cycle.
To find the full-flexion phase, we used our previous studies [20,21] implementing new features, as explained later. The purpose of this paper is to investigate the sEMG variability for the back muscles starting from the gold standard used as the first reference and adjusting through iterations the RMS validity range. This range is statistically identified by the mean RMS sEMG value during the full-flexion and the standard deviation (SD). The upper limit of the range is used as a cut-off reference beyond which the FRP is considered absent. This statistical approach can be used as an alternative, compared to the visual inspection (VIS) and flexion-relaxation ratio (FRR) methods, to automatically find FRP with the flexion-relaxation test.
The sEMG variability due to the factors previously expressed can be controlled using a standardized protocol that is well defined. The main problem that we can have using the sEMG absolute value without normalization is the skin resistance between the sensor and the muscle (which is a physical characteristic), especially due to adipose tissue, which can affect the sEMG reading [22]. The subcutaneous fat layer acts as a spatial filter, increasing the distance between the electrode and source and thus smoothing the surface potential over the region of active muscle and reducing the amplitude of the surface sEMG [32]. For this reason, we also defined the lower threshold to increase the reliability. When the subject has a large amount of adipose tissue, with respect to the normal cases, the signal is very low and goes under the lower threshold level (therefore, it is reported by the algorithm). The lower threshold is also useful to understand if there are signal anomalies for example unstable contacts between the electrodes and skin, which can cause very low RMS values. The shape of the signal can be evaluated by comparing the RMS values between the segments and between the cycles, as we will show below.

2. Measurement System, Positioning, and Acquisition Protocol

The instruments used were the zerowire sEMG wireless system (produced by Cometa) and the inertial measurement unit (produced by x-io Technologies Limited), as reported in Figure 1. The muscle activity was collected using wireless surface EMG electrodes using well-known electrode placement protocols [33].
As defined below, the electrodes were accurately positioned on the muscles to be analyzed as established by the scientific literature [33].

2.1. Longissimus Muscles

Longissimus muscles are part of the erector muscles of the vertebral column, together with the iliocostal and spinal muscles [33]. Their features are:
  • Muscle: erector spinae
  • Subdivision: longissimus (semispinalis back)
  • Abbreviation (convention): LSXfor the left muscle and LDXfor the right muscle
  • Channel (convention): Channel 1 is the LSX channel, while Channel 2 is the LDX channel
  • Origin: in the lumbar region, it merges with the iliocostalis of the loins on the posterior surfaces of the transverse processes and the accessory processes of the lumbar vertebrae and on the anterior aspect of the thoraco-lumbar fascia
  • Insertion: through tendons on the tips of the transverse processes of all thoracic vertebrae and on the inferior part of the ninth and tenth rib between the tubercle and the costal angle
  • Function: extension of the trunk
  • Reference position: pronounced with the lumbar part of the slightly flexed column
  • Electrode dimensions: no more than 10 mm in the direction of the fibers
  • Inter-electrode distance: 20 mm
  • Electrode placement:
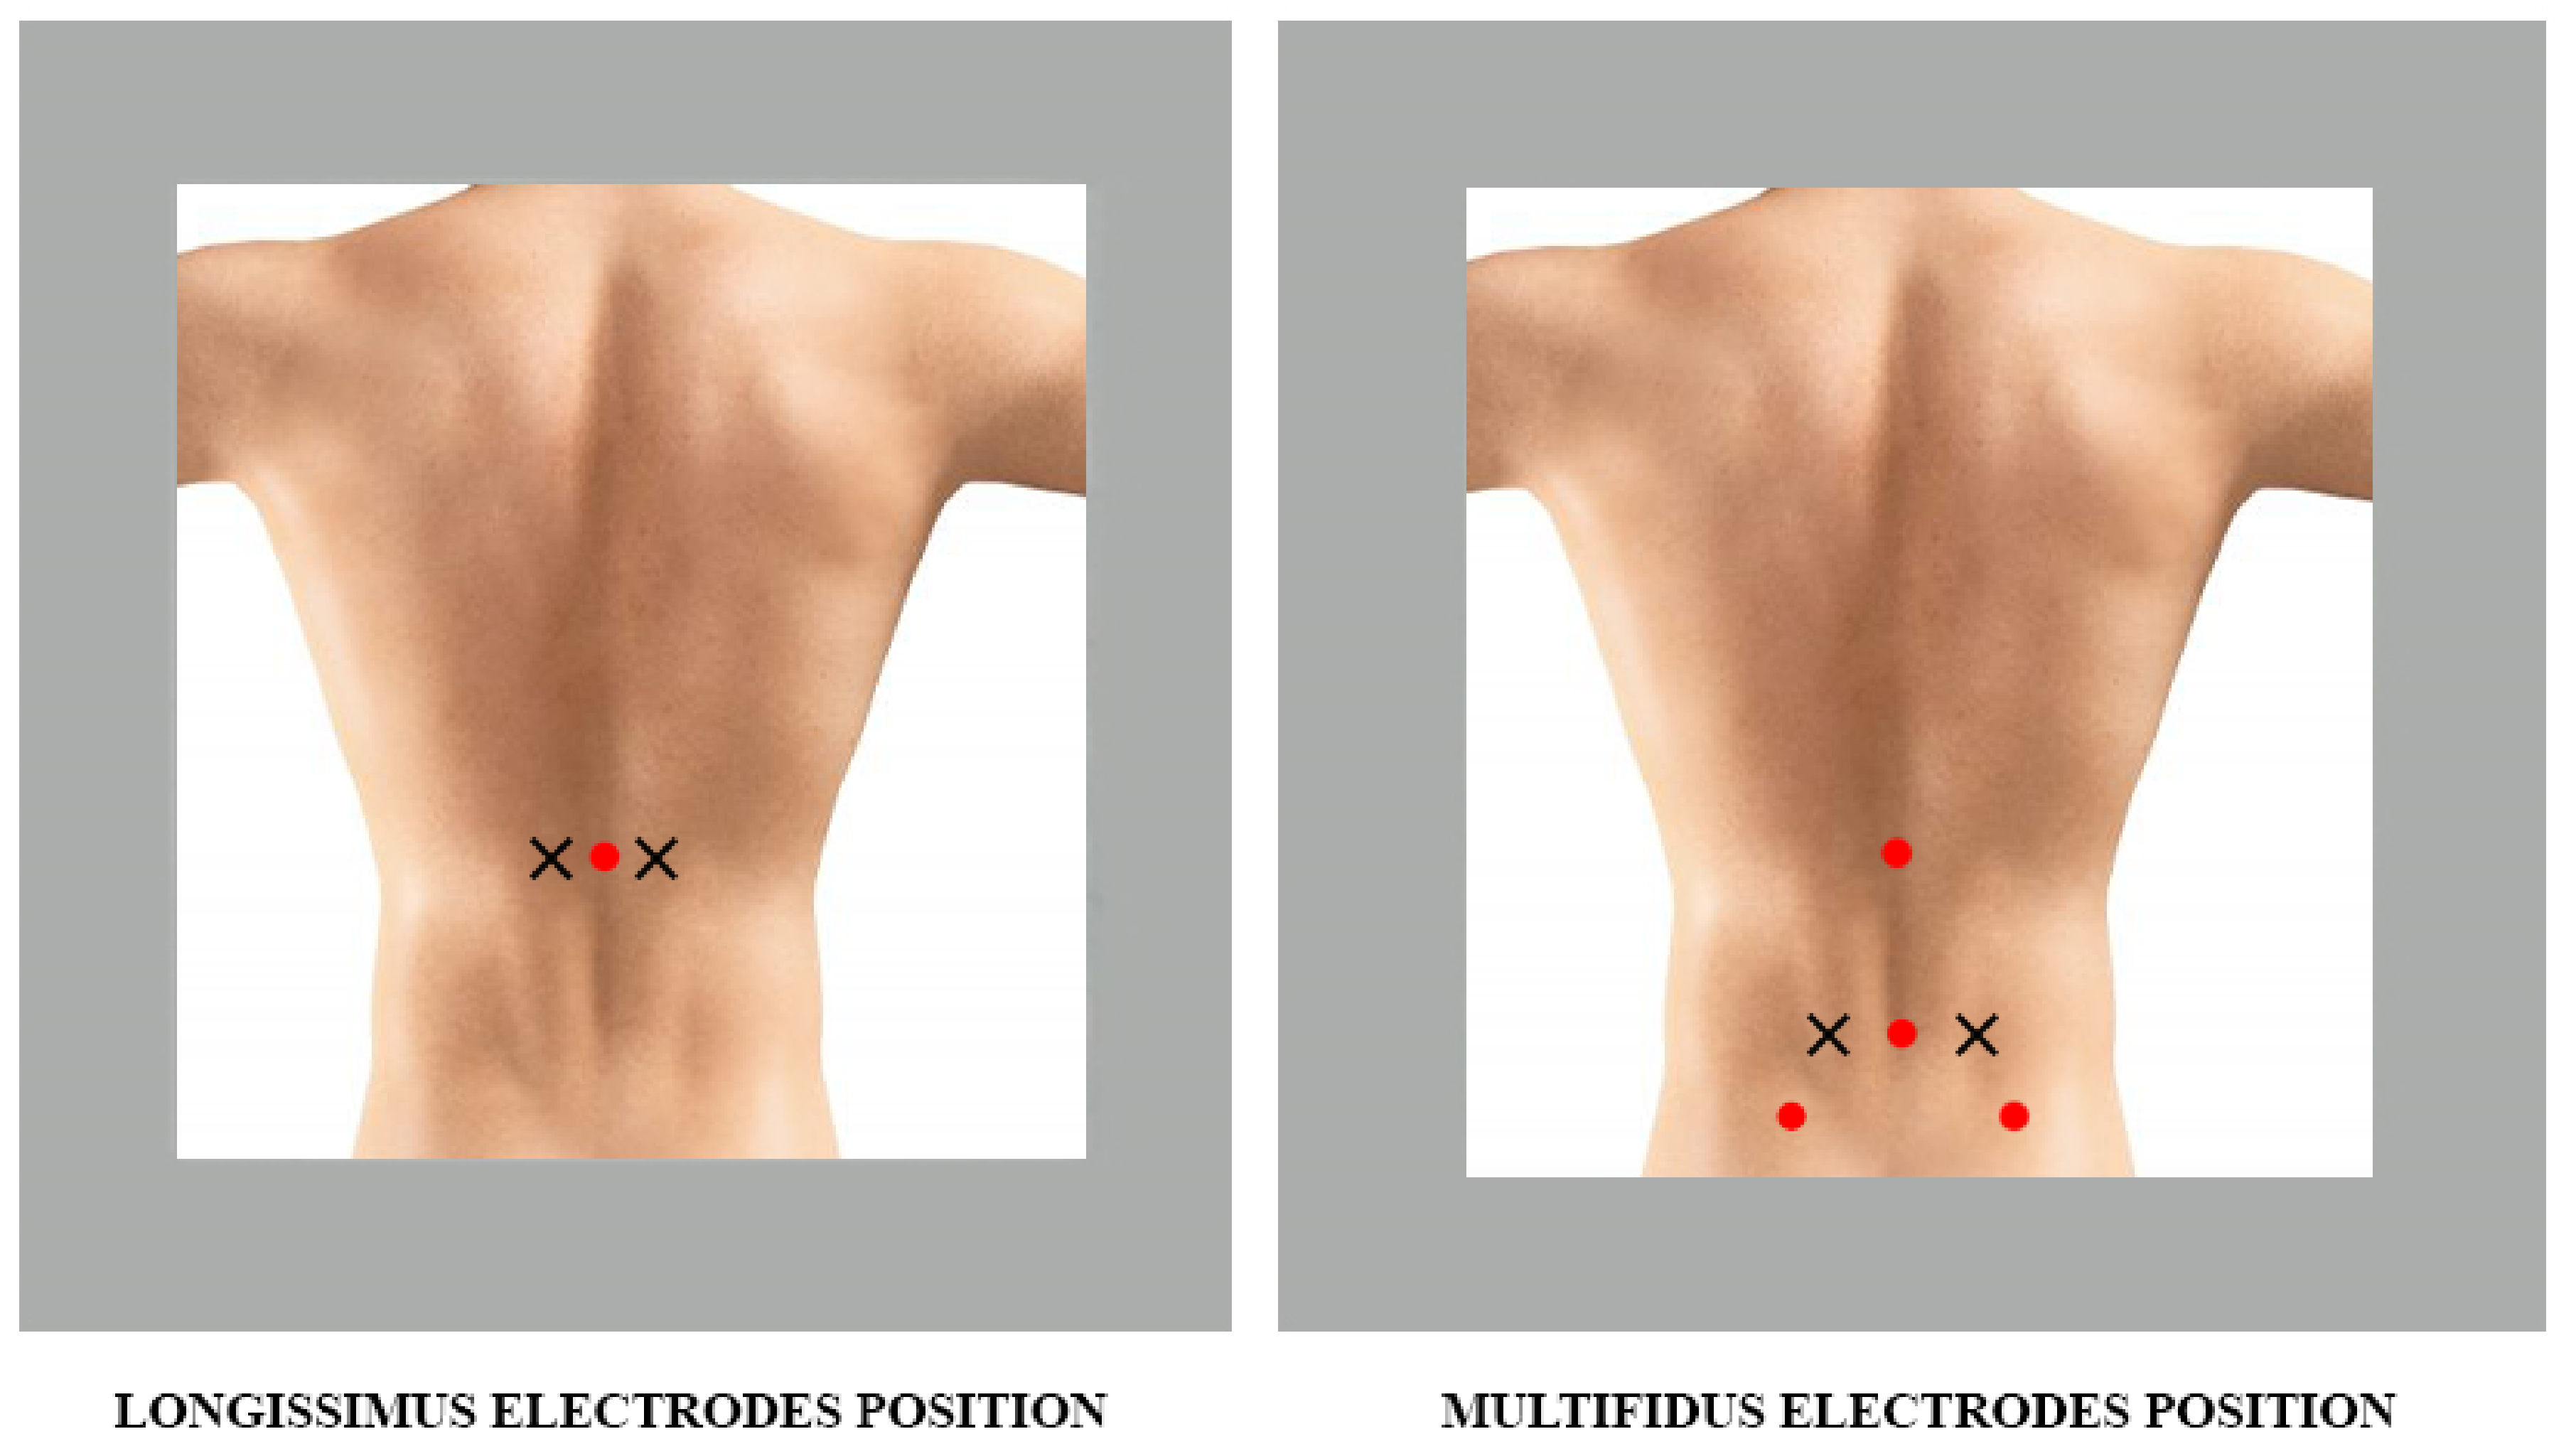
    Position: two fingers apart in a lateral direction from the spinous process L1 (Figure 2)
    Fastening: double-sided tape or rings
    Reference electrode: C7 spinous process
    Clinical test: lifting the trunk from the prone position

2.2. Multifidus Muscles

Multifidus muscles are part of the deep muscles of the trunk as they are in close contact with the spine [33]. Features:
  • Muscle: multifidus (spiny transverse)
  • Abbreviation (convention): MSXfor the left muscle and MDXfor the right muscle
  • Channel (convention): Channel 3 is the MSX channel, while Channel 4 is the MDX channel
  • Origin: spinous processes of L1-L5
  • Insertion: processes of the L4-S1 vertebrae; iliac crest and dorsal surface of the sacrum
  • Function: extension
  • Reference position: pronounced with the lumbar part of the slightly flexed column
  • Electrode dimensions: no more than 10 mm in the direction of the fibers
  • Inter-electrode distance: 20 mm
  • Electrode placement:
    Position: on the line connecting the caudal tip of the posterior superior iliac spine (SIPS) to the space between L1 and L2, at the level of the spinous process of L5, 2–3 cm from the medial line (Figure 2)
    Fastening: double-sided tape or rings
    Reference electrode: on the spinous process of C7
    Clinical test: lifting the trunk from the prone position.
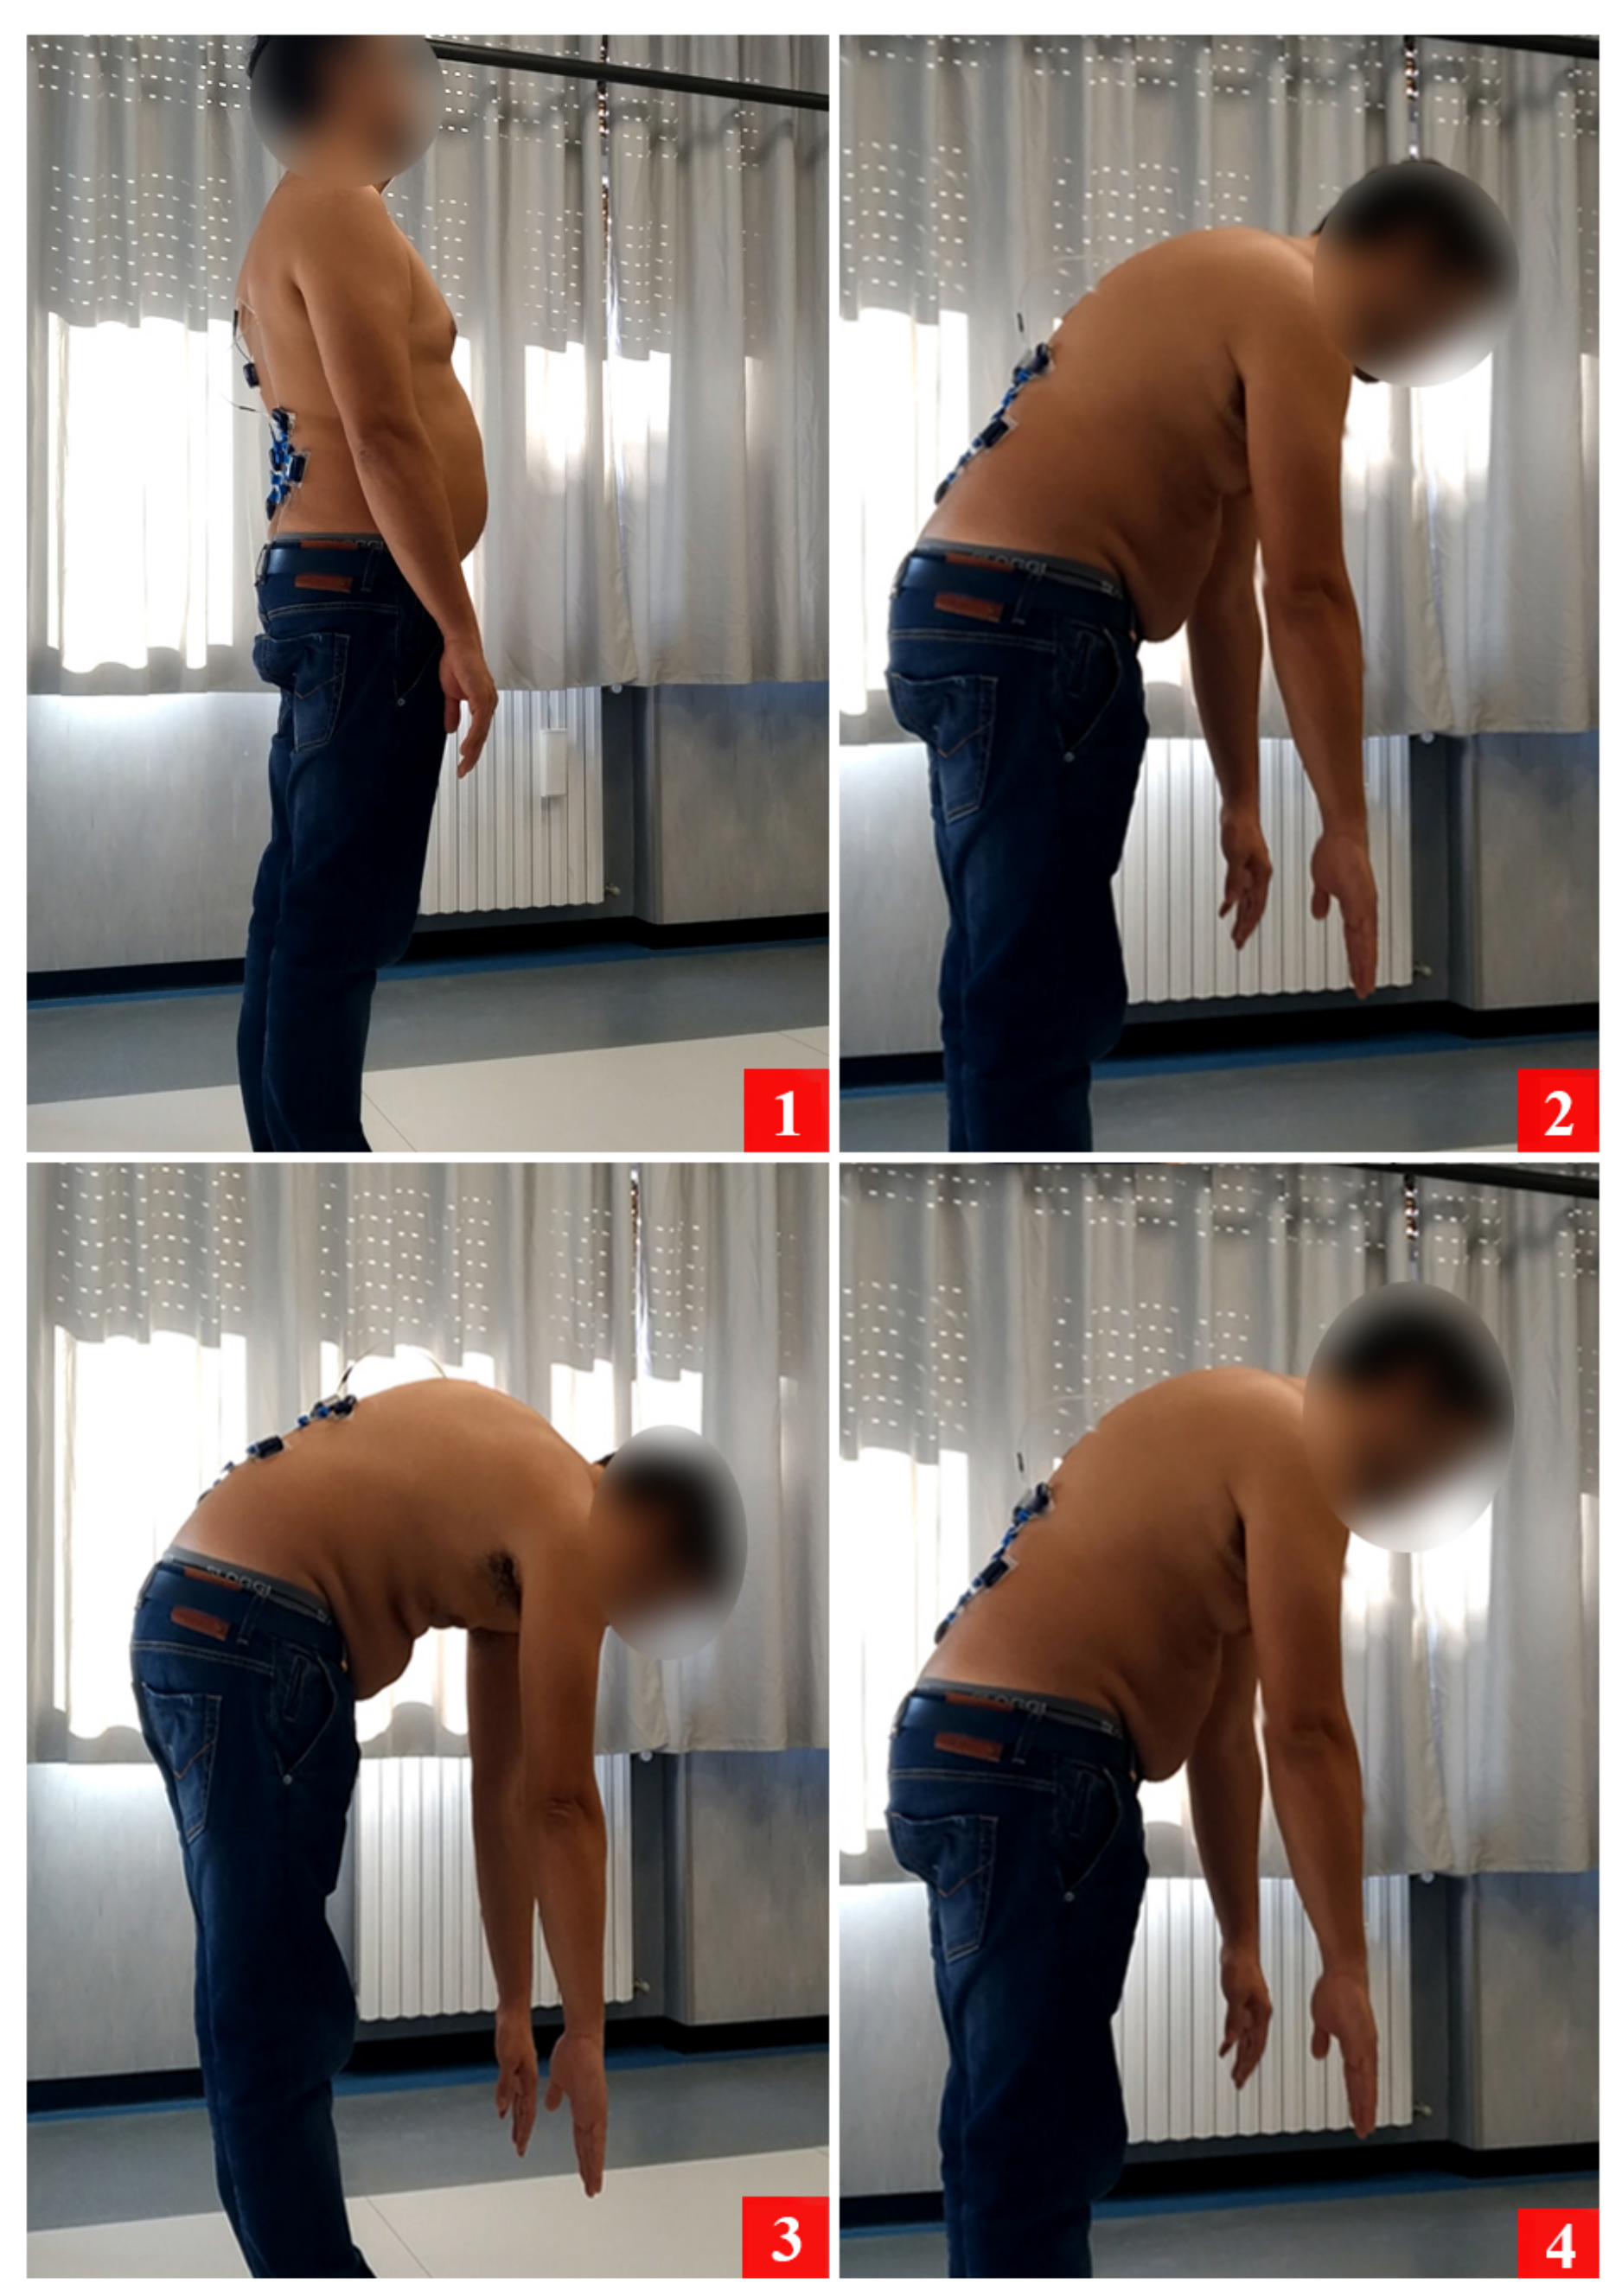
Before starting the forward bend test (Figure 3), the subject was placed with the arms on the side with the feet at the width of the shoulders, standing upright with the gaze straight and fixed on one point in order to avoid any artifacts due to the alteration of the head position. During the flexion-relaxation test, the subject wore the proposed WBSN and repeated four times a motion trial in which he/she was asked to naturally reach a bend angle of about 90° without straining the lumbar region. One complete movement was called “cycle”, and it was repeated four times (a compromise that allowed having a good number of repetitions without exaggerating and stressing the muscles involved too much).
In order to identify muscles’ activity, the sEMG signals were acquired with a sampling frequency of 2000 Hz on the four channels (LSX, LDX, MSX, MDX) and processed using a sixth-order Butterworth passband filter 30 Hz ÷ 450 Hz. The best value to filter ECG artifacts in sEMG signals [29] was 30 Hz, and four-hundred fifty hertz were used to remove high-frequency harmonics [31,34]. The inertial measurement unit, to estimate the inclination of the subject, was acquired with a sampling frequency of 128 Hz. The footswitch FSRsensor of the wireless EMG system was positioned above the inertial sensor to allow the simultaneous recording of the acquisitions. Since the sEMG system and the inertial sensor recorded data independently, a physical event was required to synchronize the two systems. The physical event was achieved by instructing the medical staff to tap the FSR sensor three consecutive times with their finger before starting the flexion-relaxation test. This physical event resulted in large acceleration spikes on the inertial sensor, which were used to synchronize the inclination signal with the data acquired by the FSR sensor of the EMG system. The synchronization was carried out not in real-time, but in the post-processing stage using MATLAB software, and then, the sEMG signals and the inclination were superimposed to derive the four phases of the forward bend test [21,35].

3. Materials and Methods

In this paper, we propose an algorithm capable of providing an FRP evaluation based on the data acquired from a wireless body sensor network (WBSN) composed of sEMG and IMU sensors. The procedures used to acquire the signals from the involved subjects and the database with the acquired data during the flexion-extension tests were described in our previous study [20]. In order to study the FRP, we used this dataset and a modified version of our previous processing algorithm [21]. Once the sEMG and inclination signals were synchronized and the phases were found (Step 1 in Figure 4, developed in the previous study), the full-flexion segment of each cycle was extracted and located in a unique signal to have only a sequence of four full-flexion phases (Step 2 in Figure 4).
Each phase in Step 1 had a duration of approximately 5 s; therefore, each signal on a cycle had a duration approximately of 20 s (see Figure 4). The problem in the signal of Step 2 was that the FF segments extracted were not perfectly of the same time length. To solve this issue and further improve the signal, only a reduced segment of these 5 s was considered, discarding the beginning and the end (from Step 2 to Step 3 in Figure 4). This had two important consequences: the extremes of each phase that can be affected by peaks, due to the previous and subsequent phases’ transient, were eliminated, and choosing segments of the same length, all the full-flexion phases would be composed of the same number of samples, thus allowing a direct comparison. We chose a segment duration of 1.5 s, a suitable value to evaluate the phenomenon. Therefore, to have an overall segment of 1.5 s, what was done for each phase was the positioning, taking 750 ms before and 750 ms after the center. The result is represented conceptually from Step 2 to Step 3 in Figure 4 and in a real representation from Figure 5 to Figure 6.
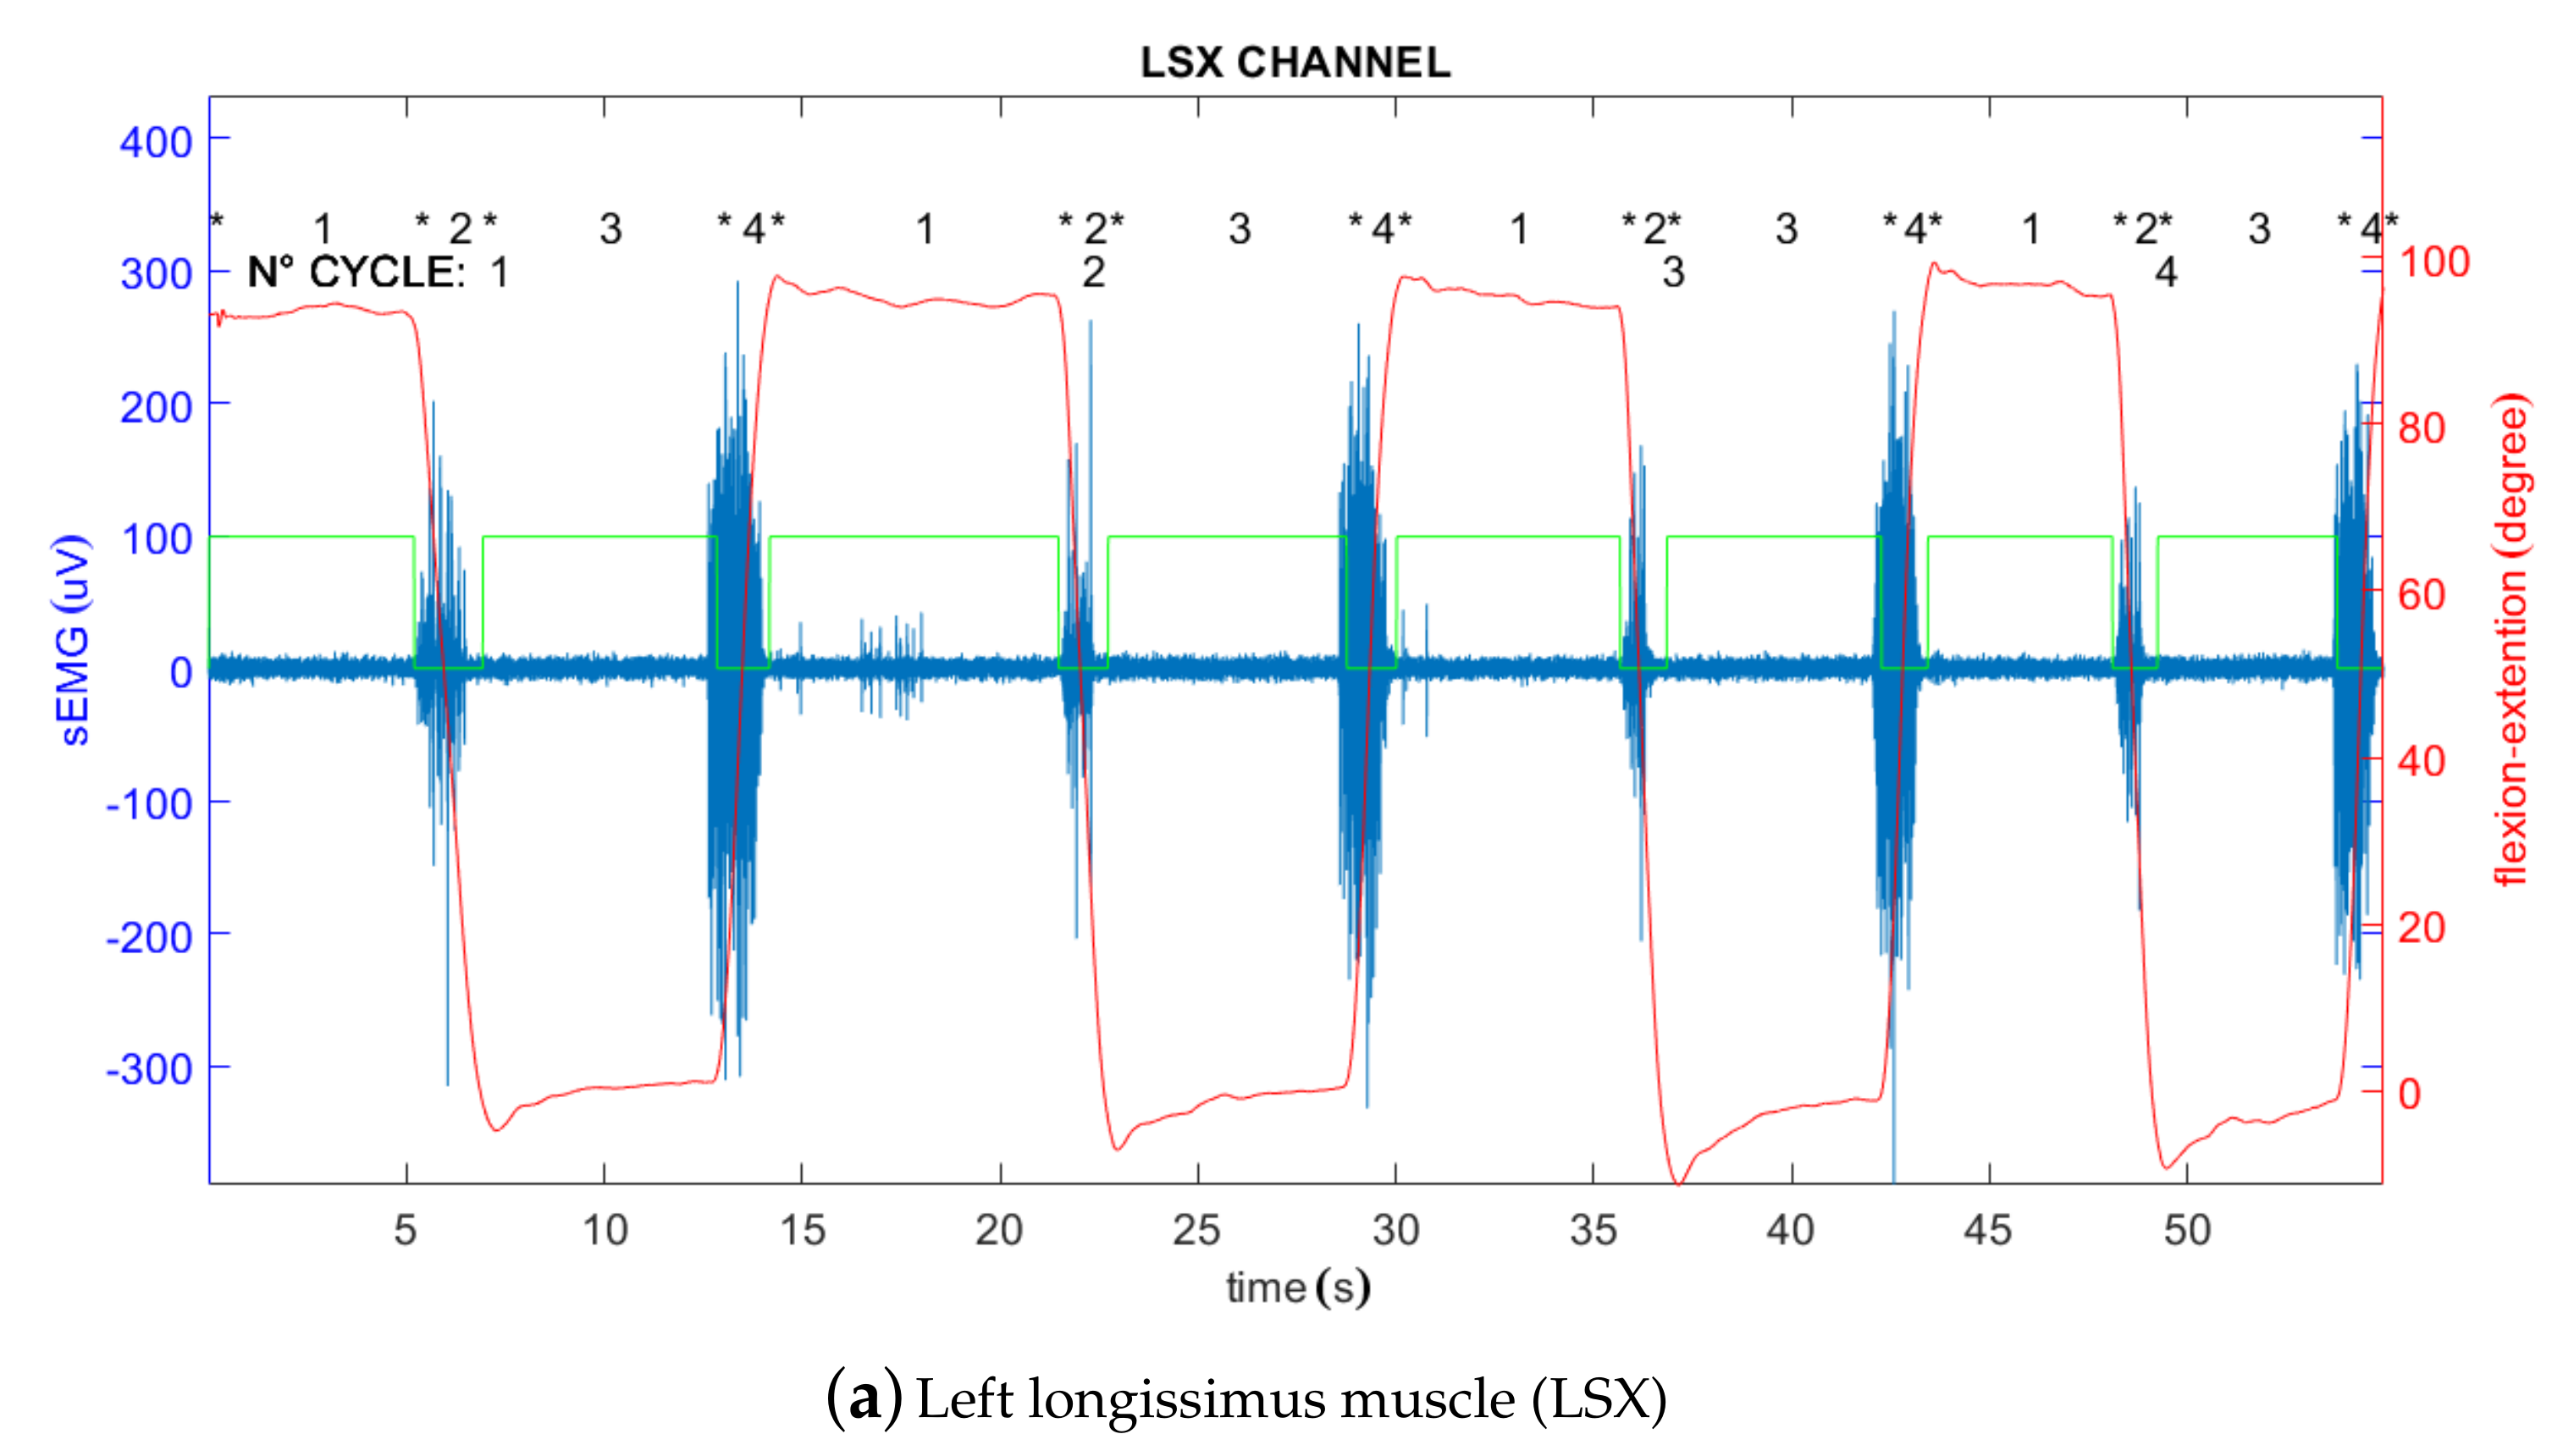
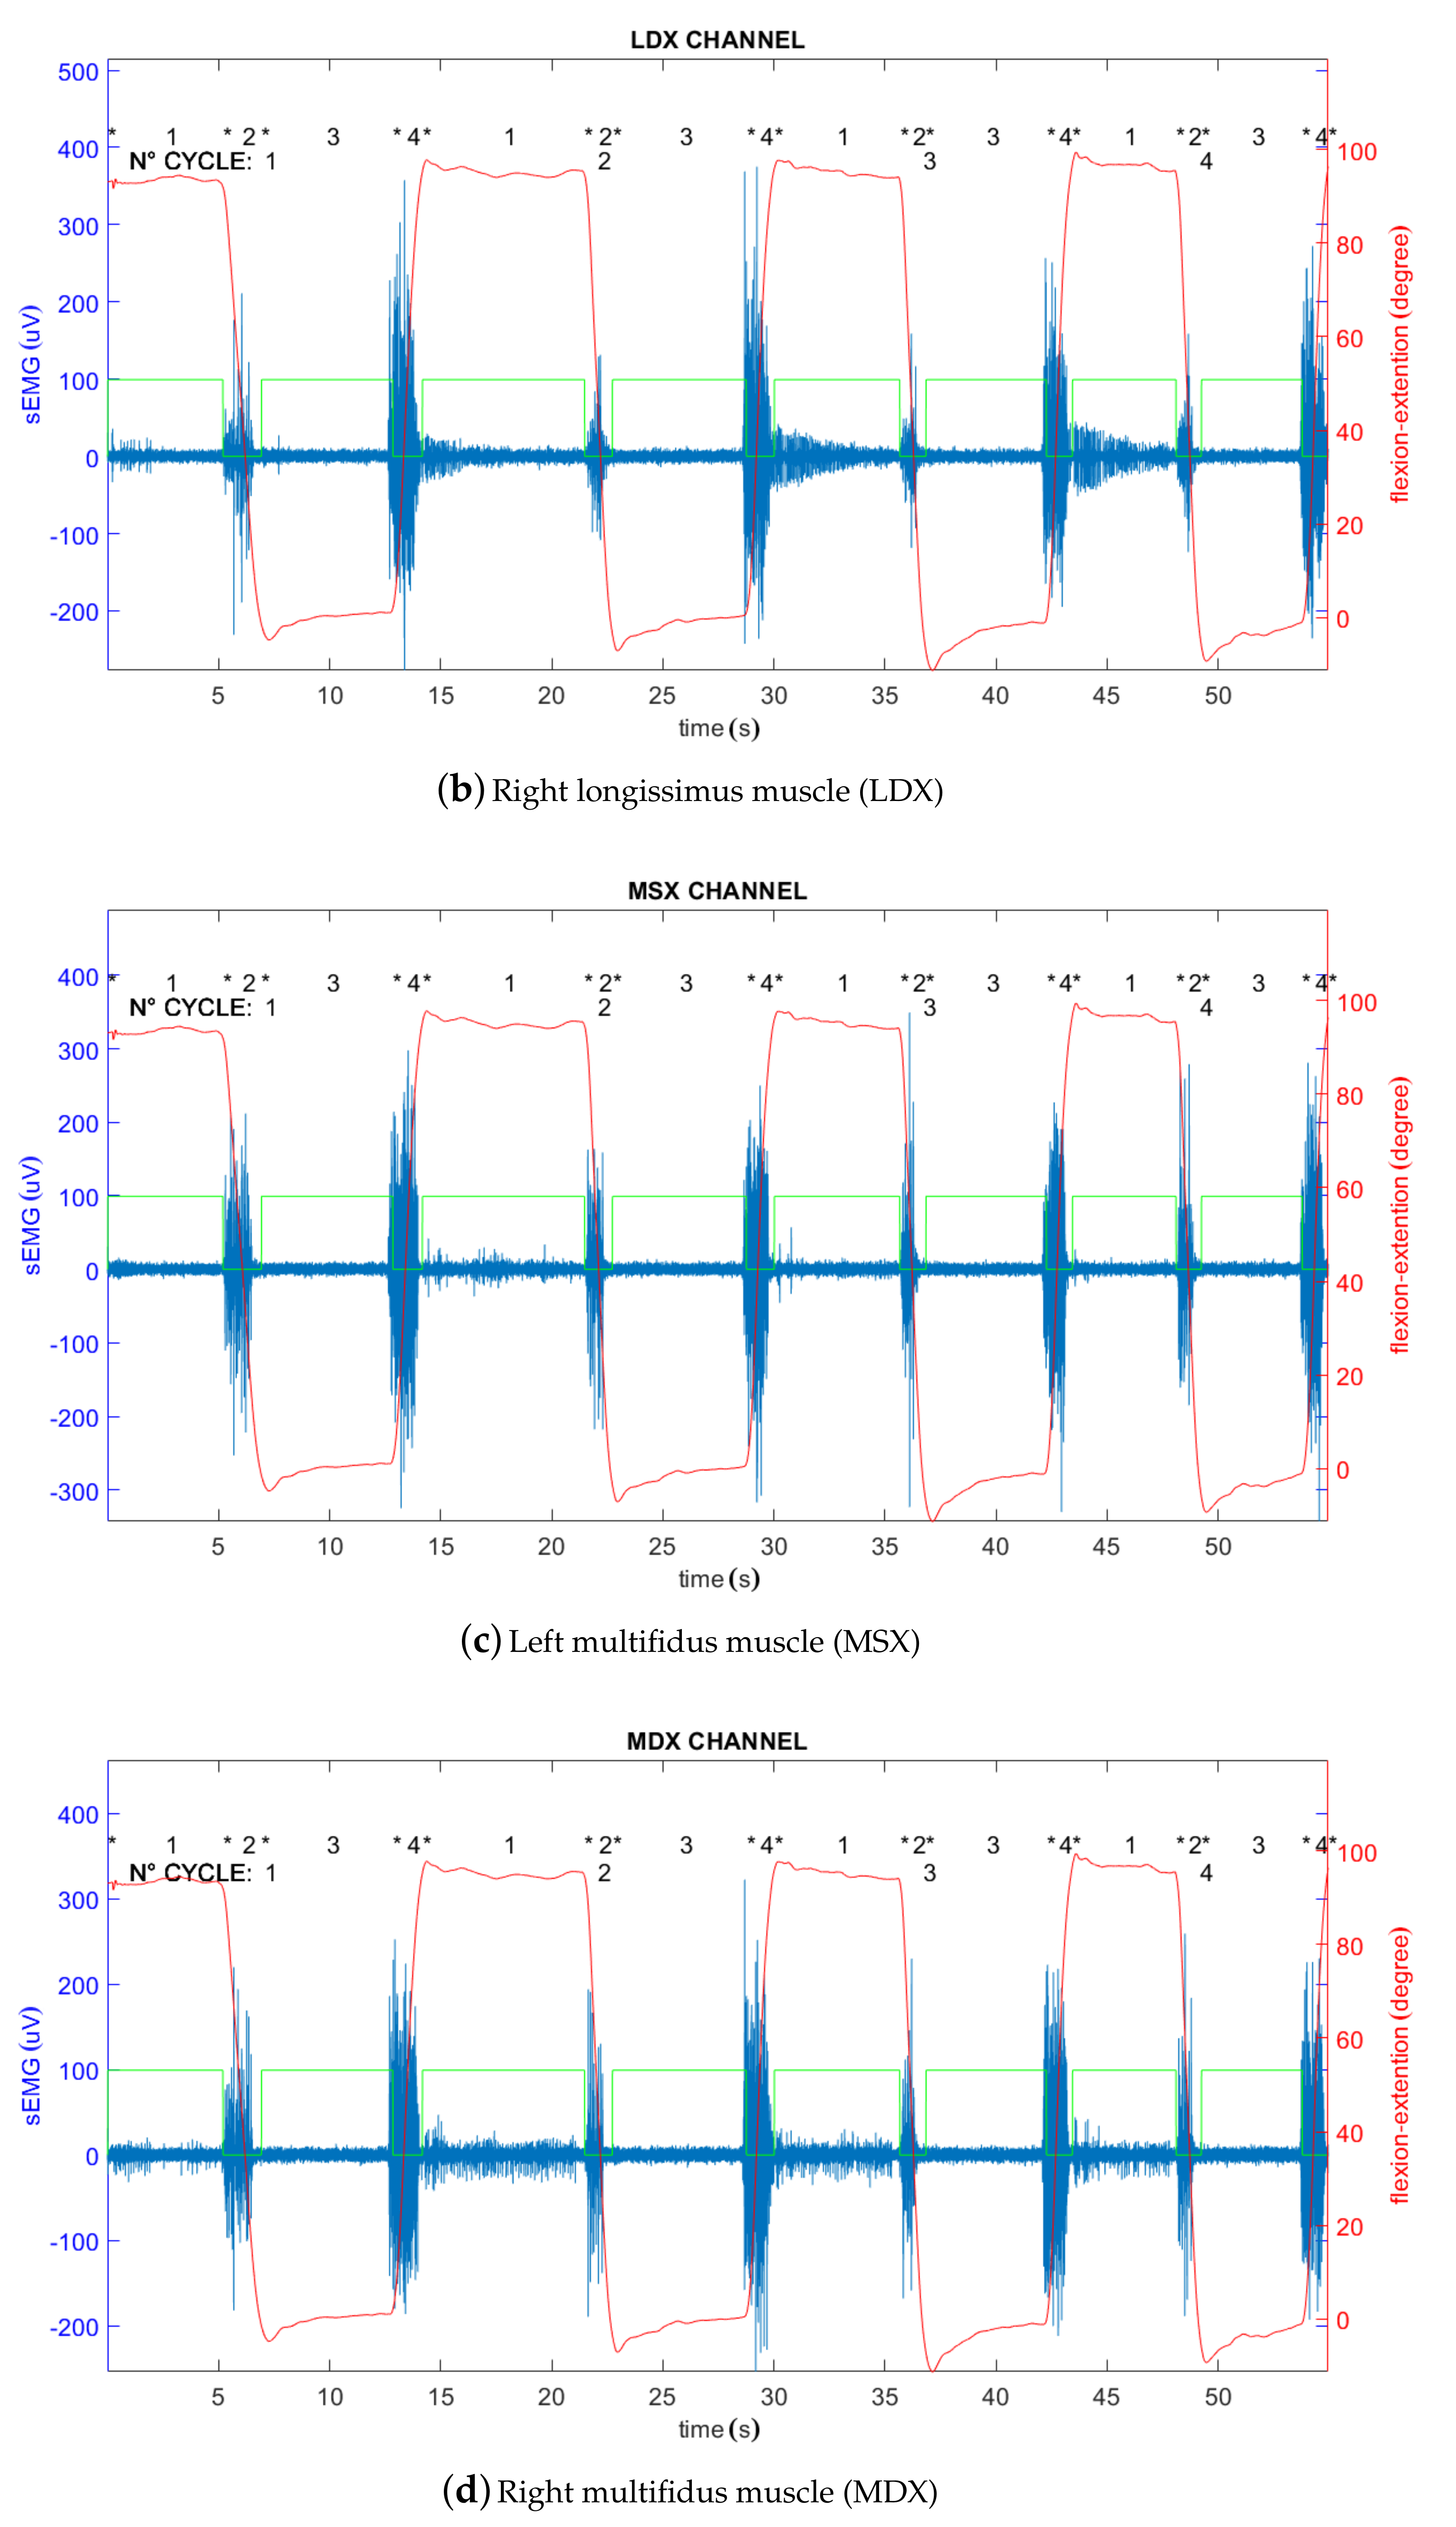
From the study group, the healthy subject with the best FRP evaluating regular patterns using the visual method, low RMS values, symmetry between left and right RMS levels, and low FRR values was empirically chosen [21]. He was chosen as the gold standard (GS) used a as first reference (Step 4 in Figure 7). The subject with ID2 was identified as this GS [35], and the signals are shown in Figure 5.
It was necessary to find a method to compare the GS with all the other subjects, so the RMS value was implemented. Sihvonen et al. did not report the RMS electrical activity during the full-flexion, saying that it was close to zero, but the real value could not be calculated with the method used [36].
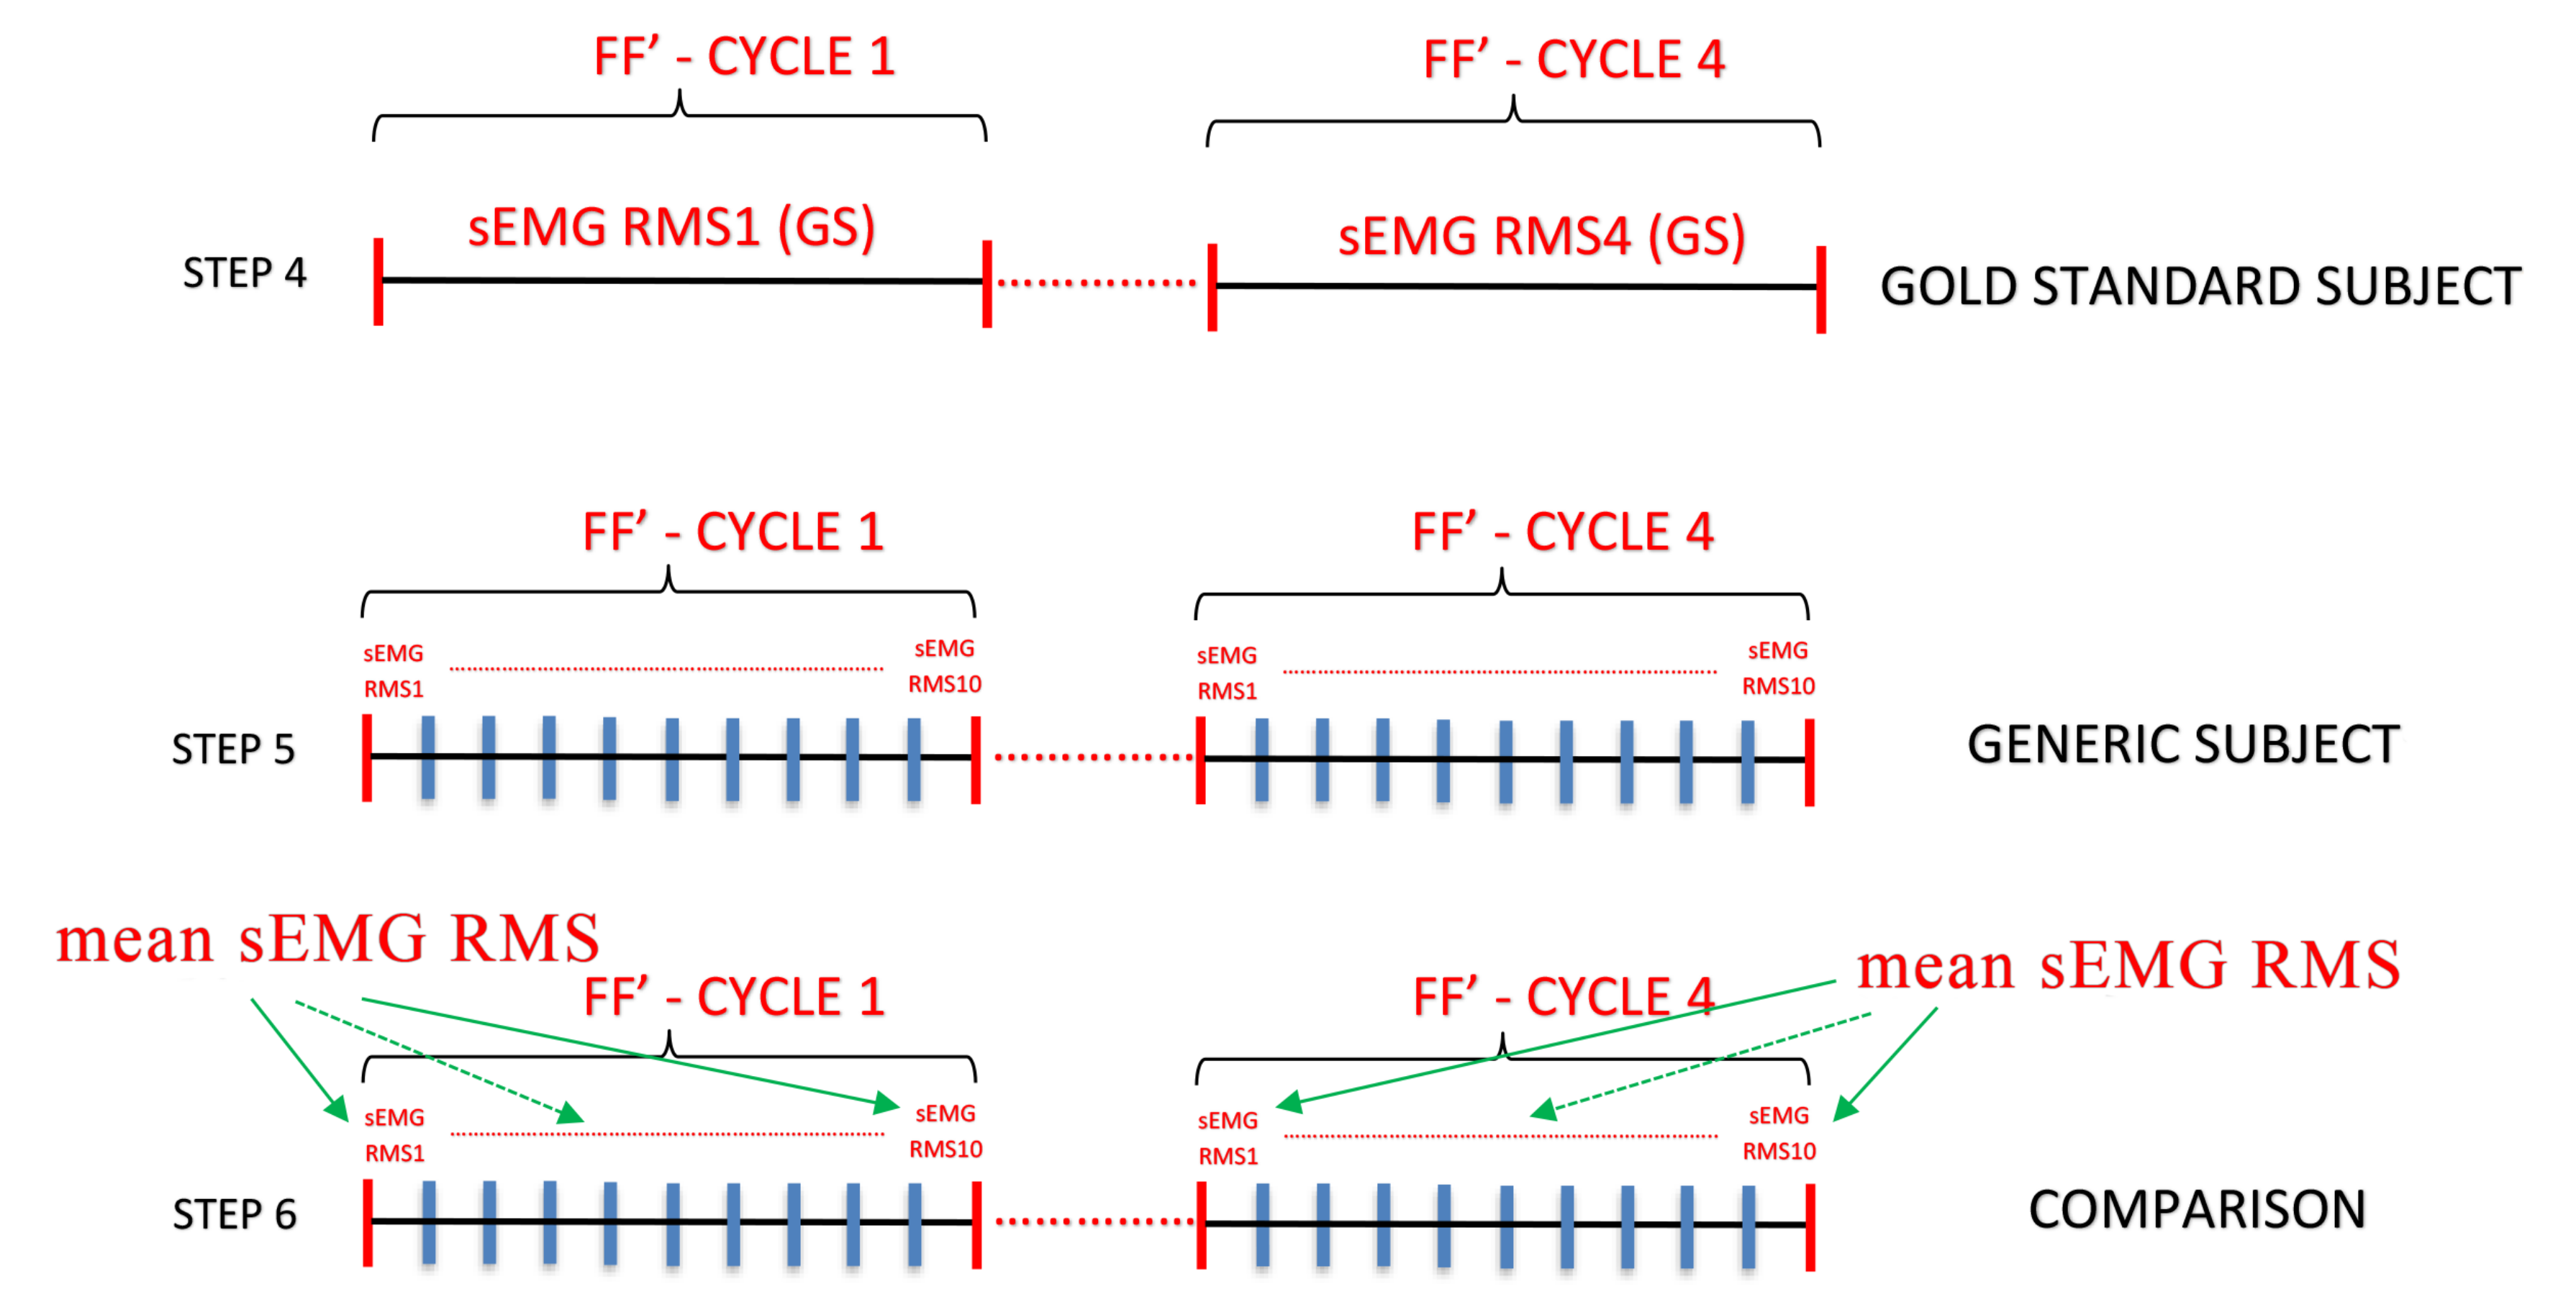
The sEMG signals of the GS were processed to find an RMS value of the full-flexion phase for each cycle (Step 4, Figure 7). The sEMG signals of the other subjects, which typically had a more variable signal, were processed with a further segmentation (10 segments, each one 150 ms), and the RMS moving window was calculated without superimposition (Step 5, Figure 7). In fact, as previously defined, the patterns can be more irregular, so we needed to reduce the window to calculate the RMS value. In Table 1 are reported all the mean RMS values obtained from the analysis for each cycle and channel.
The first mean RMS sEMG value chosen was simply the mean value of the RMS sEMG related to the GS (where the total mean was calculated between the cycles). Therefore, there were in total 16 RMS sEMG values, 4 for each channel. From these 16 RMS values, we extracted the mean indicated with R M S ¯ G S and the standard deviation (SD). Therefore, assuming a normal distribution, we defined the validity range of subjects with FRP, taking three times the positive and negative standard deviation.
In the first iteration, the rough decision about FRP presence/absence was taken comparing the gold standard with each subject. A first validity range was taken between the R M S ¯ G S plus/minus 3 times the SD.
In the second iteration, the validity range was defined by the mean value (indicated with R M S ¯ F R P ), of all the RMS values that were included in the first range previously defined, plus/minus 3 times the SD. In the third iteration, the last validity range was simply the mean value of all the RMS values, which were included in the second range previously defined, plus/minus 3 times the SD.
In summary, starting from the gold standard and only using the regular patterns (defined by the validity range updated with each iteration), we made the decision about the best range to use to identify a subject with and without FRP.
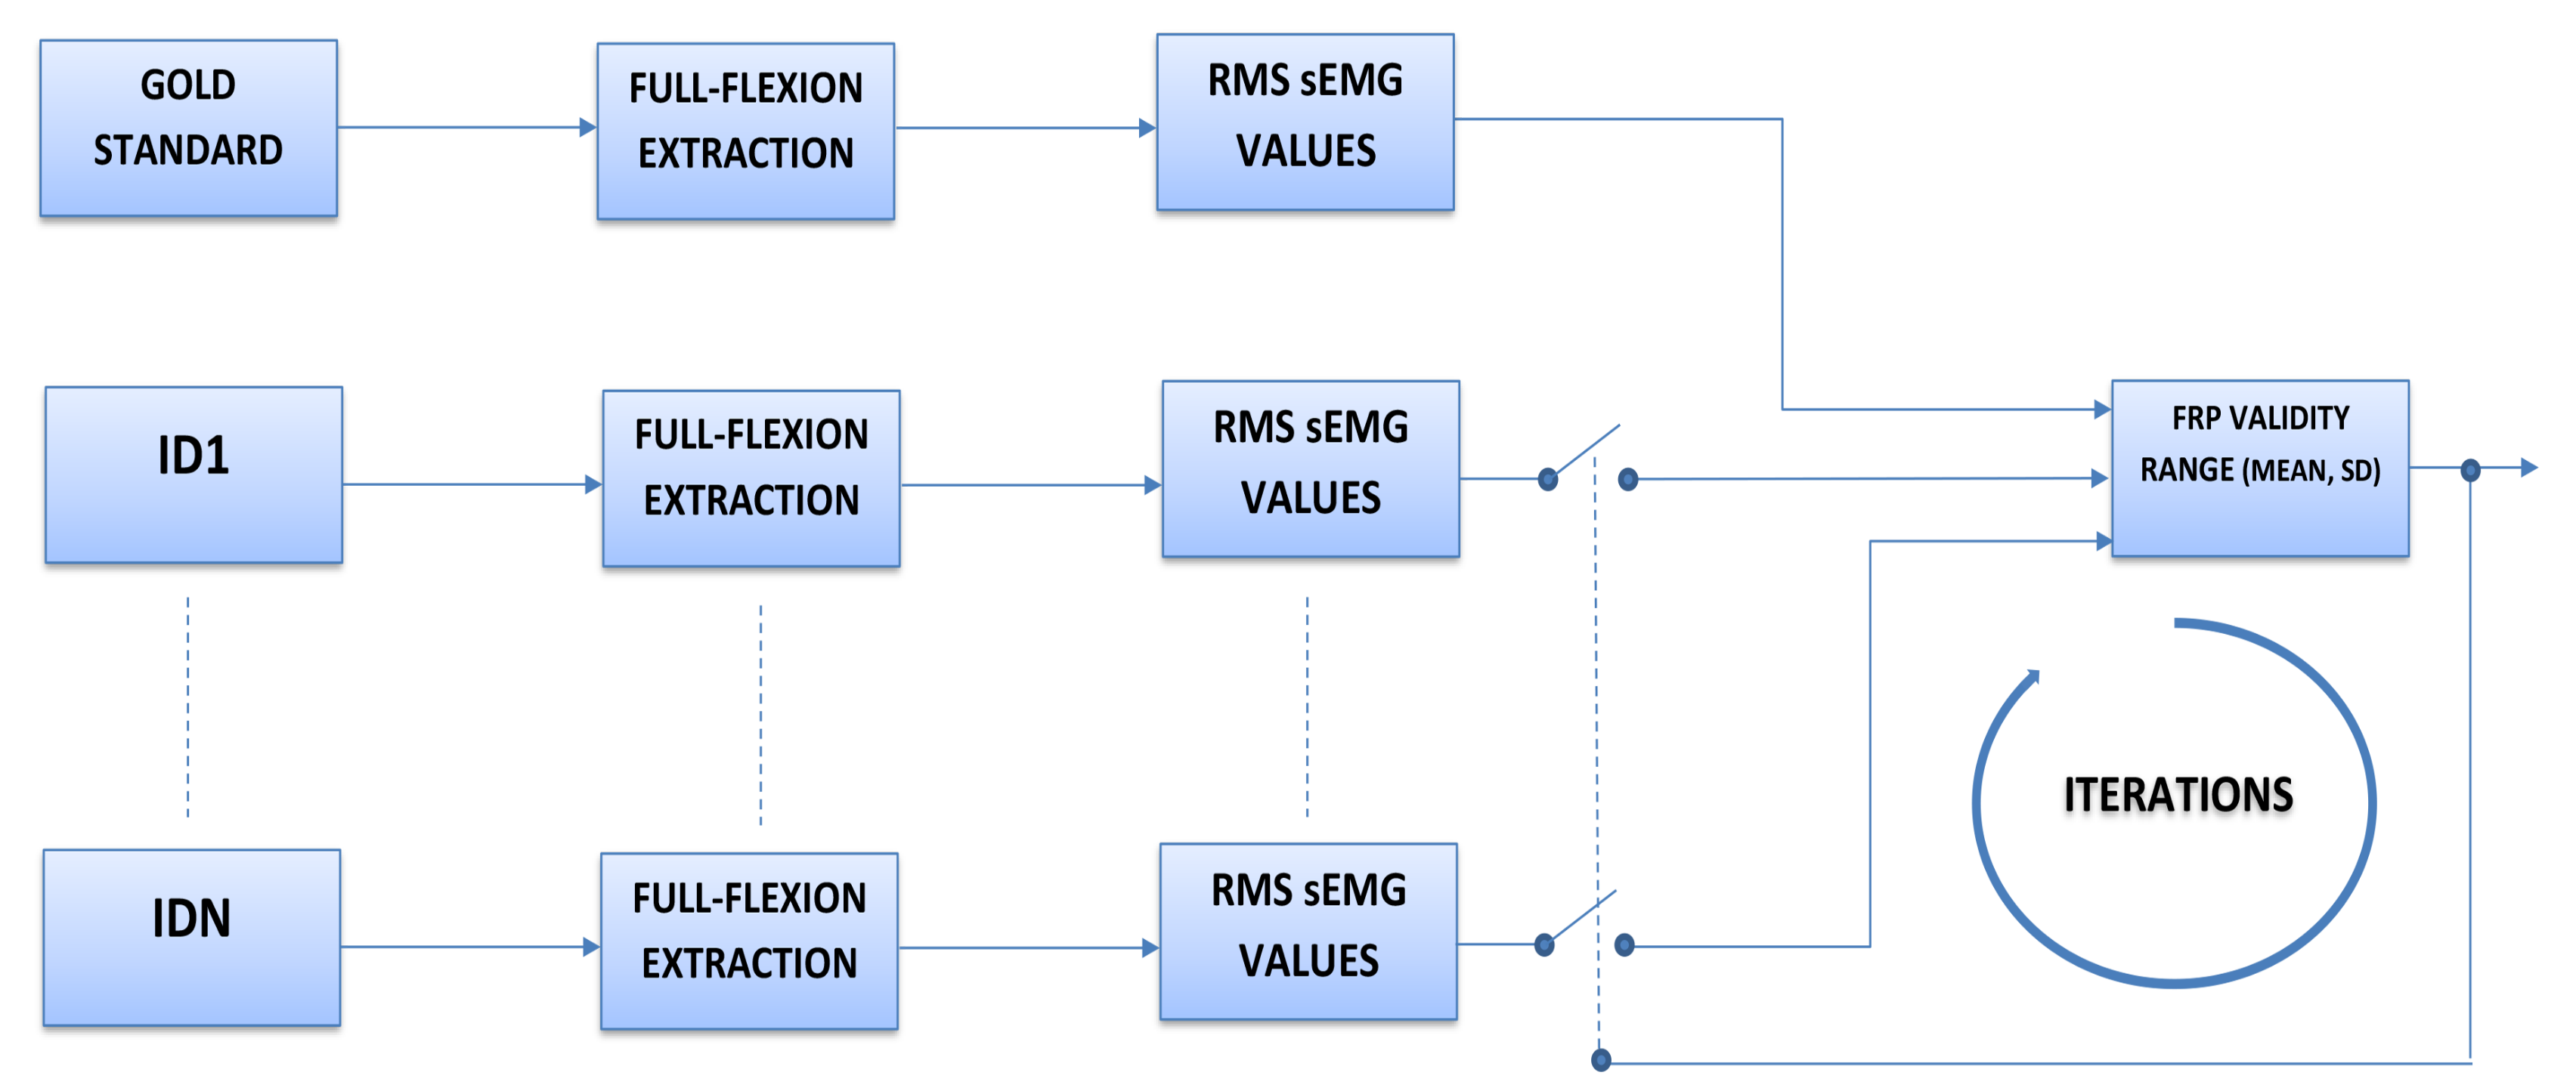
In Figure 8 is represented the operating principle of the algorithm described above. In the first iteration, only the first branch is active, where the RMS values on the full-flexion phase are extracted, and the first FRP validity range is defined. In the second iteration, the feedback about the validity range defines the RMS values inside the range, and they become the input to find the second validity range, and so on. The final output of the block diagram is reported in Table 1, and the results of a direct comparison with the VIS method [21] are reported in Table 2.

4. Experimental Design

The study group involved in this research was composed of 25 healthy mixed subjects and with lower back pain selected with the criteria explained next. Other important data are the perceived pain and disability, acquired by the doctor during the visit and reported in each subject’s anamnesis, which were identified using the numeric rating scale (NRS-11 scale) and the Backill questionnaire, respectively. To better evaluate and quantify the static or dynamic pain perceived by the subject, the NRS-11 scale was applied before, during, and after the execution of the forward bend test.

4.1. Exclusion Criteria

  • Pregnancy
  • Severe structural deformities (e.g., kyphoscoliosis)
  • Systemic diseases (a disease that affects multiple apparatuses or organs, often related to rheumatic diseases, or rare diseases such as genetic disorders) or neoplastic diseases (tumors)
  • Significant psychiatric diseases
  • Any other medical condition that could interfere with the correct execution of the protocol

4.2. Inclusion Criteria for Individuals in the Control Group

  • Aged between 18 and 65 years old
  • No history of musculoskeletal or abdominal pain
  • Not under medical treatment
  • No episodes of LBP within the last six months
  • No consultation with a therapist or doctor regarding LBP problems

4.3. Inclusion Criteria for the Patient Group

  • Aged between 18 and 65 years old
  • Available to participate in a pain management program
  • Actively suffering from LBP (LBP type should be specified, and it should also be clarified whether it is present when the test is executed)
The participants signed an informed written consent before the data collection, which was carried out in accordance with the Declaration of Helsinki.

5. Results

Using the GS, we found a mean RMS sEMG value equal to 3.92 μV (for longissimus muscles, 3.88 μV, while for multifidus muscles, 3.96 μV) and SD = 0.43 μV. Continuing the iterations, we used the dataset to find the mean and SD from RMS values inside the FRP validity range. We found a mean RMS sEMG value equal to 4.09 μV (Table 3). The dataset was used to calibrate the RMS likelihood algorithm to find if abnormal patterns were present or not. Through this implementation with the gold standard as the first reference, we found all the other regular RMS values, and so on. Table 3 represents the last iteration where the FRP validity range is defined by the upper threshold T H + = 4.09 + 3 × 0.58 = 5.83 μV and the lower threshold T H = 4.09 3 × 0.58 = 2.35 μV. Therefore, for each value of Table 1, the final decision of the algorithm is:
  • If the value is inside the range, it is considered as FRP positive
  • If the value is outside the range, it is considered FRP negative, as reported in Table 2.
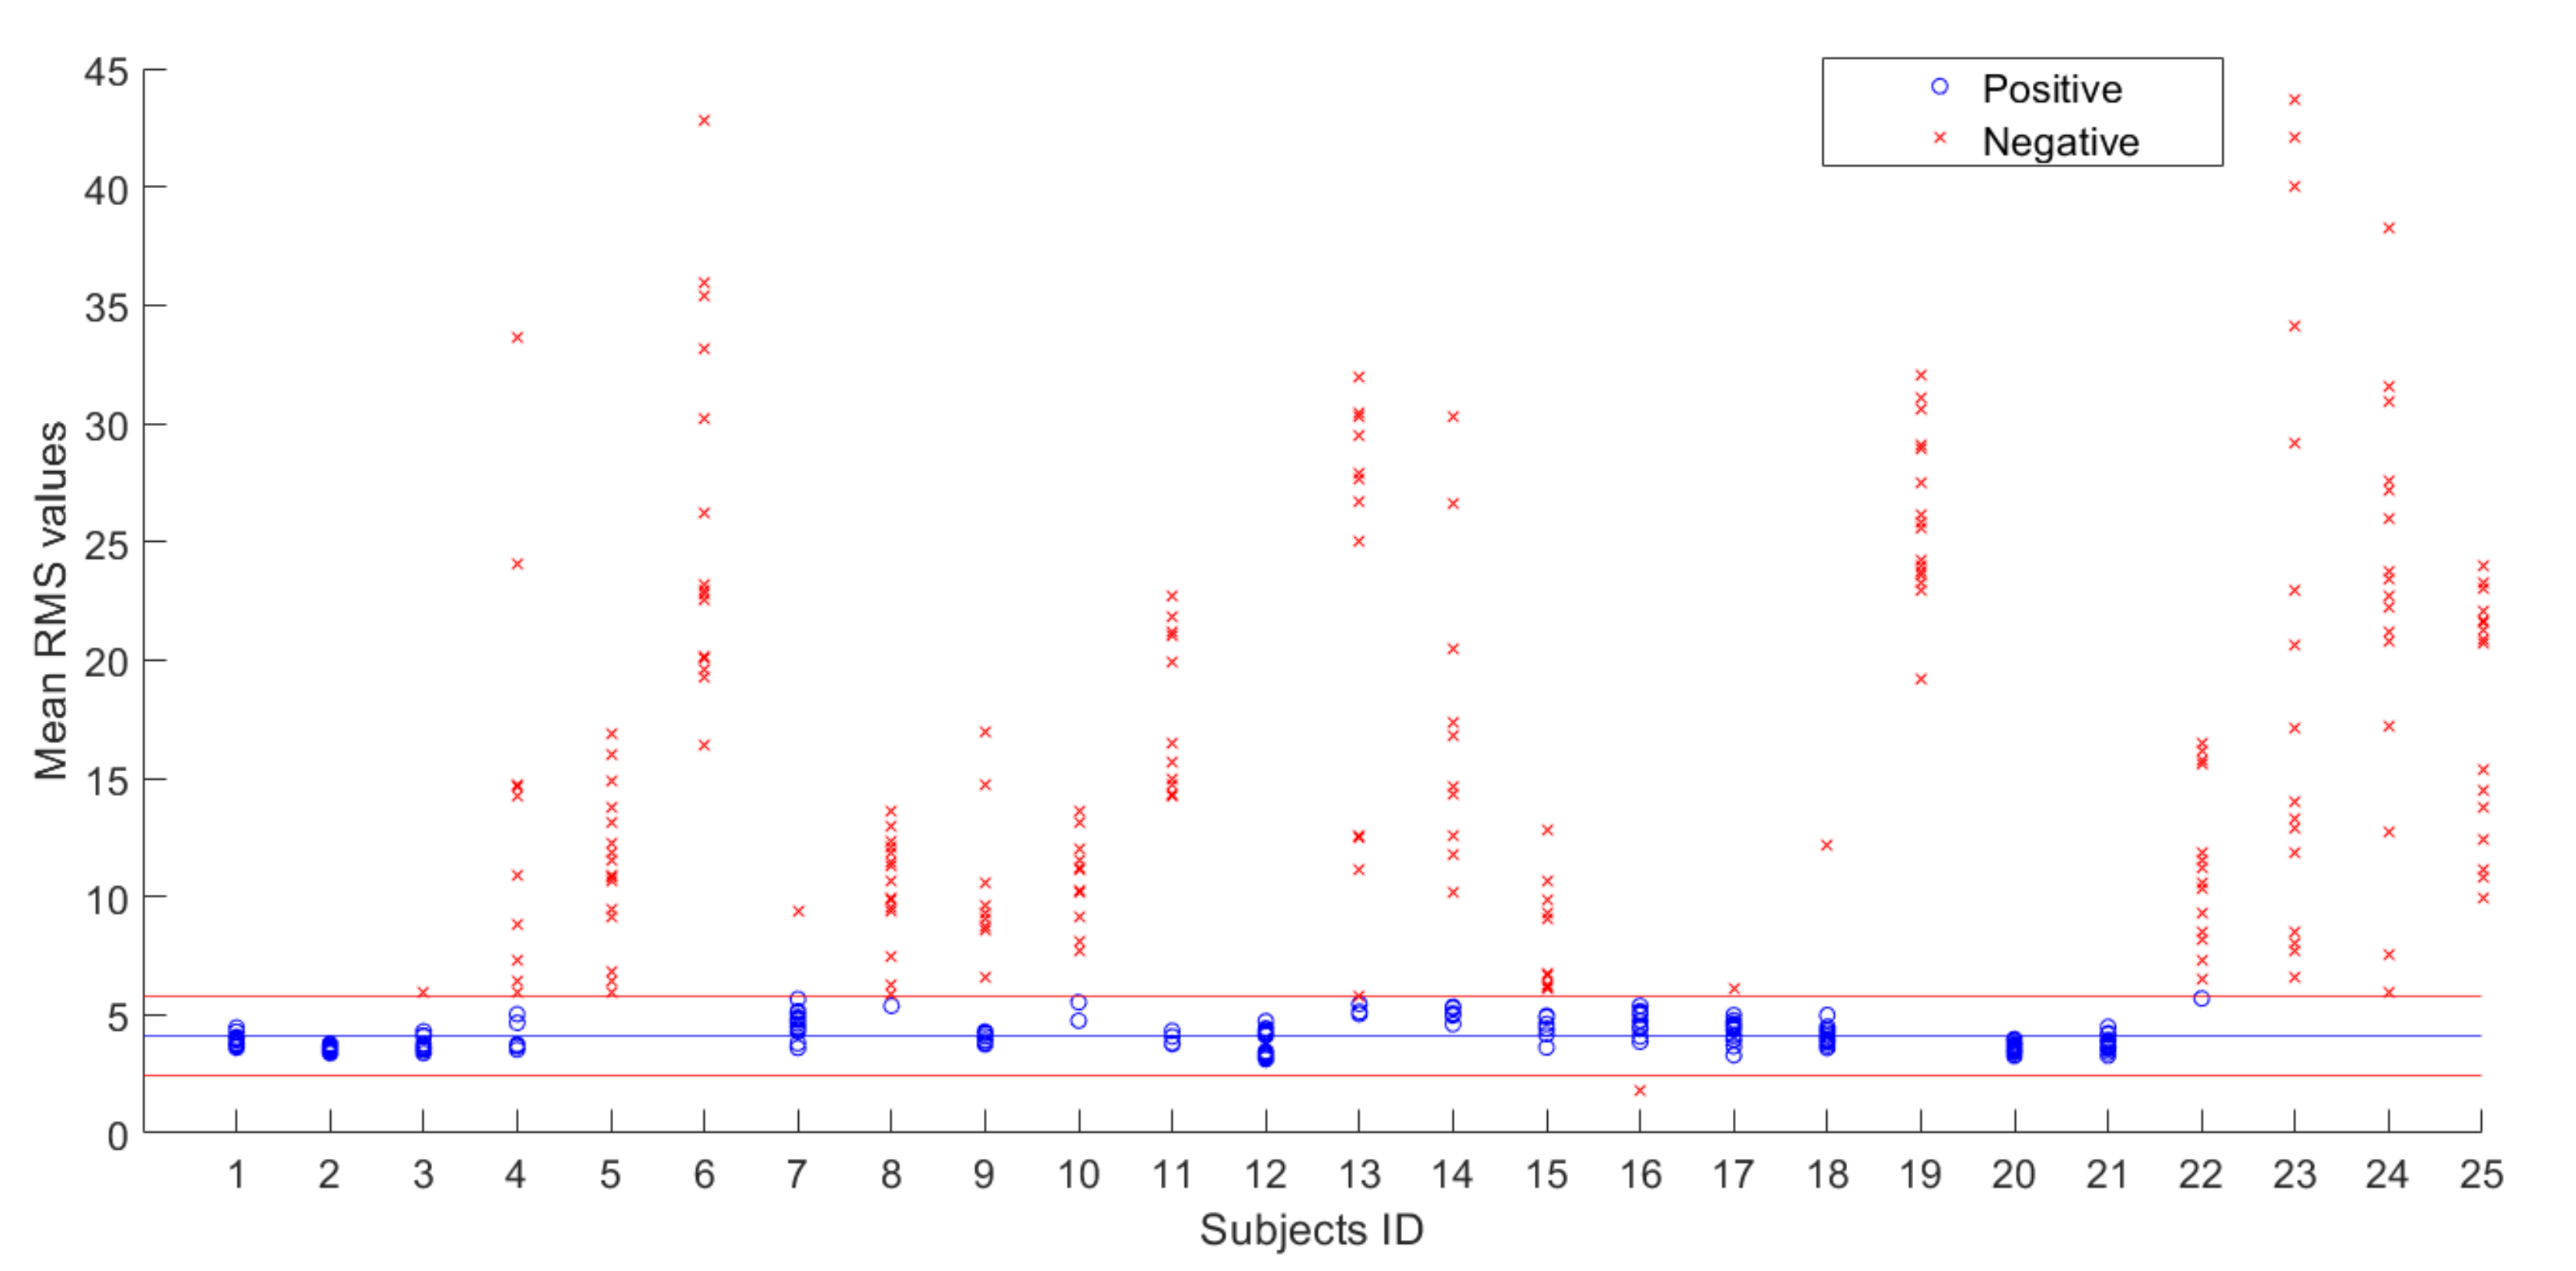
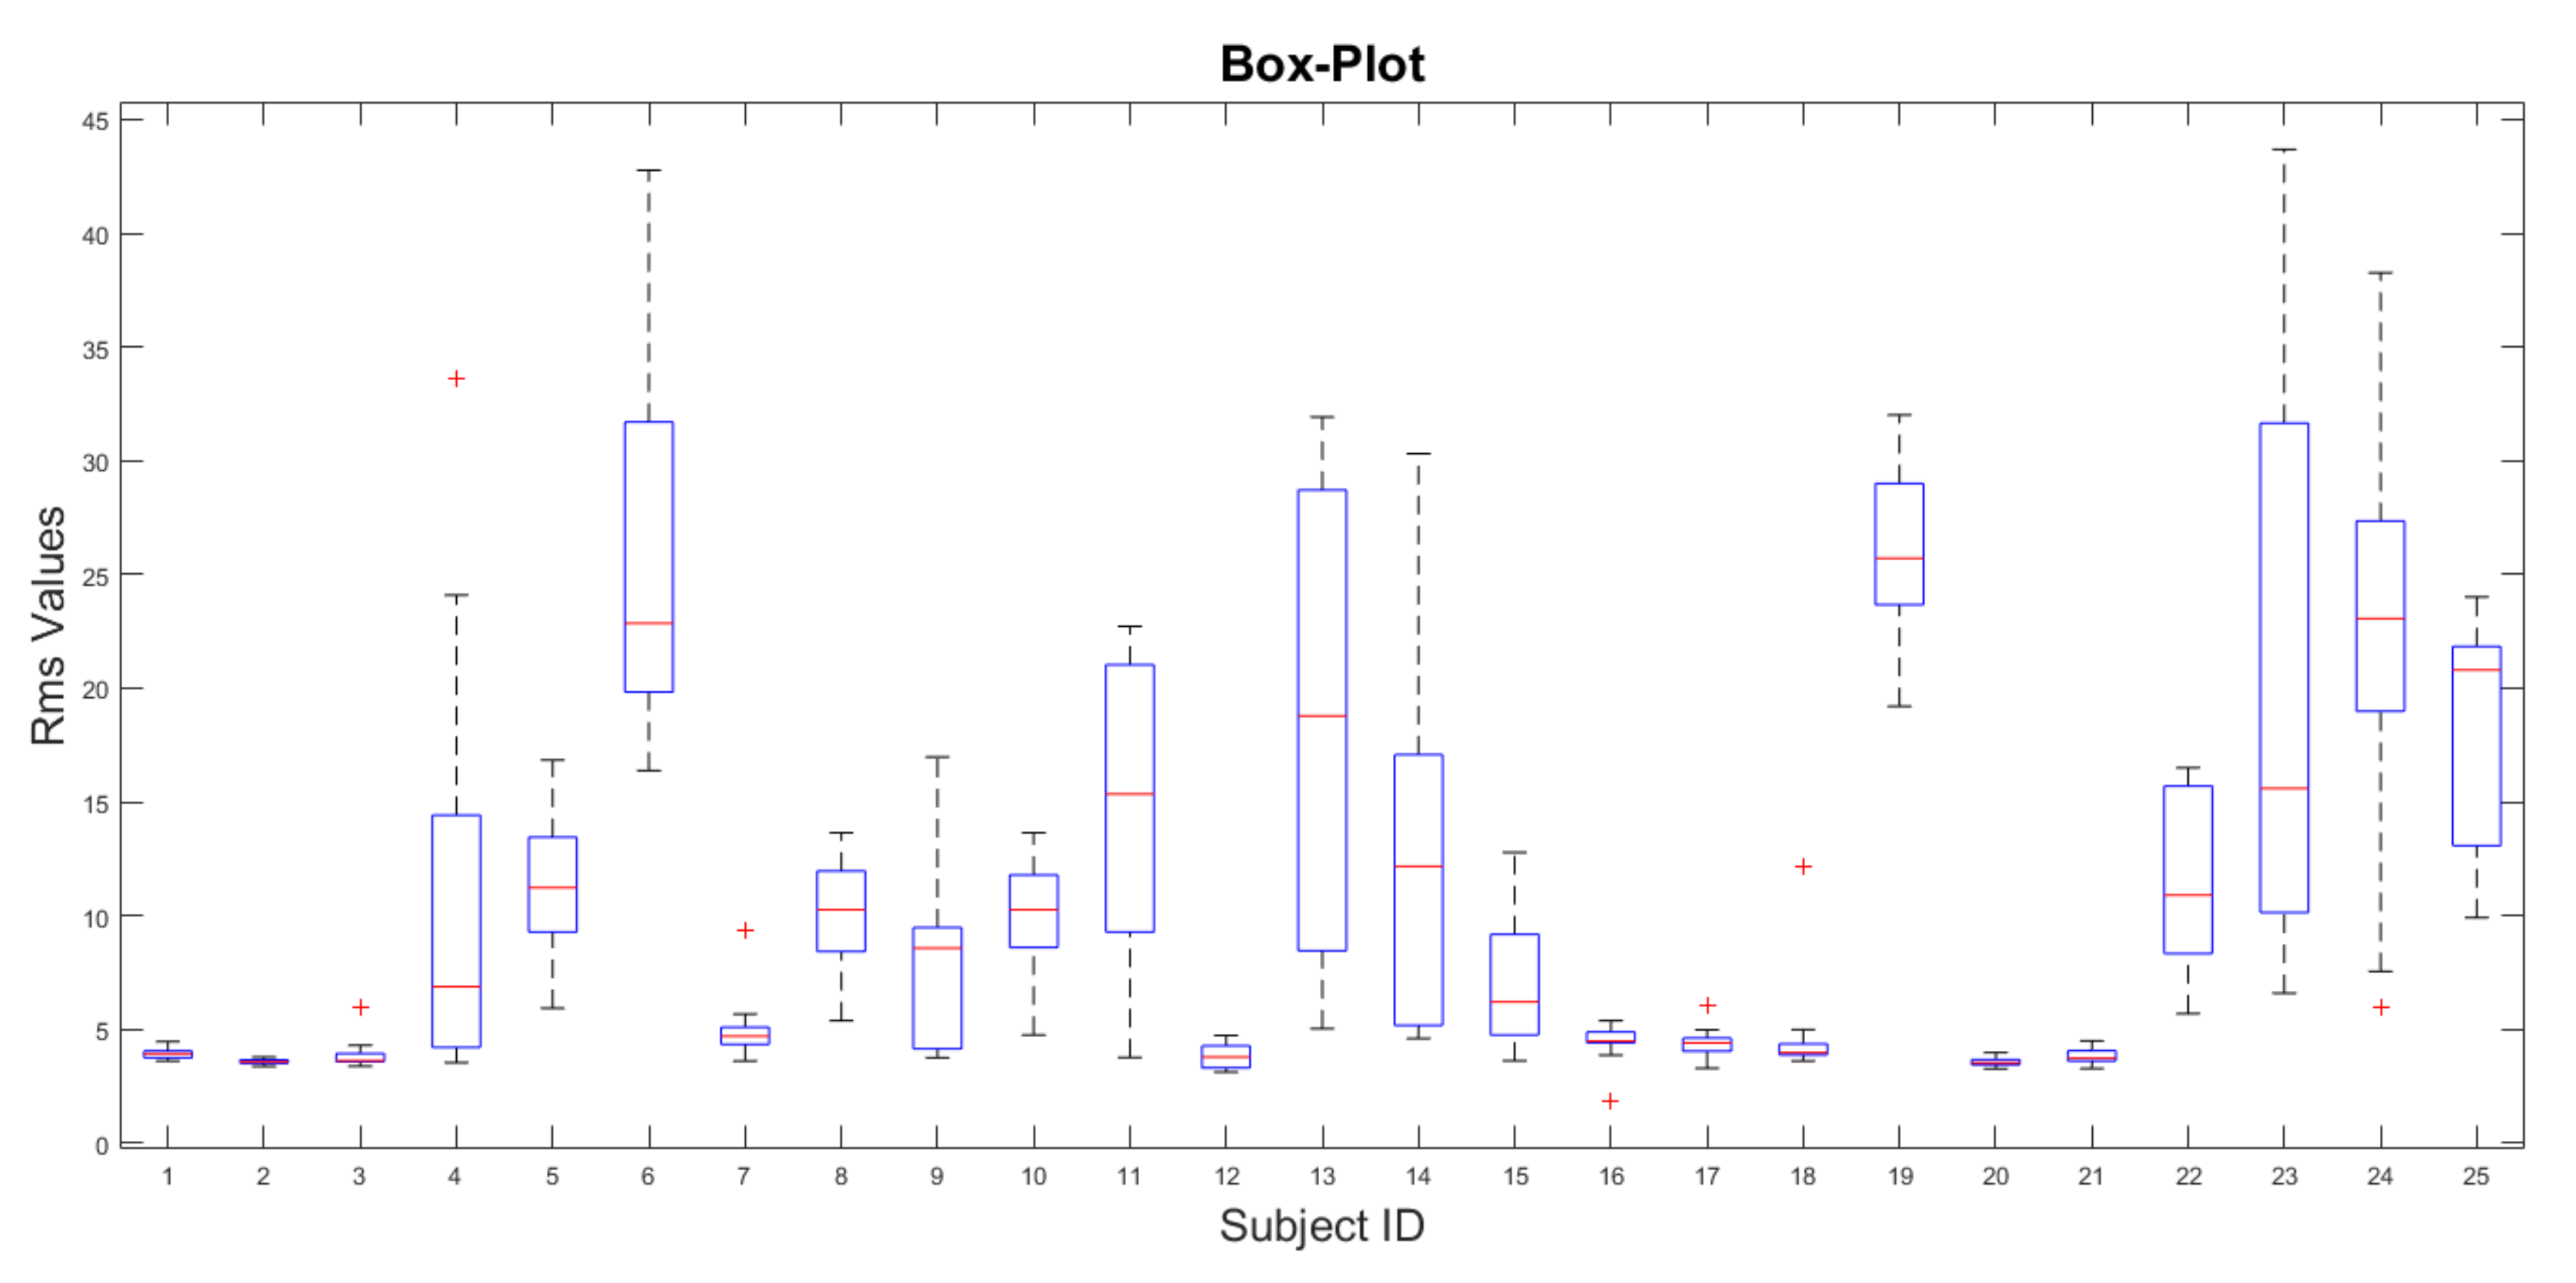
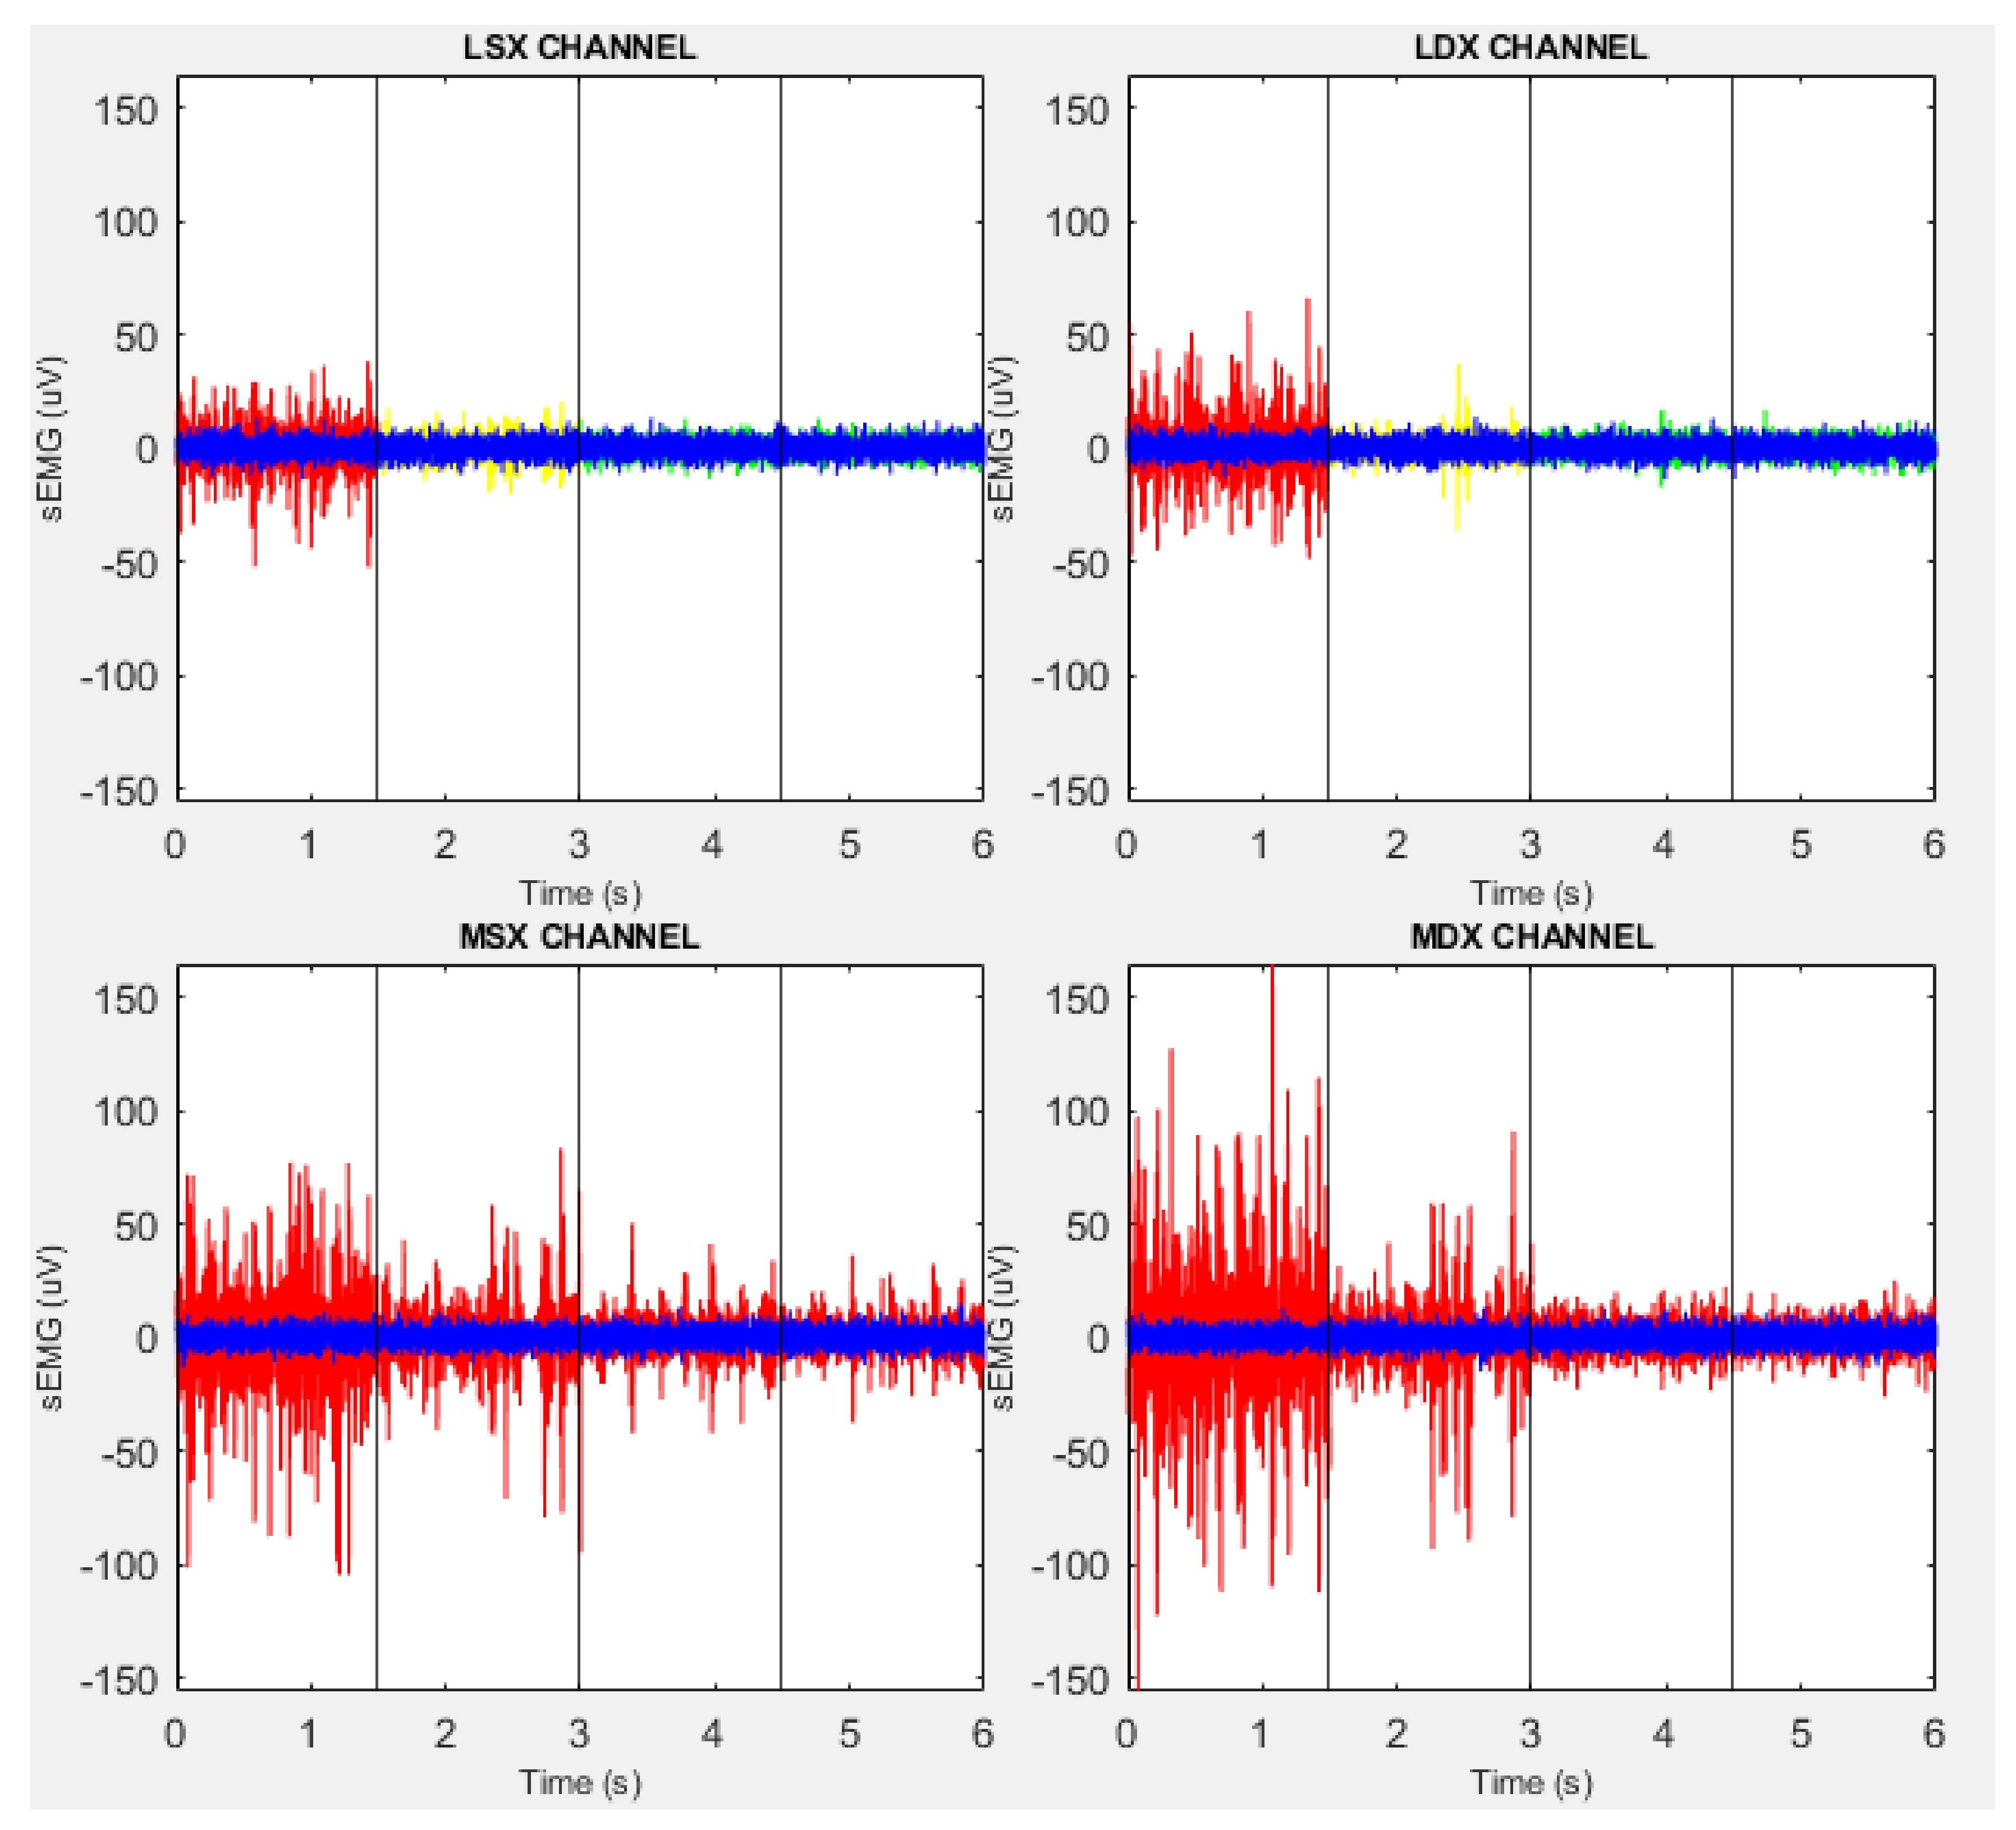
As shown in Figure 9, we can see subjects with all positive FRP values, and they tend to be close together, while subjects with all negative FRP values tend to be spaced apart, all above the upper range limit. There are also intermediate cases where the same subject manifests positive and negative values. These cases require more attention because if the negative value is only one or at most two, this is most likely due to the presence of one or more noise peaks that alter the pattern (as represented in Figure 9 for ID3, ID7, ID16, ID17, ID18). Filtering is not sufficient to eliminate these noises, which fall back into the bandwidth. Tables and figures help us to better understand the sEMG pattern arrangement in relation to each subject. In Figure 10 is represented the box-plot displaying the data distribution. There, as the previous figure, it is possible to observe the outliers that lie an abnormal distance from other values. In Figure 11 is shown an example of the superimposition between full-flexion sEMG signals of a control healthy subject (in front) and an LBP patient (back) realized in MATLAB. This can be useful to see a visual difference of the patterns between each subject and the GS. During the iterations, if the signal on the full-flexion cycle is red, it is discarded; otherwise, if it is green or yellow, it is considered in the switch selection of Figure 8.
In Table 4 are reported the summary results about the comparison of the proposed algorithm and the VIS method used as the reference [21].
Now knowing FRP presence/absence, the second question was “Is it possible to classify healthy and lower back pain patients without knowing a priori their health conditions?”. Therefore, from the results of Table 2 about FRP presence/absence using this likelihood algorithm and using Figure 9, we obtain:
  • ID6, ID8, ID22, and ID25 were not correctly identified as controls (they had no LBP, but also did not show FRP). Therefore, nine control subjects were correctly identified from a total of 13 control subjects (69.2%, against 83% found by Neblet et al. [22]).
  • ID1 was not correctly identified as an LBP patient (he had LBP, but showed FRP). Therefore, eleven patients were correctly identified from a total of 12 LBP subjects (92%, against 79% found by Neblet et al. [22]).
Results are summarized in Table 5. However, the representative group of 25 subjects is too small to define a statistic regarding the ability to discriminate healthy subjects from LBP subjects.

6. Discussions

The mean RMS sEMG value found in our results of 4.09 μV is near the 3.5 μV found by Neblett [25]. Obviously, this value depends on the type of processing carried out on the sEMG signal and on the type of muscle taken into consideration; however, the values are not very far from each other. Table 1 was added to show the various RMS levels for each cycles (to see if there were any variations) and any asymmetries between the right and left muscles. In subjects with LBP in the first cycle, we tend to see patterns with slightly higher sEMG values, and this is reflected in the final RMS values. This could be due to the fact that during the first cycle, the perception of fear could affect the electromyography levels. Evidence in Table 2 suggests that FRP is sensitive to spinal pathology, which influences LBP. However, to understand if there is a flexion-relaxation improvement after a rehabilitation program, all the subjects with LBP must be re-checked after a certain period of physiotherapy. However, further investigation is needed to understand why some healthy subjects do not show FRP (producing a low sensitivity). It would also be interesting to see if these healthy individuals without FRP are more likely to develop LBP in the future. Therefore, the question “Is it possible to classify healthy and lower back pain patients without knowing a priori their health conditions?” is hard to answer because of the low level of sensitivity. However, this research can be useful to guide future clinical researchers in determining the normalness of the flexion-relaxation pattern in LBP patients and healthy subjects for longissimus and multifidus muscles and can help guide clinicians in the treatment and restoration of normal FR patterns in LBP patients.
The boxplot in Figure 10 is important to visually understand the arrangement of the values of the entire group of subjects analyzed and the outliers defined as data points that are located outside the whiskers of the box plot (maybe caused by noise and false contacts). A possible limitation of this study could be the choice of the gold standard from which we started to define the first validity range. However, by choosing another GS subject with similar characteristics and reapplying the algorithm, very similar results were obtained. The reason is that the iterative process allows refining the validity range taking into account the other healthy subjects with FRP, as well as the variance. In future developments, by increasing the dataset of electromyographic patterns much more, the definition of a gold standard and a better classification can be obtained through the use of well-trained machine learning algorithms. Our algorithm could be used during the training to define labels (with FRP or without FRP) in supervised classification algorithms. However, if multiple datasets are used, attention must be paid to how the data were acquired and processed during the data preparation.

7. Conclusions

This algorithm can be implemented to better study the flexion-relaxation phenomenon and the sEMG patterns during full-flexion. Knowing the abnormal patterns and their location applying physiotherapy treatments, it is possible to see if there are pattern improvements, which should approach the gold standard. Through this study, we found the gold standard that best identified FRP and symmetry in the longissimus and multifidus muscles. The subject was used to find the R M S ¯ G S value, the SD, and the first validity range. Then, signals with FRP (RMS values inside the first validity range) were chosen, and the total mean R M S ¯ F R P , SD, and the second validity range were found. The results of this likelihood RMS algorithm, expressed in Table 2, were compared with the VIS reference method of our previous study [21]. The sensitivity, specificity, and accuracy reported in Table 4 showed that the capacity to find FRP absence, using this algorithm, was slightly better than the capacity to find FRP presence. This method can be useful also when, using the VIS and FRR methods, there is any indecision about FRP presence or absence to better define the final result. Clearly, the algorithm should be tested on a different and larger dataset in order to further improve the FRP range of validity. The accuracy and sensitivity are not 100% because of the valuation uncertainty that occurs when values tend to be out of range, but close to it, and the uncertainty of the subjective VIS method. This study also aims to provide and fill in the lack of reference values (RMS) in terms of typical electromyographic signals that occur in the longissimus and multifidus muscles. Therefore, the main future goal is to use this RMS likelihood technique to see if there are any improvements in terms of FRP in subjects with LBP who start physiotherapy. The ability to discriminate healthy from LBP subjects, using the FRP results, must be better investigated by increasing the number of samples.

Author Contributions

Conceptualization, M.P., A.B., L.P. and P.P.; methodology, M.P. and P.P.; software, M.P. and A.B.; validation, M.P. and L.P.; formal analysis, M.P.; investigation, M.P.; resources M.P.; data curation, M.P.; writing–original draft preparation, M.P. and A.B.; writing–review and editing, M.P. and A.B.; visualization, M.P. and A.B.; supervision, P.P.; project administration, P.P.; funding acquisition, M.P. All authors have read and agreed to the published version of the manuscript.

Funding

This research received no external funding.

Acknowledgments

All data were acquired with the support of specialized medical staff of the Santo Stefano Institute laboratory. Voluntary informed consent was acquired for each subject’s participation in the research, and utmost care was taken to ensure data privacy.

Conflicts of Interest

The authors declare no conflict of interest.

References

  1. McGorry, R.W.; Lin, J.H. Flexion relaxation and its relation to pain and function over the duration of a back pain episode. PLoS ONE 2012, 7, e39207. [Google Scholar] [CrossRef] [Green Version]
  2. Oddsson, L.I.; De Luca, C.J. Activation imbalances in lumbar spine muscles in the presence of chronic low back pain. J. Appl. Physiol. 2003, 94, 1410–1420. [Google Scholar] [CrossRef] [Green Version]
  3. Kaplanis, P.; Pattichis, C.S.; Hadjileontiadis, L.; Roberts, V. Surface EMG analysis on normal subjects based on isometric voluntary contraction. J. Electromyogr. Kinesiol. 2009, 19, 157–171. [Google Scholar] [CrossRef]
  4. Jv, B.; De Luca, C. Muscles Alive: Their Functions Revealed by Electromyography. Williams & Wilkins, Baltimore, pp 3946Belenkii V, Gurnkel, VS, Paltsev Y (1967) Elements of control of voluntary movements. Biozika 1967, 12, 135141Carlson. [Google Scholar]
  5. Wolf, S.L.; Nacht, M.; Kelly, J.L. EMG feedback training during dynamic movement for low back pain patients. Behav. Ther. 1982, 13, 395–406. [Google Scholar] [CrossRef]
  6. Marras, W.S.; Lavender, S.A.; Leurgans, S.E.; Rajulu, S.L.; Allread, S.W.G.; Fathallah, F.A.; Ferguson, S.A. The role of dynamic three-dimensional trunk motion in occupationally-related. Spine 1993, 18, 617–628. [Google Scholar] [CrossRef]
  7. Lund, J.P.; Donga, R.; Widmer, C.G.; Stohler, C.S. The pain-adaptation model: A discussion of the relationship between chronic musculoskeletal pain and motor activity. Can. J. Physiol. Pharmacol. 1991, 69, 683–694. [Google Scholar] [CrossRef]
  8. Ahern, D.K.; Follick, M.J.; Council, J.R.; Laser-Wolston, N.; Litchman, H. Comparison of lumbar paravertebral EMG patterns in chronic low back pain patients and non-patient controls. Pain 1988, 34, 153–160. [Google Scholar] [CrossRef]
  9. Andersson, G.; Ortengren, R.; Herberts, P. Quantitative electromyographic studies of back muscle activity relatated to posture and loading. Orthop. Clin. N. Am. 1977, 8, 85–96. [Google Scholar]
  10. Dolce, J.J.; Raczynski, J.M. Neuromuscular activity and electromyography in painful backs: Psychological and biomechanical models in assessment and treatment. Psychol. Bull. 1985, 97, 502. [Google Scholar] [CrossRef]
  11. Floyd, W.; Silver, P. The function of the erectores spinae muscles in certain movements and postures in man. J. Physiol. 1955, 129, 184. [Google Scholar] [CrossRef]
  12. Larivière, C.; Gagnon, D.; Loisel, P. The comparison of trunk muscles EMG activation between subjects with and without chronic low back pain during flexion–extension and lateral bending tasks. J. Electromyogr. Kinesiol. 2000, 10, 79–91. [Google Scholar] [CrossRef]
  13. Sihvonen, T.; Partanen, J.; Hänninen, O.; Soimakallio, S. Electric behavior of low back muscles during lumbar pelvic rhythm in low back pain patients and healthy controls. Arch. Phys. Med. Rehabil. 1991, 72, 1080–1087. [Google Scholar]
  14. Triano, J.J.; Schultz, A.B. Correlation of objective measure of trunk motion and muscle function with low-back disability ratings. Spine 1987, 12, 561–565. [Google Scholar] [CrossRef]
  15. Nouwen, A.; Van, P.A.; Versloot, J.M. Patterns of muscular activity during movement in patients with chronic low-back pain. Spine 1987, 12, 777–782. [Google Scholar] [CrossRef]
  16. Roland, M. A critical review of the evidence for a pain-spasm-pain cycle in spinal disorders. Clin. Biomech. 1986, 1, 102–109. [Google Scholar] [CrossRef]
  17. Wolf, S.; Basmajian, J. Assessment of paraspinal electromyographic activity in normal subjects and in chronic back pain patients using a muscle biofeedback device. Int. Ser. Biomech. VIB 1978, 6B, 319–324. [Google Scholar]
  18. Lehman, G.J.; McGill, S.M. The importance of normalization in the interpretation of surface electromyography: A proof of principle. J. Manip. Physiol. Ther. 1999, 22, 444–446. [Google Scholar] [CrossRef]
  19. Halim, H.N.A.; Azaman, A.; Manaf, H.; Saidin, S.; Zulkapri, I.; Yahya, A. Gait Asymmetry Assessment using Muscle Activity Signal: A Review of Current Methods. J. Phys. Conf. Ser. 2019, 1372, 012075. [Google Scholar] [CrossRef] [Green Version]
  20. Paoletti, M.; Belli, A.; Palma, L.; Paniccia, M.; Tombolini, F.; Ruggiero, A.; Vallasciani, M.; Pierleoni, P. Data acquired by wearable sensors for the evaluation of the flexion-relaxation phenomenon. Data Brief 2020, 31, 105957. [Google Scholar] [CrossRef]
  21. Paoletti, M.; Belli, A.; Palma, L.; Vallasciani, M.; Pierleoni, P. A Wireless Body Sensor Network for Clinical Assessment of the Flexion-Relaxation Phenomenon. Electronics 2020, 9, 1044. [Google Scholar] [CrossRef]
  22. Neblett, R.; Brede, E.; Mayer, T.G.; Gatchel, R.J. What is the best surface EMG measure of lumbar flexion-relaxation for distinguishing chronic low back pain patients from pain-free controls? Clin. J. Pain 2013, 29, 334. [Google Scholar] [CrossRef] [Green Version]
  23. Neblett, R.; Mayer, T.G.; Gatchel, R.J.; Keeley, J.; Proctor, T.; Anagnostis, C. Quantifying the lumbar flexion–relaxation phenomenon: Theory, normative data, and clinical applications. Spine 2003, 28, 1435–1446. [Google Scholar] [CrossRef]
  24. Schinkel-Ivy, A.; Nairn, B.C.; Drake, J.D. Evaluation of methods for the quantification of the flexion-relaxation phenomenon in the lumbar erector spinae muscles. J. Manip. Physiol. Ther. 2013, 36, 349–358. [Google Scholar] [CrossRef]
  25. Neblett, R.; Mayer, T.G.; Brede, E.; Gatchel, R.J. Correcting abnormal flexion-relaxation in chronic lumbar pain: Responsiveness to a new biofeedback training protocol. Clin. J. Pain 2010, 26, 403. [Google Scholar] [CrossRef] [Green Version]
  26. Sella, G.E. Muscles in Motion: The SEMG of the ROM of the Human Body; GENMED Pub.: Martins Ferry, OH, USA, 2002. [Google Scholar]
  27. Nord, S.; Ettare, D.; Drew, D.; Hodge, S. Muscle learning therapy—Efficacy of a biofeedback based protocol in treating work-related upper extremity disorders. J. Occup. Rehabil. 2001, 11, 23–31. [Google Scholar] [CrossRef]
  28. Peper, E.; Gibney, K.H. Healthy Computing with Muscle Biofeedback: A Practical Manual for Preventing Repetitive Motion Injury; Biofeedback Foundation of Europe: Woerden, The Netherlands, 2000. [Google Scholar]
  29. Redfern, M.S.; Hughes, R.E.; Chaffin, D.B. High-pass filtering to remove electrocardiographic interference from torso EMG recordings. Clin. Biomech. 1993, 8, 44–48. [Google Scholar] [CrossRef] [Green Version]
  30. Ritvanen, T.; Zaproudina, N.; Nissen, M.; Leinonen, V.; Hänninen, O. Dynamic surface electromyographic responses in chronic low back pain treated by traditional bone setting and conventional physical therapy. J. Manip. Physiol. Ther. 2007, 30, 31–37. [Google Scholar] [CrossRef]
  31. Sánchez-Zuriaga, D.; López-Pascual, J.; Garrido-Jaén, D.; García-Mas, M.A. A comparison of lumbopelvic motion patterns and erector spinae behavior between asymptomatic subjects and patients with recurrent low back pain during pain-free periods. J. Manip. Physiol. Ther. 2015, 38, 130–137. [Google Scholar] [CrossRef]
  32. Kuiken, T.A.; Lowery, M.; Stoykov, N. The effect of subcutaneous fat on myoelectric signal amplitude and cross-talk. Prosthet. Orthot. Int. 2003, 27, 48–54. [Google Scholar] [CrossRef] [Green Version]
  33. Hermens, H.J.; Freriks, B.; Merletti, R.; Stegeman, D.; Blok, J.; Rau, G.; Disselhorst-Klug, C.; Hägg, G. European recommendations for surface electromyography. Roessingh Res. Dev. 1999, 8, 13–54. [Google Scholar]
  34. Nougarou, F.; Massicotte, D.; Descarreaux, M. Detection method of flexion relaxation phenomenon based on wavelets for patients with low back pain. EURASIP J. Adv. Signal Process. 2012, 2012, 151. [Google Scholar] [CrossRef] [Green Version]
  35. Paoletti, M.; Belli, A.; Palma, L.; Paniccia, M.; Tombolini, F.; Ruggiero, A.; Vallasciani, M.; Pierleoni, P. Dataset for clinical assessment of flexion-relaxation phenomenon. Mendeley Data 2020, 1. [Google Scholar] [CrossRef]
  36. Sihvonen, T.; Partanen, J.; Hanninen, O. Averaged (rms) surface EMG in testing back function. Electromyogr Clin. Neurophysiol. 1988, 28, 335–339. [Google Scholar]
Figure 1. Measurement equipment: sEMG system and IMU.
Electronics 09 02046 g001
Figure 2. Application points of the electrodes, following the European recommendations [33]. The cross indicates the application points, while the dots indicate the references.
Electronics 09 02046 g002
Figure 3. Flexion-extension phases: (1) standing phase; (2) flexion phase; (3) full flexion phase; (4) extension phase. This forward bend test was repeated for four times.
Electronics 09 02046 g003
Figure 4. Graphic representation of the segmentation used to obtain the full-flexion phases of the same length. Only one channel is shown, but it is the same for all the other channels. In Step 1 and Step 2, the phases are depicted with the same length for simplicity, but they are not perfectly equal, while in Step 3, they are the same length. S = standing, F = flexion, FF = full flexion, E = extension, FF’ = new full flexion.
Electronics 09 02046 g004
Figure 5. Graphic representation with the signals superimposition (filtered sEMG signal in blue, inclination signal in red, phases signal in green), phases (upper numbers: 1 standing, 2 flexion, 3 full-flexion, 4 extension), and cycles (lower numbers). This refers to a healthy subject (ID [20]).
Electronics 09 02046 g005aElectronics 09 02046 g005b
Figure 6. Real representation of Step 3 referred to the gold standard subject (ID2).
Electronics 09 02046 g006
Figure 7. This is the second part of the graphic representation for the segmentation used to obtain the final decision. Only one channel is shown, but it is the same for all the other channels. Step 4 is the zoom of Step 3 referred to a gold standard subject. Step 5 is referred to a generic subject, and there is another segmentation, so there are 10 RMS sEMG values for each FF’ cycle. In Step 6 is depicted the comparison between the gold standard and the generic subject.
Electronics 09 02046 g007
Figure 8. Block diagram. The switch symbolizes the selection of the RMS values within the validity range.
Electronics 09 02046 g008
Figure 9. Graphic representation of Table 1 and Table 2, related to the last iteration. The blue line is the mean RMS value, while the red lines represent the upper and lower bounds of the FRP validity range. Blue circles are the RMS values that identify FRP presence, while the red crosses are the RMS values that identify FRP absence.
Electronics 09 02046 g009
Figure 10. Box-plot representation for all the 25 subjects from Table 1.
Electronics 09 02046 g010
Figure 11. Superimposition between sEMG full-flexion signals of ID2 and ID4. The blue signals in front refer to the ID2 (gold standard (GS)), while the others on the back refer to ID4 (LBP patient). The sEMG signal of the LBP patient is in red when the mean RMS value, on the 10 segments represented in Figure 7 Step 6, is outside the FRP validity range; in green when all sEMG RMS values on the segments are in the validity range; in yellow if there is one or more segments with an outer value with respect to the validity range, but the overall mean on the 10 segments is inside the range.
Electronics 09 02046 g011
Table 1. Representation of the RMS values: the mean is calculated for each FF’ cycle as represented in Step 6 of Figure 7.
Subject IDRMS (LSX)RMS (LDX)RMS (MSX)RMS (MDX)
1234123412341234
13.793.803.933.923.714.064.284.294.463.653.613.643.993.784.044.02
23.593.683.553.673.523.623.463.583.513.433.553.733.373.643.503.78
33.603.773.493.683.643.773.593.384.094.305.984.133.563.593.583.55
410.885.033.663.5314.714.663.713.7424.0914.228.817.3033.6214.626.445.92
510.9010.679.446.4613.1213.7710.845.9312.2711.8411.566.8415.9716.8414.869.11
633.1835.3742.7735.9519.5620.1522.5322.7822.9220.1030.2326.2016.3719.5623.1719.28
75.103.793.603.605.675.164.635.089.384.844.904.484.774.384.294.48
85.905.387.456.289.909.569.879.4010.6211.3013.6411.4713.0012.0712.2911.85
98.753.753.933.828.574.204.084.2916.979.639.086.5814.719.3210.618.56
1012.0111.1411.197.679.119.1310.185.5313.1213.6412.028.0810.2311.5610.294.75
1114.691514.303.7616.514.2315.694.0821.0522.7219.913.8121.1921.80214.32
123.413.403.333.454.734.434.284.123.293.123.263.204.224.204.274.37
1312.4812.5711.1212.535.795.135.465.0326.6824.9827.6230.2630.4327.9231.9229.50
1411.755.344.97510.175.285.064.6030.3120.4816.7914.3626.6217.3614.6712.58
1510.644.966.244.176.174.614.423.6212.779.089.266.719.876.636.104.90
164.475.384.405.164.451.833.864.494.084.764.424.474.745.004.535.08
174.483.294.134.116.084.604.984.773.933.674.374.144.633.964.564.43
183.933.603.833.713.853.944.004.114.374.353.953.8912.134.994.504.23
1929.0625.6122.9723.5627.5226.1523.9519.2025.8024.1823.7723.2731.0730.5632.0128.95
203.763.643.903.983.493.443.533.513.263.333.433.593.433.643.473.70
214.183.903.643.423.823.743.623.683.943.724.194.493.273.604.223.55
2215.7815.6016.508.5011.8711.2111.555.6916.1210.3510.587.2815.789.318.156.50
237.698.468.056.5929.2020.6622.9717.1434.1042.0940.0443.6911.8114.0413.2512.89
2423.4521.1922.1920.7926.0030.9027.1322.6731.5438.2627.5623.7312.7017.177.555.97
2512.4010.789.9111.1620.9021.2422.9824.0120.7121.6421.6023.2422.0315.3913.7514.51
Table 2. Results of the proposed likelihood algorithm. The ID2 subject is the gold standard. P = positive, subject with FRP in the considered cycle of the corresponding channel. N = negative, subject without FRP in the considered cycle of the corresponding channel. LPB, lower back pain.
Subject IDSEXAGEGROUPLSXLDXMSXMDX
1234123412341234
1F51LBPPPPPPPPPPPPPPPPP
2F40HEALTHY (GOLD STANDARD)PPPPPPPPPPPPPPPP
3F34HEALTHYPPPPPPPPPPNPPPPP
4M57LBPNPPPNPPPNNNNNNNN
5M30LBPNNNNNNNNNNNNNNNN
6M31HEALTHYNNNNNNNNNNNNNNNN
7M35HEALTHYPPPPPPPPNPPPPPPP
8M25HEALTHYNPNNNNNNNNNNNNNN
9M58LBPNPPPNPPPNNNNNNNN
10F52LBPNNNNNNNPNNNNNNNP
11F46LBPNNNPNNNPNNNPNNNP
12F40HEALTHYPPPPPPPPPPPPPPPP
13M49LBPNNNNNPPPNNNNNNNN
14F49LBPNPPPNPPPNNNNNNNN
15F51LBPNPNPNPPPNNNNNNNP
16F60HEALTHYPPPPPNPPPPPPPPPP
17F36HEALTHYPPPPNPPPPPPPPPPP
18M22HEALTHYPPPPPPPPPPPPNPPP
19M52LBPNNNNNNNNNNNNNNNN
20F22HEALTHYPPPPPPPPPPPPPPPP
21M60HEALTHYPPPPPPPPPPPPPPPP
22F51HEALTHYNNNNNNNPNNNNNNNN
23M60LBPNNNNNNNNNNNNNNNN
24M61LBPNNNNNNNNNNNNNNNN
25M52HEALTHYNNNNNNNNNNNNNNNN
Table 3. Summary statistical results of the previous table. The RMS sEMG unit of measurement is μV.
GROUPSAMPLESRMS (MEAN)RMS (STD)
POSITIVE1904.090.58
NEGATIVE21016.688.60
Table 4. Test results: RMS likelihood algorithm compared to the VIS method (used as the reference method).
TPTNFPFNACCURACYSENSITIVITYSPECIFICITY
167182232887%86%89%
Table 5. Summary test results about the capacity of this algorithm to discriminate healthy controls from LBP patients.
TPTNFPFNACCURACYSENSITIVITYSPECIFICITY
9111480%69%92%
Publisher’s Note: MDPI stays neutral with regard to jurisdictional claims in published maps and institutional affiliations.