Abstract
Image signal processing has considerable value in artificial intelligence. However, due to the diverse disturbance (e.g., color, noise), the image signal processing, especially the representation of the signal, remains a big challenge. In the human visual system, it has been justified that simple cells in the primary visual cortex are obviously sensitive to vision signals with partial orientation features. In other words, the image signals are extracted and described along the pathway of visual processing. Inspired by this neural mechanism of the primary visual cortex, it is possible to build an image signal-processing model as the neural architecture. In this paper, we presented a method to process the image signal involving a multitude of disturbance. For image signals, we first extracted 4 rivalry pathways via the projection of color. Secondly, we designed an algorithm in which the computing process of the stimulus with partial orientation features can be altered into a process of analytical geometry, resulting in that the signals with orientation features can be extracted and characterized. Finally, through the integration of characterizations from the 4 different rivalry pathways, the image signals can be effectively interpreted and reconstructed. Instead of data-driven methods, the presented approach requires no prior training. With the use of geometric inferences, the method tends to be interpreted and applied in the signal processor. The extraction and integration of rivalry pathways of different colors allow the method to be effective and robust to the signals with the image noise and disturbance of colors. Experimental results showed that the approach can extract and describing the image signal with diverse disturbance. Based on the characterization of the image signal, it is possible to reconstruct signal features which can effectively represent the important information from the original image signal.
1. Introduction
With the development of the artificial intelligence, automotive robots with advanced vision-perception-based systems raise several timing issues. For the vision signals captured by robots, how can the robots extract the valuable information from the signals and describe the features of them? In addition, how can the characterization of the signal information be interpreted and applied in monitoring and mission planning (e.g., scene understanding, autonomous navigation, object recognition and grasping) in robots? For all these problems, the extraction and description of the information (image signal), which has been discussed as a fundamental issue for decades, is increasingly playing an important role in the vision-perception. However, due to the diverse disturbance, such as the color and noise, the issue remains a challenging problem.
In the human visual system, the stimuli from the environment can project onto the retina and the vision information is processed by neural coding and analyzing, resulting in the sensation and perception. This signal processing for computing should be a complex system in which the optical signal can be effectively altered into a neural signal that is liable to be coded and analyzed. It is indicated that the visual signal has been processed and characterized along the pathway from the retina to the primary visual cortex, and the simple cells have been sensitive to the signal with stimuli of partial orientation. Hence, extracting and characterizing the visual signal involving the partial orientation has fundamental and considerable value in processing of bio-representation.
In this paper, we presented an approach to model the signal processing for brain-inspired computing. First, the four rivalry pathways can be extracted from the original image signal through the color projection. Then, based on the DOG (difference of Gaussian) model, an algorithm was designed to alter the processing of computing the stimuli of partial orientation into the issue of analytical geometry. Accordingly, it is possible to extract and represent the image signal with the partial orientation. Finally, the representation from the four different rivalry pathways can be integrated, allowing it to be interpreted and reconstructed.
Compared to the current methods that are always driven by the labeled data, the presented approach requires no prior training. For the changes in illumination and color, the method can deal with the disturbance via the rivalry pathways by color projections. Moreover, using the geometric inferences, the algorithm is liable to be interpreted and robust. Experimental results showed that our approach can effectively extract and describe the image signal, resulting in the representation that can be reconstructed to represent the important information from the original image signal.
To this end, an algorithm based on biological retina is presented to model the signal processing, and it is practical for effectively detecting line segments. The main contributions of this paper are as follows:
- a method designed to effectively process the color disturbance through the color projection;
- an algorithm developed to alter the computing processing of the stimuli of partial orientation into the issue of analytical geometry, which is more interpretable and robust;
- an approach presented to integrate the representation from four different rivalry pathways, allowing the representation to be described and reconstructed as the original image signal.
2. Related Work
In the human visual system, the signal from the environment is essentially an optical signal. In existing works impressive progress has indicated that the optical signal can be altered into a neural signal in the retina [1]. Moreover, in this signal processing, the number of input units (photoreceptor) is about ( rod cells and cone cells), whereas the number of output units (ganglion cells) is about [1,2,3,4,5]. It means that the signal has been extracted and represented in this process, resulting in the compressed signal that can be liable to be processed in the subsequent mission [2].
In the process of sampling in retina, the photoreceptor that is to transform the optical signal to the neural signal appears a nonuniform distribution [6]. In order to simulate this sampling strategy, Balasuriya designed an algorithm in which an iterative process and a distribution with different densities were experimented in the processing of image signals [7,8]. It proved that the strategy had an advantage of eliminating the redundant signals. The simple cells in the primary cortex are justified to detect the stimuli of orientation in the receptive field [9]. The cells with receptive fields in the lateral geniculate body stand in a column, shaping a simple cell with receptive field orientation [10]. Instead of processing in one pathway of vision, the signal of stimuli can be coded in different categories and transmitted parallelly along the different pathways.
There are classic features description methods. A method was presented for extracting distinctive invariant features from images that are invariant to image scale and rotation [11]. Through comparing the performance of descriptors computed for local interest regions, Mikolajczyk also proposed an extension of the SIFT descriptor that outperforms the original method [12]. Liu presented a contour-based representation of binary objects in raster images [13]. For existing studies using chain codes to represent the image signal, the chain code might be too small to reflect micro-features that can involve considerable data [14]. Khan proposed a shape representation scheme based on B-splines, wherein the control points that represent the shape are repaired and subsequently evolved [15]. The methods adopted spline curves to fit the signal of image, but the accuracy of the representation of image signal relies on point-set and selection of coordinate system [16]. Also, Wei and Wang presented an efficient visual cortex inspired imaging-sensor architecture and an approach of constraint propagation examination to extract and process images [17]. Approaches with the use of polygon approximation tend to be sensitive to posture and size, which can affect the forming of polygons [18]. Meanwhile, a method for assessing the accuracy of unsupervised polygonal approximation algorithms was presented [19]. Hu introduced a method to extract salient features from surfaces that are represented by triangle meshes [20]. Nasreddine defined a multi-scale distance between shapes that are based on geodesics in the shape space [21]. As to these two methods based on the scale-features, it is difficult to build descriptors accurately because of the disturbance of color, brightness, and noise. In two-dimensional space, Direkoglu proposed a multi-scale Fourier-based object description via a low-pass Gaussian filter and a high-pass Gaussian filter [22]. Similarly, Arai presented a visualization method for representation of three-dimensional object shape complexity on base of the proposed wavelet descriptor [23]. Such disturbance also limits the methods using Hu-moment, Fourier, wavelet, or geometric spectrum descriptors, resulting in the difficulty of processing the image signals.
Therefore, inspired by the psychological theory and human cognitive processing, this paper presents an algorithm that can process the signal of image with the disturbance of color, brightness and noise. The goal of the paper is to introduce an algorithm based on biological retina that can be used in the signal processing, and it is practically applied for effectively detecting line segments, which can help robots extract the valuable information from the signals. It is obvious that there are different requirements of precision in various areas in a picture. Therefore, inspired by neural mechanism, we presented a sampling strategy in which pixels of the picture are seen as continuous color regions, making sampling irrelevant to pixels.
3. Inference
As shown in Figure 1, there are five layers and two pathways (labeled P and M) in the architecture of signal-processing model. It is obvious that there are different requirements of precision in various areas in a picture. Therefore, inspired by neural mechanism, we presented a sampling strategy in which pixels of the picture are seen as continuous color regions, making sampling irrelevant to pixels. As shown in Figure 2 (left), rectangles with different gray scales represent the amplified pixels columns, while the dotted circle represents the ganglion cell’s receptive field. It is seen that the image signals are sampled and processed by these ganglion cell’s receptive fields with different scales and densities. For the amplified circular receptive field shown in Figure 2 (right), the photoreceptor appears a hexagon with a uniform distribution. Through the hexagon, which is the sampling unit, the sampled information can be processed via DOG and it is transferred to the ganglion cell in which the information would be simply preprocessed. As for the addition of two Gaussian functions (in Figure 2, right-top), the yellow area related to the center of receptive field represents the input of stimulus, whereas the blue area corresponding to the circumjacent area of receptive field indicates the restrainable input.
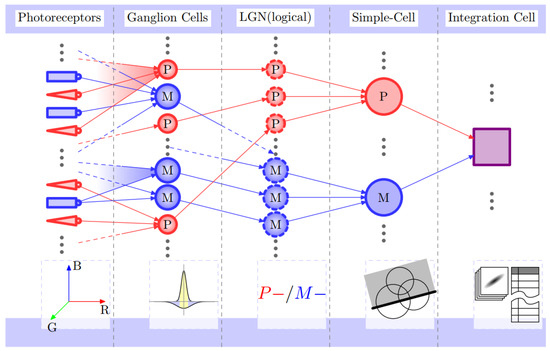
Figure 1.
The architecture of signal-processing model. There are 5 layers in the structure. The red pathway (labeled P) represents that it is sensitive to colors (e.g., R, G, B), while the blue pathway (labeled M) is sensitive to gray scale. These two pathways are both involved in the integration of representation for image signals.
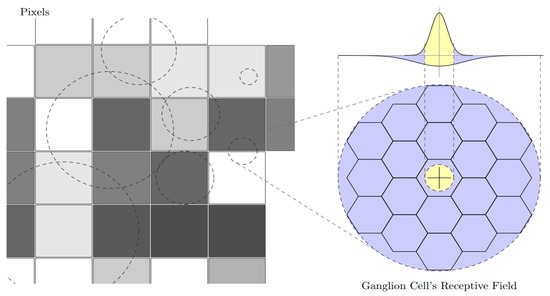
Figure 2.
(Left) rectangles with different gray scales represent the amplified pixels columns, while the dotted circles represent the ganglion cell’s receptive fields; (Right) the photoreceptor appears a hexagon with a uniform distribution. The yellow and blue area is related to the center and circumjacent area of receptive field, representing the stimulus and restrainable input, respectively.
For each pixel in the signal of image, it can be defined as follows,
The pixels can be expressed in a cubic of , as shown in the Figure 3. Then the point in the cubic can be projected onto the four different pathways, as shown in the Figure 3.
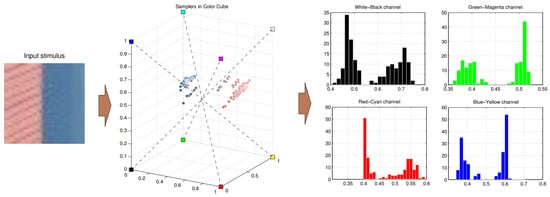
Figure 3.
An example for color projection. For an input stimulus, each pixel can be expressed in a cubic of . The value of color can be projected on the different pathway.
The response of each ganglion cell can be represented as an annulus. It means that a partial stimulus of orientation is tangent to the annulus. The filled circle means that the stimuli covers the center. Instead, it can be described as a hollow one, as shown in Figure 4.
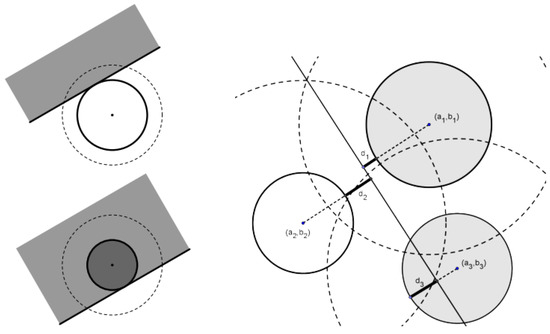
Figure 4.
An example for transformation from the processing of computing partial stimuli of orientation to an optimal calculation of analytical geometry.
In this way, the processing of computing partial stimuli of orientation can be transformed into an optimal calculation of analytical geometry. Given the three circles in the plane, it is to determine a line that can be modeled as following,
where the optimal solution represents the most possible stimuli formulation: .
In the process of computing the optimal solution, the initial value of the solution is important to estimate the optimal solution. As shown in Figure 5, there are eight situations for different initial lines. The green annulus represents that the partial stimuli has not covered the center, while the red one means that the stimulus has covered the center. The triangle consists of three lines between the three centers of receptive fields.
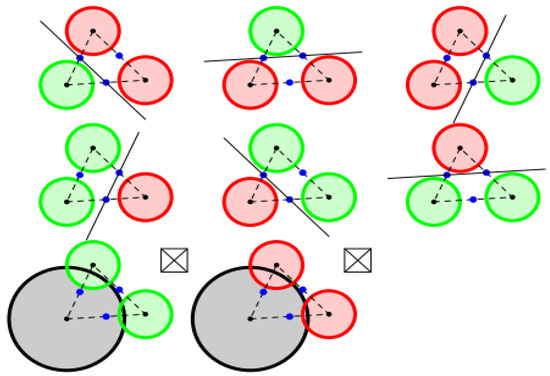
Figure 5.
An example for the estimation of the initial value of the solution.
In the four visual pathways, the stimulus of partial orientation can be respectively represented. Since they share the same receptive field, the representation can be integrated, as shown in the Figure 6.
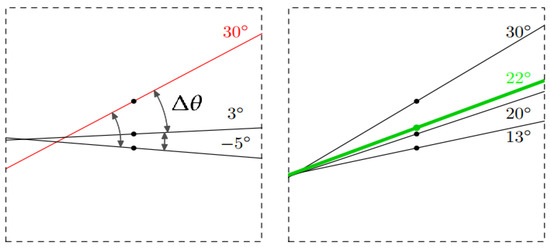
Figure 6.
An example for the integration of the representation in different pathways. The dotted rectangle can be seen as a shared receptive field. (Left) the red line should be eliminated, for the angle of red line is far from other two lines; (Right) the stimulus of partial orientation can be represented by the green line.
In the process of integration, the strategy for the shared receptive field can be defined as follows: (1) when there are less than two stimuli of partial orientation in the receptive field, the representation can be abandoned; (2) the angles of stimulus of partial orientation in different pathways can be determined, and the error of angles between them can be estimated; (3) if the error angle exceeds the preset threshold (e.g., 20), it means that there might be a mistake or error in the process, resulting in that the representation on this receptive field can be eliminated; (4) for the angle that satisfies the constraint of preset threshold, the parameters of the stimulus (e.g., position, orientation) can be described as average value, and the strength of response can be expressed as the max value.
Here represents the error between angles of stimulus of partial orientation in different pathways. In the Figure 6 left, the dotted rectangle can be seen as a shared receptive field, in which there are three representations of the stimulus of partial orientation. First, the red line should be eliminated, for the angle of red line appears too far from other two representation, and also it means that there might be a mistake in the process. In the Figure 6 right, the error angle between the representations is less than the preset threshold, so the stimulus of partial orientation can be represented by the average value (green line).
4. Experiment
4.1. Line Detection
First, experiment performed on artificial images to measure the proposed neural model based on biological retina, as shown in Figure 7. Blue circles represent the ganglion cell’s receptive fields, respectively. The union set that these three blue circles share can be seen as the receptive field of simple cells. The red and green circles are the response of ganglion cells for input stimulus. The green means the shadow edge does not cover the center, while the red means the shadow edge has covered the center area. Here the number following the “Detected” means the angle of orientation, while “Discard” means this area cannot be detected. Here the figure shows the “white-black” pathway. Since four pathways share this receptive field, other pathway can be similarly inferred.
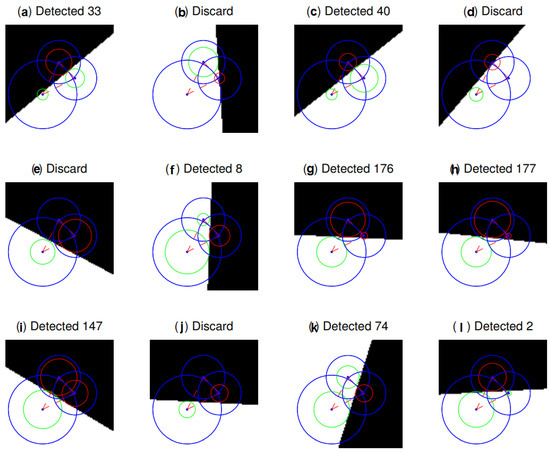
Figure 7.
An example of experiment that was performed on artificial images. Blue circles mean receptive fields of the ganglion cells, respectively. The union set these three blue circles share can be considered to be the simple cell’s receptive field. For input stimulus, the red and green circles are the response of ganglion cells. The green represents the shadow edge does not cover the center, while the red means the shadow edge cover the center area. Here the number following the “Detected” means the orientation angle, while “Discard” means this area cannot be detected.
Second, experiments were performed on nature images, as shown in Figure 8. At the top of each images, the four elements in matrix (e.g., , top left) means the representation of simple cells in four pathways (white-black, red-cyan, green-azaleine and blue-yellow), respectively. Here 0 means the representation is failed in corresponding pathway.
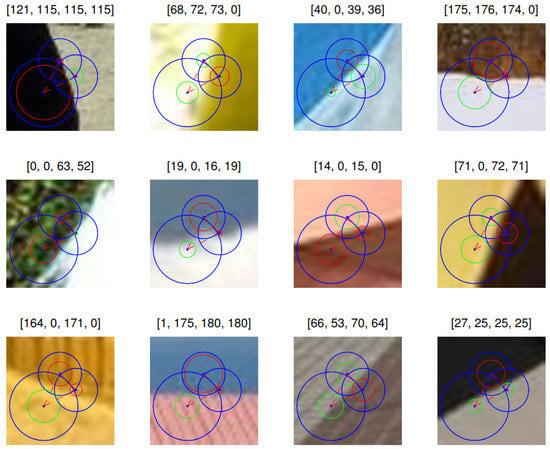
Figure 8.
An example of experiments that were performed on nature images. At the top of each image, the four elements in matrix (e.g., , top left) means the representation of simple cells in four pathways (white-black, red-cyan, green-azaleine and blue-yellow), respectively. Here 0 means the representation is failed in corresponding pathway.
4.2. Representation and Reconstruction
Take an image as an example, as shown in Figure 9. For the signal of original Figure 9a,b, our method can cope with the disturbance such as color, noise without any prior training. The representation in Figure 9a can be shown in Table 1, which means that there are 875 lines. Through simple geometric inference, the proposed approach appears more interpretable and similar to the process of human vision. Experimental results showed that the algorithm can effectively represent and reconstruct the image signal, as shown in Figure 9c,d.
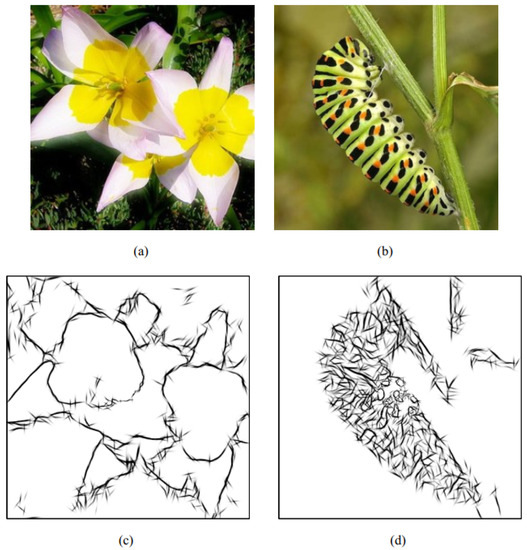
Figure 9.
An example of reconstructing the signal of image by the proposed representation. (a,b) The signal of original figures. (c,d) reconstruction by our method.

Table 1.
Representation on Figure 9a.
In addition, more experimental results also were performed on a database of images, as shown in Figure 10.
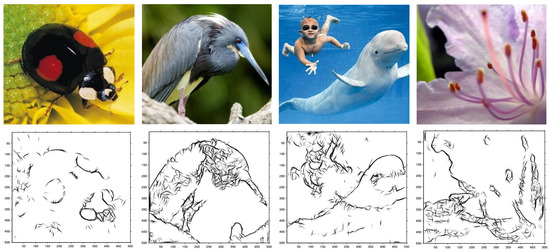
Figure 10.
More examples were performed. (First row) input images from FDWW database [24]; (Second row) reconstruction by the proposed representation. Obviously, our approach can process the images involving disturbance (e.g., color and noise) and reconstruct images by the proposed representation, without any prior training.
5. Conclusions
Inspired by neural mechanism of primary visual cortex, the current work presents a method of processing the image signal involving a multitude of disturbance such as color and noise. Through the color projection, four rivalry pathways can be extracted. Then an algorithm was developed to transform the process of computing the stimulus of partial orientation to the problem of determining the optimal solution of the analytical geometry. Finally, the image signal can be represented by integration of characterizations from the different rivalry pathways. In contrast to the data-driven approaches, the proposed method requires no prior training. In addition, with the use of geometric rules, the proposed approach can deal with the signal which even contains a lot of disturbance of color and noise. The experimental results showed that the signal can be effectively reconstructed by the representation via the proposed method, making a considerable contribution to its success.
Author Contributions
H.W.: Conceptualization, methodology, funding acquisition; L.W.: Writing—original draft, writing—review & editing; S.W.: Formal analysis, data curation, software, validation; Y.J.: Writing—original draft, writing—review & editing; J.L.: Formal analysis. All authors have read and agreed to the published version of the manuscript.
Funding
This research was funded by the NSFC Project (grant number 61771146 and 61375122), the National Thirteen 5-Year Plan for Science and Technology (grant number 2017YFC1703303), the Key Project of National Key R&D Project (No. 2017YFC1703303), (in part) by Shanghai Science and Technology Development Funds (grant number 13dz2260200, 13511504300).
Acknowledgments
This work was supported by the NSFC Project (Project Nos. 61771146 and 61375122), the National Thirteen 5-Year Plan for Science and Technology (Project No. 2017YFC1703303), the Key Project of National Key R&D Project (No. 2017YFC1703303), (in part) by Shanghai Science and Technology Development Funds (Project Nos. 13dz2260200, 13511504300).
Conflicts of Interest
The authors declare no conflict of interest.
References
- Masland, R. The fundamental plan of the retina. Nat. Neurosci. 2001, 4, 877–886. [Google Scholar] [CrossRef] [PubMed]
- Kolb, H. How the Retina Works. Am. Sci. 2003, 91, 28–35. [Google Scholar] [CrossRef]
- Wei, H.; Ren, Y. A Computational Neural Model of Orientation Detection Based on Multiple Guesses: Comparison of Geometrical and Algebraic Models. Cogn. Neurodyn. 2013, 7, 361–379. [Google Scholar] [CrossRef] [PubMed]
- Wei, H.; Ren, Y. A Mathematical Model of Retinal Ganglion Cells and Its Applications in Image Representation. Neural Process. Lett. 2013, 38, 205–226. [Google Scholar] [CrossRef]
- Wei, H.; Ren, Y. An Orientation Detection Model Based on Fitting from Multiple Local Hypotheses. In Proceedings of the International Conference on Neural Information Processing, Doha, QC, Qatar, 12–15 November 2012; pp. 383–391. [Google Scholar]
- Jonas, J.B.; Naumann, G. Count and density of human retinal photoreceptors. Graefe’s Arch. Clin. Exp. Ophthalmol. 1992, 230, 505–510. [Google Scholar] [CrossRef] [PubMed]
- Balasuriya, S. A biologically inspired computational vision frontend based on a self-organised pseudo-randomly tessellated artificial retina. In Proceedings of the International Joint Conference on Neural Networks, Montreal, QC, Canada, 31 July–4 August 2005; pp. 3069–3074. [Google Scholar]
- Xuan, S.D.; Ding, S.; Zhai, Q.; Li, Y.; Zhu, J. Simultaneous Body Part and Motion Identification for Human-Following Robots. Pattern Recognit. 2016, 50, 118–130. [Google Scholar]
- Jones, J.P. An evaluation of the two-dimensional Gabor filter model of simple receptive fields in cat striate cortex. J. Neurophysiol. 1987, 58, 1233–1258. [Google Scholar] [CrossRef] [PubMed]
- Hubel, D.H. Receptive fields, binocular interaction and functional architecture in the cat’s visual cortex. J. Physiol. 1962, 160, 106–156. [Google Scholar] [CrossRef] [PubMed]
- Lowe, D. Distinctive image features from scale-invariant keypoints. Int. J. Comput. Vis. 2004, 60, 91–110. [Google Scholar] [CrossRef]
- Mikolajczyk, K. A performance evaluation of local descriptors. IEEE Trans. Pattern Anal. Mach. Intell. 2005, 27, 1615–1630. [Google Scholar] [CrossRef] [PubMed]
- Liu, Y.-K.; Zalik, B. Directional difference chain codes with quasi-lossless compression and runlength encoding. Signal Process. Image Commun. 2012, 27, 973–984. [Google Scholar] [CrossRef]
- Zhang, Q.; Liu, J.; Wang, Q.; Xu, G.; Xue, Y. A shape contour description method based on chain code and fast Fourier transform. In Proceedings of the Seventh International Conference on Natural Computation, Shanghai, China, 26–28 July 2011; pp. 1809–1812. [Google Scholar]
- Khan, M.S.; Ayob, A.F.M.; Isaacs, A.; Ray, T. A novel evolutionary approach for 2D shape matching based on B-spline modeling. In Proceedings of the IEEE Congress of Evolutionary Computation (CEC), New Orleans, LA, USA, 5–8 June 2011; pp. 655–661. [Google Scholar]
- Grove, O.; Rajab, K.; Piegl, L.A.; Lai-Yuen, S. From CT to NURBS: Contour fitting with B-spline curves. Comput. Aided Des. Appl. 2011, 8, 3–21. [Google Scholar] [CrossRef][Green Version]
- Wang, H.W. A Visual Cortex-Inspired Imaging-Sensor Architecture and Its Application in Real-Time Processing. Sensors 2018, 18, 2116. [Google Scholar]
- Carmona-Poyato, A.; Madrid-Cuevas, F.J.; Medina-Carnicer, R.; Muñoz-Salinas, R. Polygonal approximation of digital planar curves through break point suppression. Pattern Recognit. 2010, 43, 14–25. [Google Scholar] [CrossRef]
- Carmona-Poyato, A.; Medina-Carnicer, R.; Fernandez-Garcia, N. A new measurement for assessing polygonal approximation of curves. Pattern Recognit. 2011, 44, 45–54. [Google Scholar] [CrossRef]
- Hu, J.; Hua, J. Salient spectral geometric features for shape matching and retrieval. Vis. Comput. 2009, 25, 667–675. [Google Scholar] [CrossRef]
- Nasreddinea, K.; Benzinoua, A.; Fablet, R. Variational shape matching for shape classification and retrieval. Pattern Recognit. Lett. 2010, 31, 1650–1657. [Google Scholar] [CrossRef]
- Direkoglu, C.; Nixon, M.S. Shape classification via image-based multiscale description. Pattern Recognit. 2011, 44, 2134–2146. [Google Scholar] [CrossRef]
- Arai, K. Visualization of 3D object shape complexity with wavelet descriptor and its application to image retrievals. J. Vis. 2012, 15, 155–166. [Google Scholar] [CrossRef]
- Wang, H.W. Understanding of Indoor Scenes Based on Projection of Spatial Rectangles. Pattern Recognit. 2018, 81, 497–514. [Google Scholar]
© 2019 by the authors. Licensee MDPI, Basel, Switzerland. This article is an open access article distributed under the terms and conditions of the Creative Commons Attribution (CC BY) license (http://creativecommons.org/licenses/by/4.0/).