1. Introduction
The human-computer interface (HCI) is one of the key technologies used to improve the interaction between human and computer. In terms of usability of HCI, it is very important to study interfaces that can give commands to computers in a more human-friendly way. There are various interface approaches for HCI including voice, gesture, electroencephalogram (EEG) from brain, eye movement, etc., and the characteristics of each type are clear [
1]. First, the voice-based HCI is a technology that receives the voice of a user by using a microphone and recognizes the user’s intention through language processing. This technology has been steadily evolving since recognizing certain commands and has evolved into technologies such as voice typing and natural language processing [
2,
3]. This method is very attractive since it is very intuitive and can directly transmit the user’s command. However, the performance of this system is very dependent on the type of users, ambient noise, and performance of natural language processing. Gesture-based HCI can recognize movements of the hands or fingers through a camera or electromyogram (EMG). Recently, the recognition rate and recognition speed have been greatly improved [
4,
5]. However, the use of this type of HCI method seems to be very limited since the conventional interfaces using hands including keyboard, mouse, remote control, and touch screen are much comfortable and reliable. The EEG from brain-based interface is a technique that recognizes the user’s intention by receiving bio-signals through electrodes attached to the scalp near the brain [
6,
7]. Although it is ideal in the sense that it can transfer the user’s intuition to computer more directly than voice, but the practical use of EEG-based HCI or brain computer interface (BCI) is expected to be very limited due to the lack of usability. It is very difficult to attach electrodes to various parts of the scalp and maintain the attachment position during measurement. The last type is eye movement-based HCI. Eye movement-based HCI technologies are mainly divided into two types, camera-based HCI and EOG-based HCI. In general, camera-based eye tracking systems require a small camera to capture an image of the eyeball and find the gazing position by mapping the eyeball position to the screen. Camera-based eye movement tracking systems have the advantage of directly determining the position that the user is currently gazing at. Camera-based systems have been continuously researched and their performance is continuously improving. Recently, commercialized camera-based eye-mouse products have been introduced [
8]. However, despite several advantages, there is a problem in implementing click operation using blinking since the user may be blinking regardless of a click and may result in a malfunction. Additionally, the cost of system and portability are also considered to be disadvantages. EOG-based HCI systems have also been researched continuously. Wu et al. developed an EOG-based wireless HCI system for detecting eyes movements in eight directions with a simple system and short computational time [
9]. Mulam et al. developed a HCI system to recognize four kinds of eye movement and blinking action using neural networks [
10]. The EOG signals are decomposed by empirical mean curve decomposition (EMCD) process and principal component analysis (PCA) is used to reduce the signal dimension. Compared to similar approaches, these methods showed enhanced accuracy and precision. Most of EOG-based HCI systems including Wu and Mulam’s system detect the up, down, left, and right movements or blinking of eyes using pattern recognition algorithms and uses them as commands for HCI. In other words, in conventional ways, only a series of discrete commands can be executed, and it cannot recognize the variance of gazing positions since it cannot determine how much the eyeball has moved.
Ang et al. developed an EOG-based HCI using a commercial wearable device (NeuroSky Mind Wave headset) [
11]. They applied their system to a virtual on-screen keyboard to control the cursor by detecting double blinking action. They used L1-norm, Kurtosis, and Entropy as features and SVM classifier is used for activity detection. Similar to Ang’s system, He et al. also used blinking action for HCI, but could produce commands by the user’s eye blinks that are performed in synchrony with button flashes and could increase the number of possible commands. However, both systems can only make the selection command by blinking and they need to wait to select a specific command (or character on keyboard) until it flashes.
In this paper, we propose an EOG-based HCI system using single channel bio-signals that can measure EOG signal and temporalis EMG signal simultaneously without additional electrodes. The motivation of the proposed system is to make a novel interface method that can work in real-time for practical applications with higher usability. For this, we need to enhance the system performance in terms of usability, speed, and accuracy. To enhance usability, we designed a signal acquisition system that can measure EOG and EMG with only two electrodes. To enhance the system speed, we developed a modified sliding window algorithm-based PLA to reduce the complexity of signal. To enhance the accuracy, we designed our own signal acquisition system, optimized the PLA performance, and applied SVR after finding kernel function that shows better generalization performance than others in this application. The main difference between the proposed system and the conventional methods is that the proposed system can quantitatively estimate the horizontal position of eyeball without delaying time. For this purpose, we developed a single channel EOG and EMG acquisition system with only two electrodes. After measurement, the signals are separated to EOG and EMG signal based on frequency division. To reduce the signal complexity for real time eyeball tracking, modified sliding window algorithms are applied for piecewise linear approximation (PLA). The width and height of the line segment and slope and length of the line segment are selected as a feature set for eyeball tracking. To find the eyeball position, support vector regression (SVR) is applied as a curve-fitting model. A developed system is applied to an eyeball mouse interface to select horizontally listed buttons on the computer screen and this can be a practical alternative interface particularly for a disabled person with quadriplegia to access computer or mobile devices. Through the PLA and parameter optimization, proposed system minimized the consumption of hardware resources and it can be easily implemented on open-source platforms including Arduino and Raspberry-compatible modules.
2. Materials and Methods
2.1. EOG and EMG Signal Sensing System
2.1.1. Electrooculogram (EOG)
Electrooculogram is a signal that measures and records the resting potential of the retina. The human eye works as a dipole in which the front cornea is an anode and the rear part is a cathode. Therefore, when the eyeball moves and the cornea approaches one electrode, the potential of the corresponding electrode rises, and the potential of the opposite electrode falls. The most commonly used electrode attachment position for EOG is near the outer angle of both eyes as shown in
Figure 1 and the position information of horizontal direction can be obtained by the pair of electrodes.
2.1.2. Temporalis Electromyogram (EMG)
Electromyogram is a measure of activity potential produced by the activity of the skeletal muscles and it usually has an amplitude ranging from 50 μV to 30 mV. The skeletal muscles under the control of one motor neuron contract when the particular motor neuron is excited, and the muscles are excited or contracted almost simultaneously through connected motor neurons. Since the excitation of shock repeats at a frequency of 7 to 20 Hz, EMG is also measured in this frequency band. The temporal muscle or temporalis is the muscle located from the eyebrows to the cheekbone on both sides of the head. It is classified as a muscle of mastication and serves to move the lower jaw to chew food. Therefore, when the EMG is measured in the temporal muscle, a signal with large amplitude is generated in the case of bending on the muscle for bite, and a signal with small amplitude is generated when the bending force is released.
2.1.3. Design of Hardware System for EOG and EMG Signal Acquisition
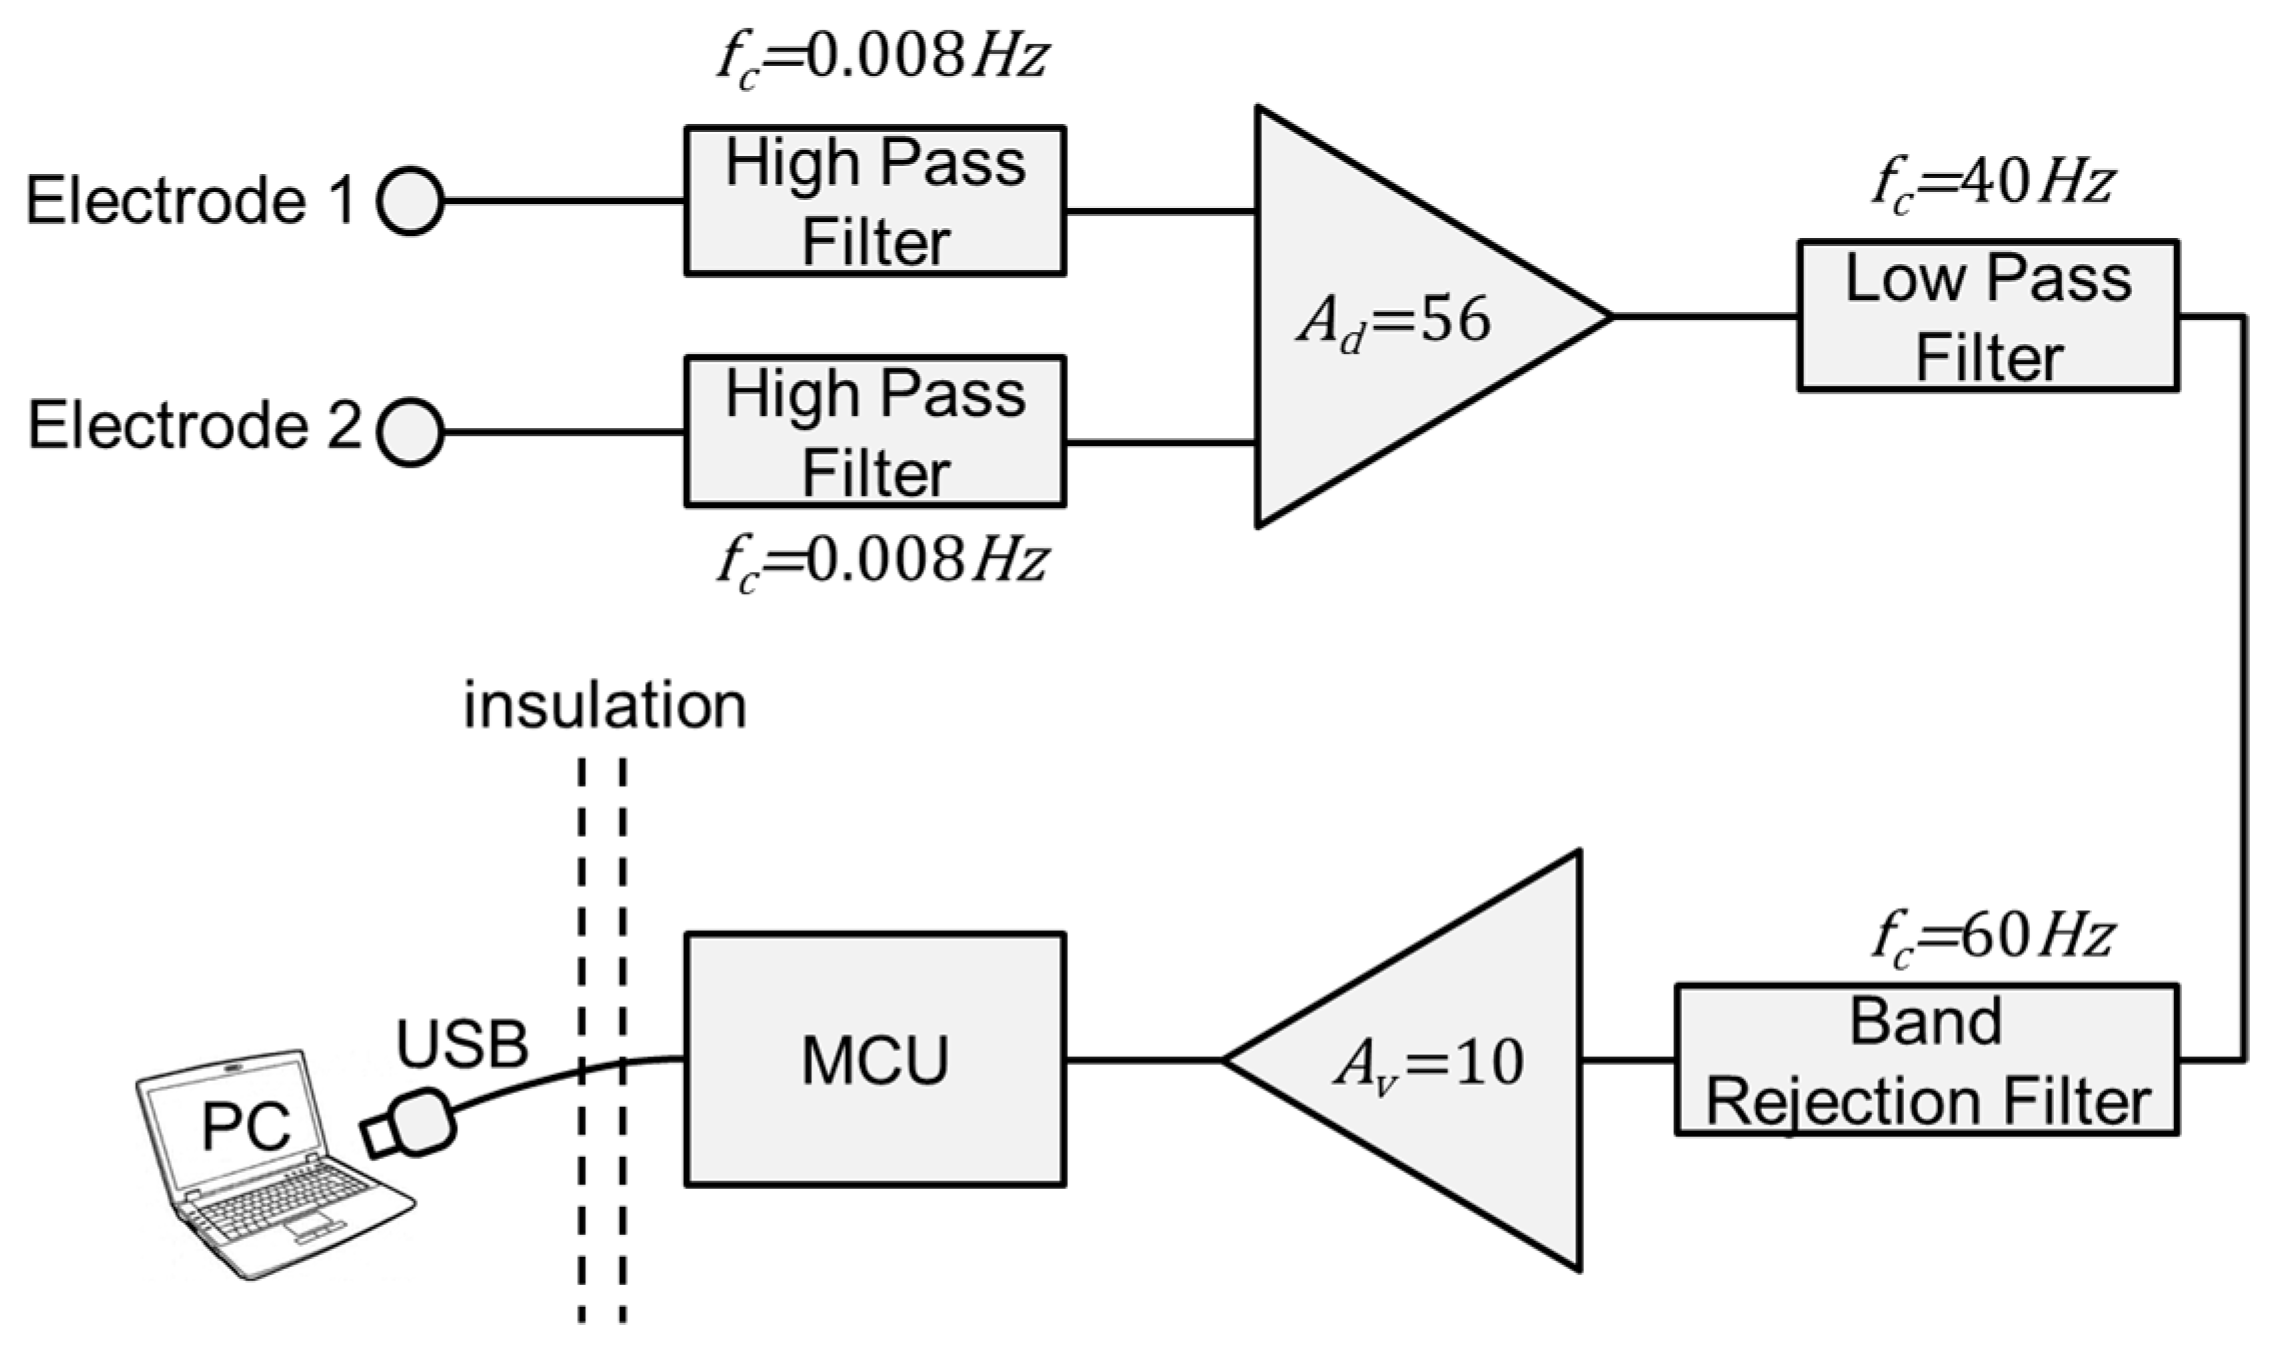
The structure of the designed hardware for signal acquisition is shown in
Figure 2. It amplifies the biological signals measured through the electrodes attached to both temples and transmits the signals to the PC. Measured signals are differential signals obtained by differential amplification of signals received from both electrodes. In this case, the common mode signal is treated as noise. In conventional bio-signal acquisition hardware, a ground electrode is added to effectively remove the interference of the common mode signal using signal feedback. However, in this case, the number of electrodes would need to be increased, which is not desirable for usability. In this paper, a pre-processing filter is applied as a method for measuring bio-signals without adding an additional ground electrode. The 1-pole active high-pass filter with a cut-off frequency of 0.008 Hz is used as a pre-processing filter. Here, the pre-processing filter is a kind of high-pass filter that removes low-frequency components before the signal is applied to the differential amplifier prior to passing the instrumentation amplifier. This pre-filter has two roles, the first is to ensure that the input signal is within the common mode input voltage range of the instrumentation amplifier of the measurement circuit. Since the designed system and the human body do not have a common ground, for the measurement circuit, it is not possible to predict the level of common mode potential of the human body signal. Therefore, in some cases, there is a risk of exceeding the common mode input voltage range of the instrumentation amplifier and it may lead to severe signal distortion and must be avoided. The second role of the pre-filter is to eliminate the DC offset. During the differential amplification of signals between the two electrodes, if a DC offset voltage exists between the two signals, they are not removed from differential amplifier. In the case of the bio-signal measuring circuit, since the amplification gain is usually several hundred times higher, the amplifier is easily saturated due to the DC component. At this time, the high-pass filter is equally applied to the signals transmitted from both electrodes, so that the DC voltages of the two signals are equalized and it can solve the two problems described above.
Although high-pass filters have essential roles, they must be handled with care in handling EOG signals. When gazing at one spot without eyeball movement, it resembles a nearly DC signal form. Therefore, the shape of the EOG signal is greatly affected by cut-off frequency and the selection of level of the high-pass filter is very critical.
Figure 3 shows the filtered EOG signal according to the cut-off frequency of the high-pass filter.
Based on the time point t1, the left side shows the signal from slow eye movements and the right side shows the signal from fast eye movements. When using a high-pass filter with 3.0 Hz cut-off frequency, it is advantageous to detect the time when the eyeball moves since a waveform having large amplitude appears only in a section in which the eyeball moves, similar to the case of taking a derivative. However, it can be seen that the filtered signal varies greatly according to the velocity of the eyeball movement, and since the filter attenuates a large part of the frequency band of the signal, the size of the waveform itself is reduced and it is vulnerable to noise. On the other hand, when using a high-pass filter with 0.008 Hz cut-off frequency, when the eyeball does not move, it shows a typical EOG signal pattern showing a flat waveform, so that the change in the eyeball motion speed does not greatly affect the signal shape changes. Therefore, it is suitable to analyze the moving distance of the eyeball using the degree of the rise or fall of the signals. Also, since the signal strength of the desired portion of the signal is big enough, it is more robust against noise. However, since it requires a relatively long time to stabilize the signal close to ‘0′, there is a disadvantage that it is difficult to recover the waveform if a large noise is added during the measurement such as when an impact is applied to an electrode or a cable. When a high-pass filter with 0.1 Hz cut-off frequency is used, the characteristics of the two cases mentioned above are shown together and can be selected as a compromise. Based on this, to consider the fact that the system requires precise analysis of eye movement distance, high pass filter with 0.008 Hz cut-off frequency was selected and applied.
The signal passed through the preprocessing filter is fed to the instrumentation amplifier for differential amplification. The instrumentation amplifier requires high common mode rejection ratio since the amplitude of the common mode signal to be removed is several ten times bigger than the EOG signal to be obtained from this system. Therefore, we applied ‘INA128′, which is a widely used IC chip for amplification of bio-signals and the designed circuit has 120 dB of common mode rejection ratio. In addition, the gain of the instrumentation amplifier is set to 56 V/V to obtain a magnitude of ±50~±150 mV which is sufficiently larger than the white noise that can be added in the subsequent signal processing. The differential amplified bio-signal is filtered through the post-processing filter to remove residual noise and amplified once more. The noise elimination of the post-processing filter starts with the low-pass filtering process to only pass the band less than 40 Hz which is enough to observe the EOG and temporalis EMG signals. In addition, since the low-pass filter limits the bandwidth of the signal, the sampling frequency in the analog-to-digital conversion (ADC) can be set low and it can reduce the computation complexity during digital signal processing. The second stage of noise cancellation is the elimination of 60 Hz noise using a band rejection filter. Often, the 60 Hz noise generated from various factors during the measurement environment cannot be removed solely by the low pass filter, so band elimination filter is added so that the system can be utilized even in a harsh measurement environment. In the final stage of the post-processing filter, signal amplification of 10 V/V level is performed so that the size of the bio-signal is increased to ±0.5~±1.50 V to be suitable for analog-to-digital conversion.
After all analog signal processing steps have been performed, the ADC processed signals are sent to the PC. The ADC process is performed using a microcontroller with a 10-bit resolution and a sampling frequency of 300 Hz. Then, the converted digital data is transferred to USART to USB conversion IC chip through USART communication method and data can be transmitted through a USB cable connected to the computer. The USB cable also supports the 5 V power to the measurement system. To prevent electric shock from unexpected damage or leakage, the micro controller and the USART to USB conversion IC chip are electrically isolated. The ATMEGA8 microcontroller is used in this hardware and input voltage of this system is 5 V. This system consumes 1.8 mA at 5 V, so the power consumption of this system is around 9 mW.
2.2. Modified Sliding Window Algorithm for Piecewise Linear Approxamation (PLA)
The measured EOG signal using the proposed system showed potential difference only at the time of eyeball movement. Even if the speed of eyeball is very slow, still it showed very stiff potential difference like a step function. In this case, only the time of eyeball movement and the position of the eyeball are important data and we do not need to consider small signal change information during eyeball fixation. Therefore, PLA would be a good way to reduce signal complexity. There are various PLA algorithms including sliding window [
12], scan along [
13], top down [
14], and bottom up [
12]. Several hybrid algorithms are also developed to take advantage of both algorithms at the same time. In this paper, we designed a modified sliding window-based PLA algorithm that is best for real-time signal processing. Top-down- and bottom-up-based algorithms showed good approximation performance but were not appropriate for real-time signal processing applications since they require batch processing. Some research results showed modified top down or bottom up-based algorithms for real-time applications but still required some time delay to get the responses. Compared to these methods, sliding window and scan along-based algorithms showed quick processing responses. Another advantage of the sliding window-based method is that it can change the signals shapes to fit to our applications during calculation of error between the original signals and approximated signals.
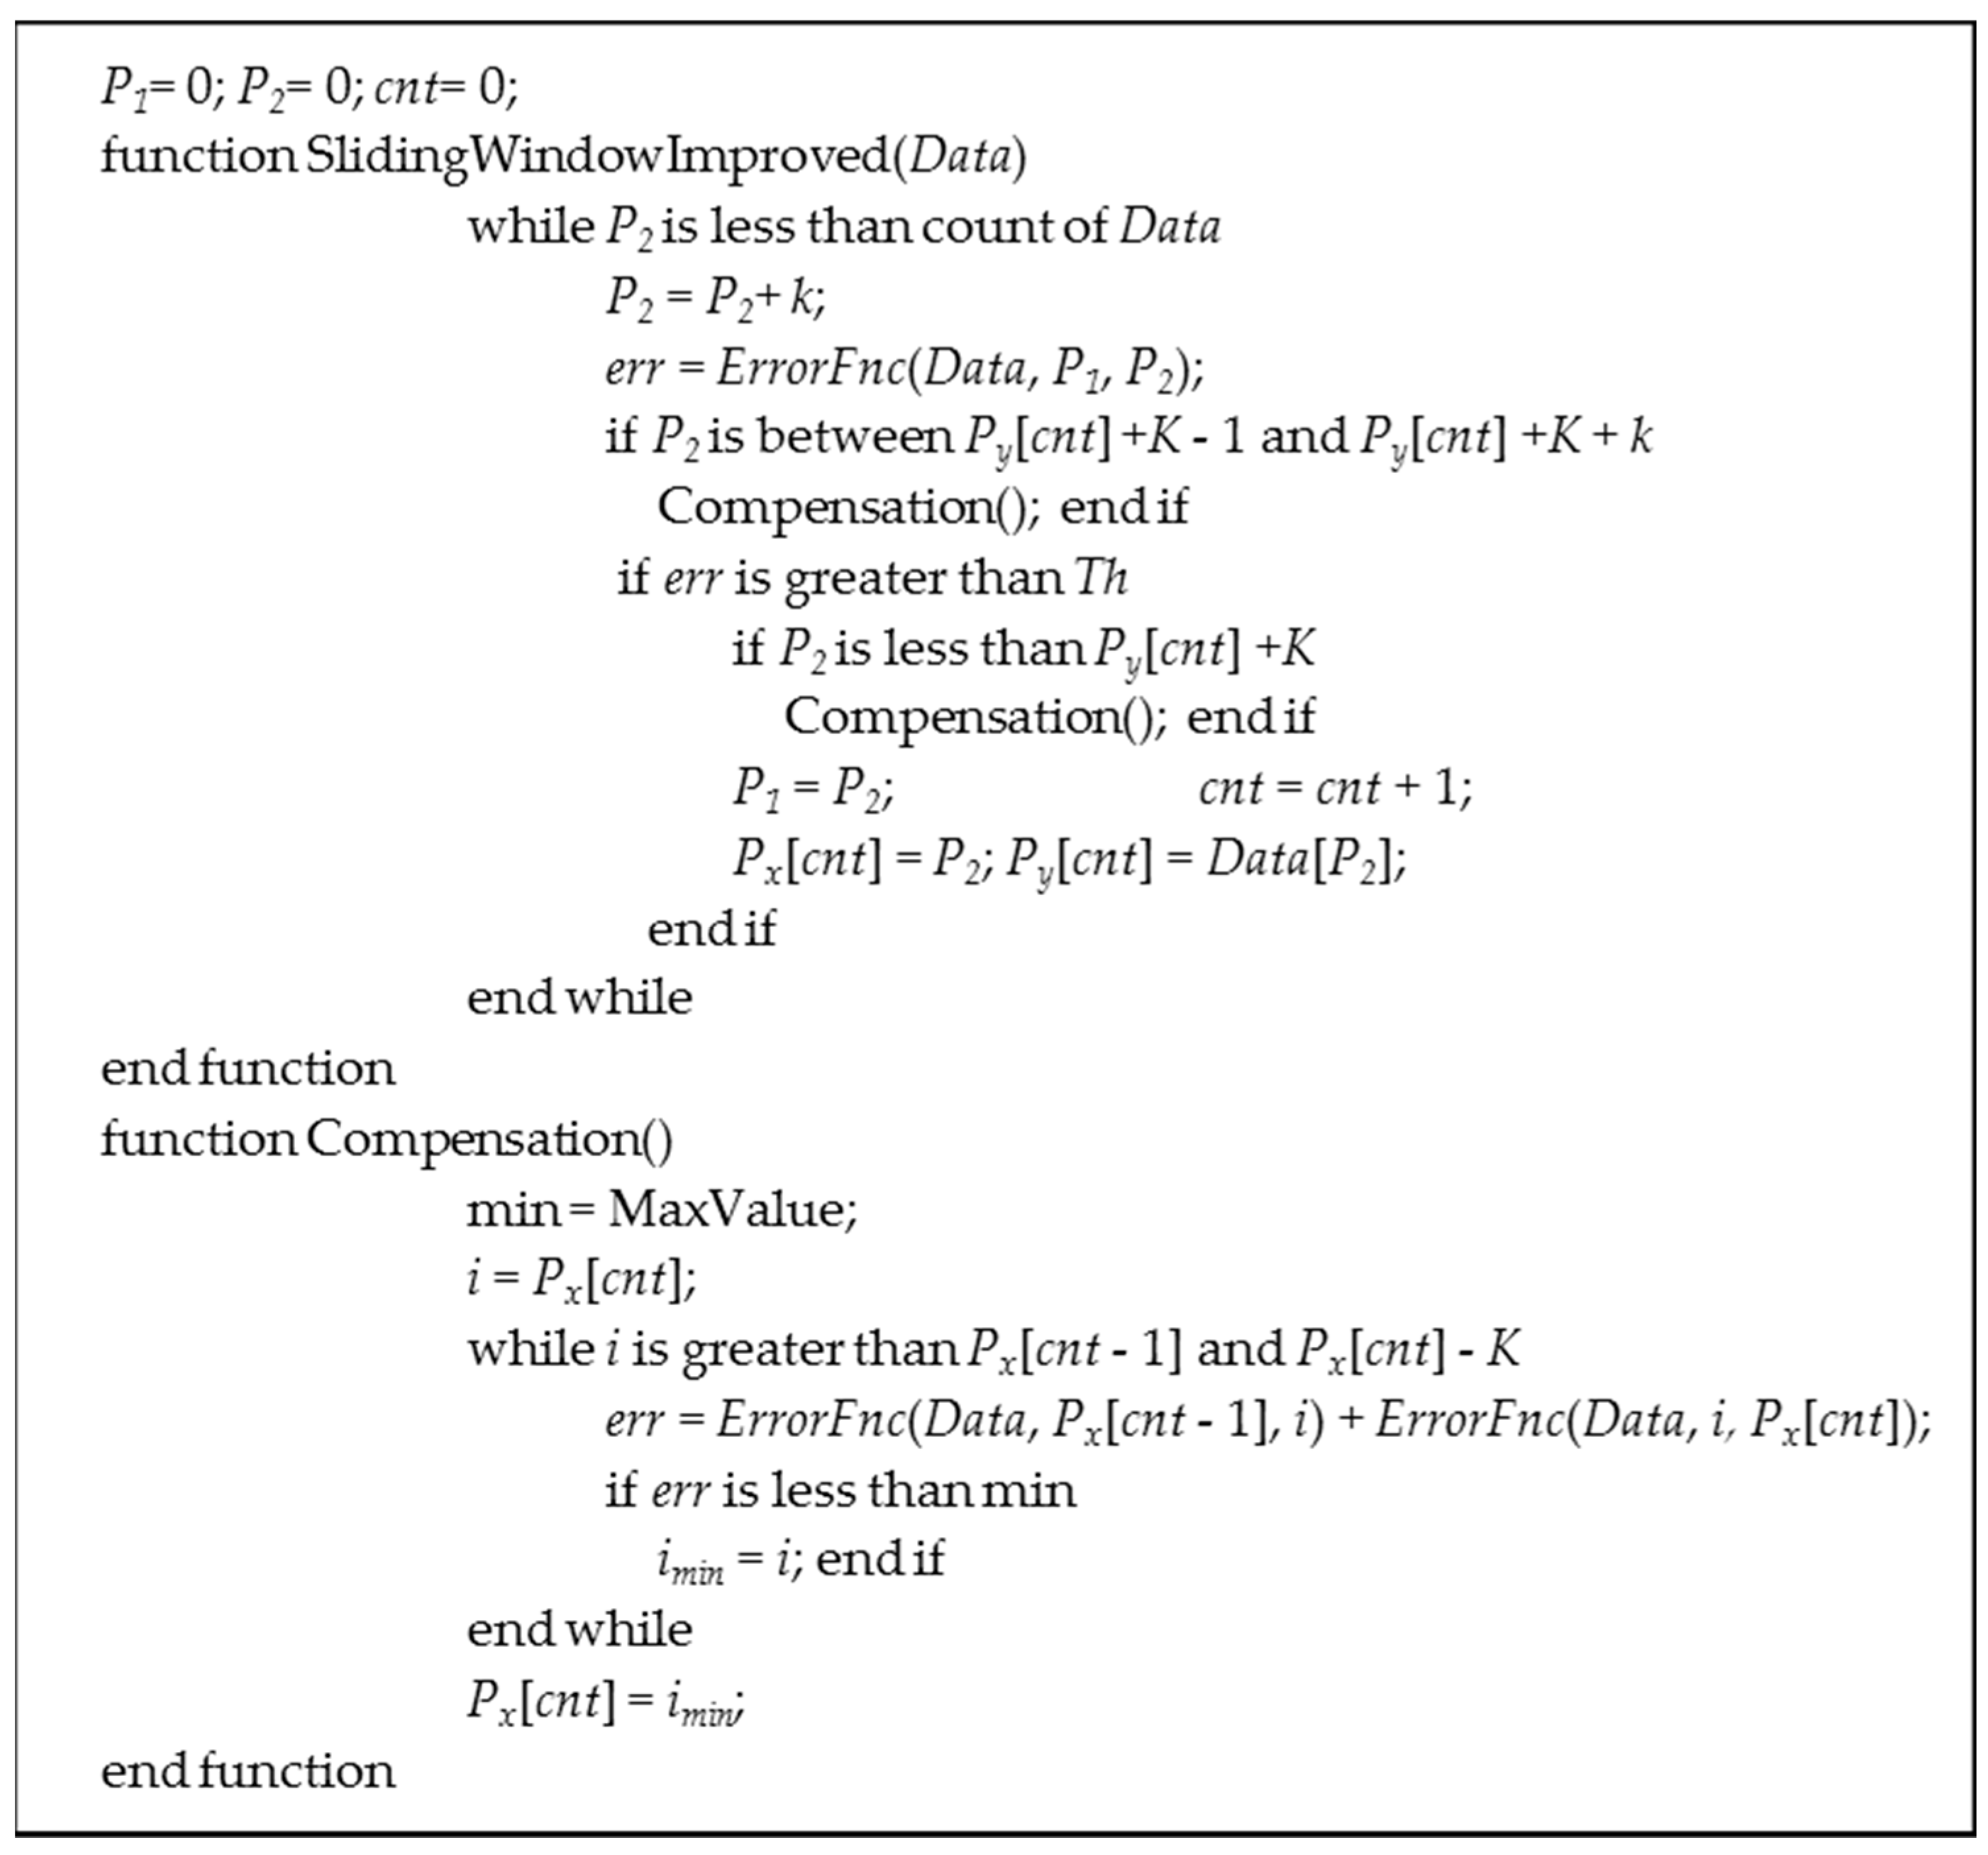
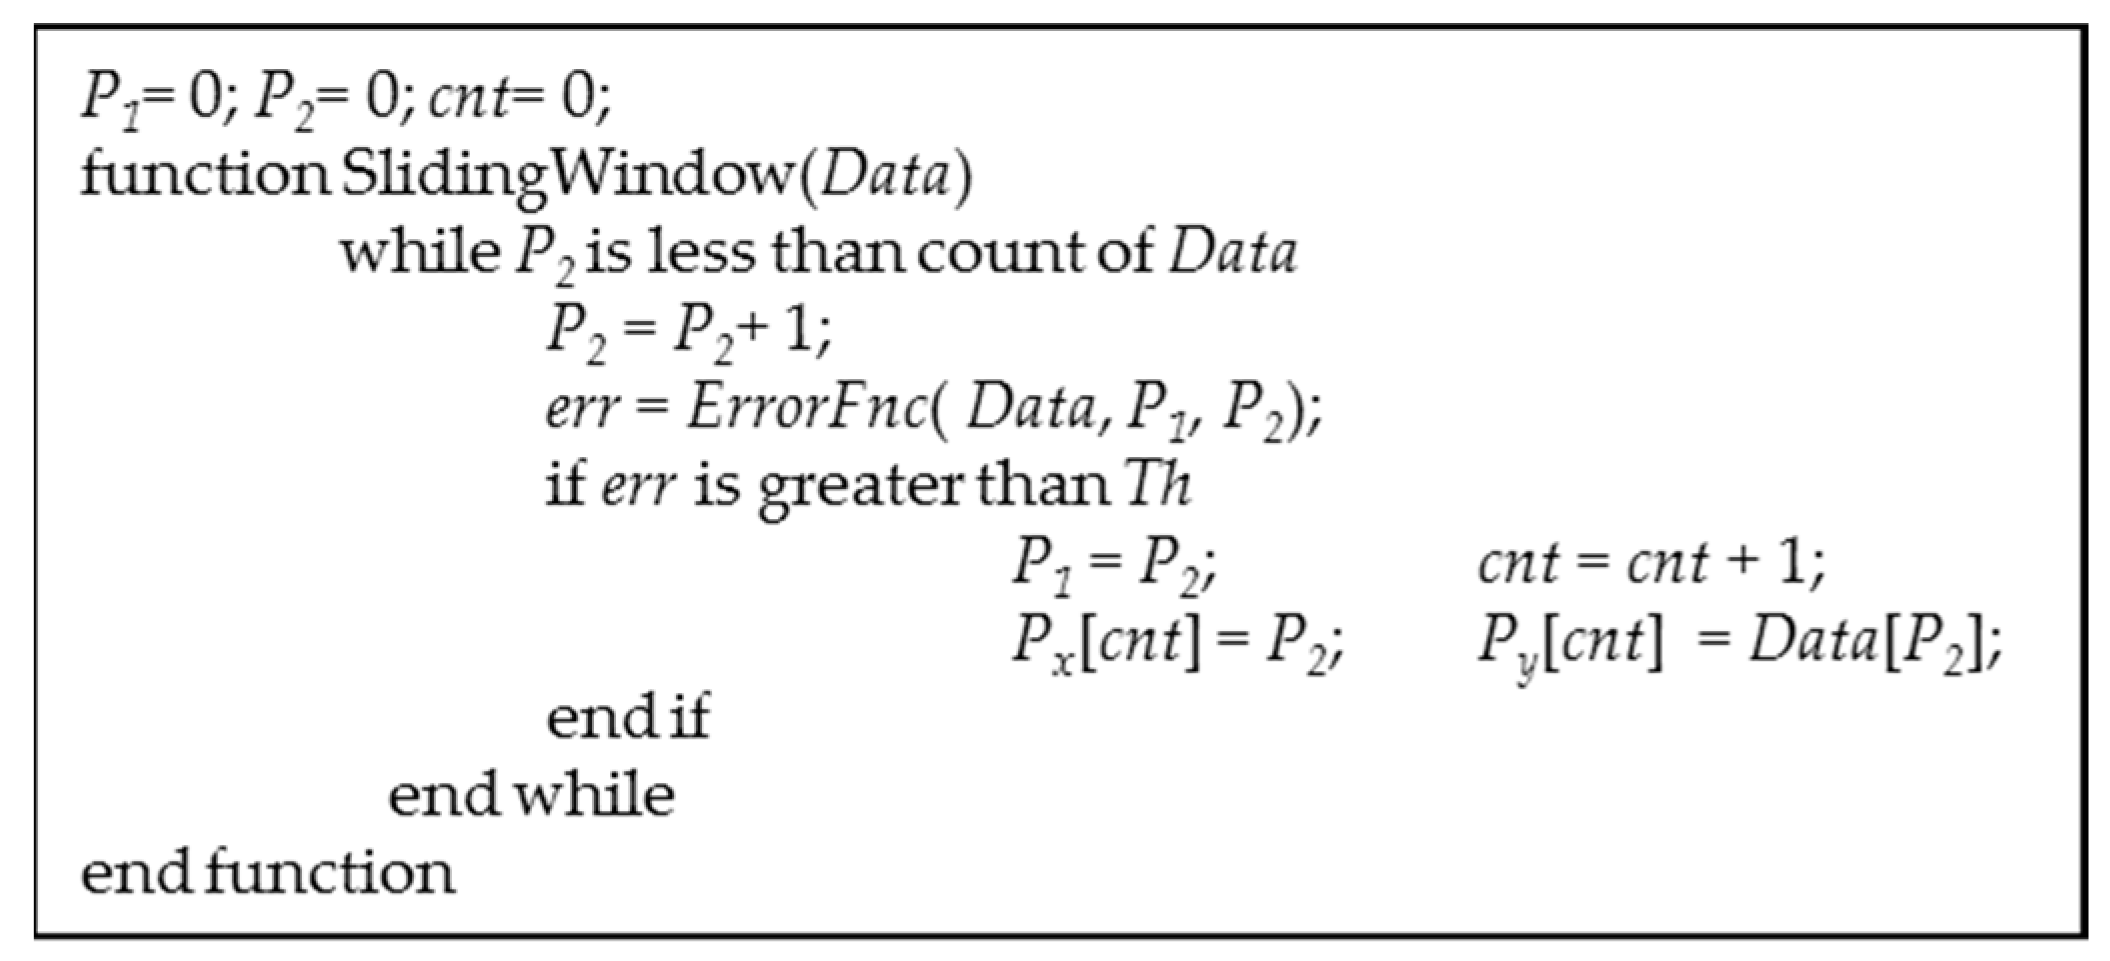
Figure 4 shows the pseudo code of the standard sliding window algorithm. As shown in this code, when we increase the count number of
P2, we need calculate the error at every point between
P1 and
P2 which causes calculation burden. In addition, error, and threshold (
Th)-based creation of vertices at every point sometimes showed poor approximation performances.
To enhance the calculation efficiency and approximation performance, we developed a modified sliding window algorithm as shown in
Figure 5. First, as Koski suggested [
15], we used
k increment instead of an increment 1. By increasing the step point from 1 to
k, we can reduce the calculation complexity but need to find the optimal
k value for acceptable approximation performance. Also, we added a vertex position correction algorithm after adding a new vertex point. This correction algorithm performed if
K more data are added right after new vertex point
Px[
cnt] was generated. At this point, if we generate temporal vertex point P
2, then we can make two line segments
and
, and we can find the new position of
that minimizes the sum of error. At this time, to consider computational time, we set the number of searching points to be less than
. In this work, to set the maximum response delay to be less than 0.2 s, we set that
K to 55.
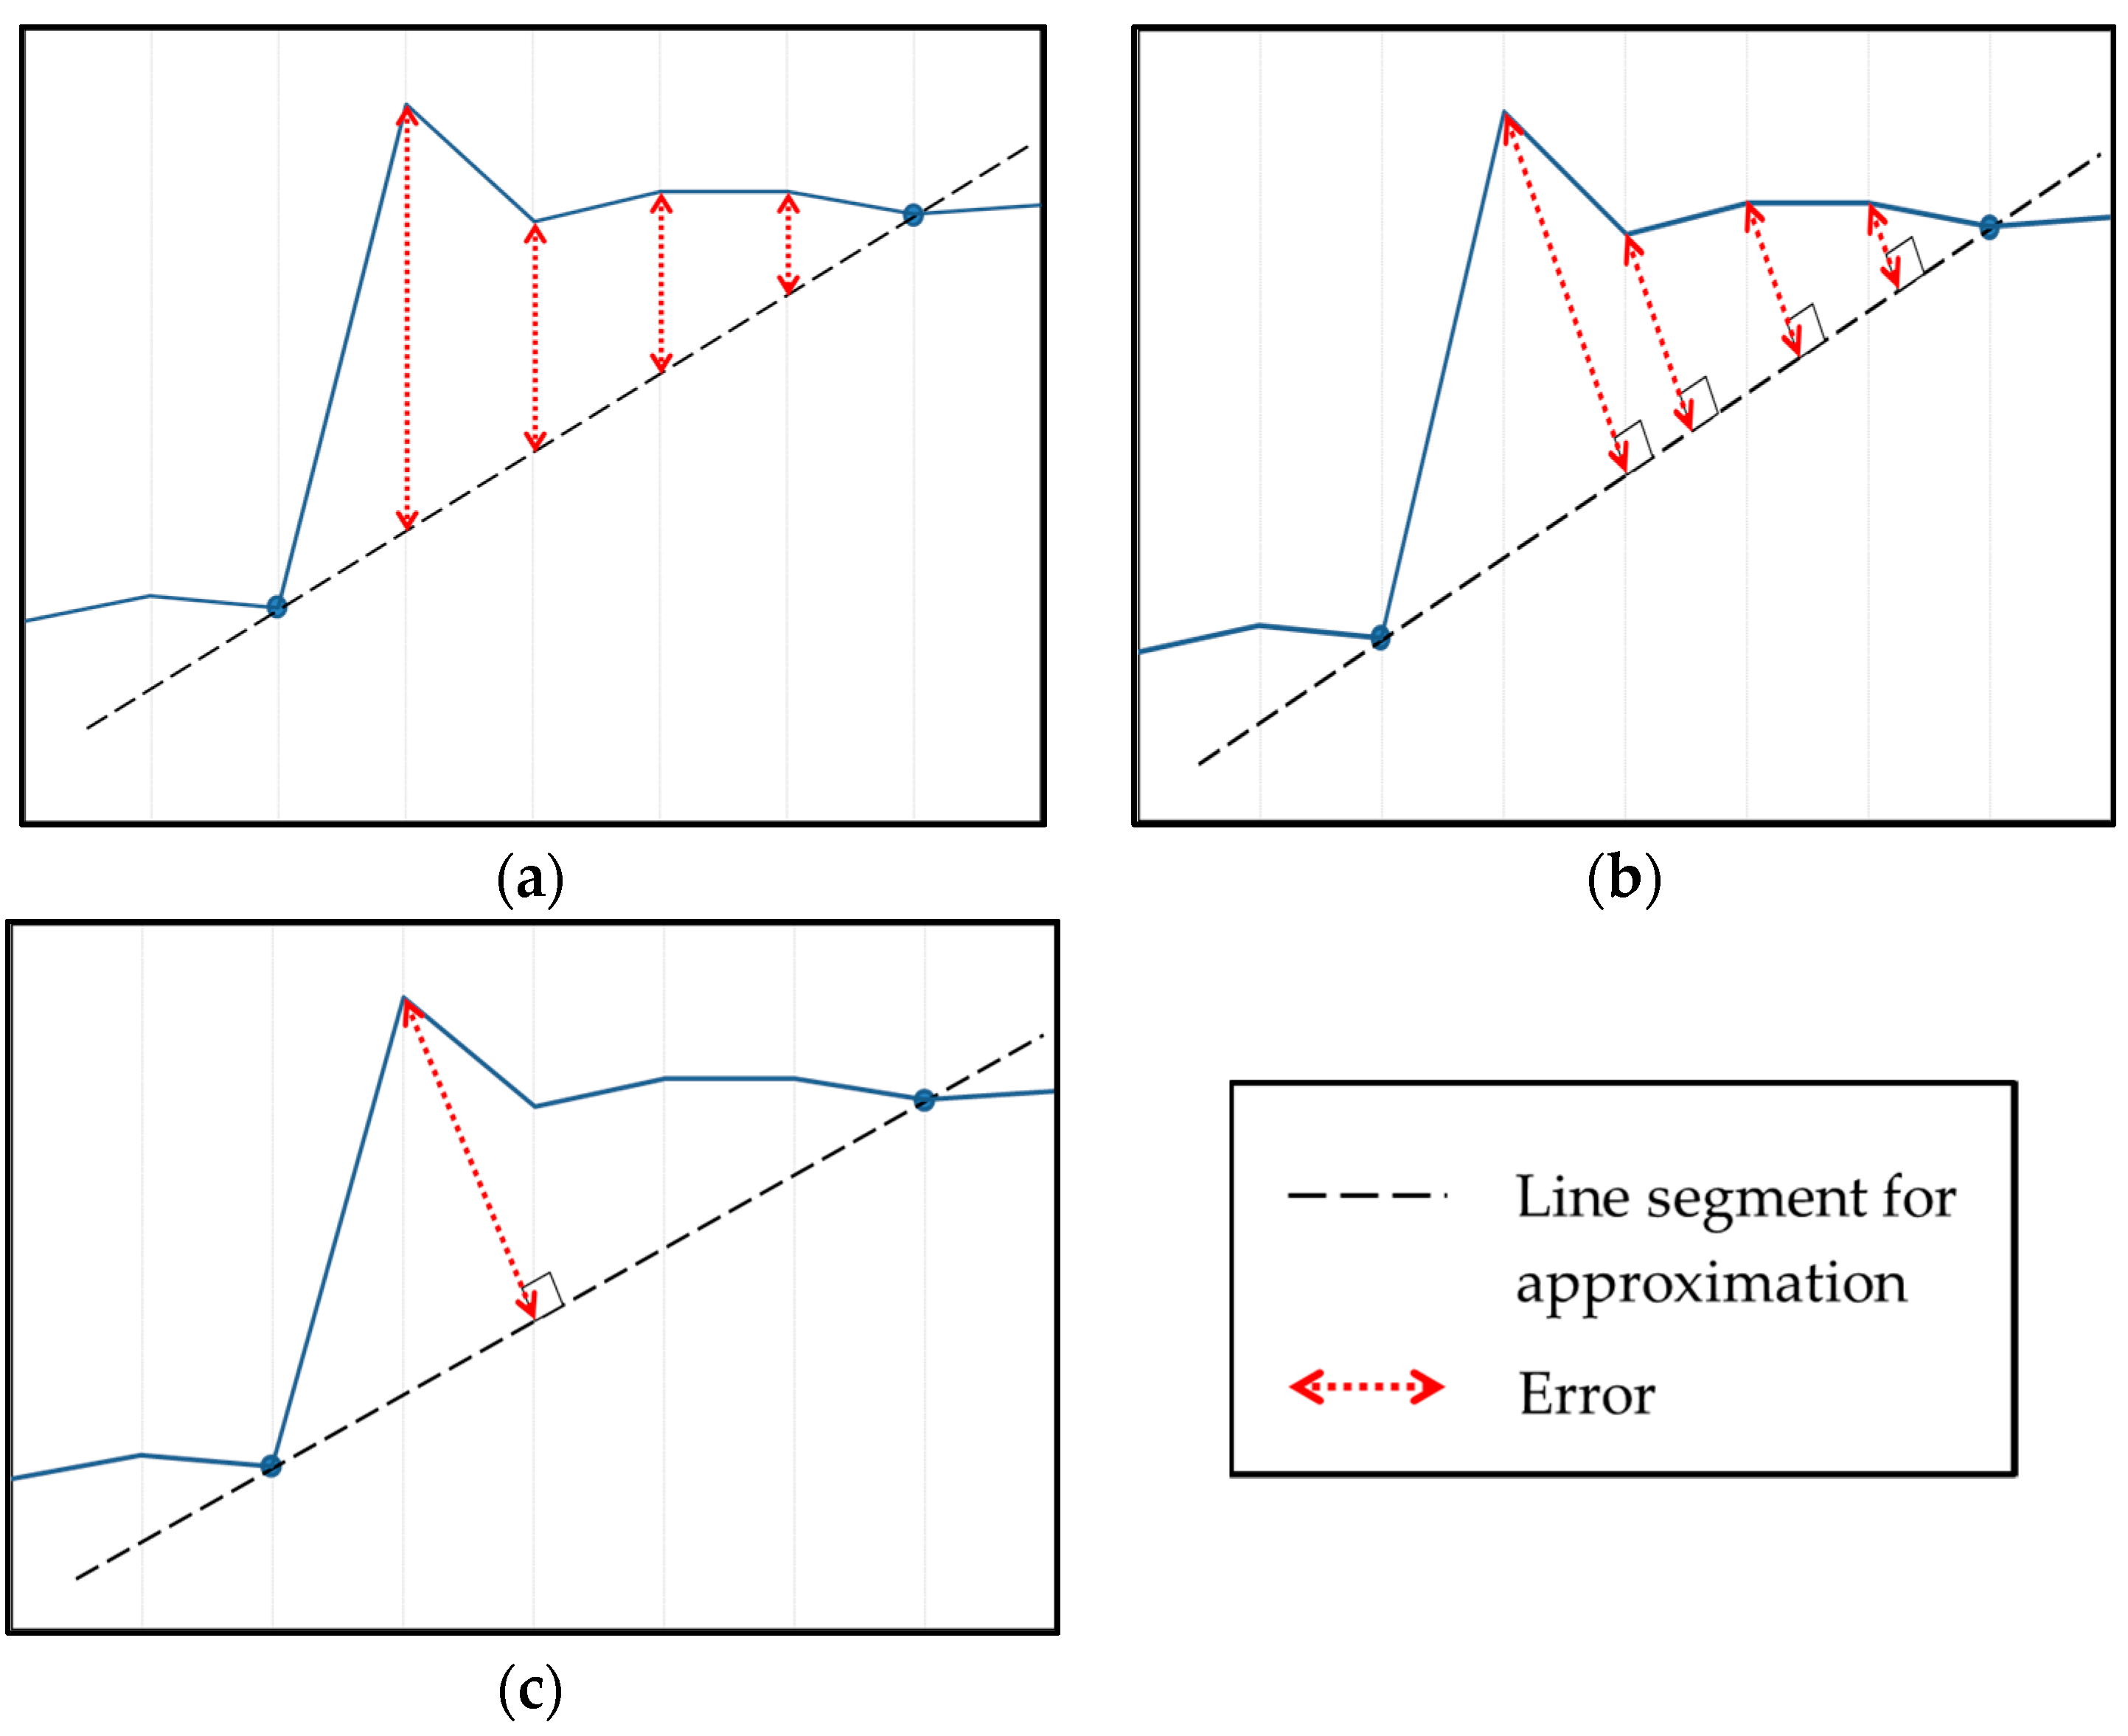
Although we used the same approximation algorithm, the performance varies on the selection of function
ErrorFnc. There are various error functions and we considered three kinds of error function in this paper, root mean squared error (RMSE), Euclidean error and Euclidian distance as shown in
Figure 6.
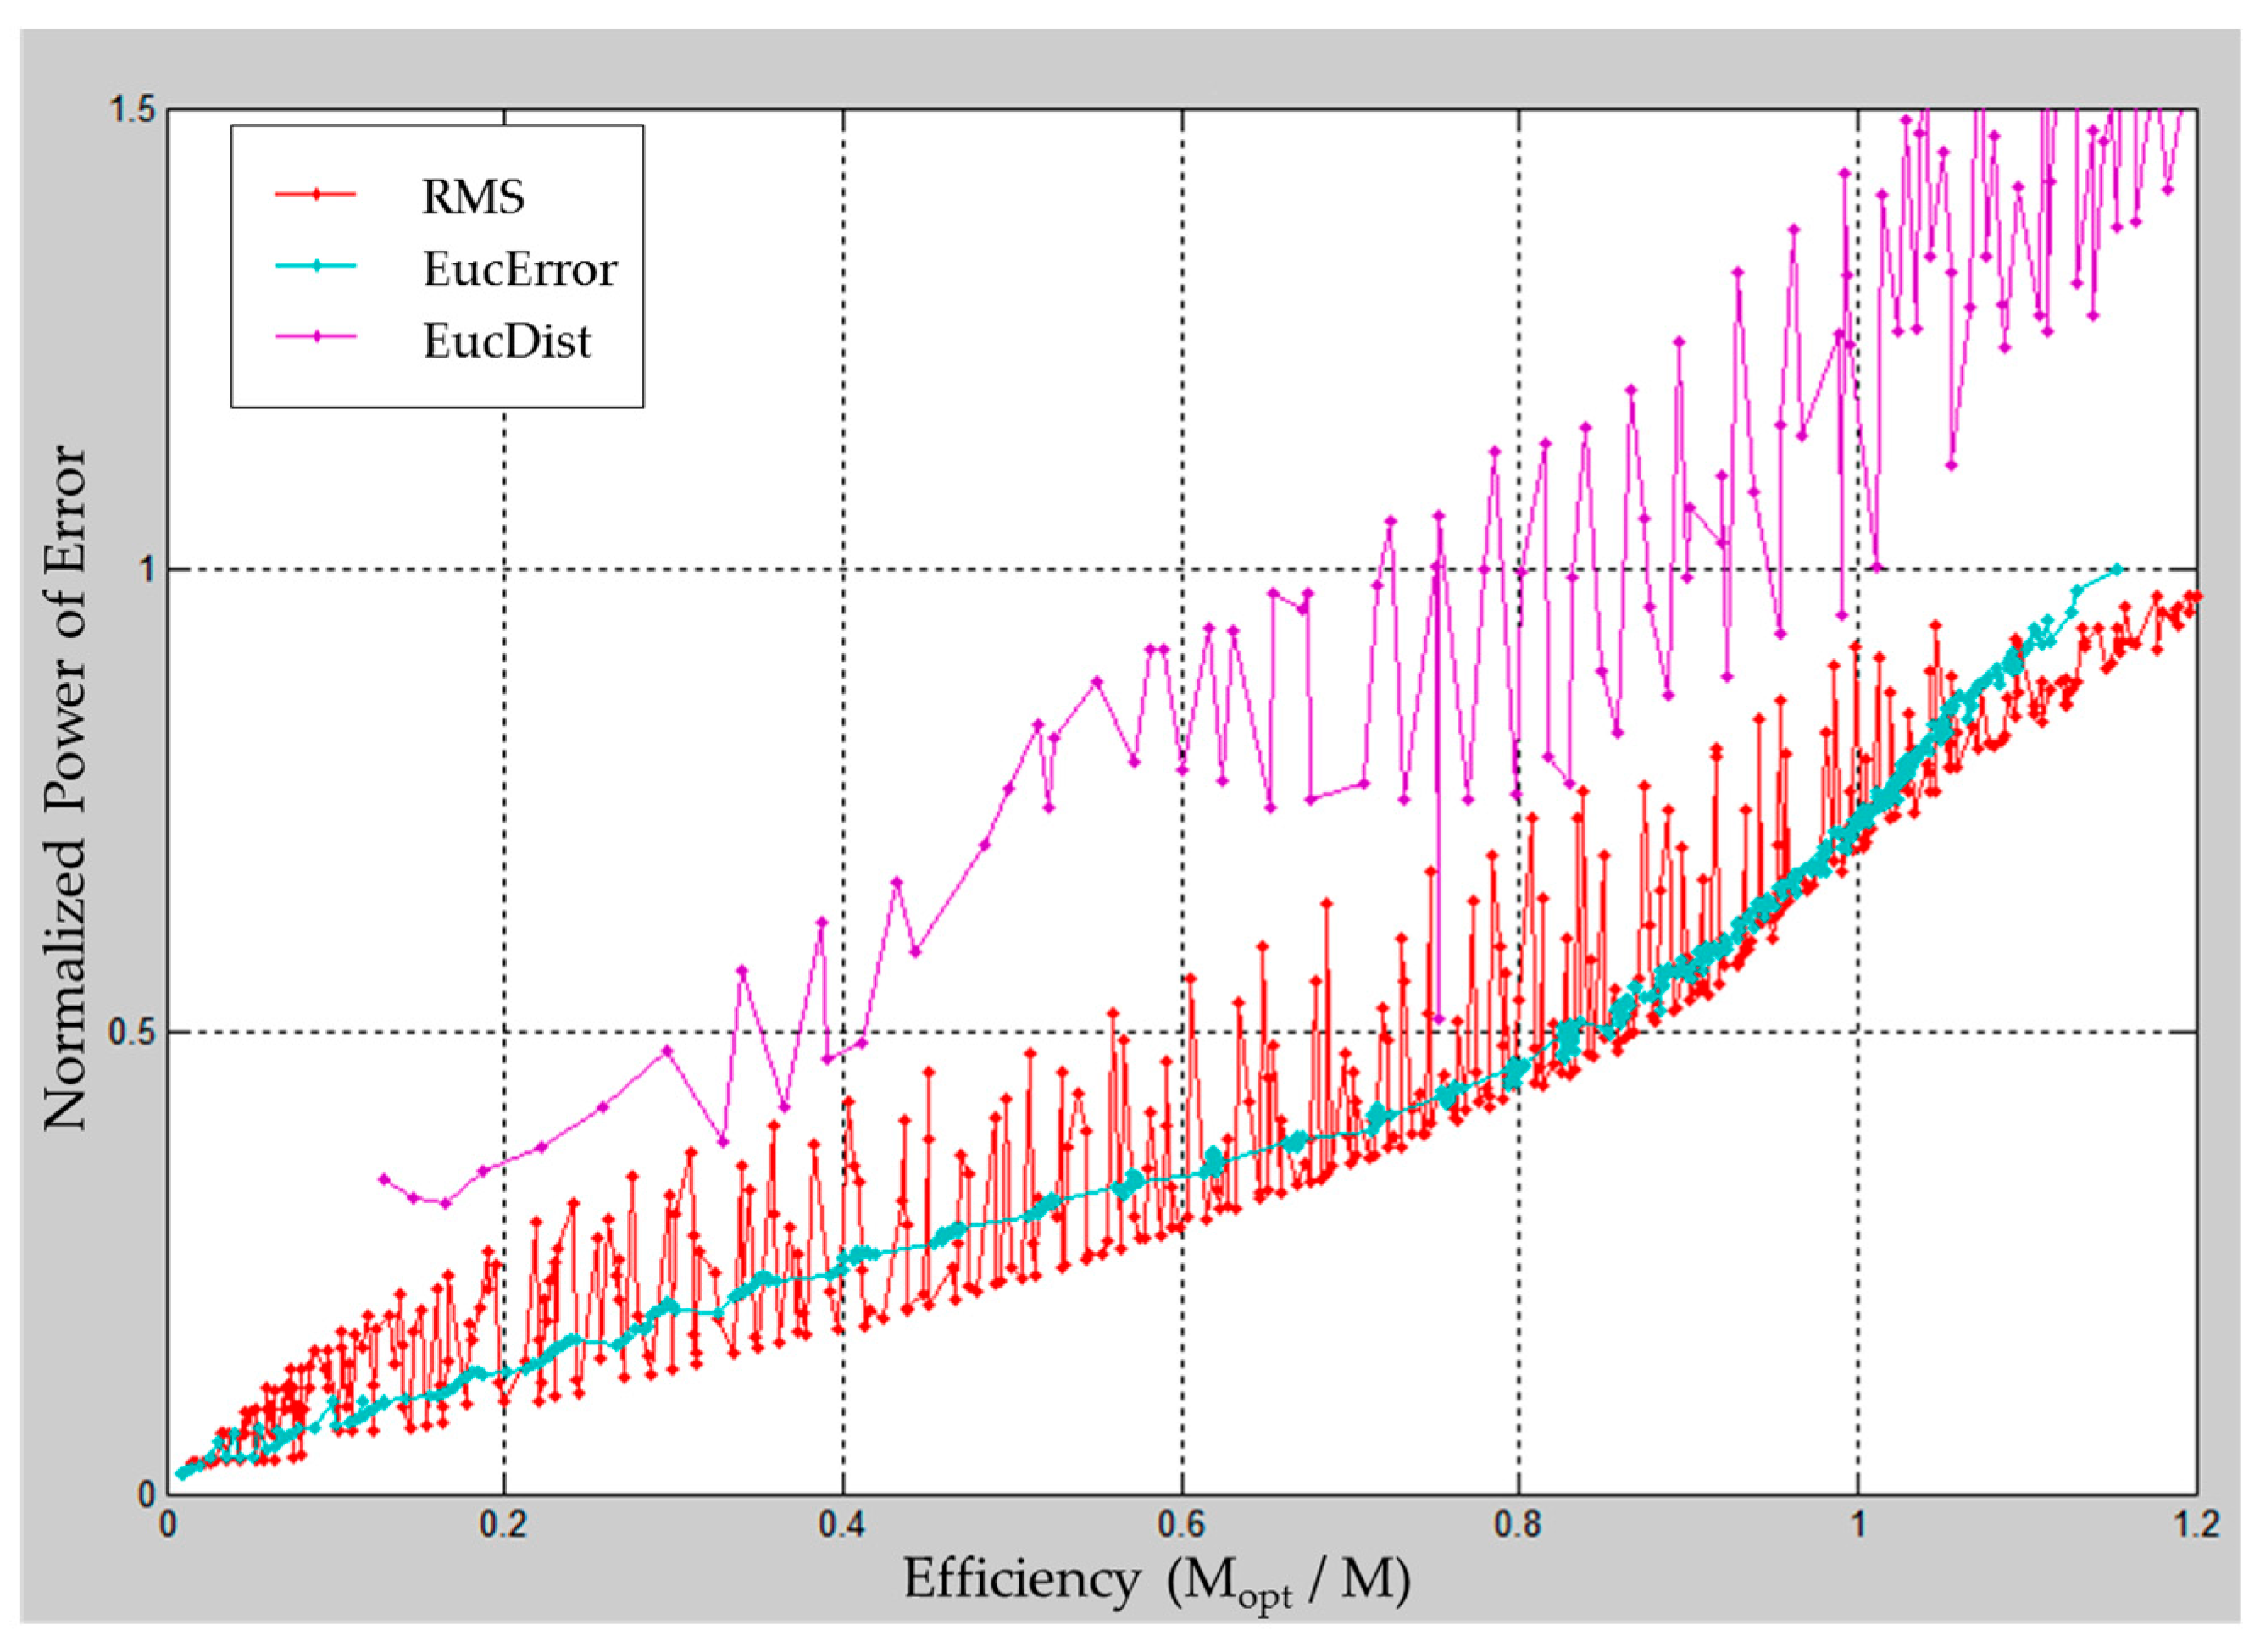
Figure 7 shows the approximation performance dependency on error function type. For this, we defined the efficiency as the ratio of optimized number of line segment (M
opt) to PLA-based number of the line segment (M). In this case, M
opt is calculated based on the original number of eye movement trials. In other words, if efficiency is bigger than 1, then it infers that PLA missed the vertex point that needs to be created. Therefore, the smaller the efficiency, the more the part that can be represented by one line segment is often represented by two or more line segments.
In
Figure 7, the graph of Euclidean Error shows gentle rises, while the graph of RMSE and Euclidean Distance shows irregular vibrations. The reason behind this difference can be found in
Figure 8.
In the case of Euclidean error, there is little change of power of error (Perr) and efficiency according to the change of k, so Perr and Efficiency gently rise as Th increases. In contrast to Euclidian Error, the RMSE shows an irregular efficiency change according to k and Euclidean Distance also shows irregular Perr changes according to k. In addition, in contrast to others, the efficiency is more sensitive to k than Th in Euclidean Distance. Therefore, we can increase the value of k without significant loss of approximation performance and we set k to 30 which is half of the buffer length K. Theoretically, it can be considered that Th is best optimized when the efficiency is 1, but in some practical cases, it is considered that there are cases where the extra vertices must be generate for better approximation. For this reason, 20% of the margin is considered despite lowered efficiency.
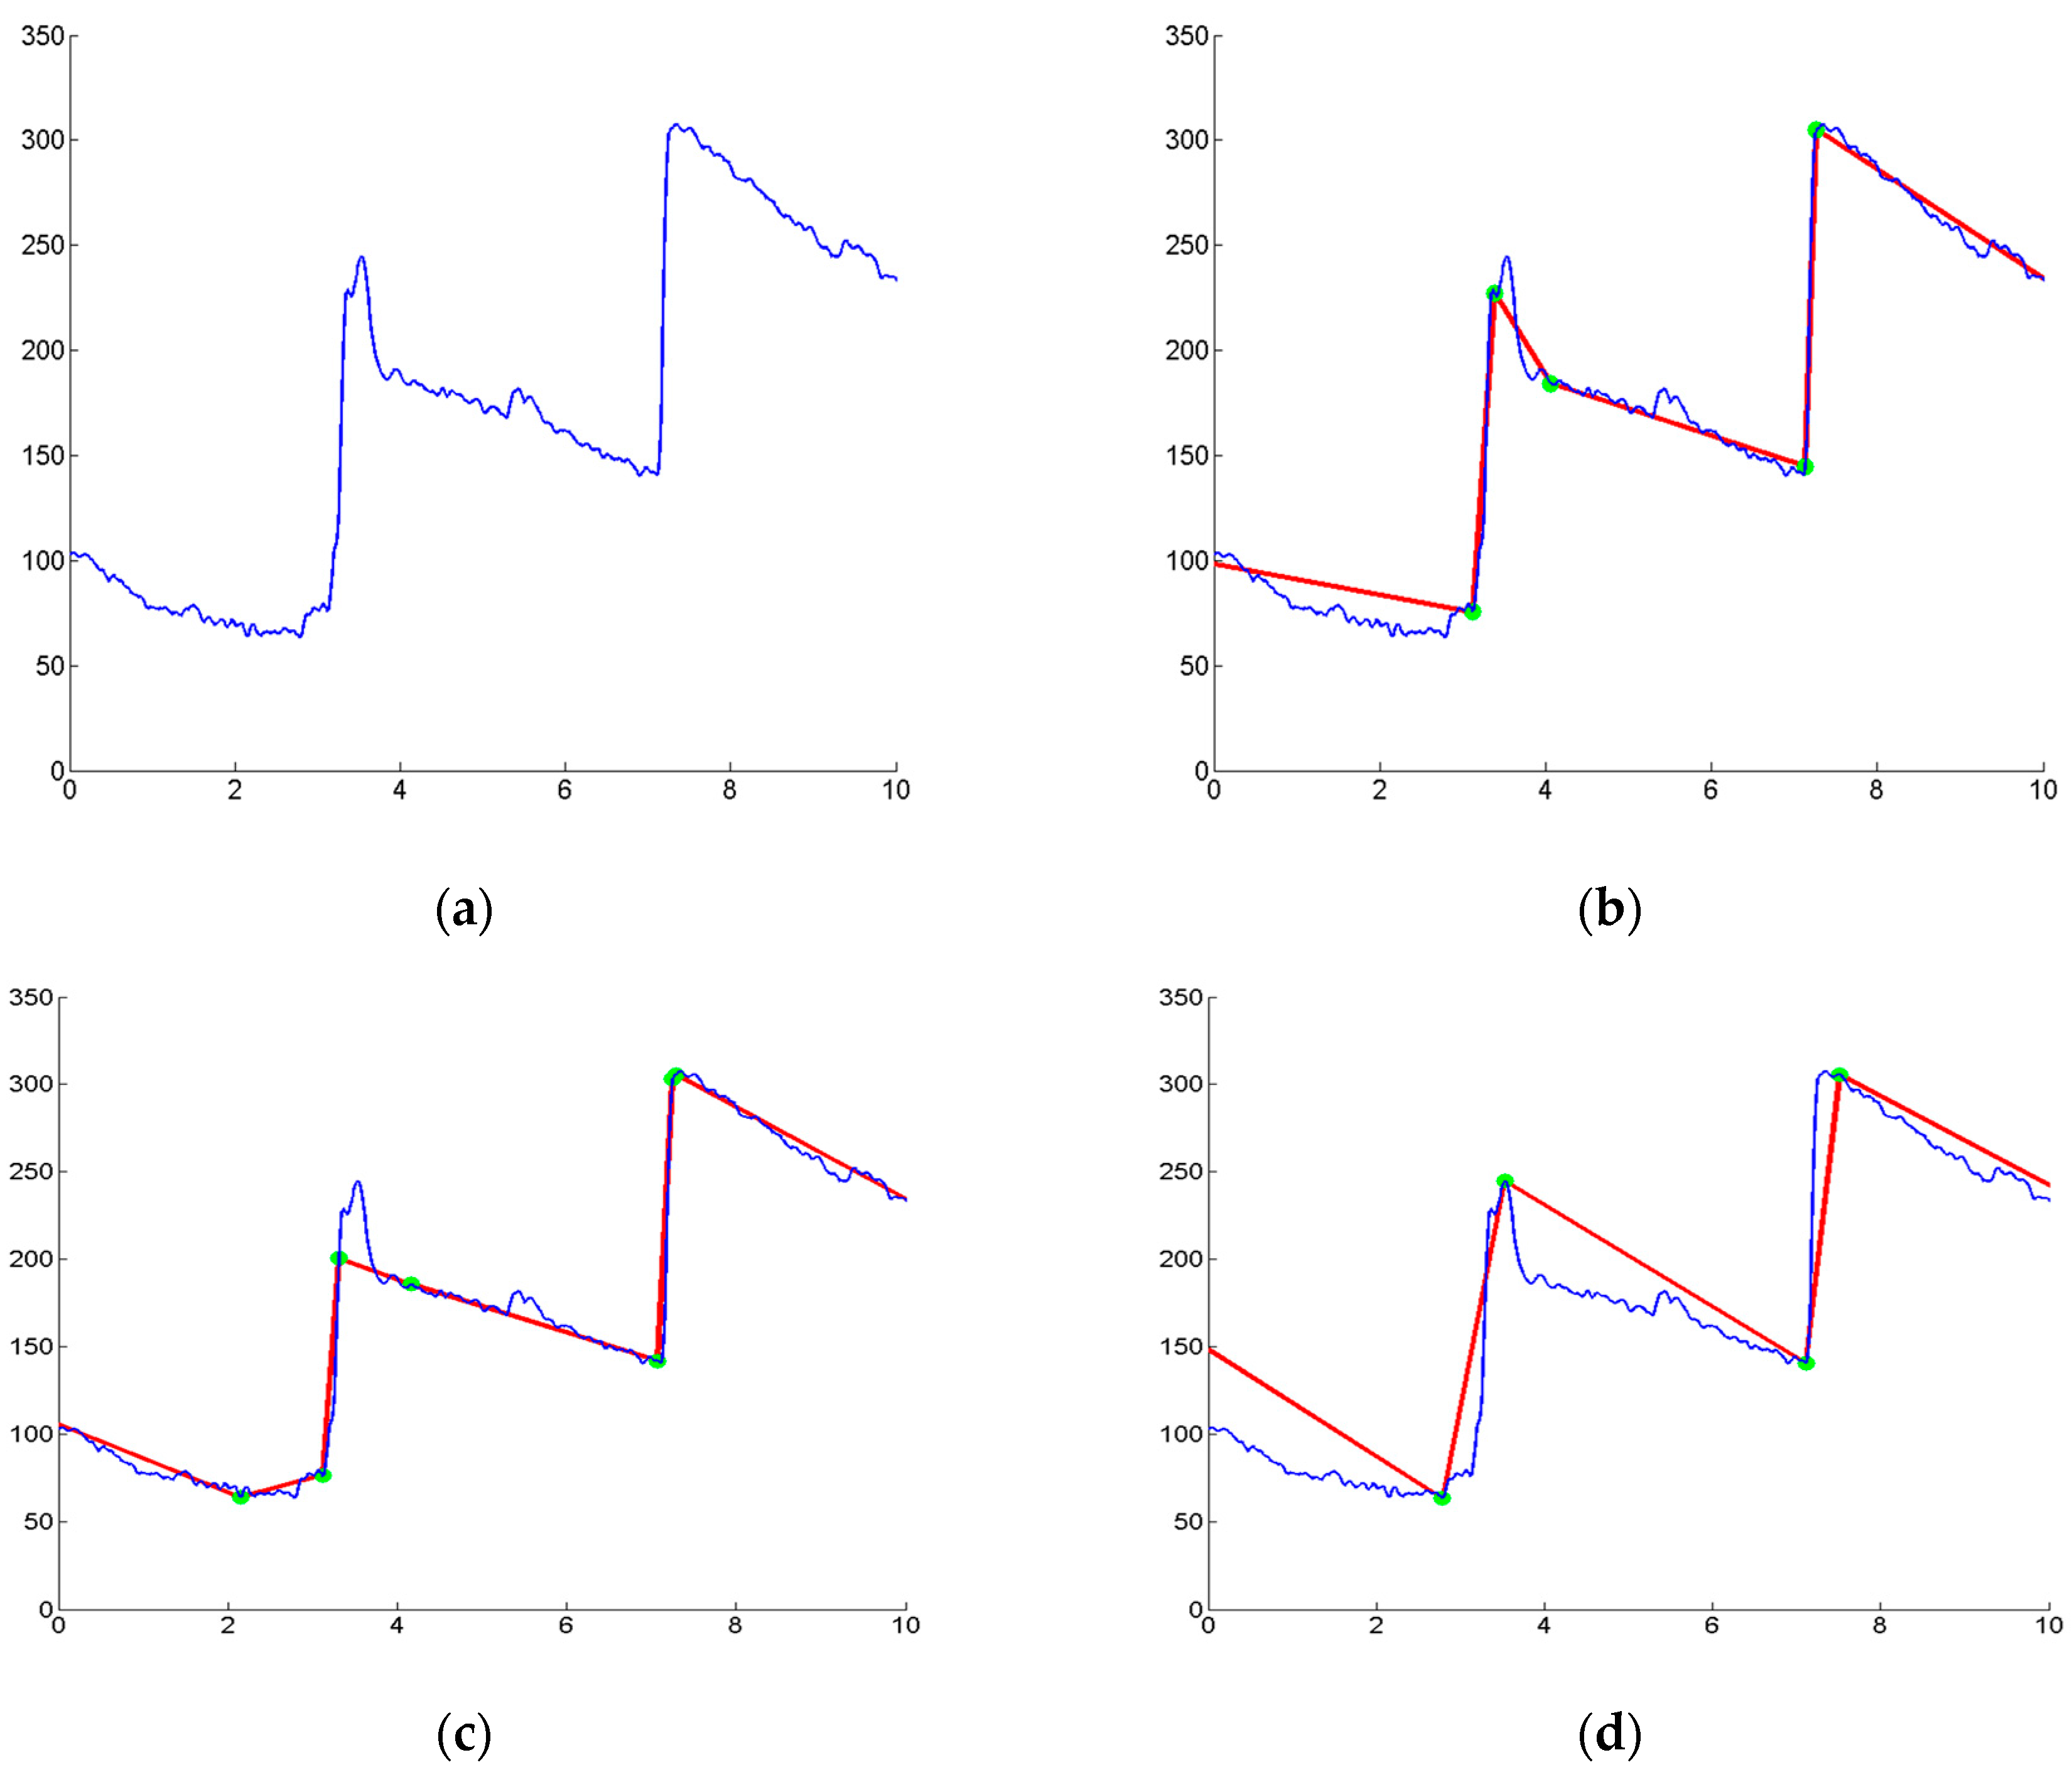
The Euclidean Error method also can overcome the overshooting phenomenon commonly found in EOG waveforms. The overshooting phenomenon occurs when the user attempts to move the eyeballs to the target position. If eyeballs move to the beyond the target position—in other words if eyeballs fail to move to the correct position at a time—then they return to the original target position quickly, creating an overshooting phenomenon. As shown in
Figure 9, the Euclidean Error method can detect vertices effectively by ignoring overshoots in EOG waveforms.
2.3. Curve-Fitting Model for Eye Tracking
Since the signal after PLA appears as a set of line segments, the width in the horizontal direction and the height, slope, or length in the vertical direction can be considered as feature parameters to represent the EOG signal. These features can be obtained by simple computation from the shape of the line segment and they can express the information of the line segment intuitively [
16]. In this paper, we define the two-feature set
Fhv that represents width and height of line segment and
Fθl that represents slope and length of the line segment.
Sometimes the information of the previous line segments may be useful to determine the characteristics of the current line segment. For example, if a steeply rising line segment appears after a flat signal has been sustained, it can be seen that the gaze is shifted when the EOG signal is rapidly rising from the flat region. In this case, it is desirable to use information of the previous line segment (flat line segment) to characterize the current line segment (rapidly rising line segment). The classification performance can depend on how many prior segments (Np) are used to represent the current single segment. To find the optimal the value of Np, we tested for a range of 2 to 7 and we found that Np = 3 is the optimal value in terms of performance and computation complexity. Another factor to consider for feature extraction is that the variation of the measured signal is different for each individual. To overcome these individual signal differences, the bio-signal data collected were analyzed and the average variation of EOG for each subject was set to a constant that is unique to each subject. This personalization constant is expressed as SFu where u denotes the assigned unique number for each subject.
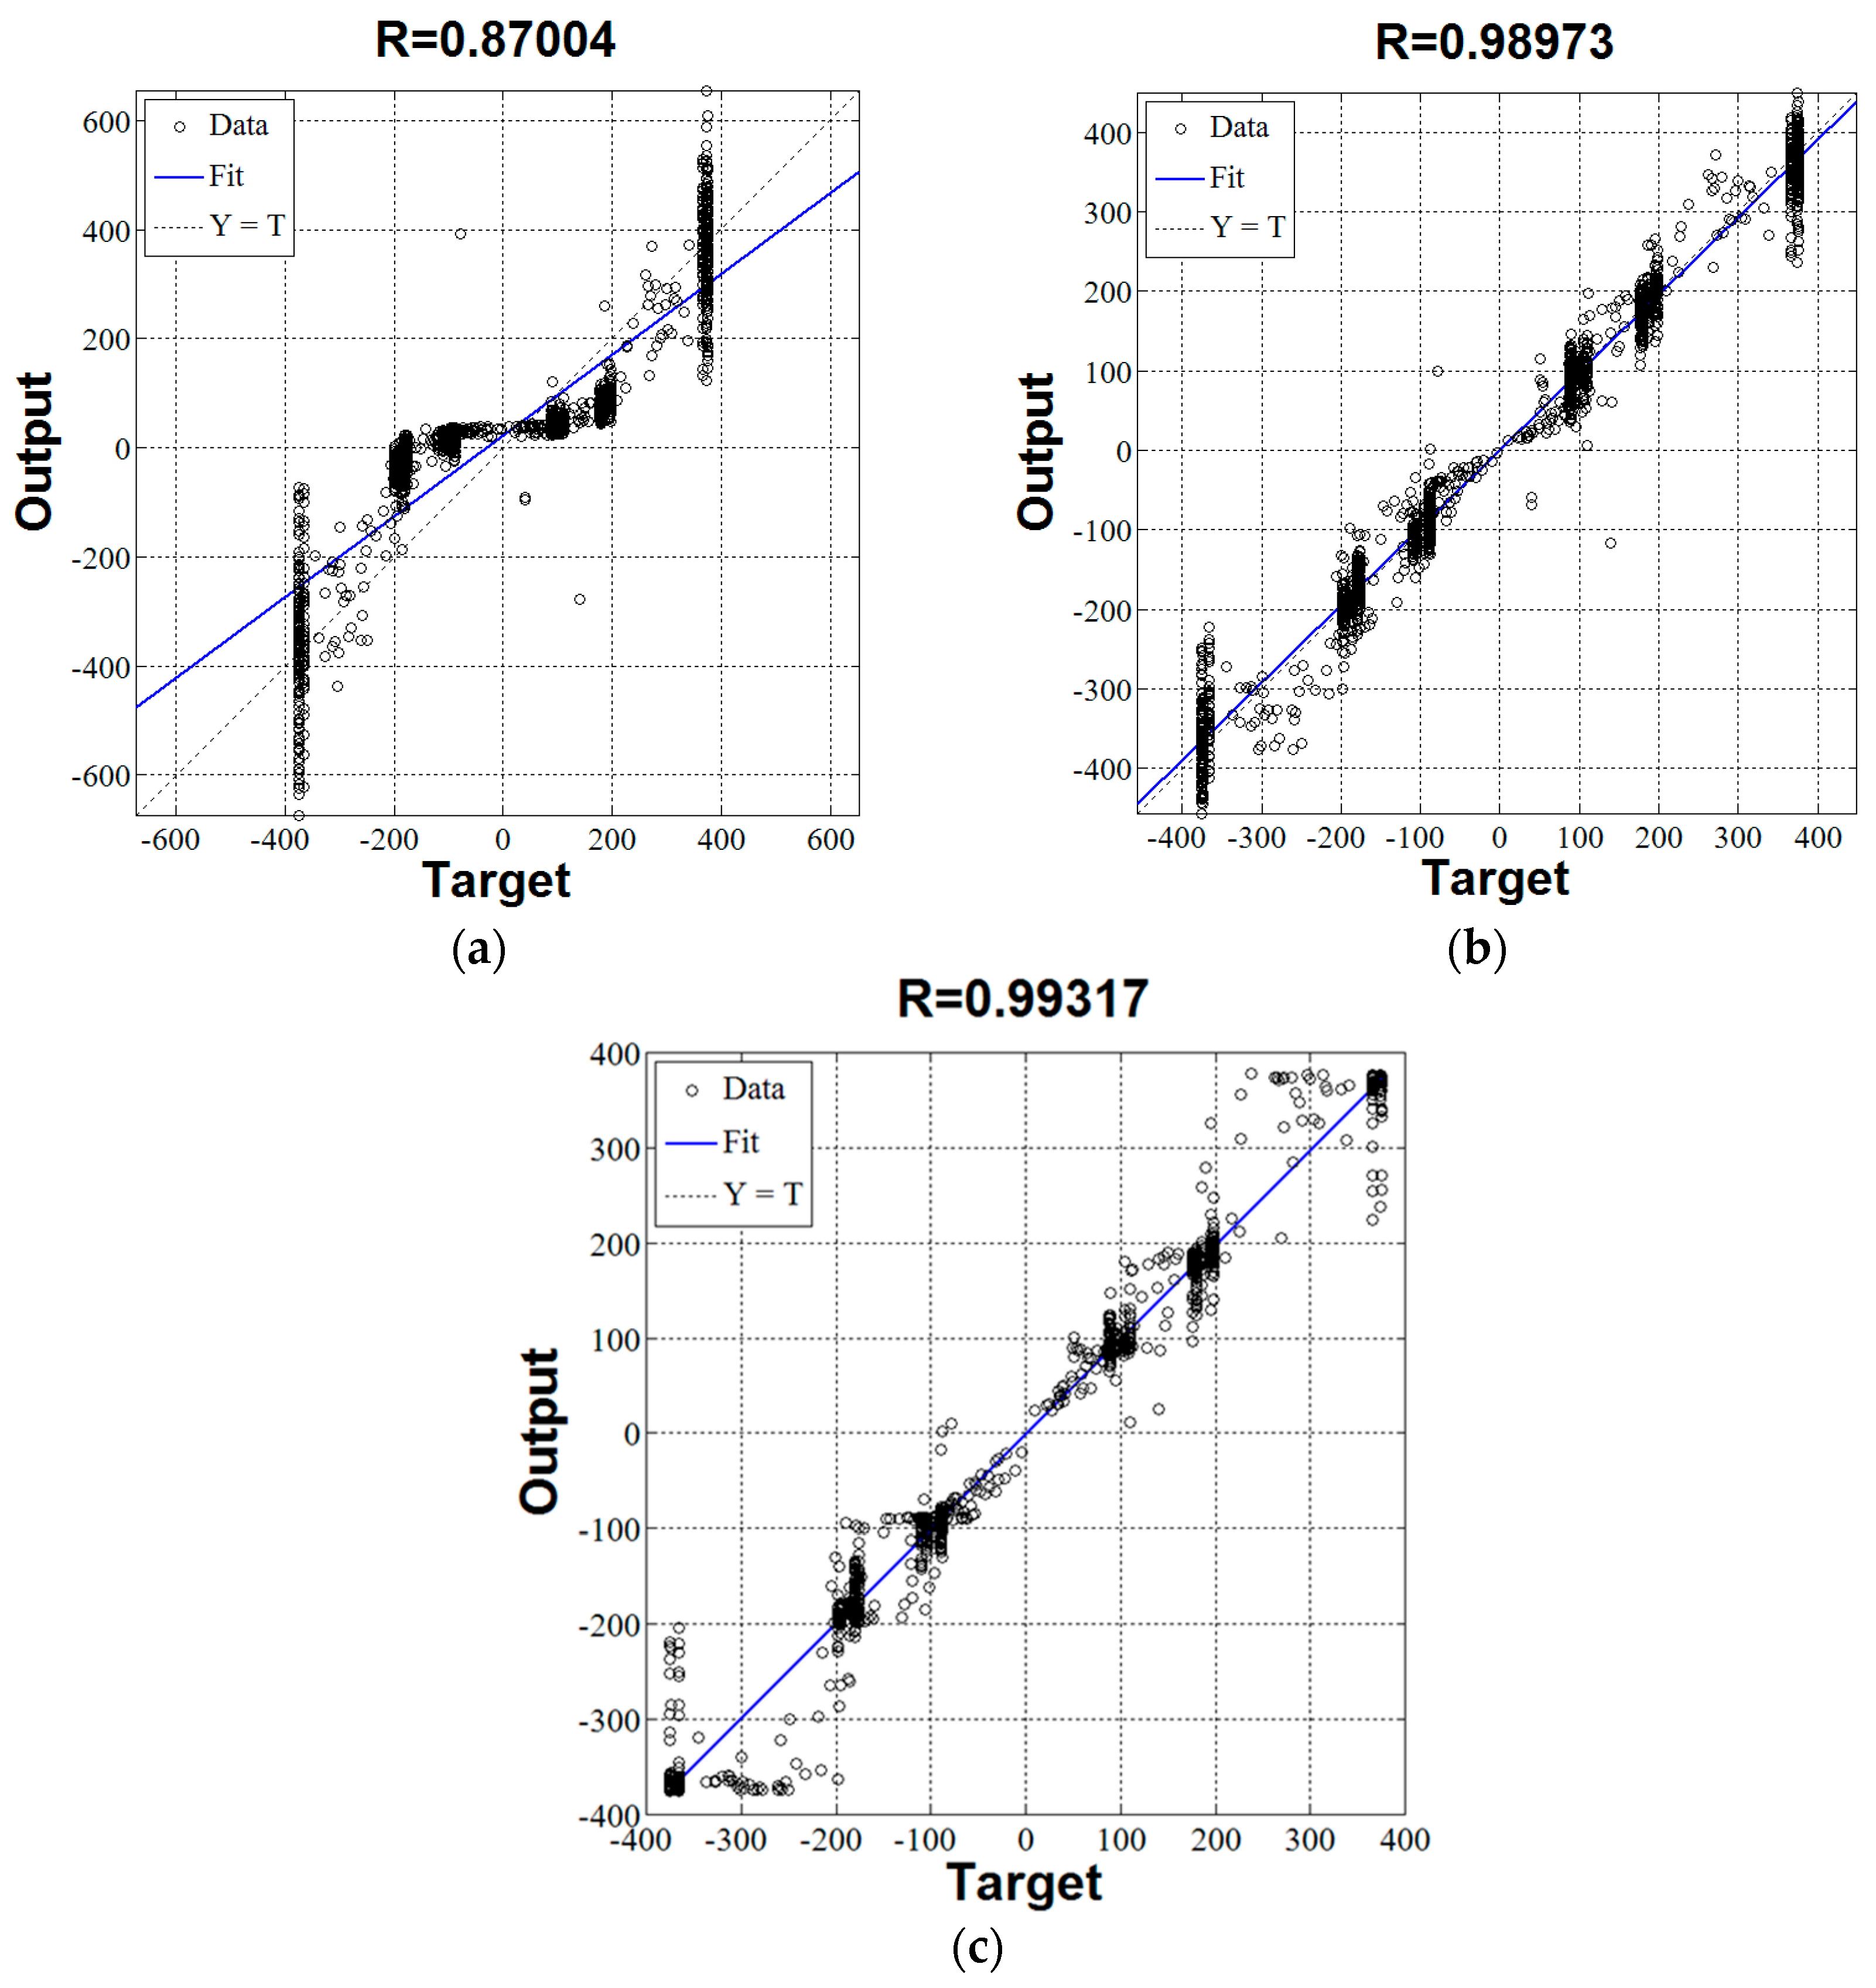
To improve the generalization ability of the system, we used the support vector regression (SVR) as a curve-fitting model. The curve-fitting model can represent a set of discrete data as a continuous function. Thus, by using the curve-fitting model to the proposed system, the proposed system is capable of coping with any arbitrary eye movements not included in the training data set. SVR is a kind of curve-fitting model used to solve the regression problem based on the existing Support Vector Machine (SVM) that has excellent modeling and prediction capabilities. In this paper, we used the Chang and Lin’s model that can be found on “LibSVM’ library [
17]. Since the performance of SVR depends on the type of kernel functions, we tested three types of kernel functions including polynomial kernel function, sigmoid kernel function and Gaussian kernel function. For the performance test, we set 90% of data for training the SVR and 10% of data for test and repeated 10 times without duplication of the test data using a 10-fold cross validation method.
Figure 10 shows the effects of the types of kernel functions on SVR performance. In these plots, the horizontal axis shows the actual moving distance of the gazing position and the vertical axis shows the prediction results of SVR. As shown in these plots, result plot of SVR with Gaussian kernel type showed the best results with 0.99317 of R value (multiple correlation coefficient value).
2.4. Temporalis EMG Signal Processing for Recognition of Bite Action
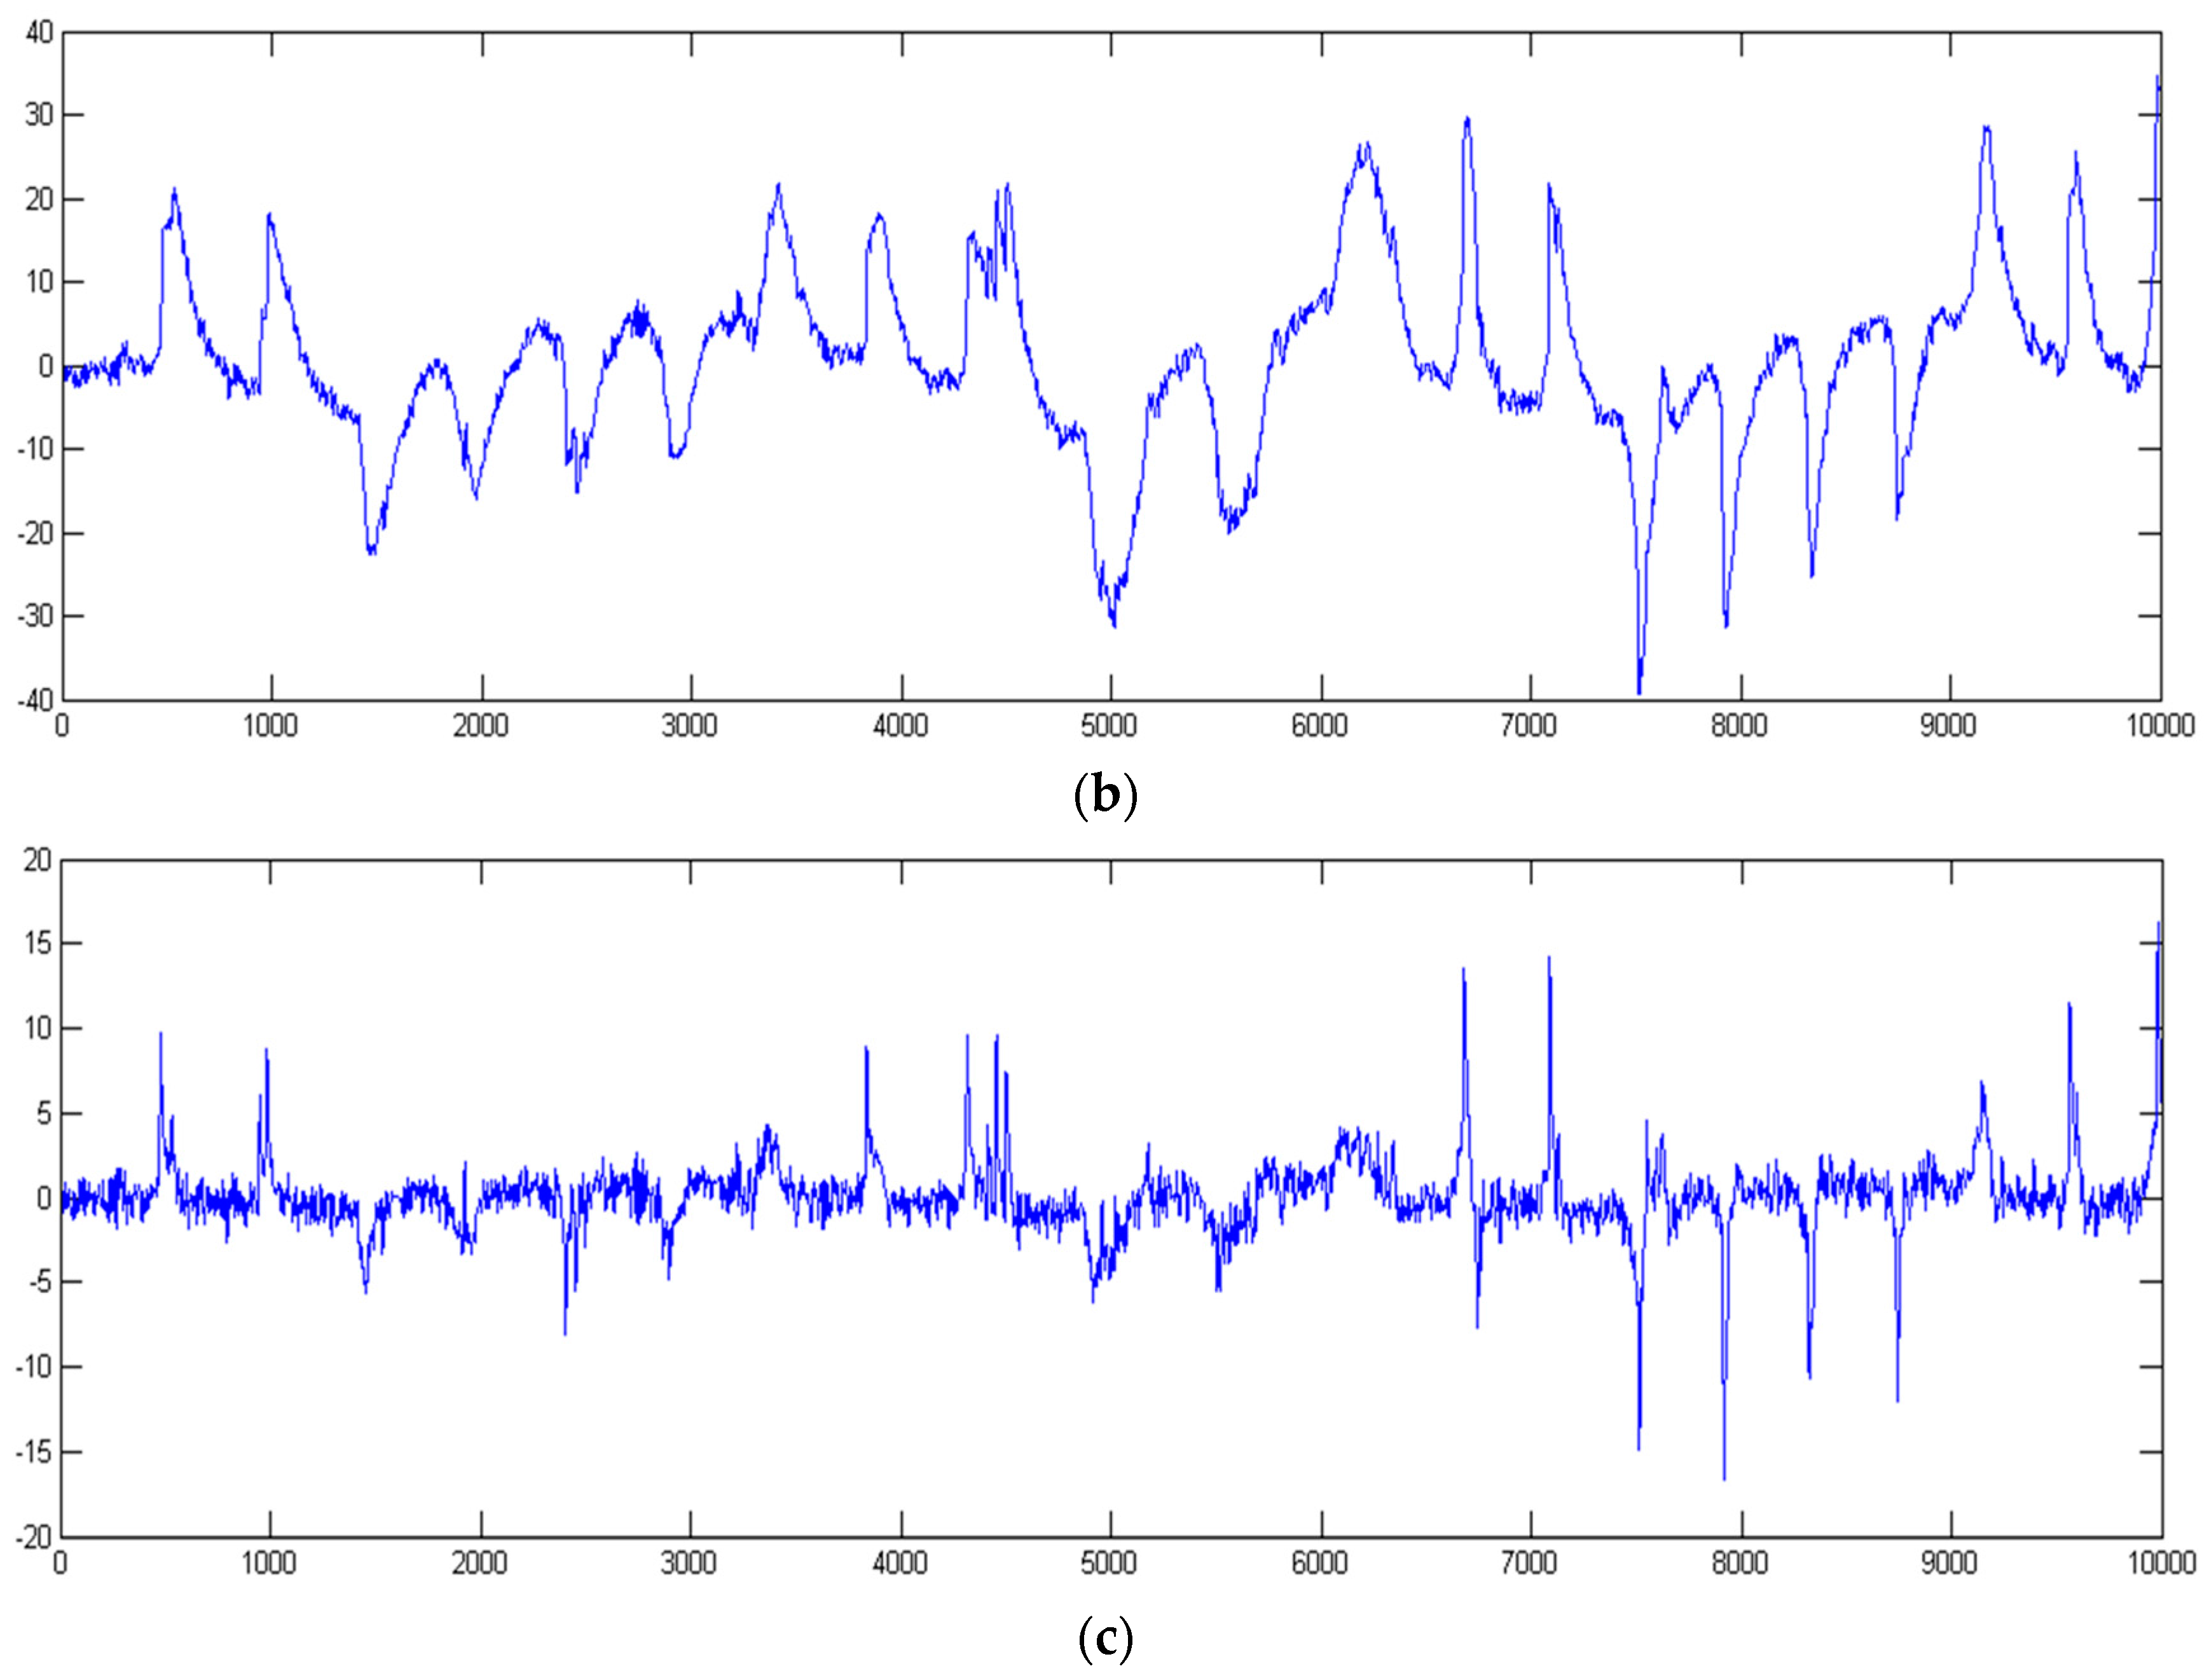
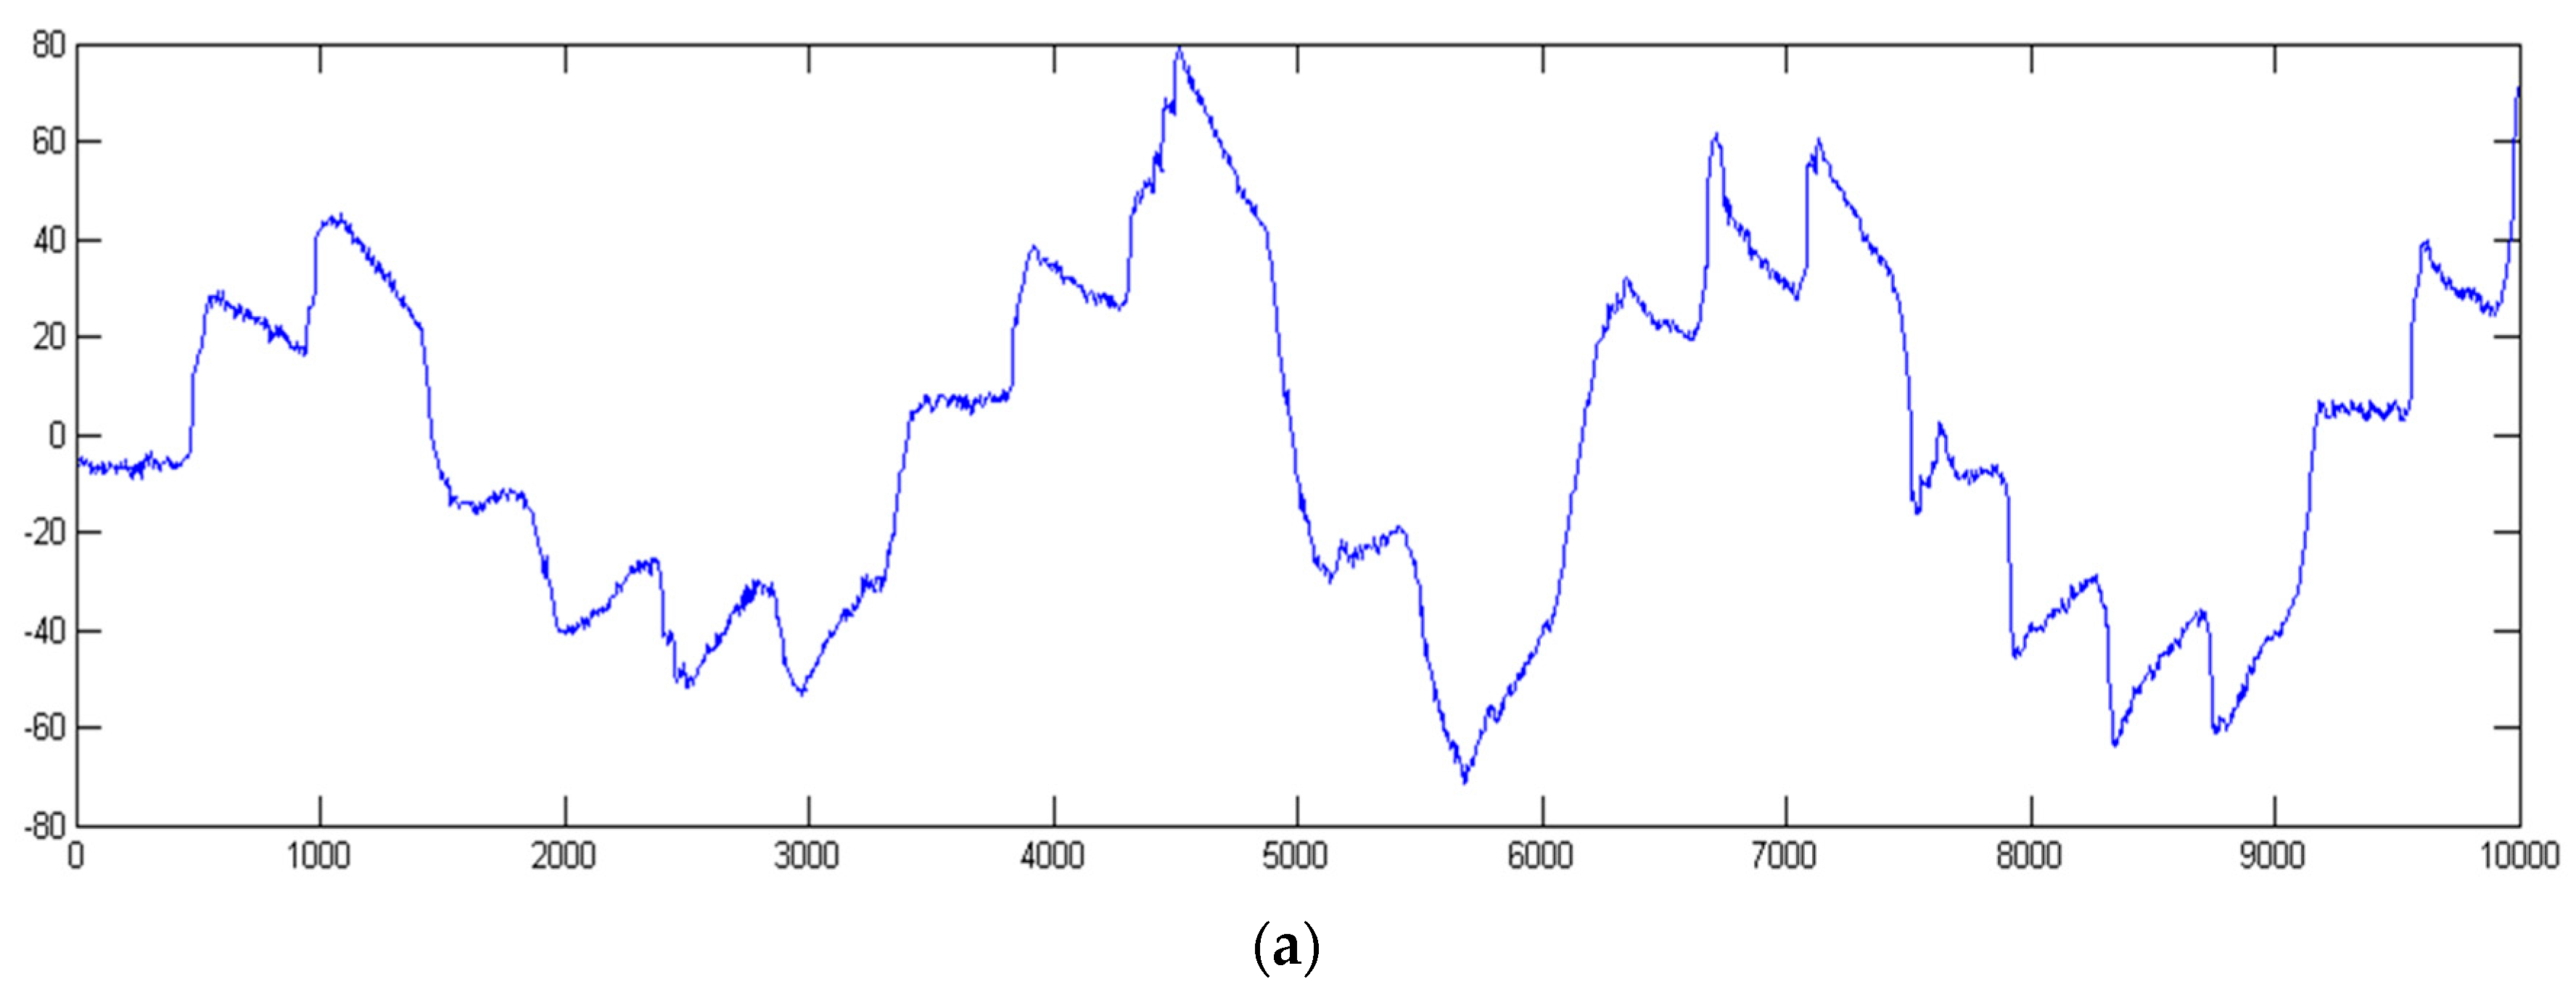
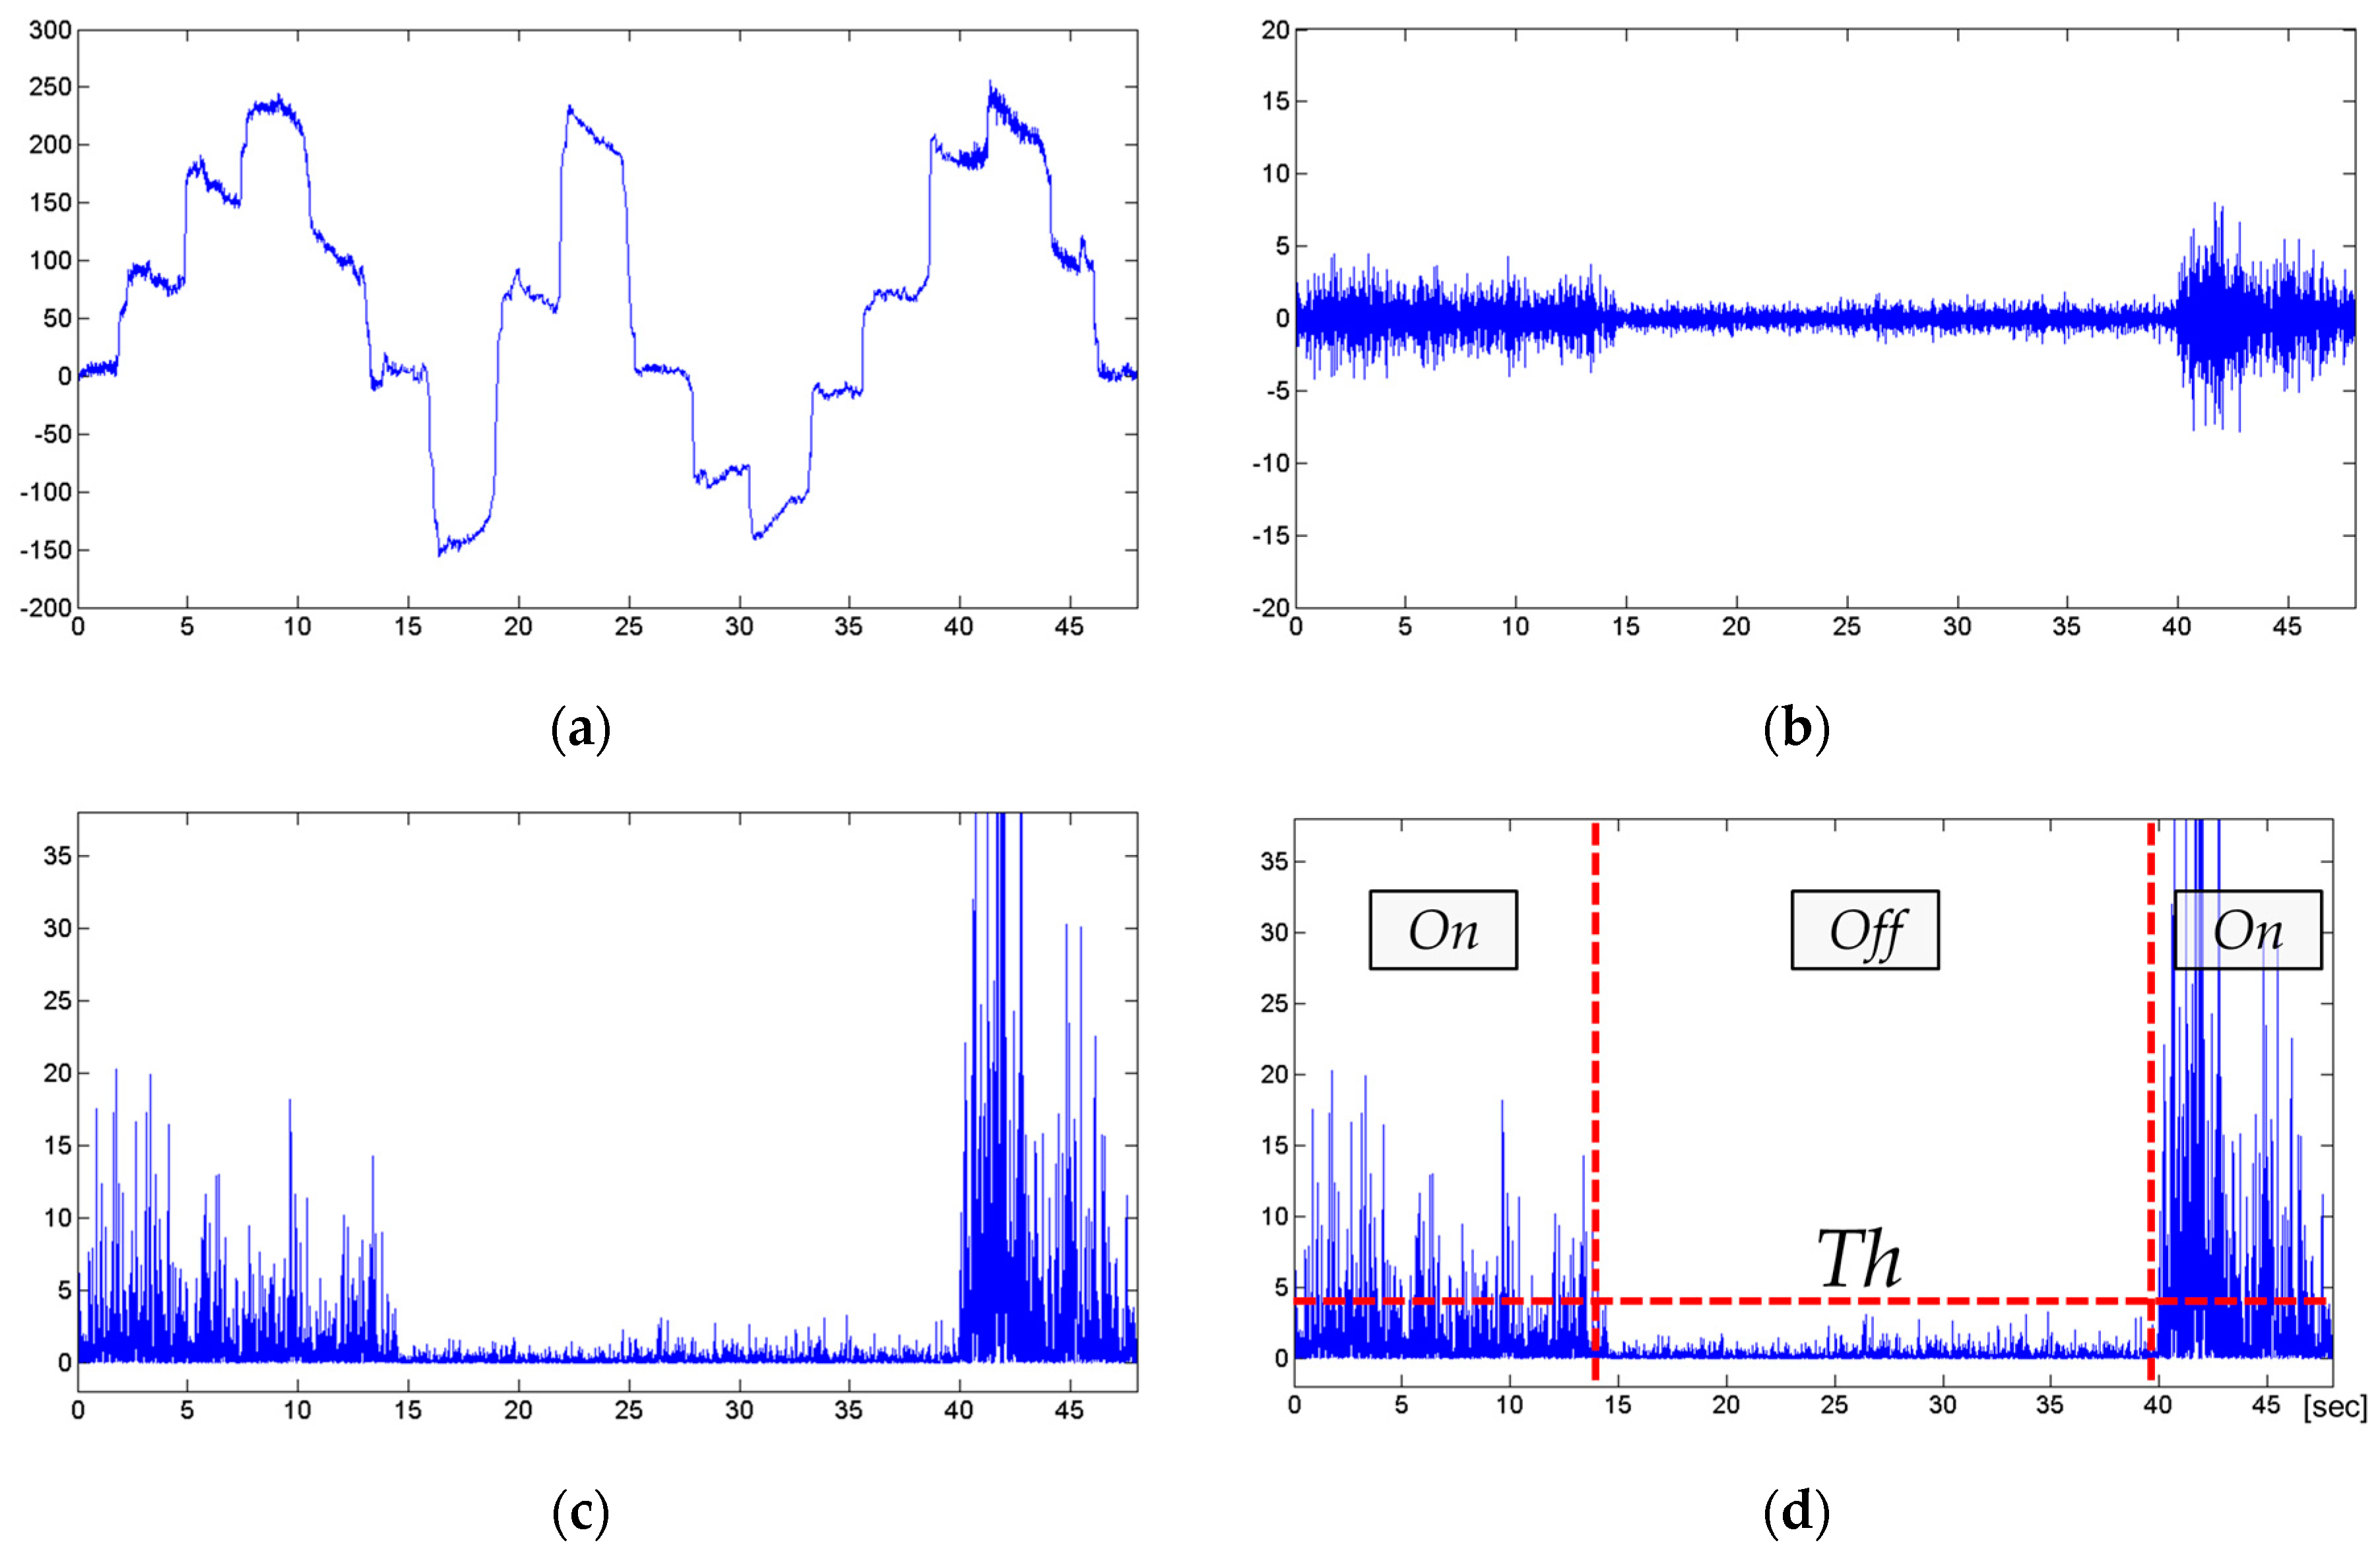
EOG and EMG have different signal characteristics in terms of signal amplitude and frequency ranges. Therefore, the EMG of the temporalis muscle can be obtained by frequency division of the measured signal which is shown in
Figure 11a. In this figure, we cannot recognize the EMG since the amplitude of EMG is much smaller than EOG. In general, EMG has a relatively bigger amplitude than EOG. However, in this case, the amplitude of EOG is bigger than the amplitude of EMG since the electrodes are attached to the temple on both sides which is relatively far from temporalis. The frequency division is performed using a Butterworth 4 pole 30 Hz high-pass filter designed by the IIR method, and the obtained temporal EMG signal by IIR filter is shown in
Figure 11b. Since the frequency range of EMG signal does not overlap with EOG signals, we can use both signals independently at the same time. For this, the proposed system analyzes these temporal muscle EMG signals and determines if the line segment information obtained through the PLA process is generated in bite action or not. For this, when the PLA outputs new segment information, only the temporal muscle EMG of the same interval as the time segment of the corresponding line segment is separated and the signal amplitude within that interval is determined. When the temporal EMG according to the time is
, the intra-segment power
for the
i-th segment can be expressed by the following equation.
In the formula for calculating
, it can be seen that the temporal EMG signal is squared and then the time average is obtained between the two vertices
and
where the
i-th line segment appears. As shown in
Figure 11b, since the DC component is removed by the high pass filter and the temporal muscle EMG signal is concentrated around 0, the amplitude of the squared EMG signal becomes more prominent when the bite action occurs as shown in
Figure 11c. Afterwards, the
is compared with the threshold value
Th, and if
is greater than
Th, we conclude the measurer to be in a state of bite and vice versa.
Figure 11d conceptually shows that temporal muscle EMG is classified according to bite action by applying threshold value
Th.
3. Results
In this paper, we designed two kinds of experiments for performance evaluation and real application to menu selection using the proposed system. For performance evaluation, the target circle located at the center of the screen randomly changes its horizontal position and we measured the EOG during that procedure. From this measurement, we calculated the difference between real horizontal position of target circle and expected gazing position from the developed system. In addition, this test also recognized the bite action that replaces the click action of the mouse interface. The second experiment is a real application of the proposed HCI. For this, we developed an EOG and EMG-based pointing interface system that can be used as a mouse. Through this experiment, we verified if the proposed EOG and EMG-based interface can easily applicable to menu selection command on a computer system as a new interface method.
3.1. Results of Performance Evaluation
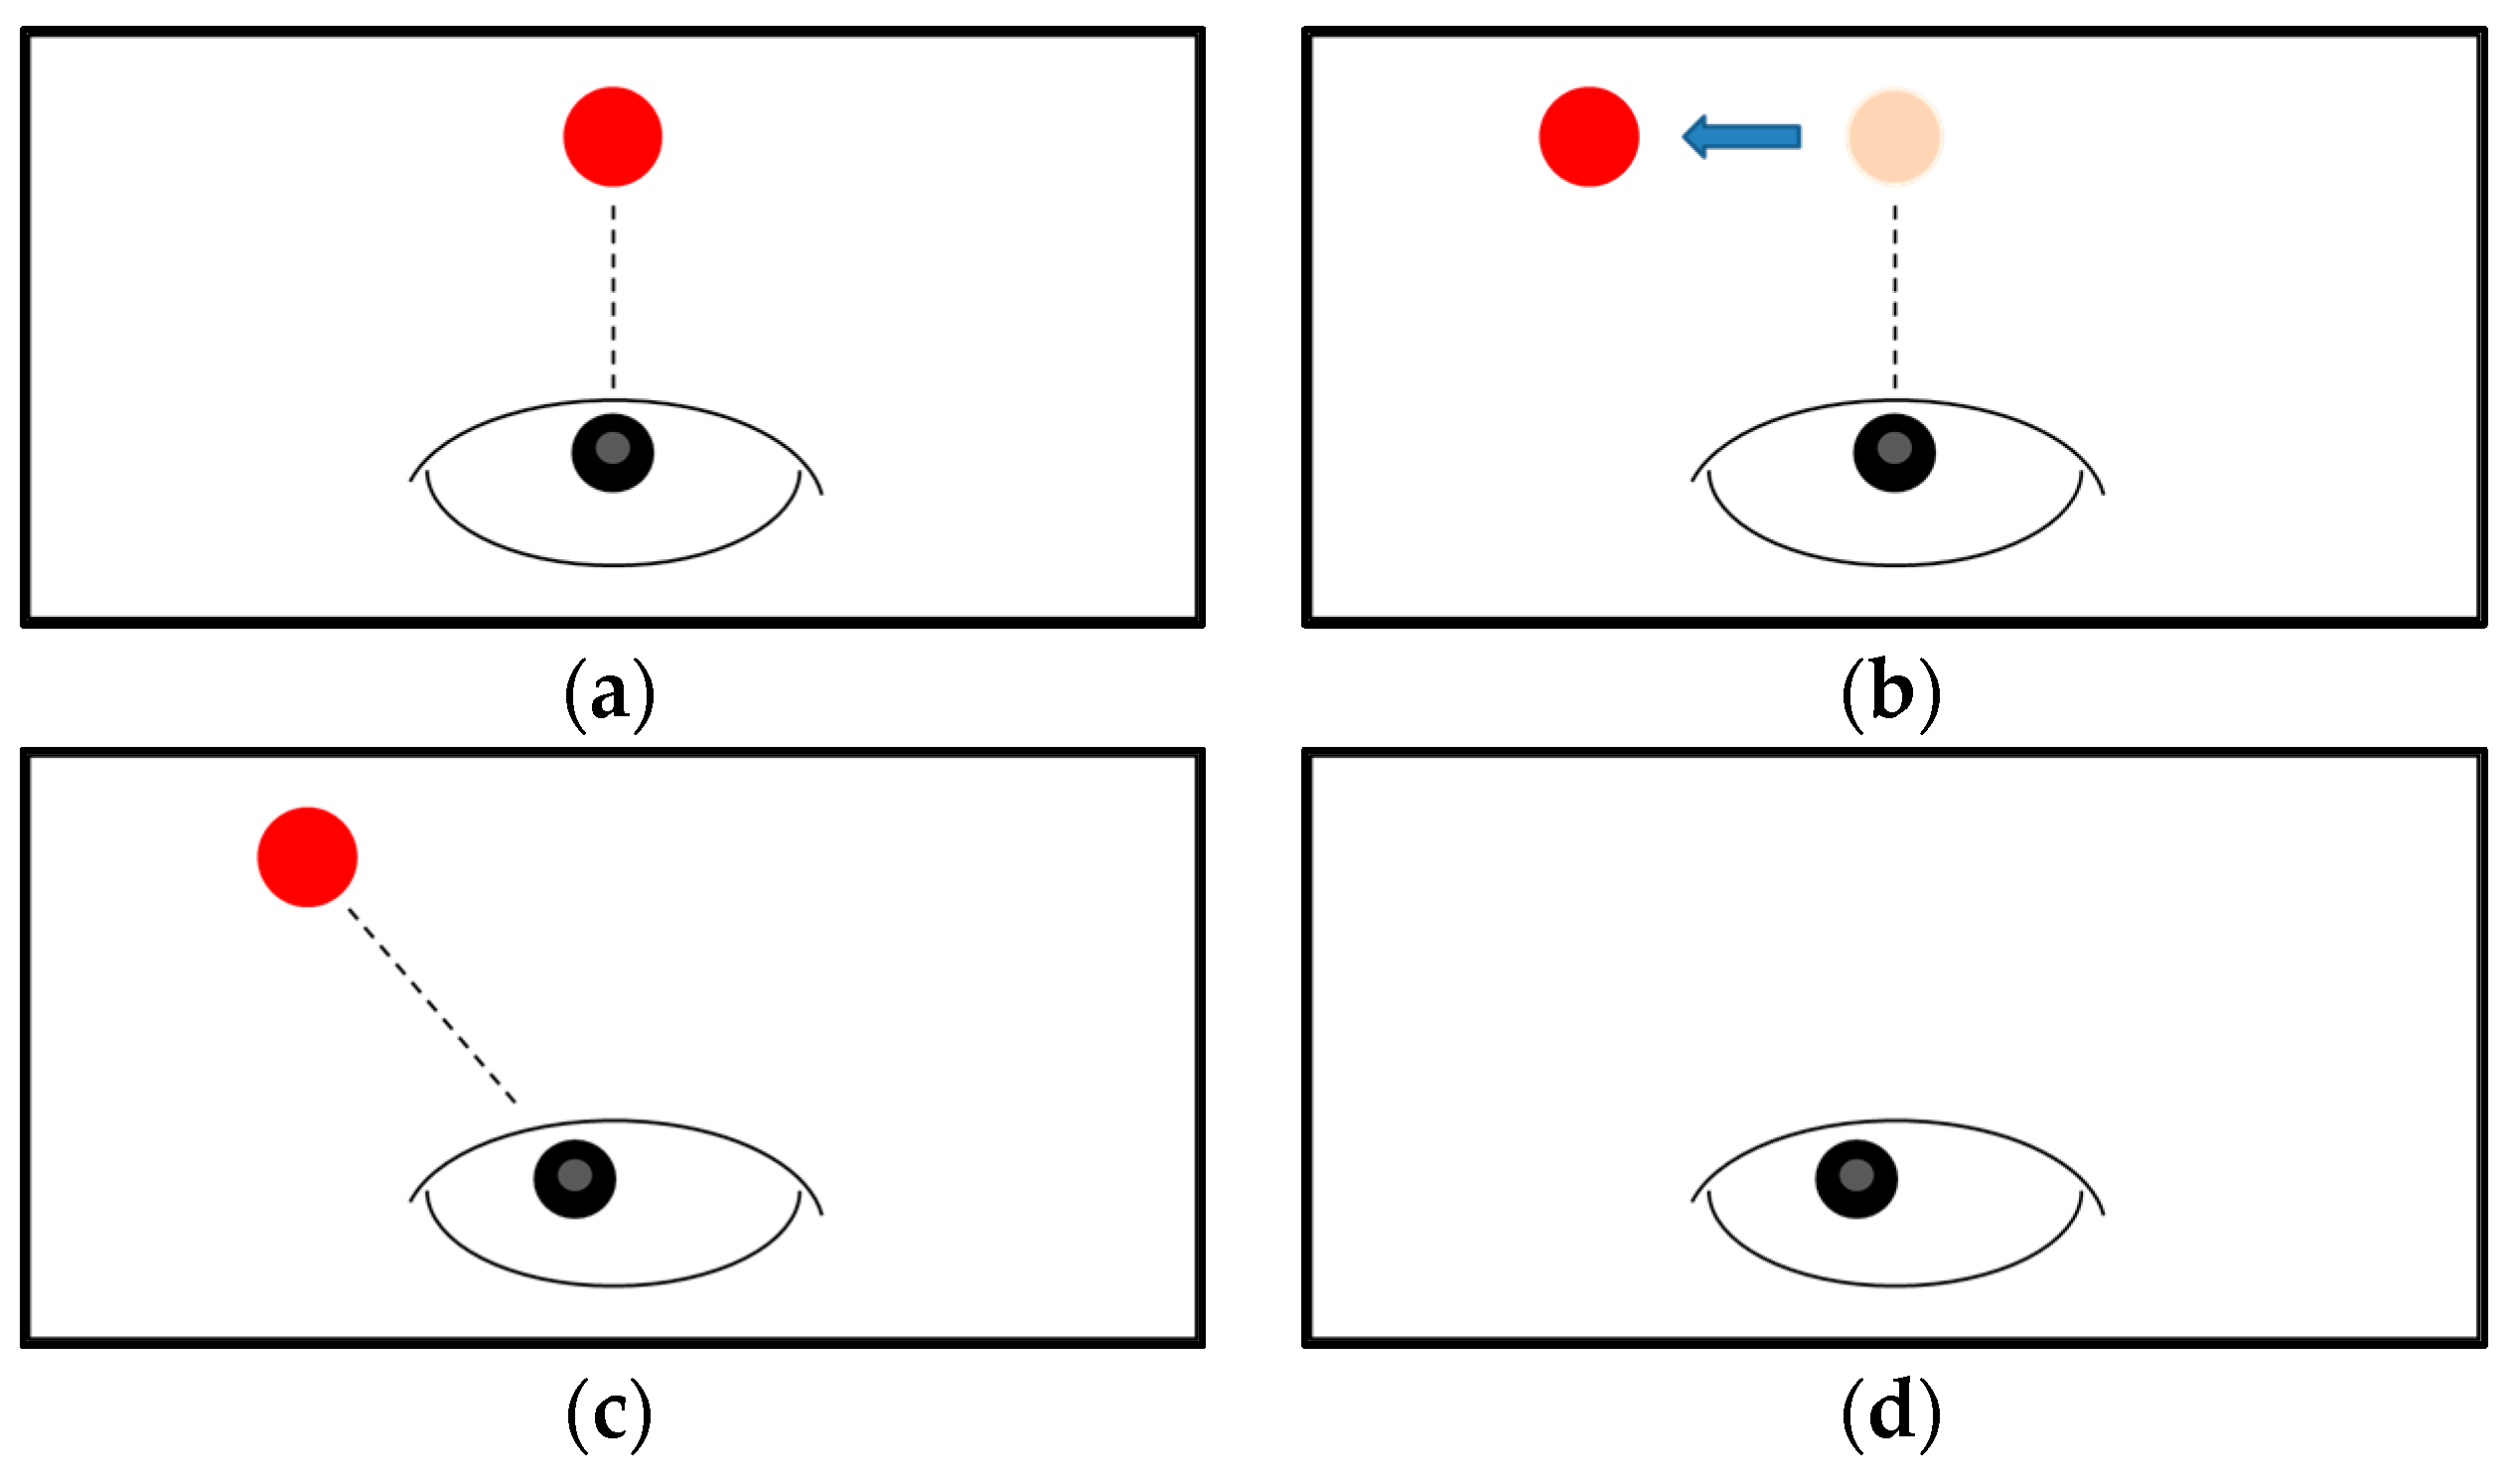
The proposed system continuously tracks the movement of the user’s eyeball and finds the position where the user is currently gazing on the screen. However, it is a waste of resources to perform such a function continuously even if the user does not need any operation. However, if the system is paused when no operation is needed, the system will lose the position information of the user’s current eyeball since the system does not know where to start tracking once the system resumes. Therefore, the performance evaluation program was made by first giving a position to start eye movement tracking and tracking the movement of eye movement started from this position as shown in
Figure 12. In this figure, the red circle is the target position to which the eyeball should gaze.
In the signal acquisition phase for training, the target circles on the screen were designed to reciprocate with a maximum of nine positions. In the performance evaluation stage, ten positions were selected in the same range to confirm the performance of how the SVR can track eye movements when the eye moves to an arbitrary position that has not been trained.
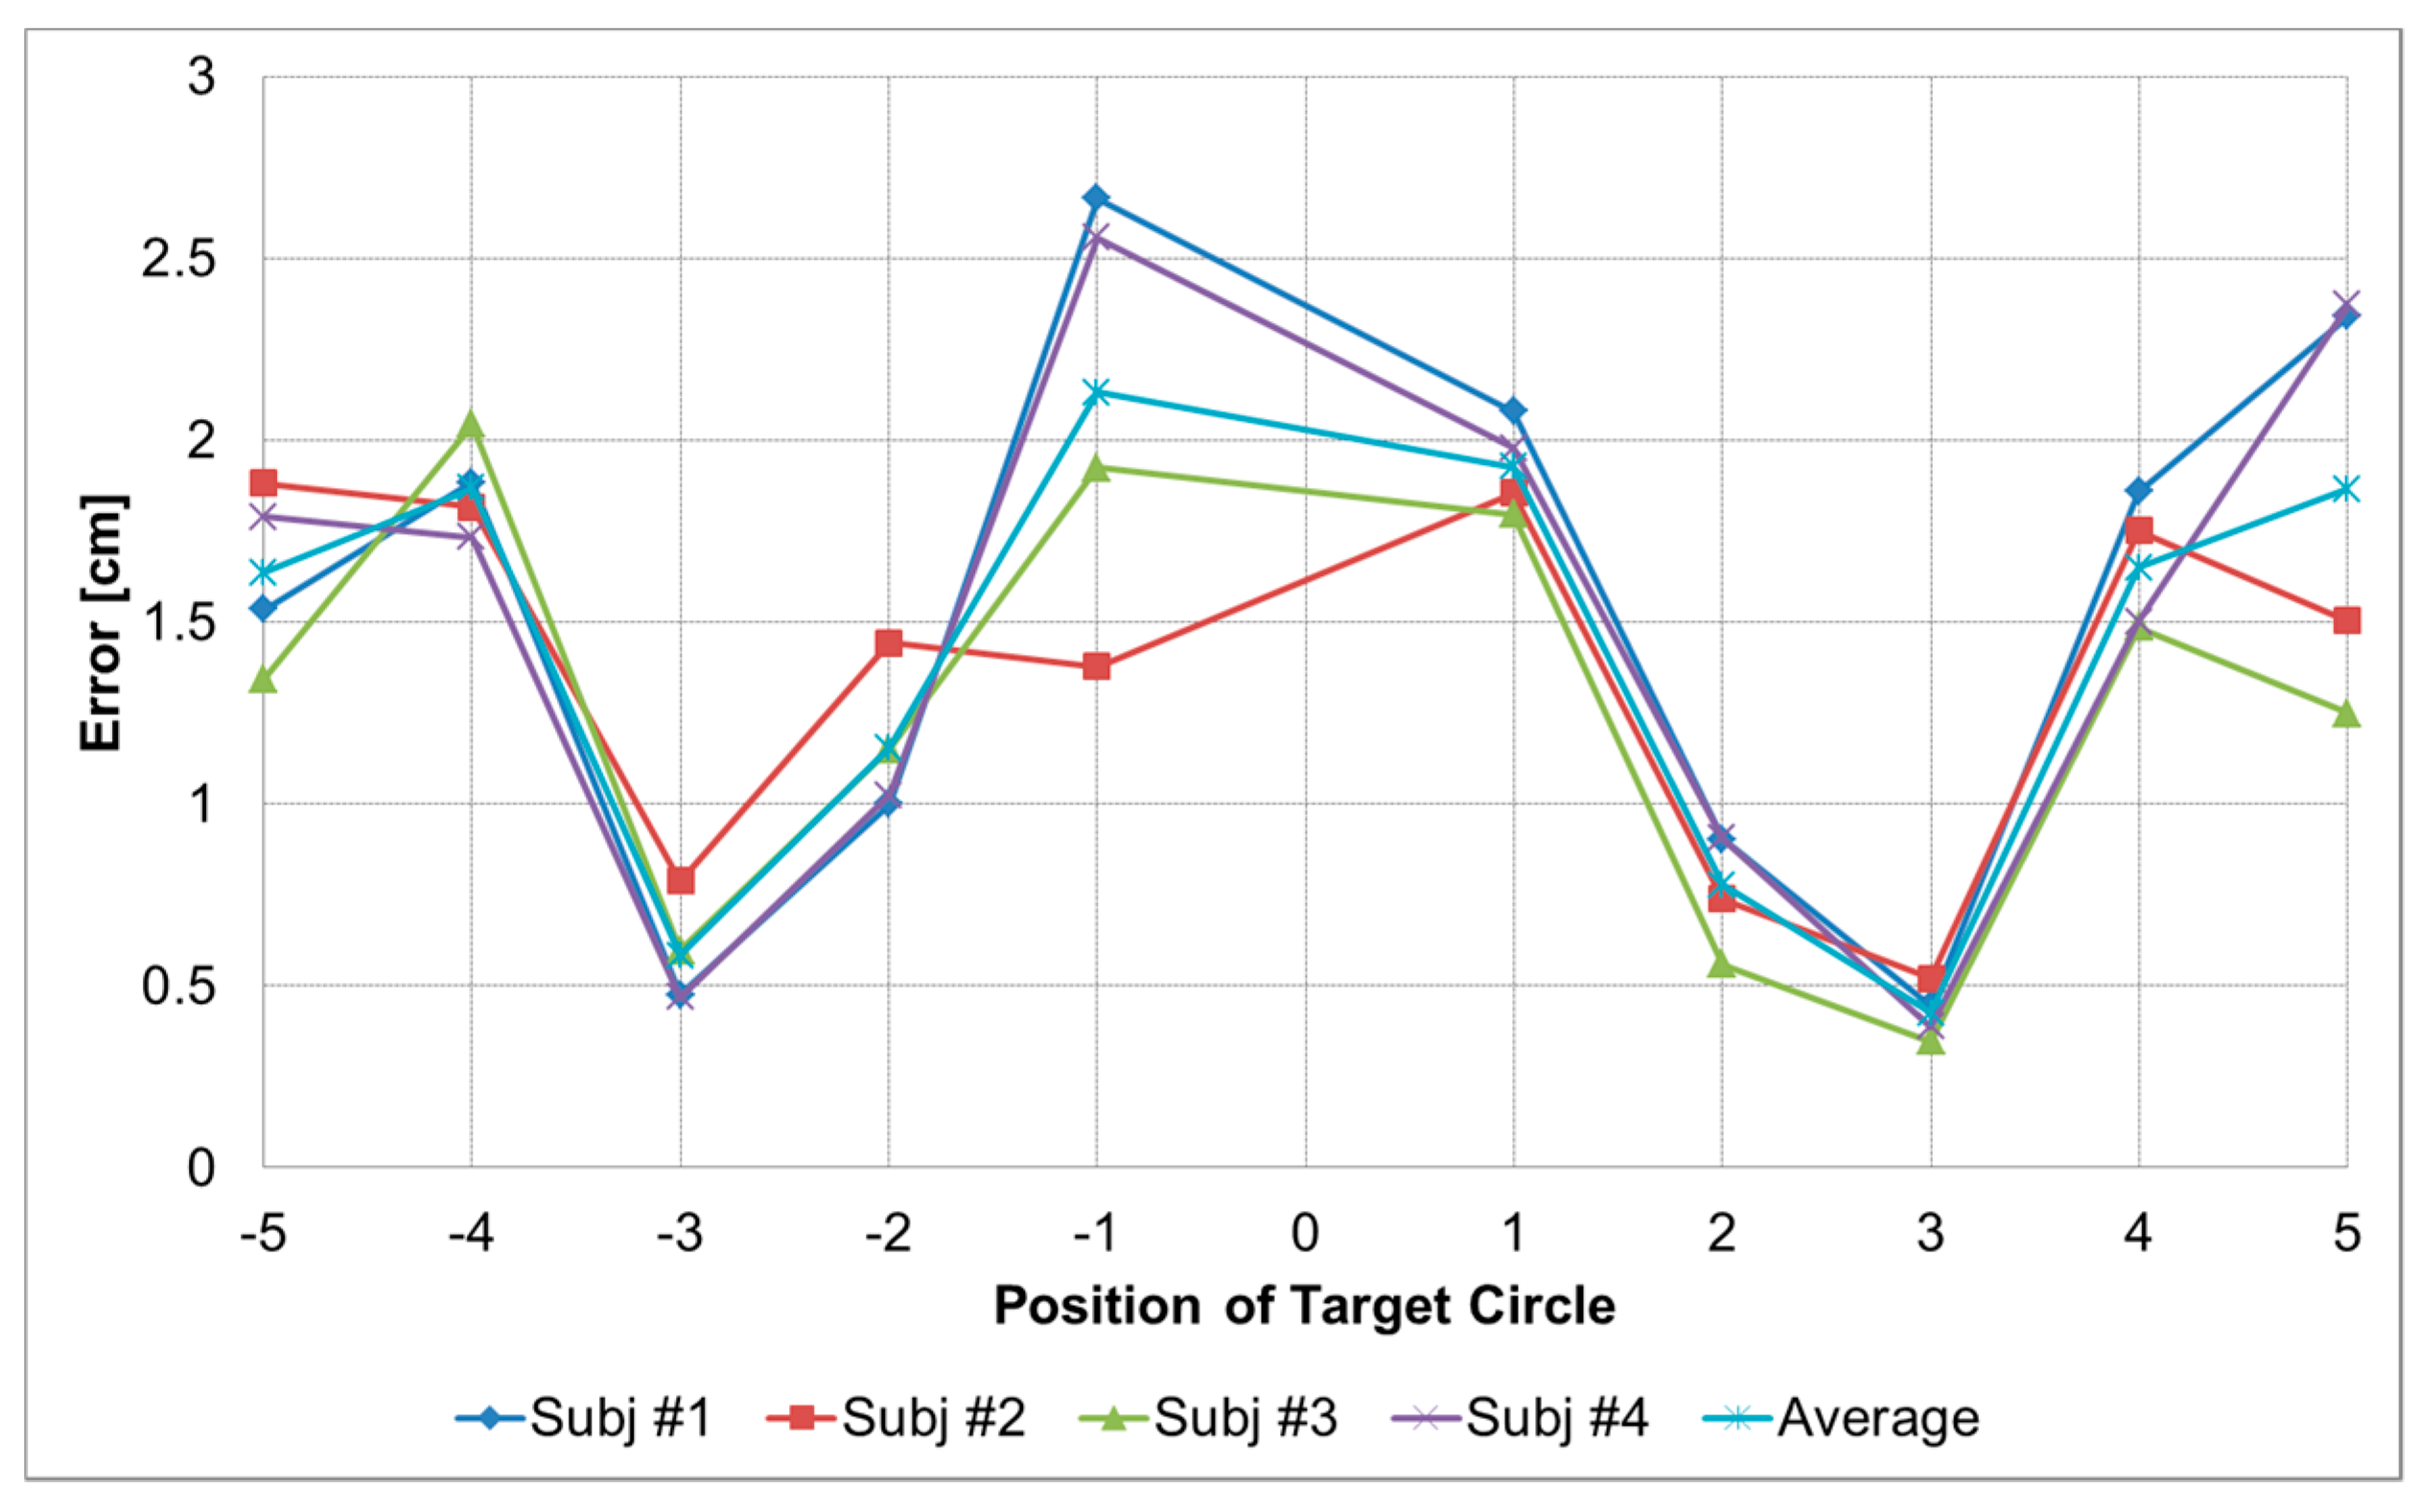
Performance evaluation was performed on 4 out of 7 subjects participating in signal acquisition for training the system. Each subject performed 300 eye movements for testing. The spending time for this experiment was dependent on the subject. We did not give specific time guidelines for repetition of this experiment since each subject showed different levels of eye fatigue. So, we suggested that the subjects re-participate in this experiment after they had fully rested when they felt eye fatigue. In general, they continued the experiments for approximately 30 s to 1 min and then took rest. All subjects were male and aged between 20 and 30 years old. For the performance evaluation, two performance evaluation indices were applied. The first performance evaluation index was obtained by measuring the difference in units of cm on a 51 cm monitor between the position of the target circle and the tracking position of eyeball using the proposed system as shown in
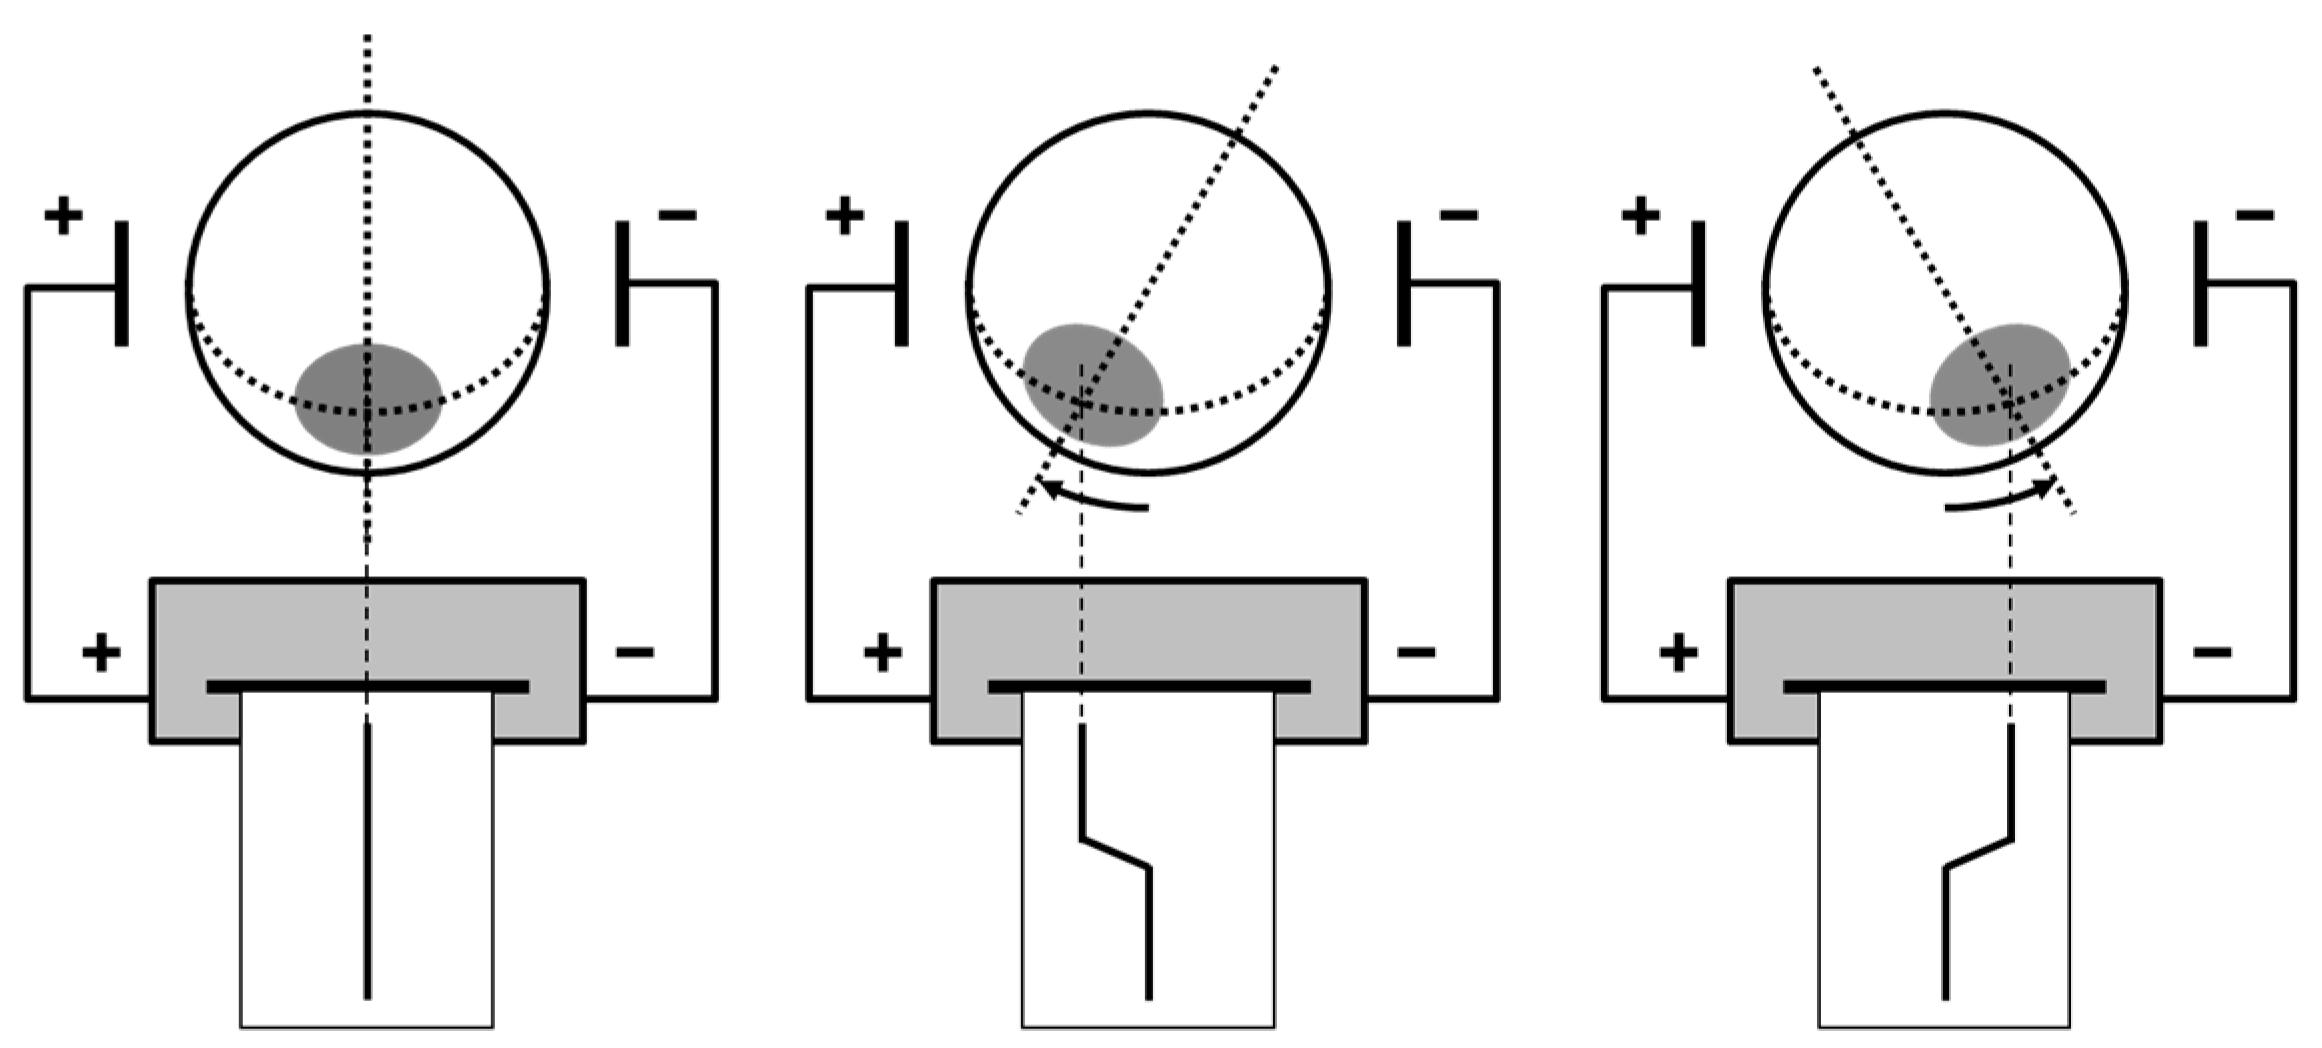
Figure 13. As shown in this figure, the significant difference by subject is not significant. In this figure, minimum error was measured at positions −3 and 3 which is the median position of horizontal range. In addition, it can be seen that there is a similar error value at the symmetric position with respect to reference 0 point. This infers that the cause of error may be coming from the approximation of the movement of the eyeball to the linear motion, whereas the human eyeball movement is a rotational motion with varying angle. Therefore, it infers that the error increases as the difference between linear motion and rotational motion becomes larger as the position deviates from the central position where the eyeball motion starts.
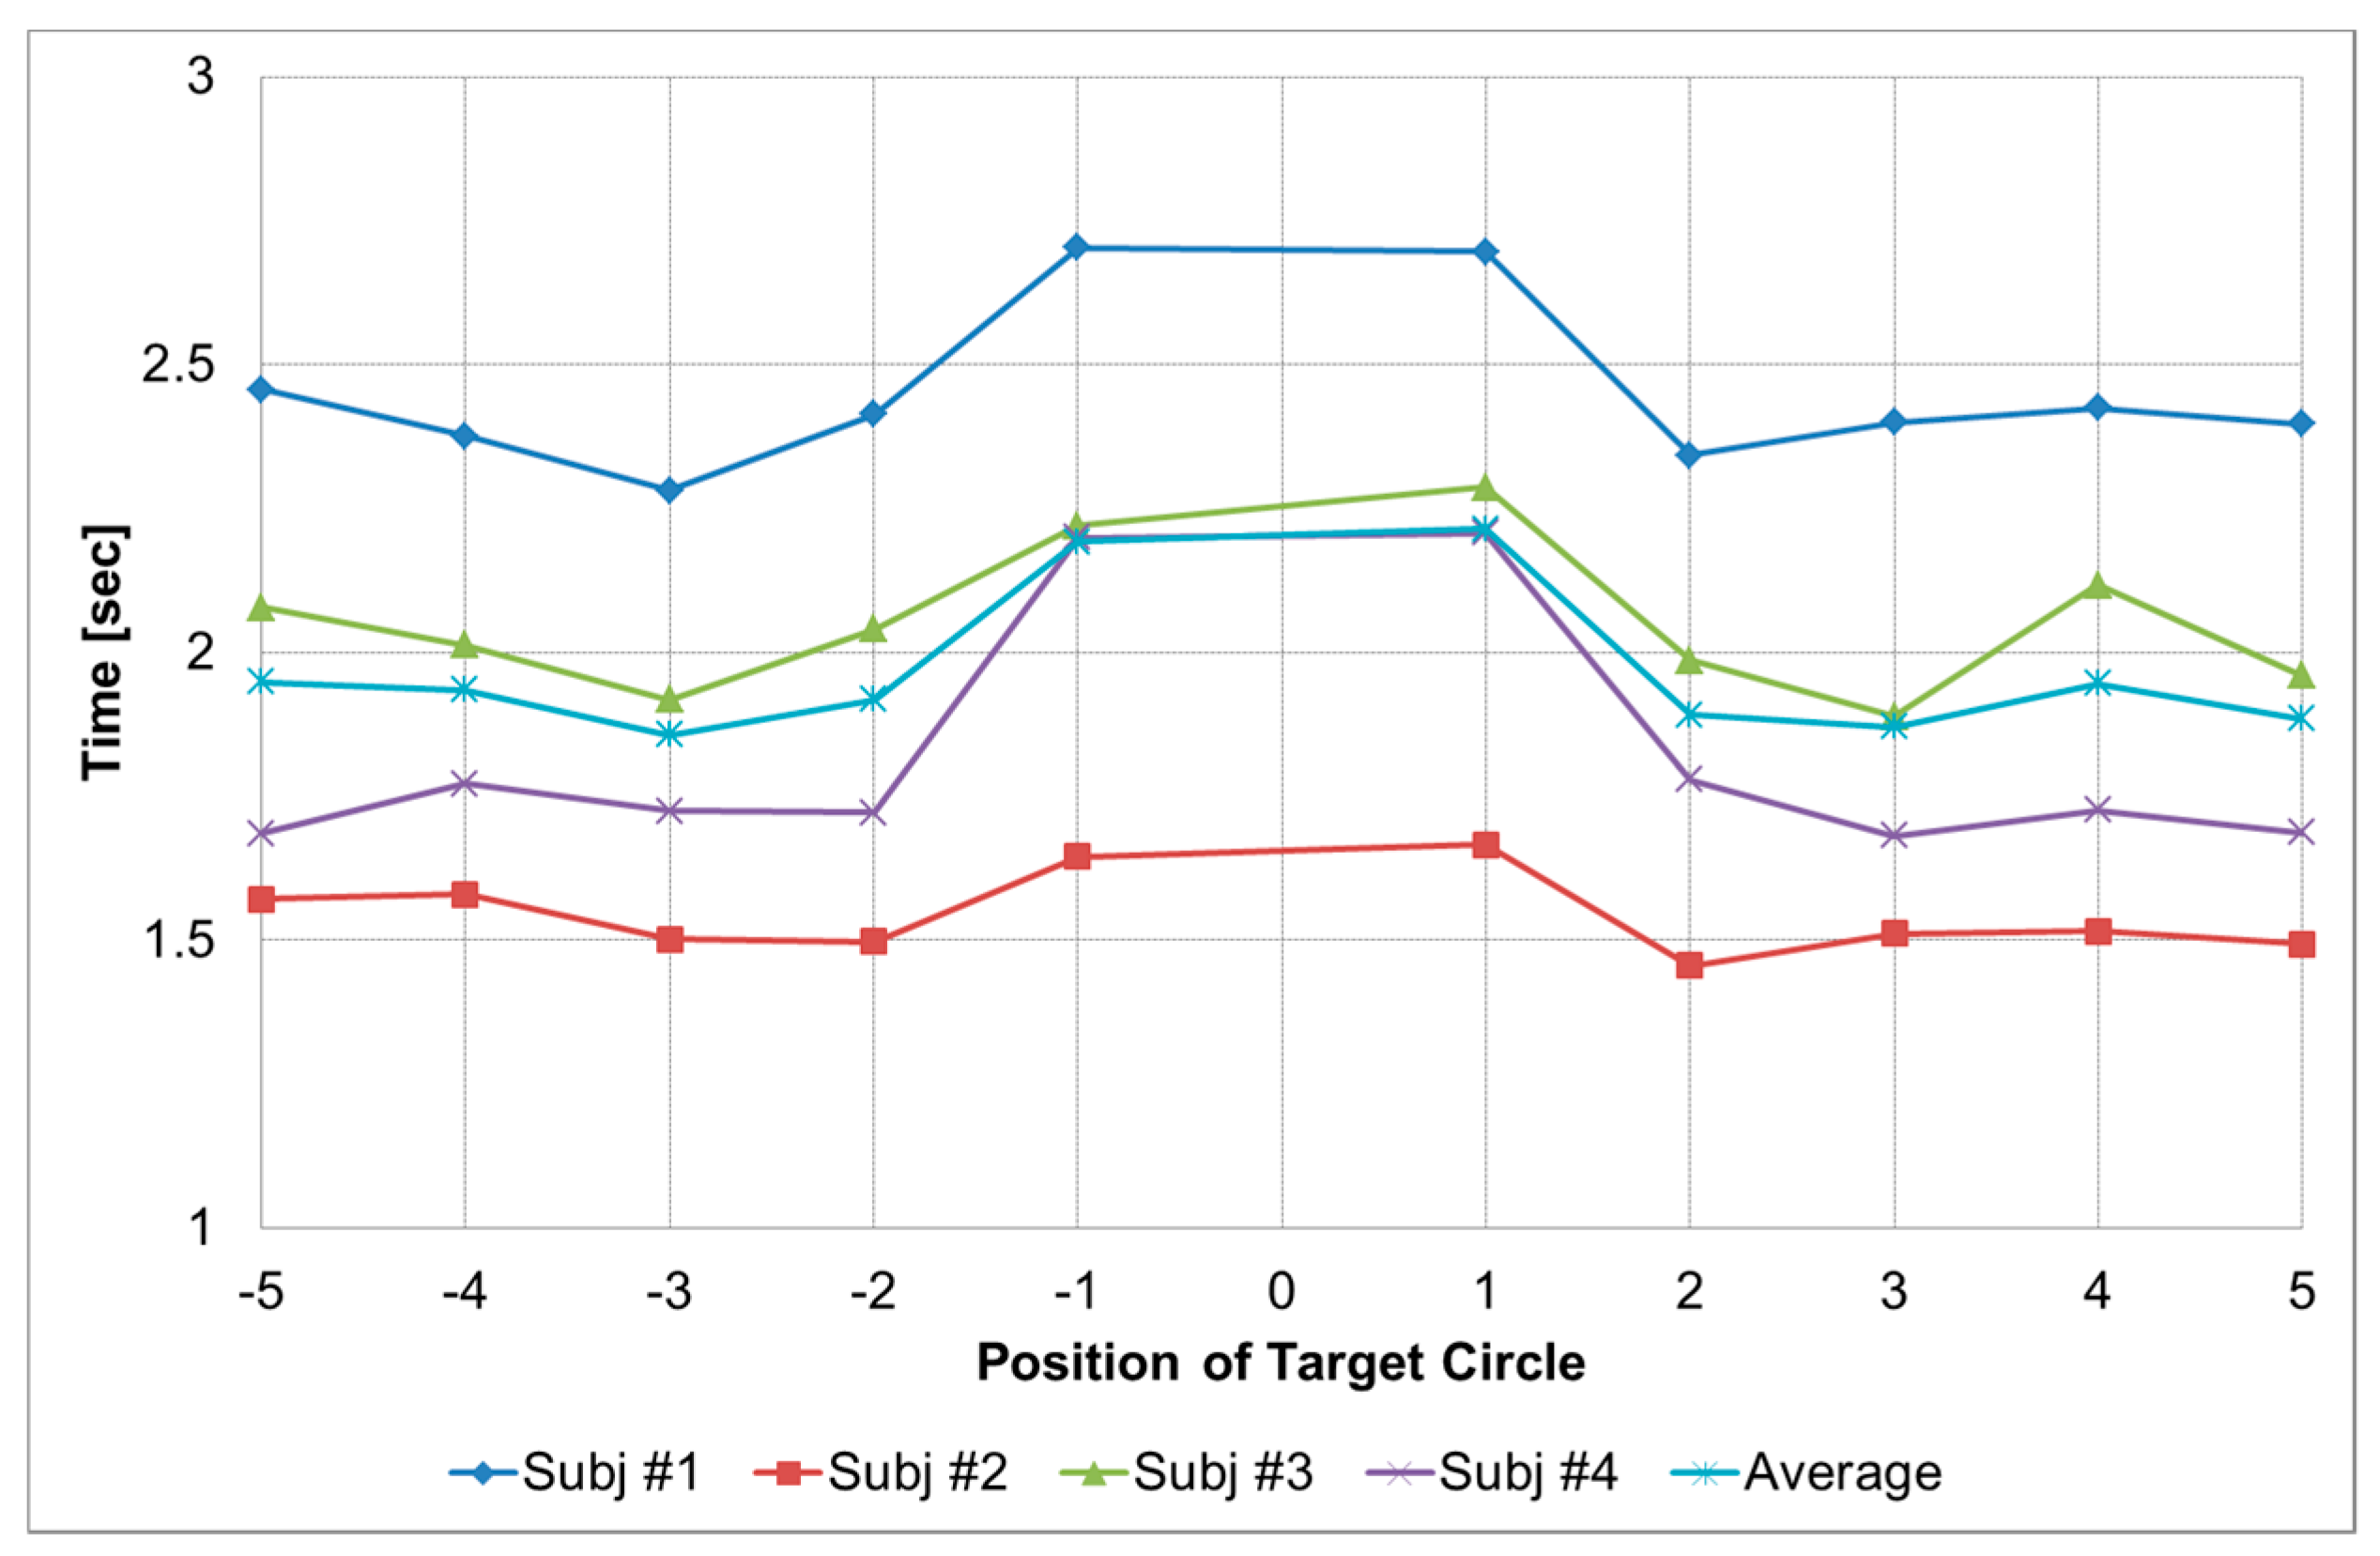
The second performance index is the time (in units of seconds) required to complete the drag-and-drop operation after the center circle has moved to an arbitrary position as shown in
Figure 14. Although the required time varies by subject, it can be confirmed that general trend for each target positions are similar.
3.2. Result of Mouse Interface Using EOG and EMG
The proposed system can be applied in various ways for HCI or HMI. As one example, we developed EOG and EMG-based pointing interface system that can be used as a mouse. The developed system is similar to the performance evaluation program which is shown in
Section 3.1., but it is more user friendly for convenience of use. First, when you run the program, you will only see the tray icon on the Windows operating system without any visible pointing menu on the screen. Right clicking on this tray icon allows you to select your name among the list. If one has finished some set-up procedure in advance, the user can set personalized
SFu value by selecting his or her own name. In the case of a first-time user, a simple set up procedure is required to obtain customized
SFu value for each user. After the user selection is completed, the same tray icon menu can be used to connect the bio-signal acquisition hardware to the PC. After the connection is established, the user’s bio-signal is transmitted to the PC and the developed interface system is executed in real time.
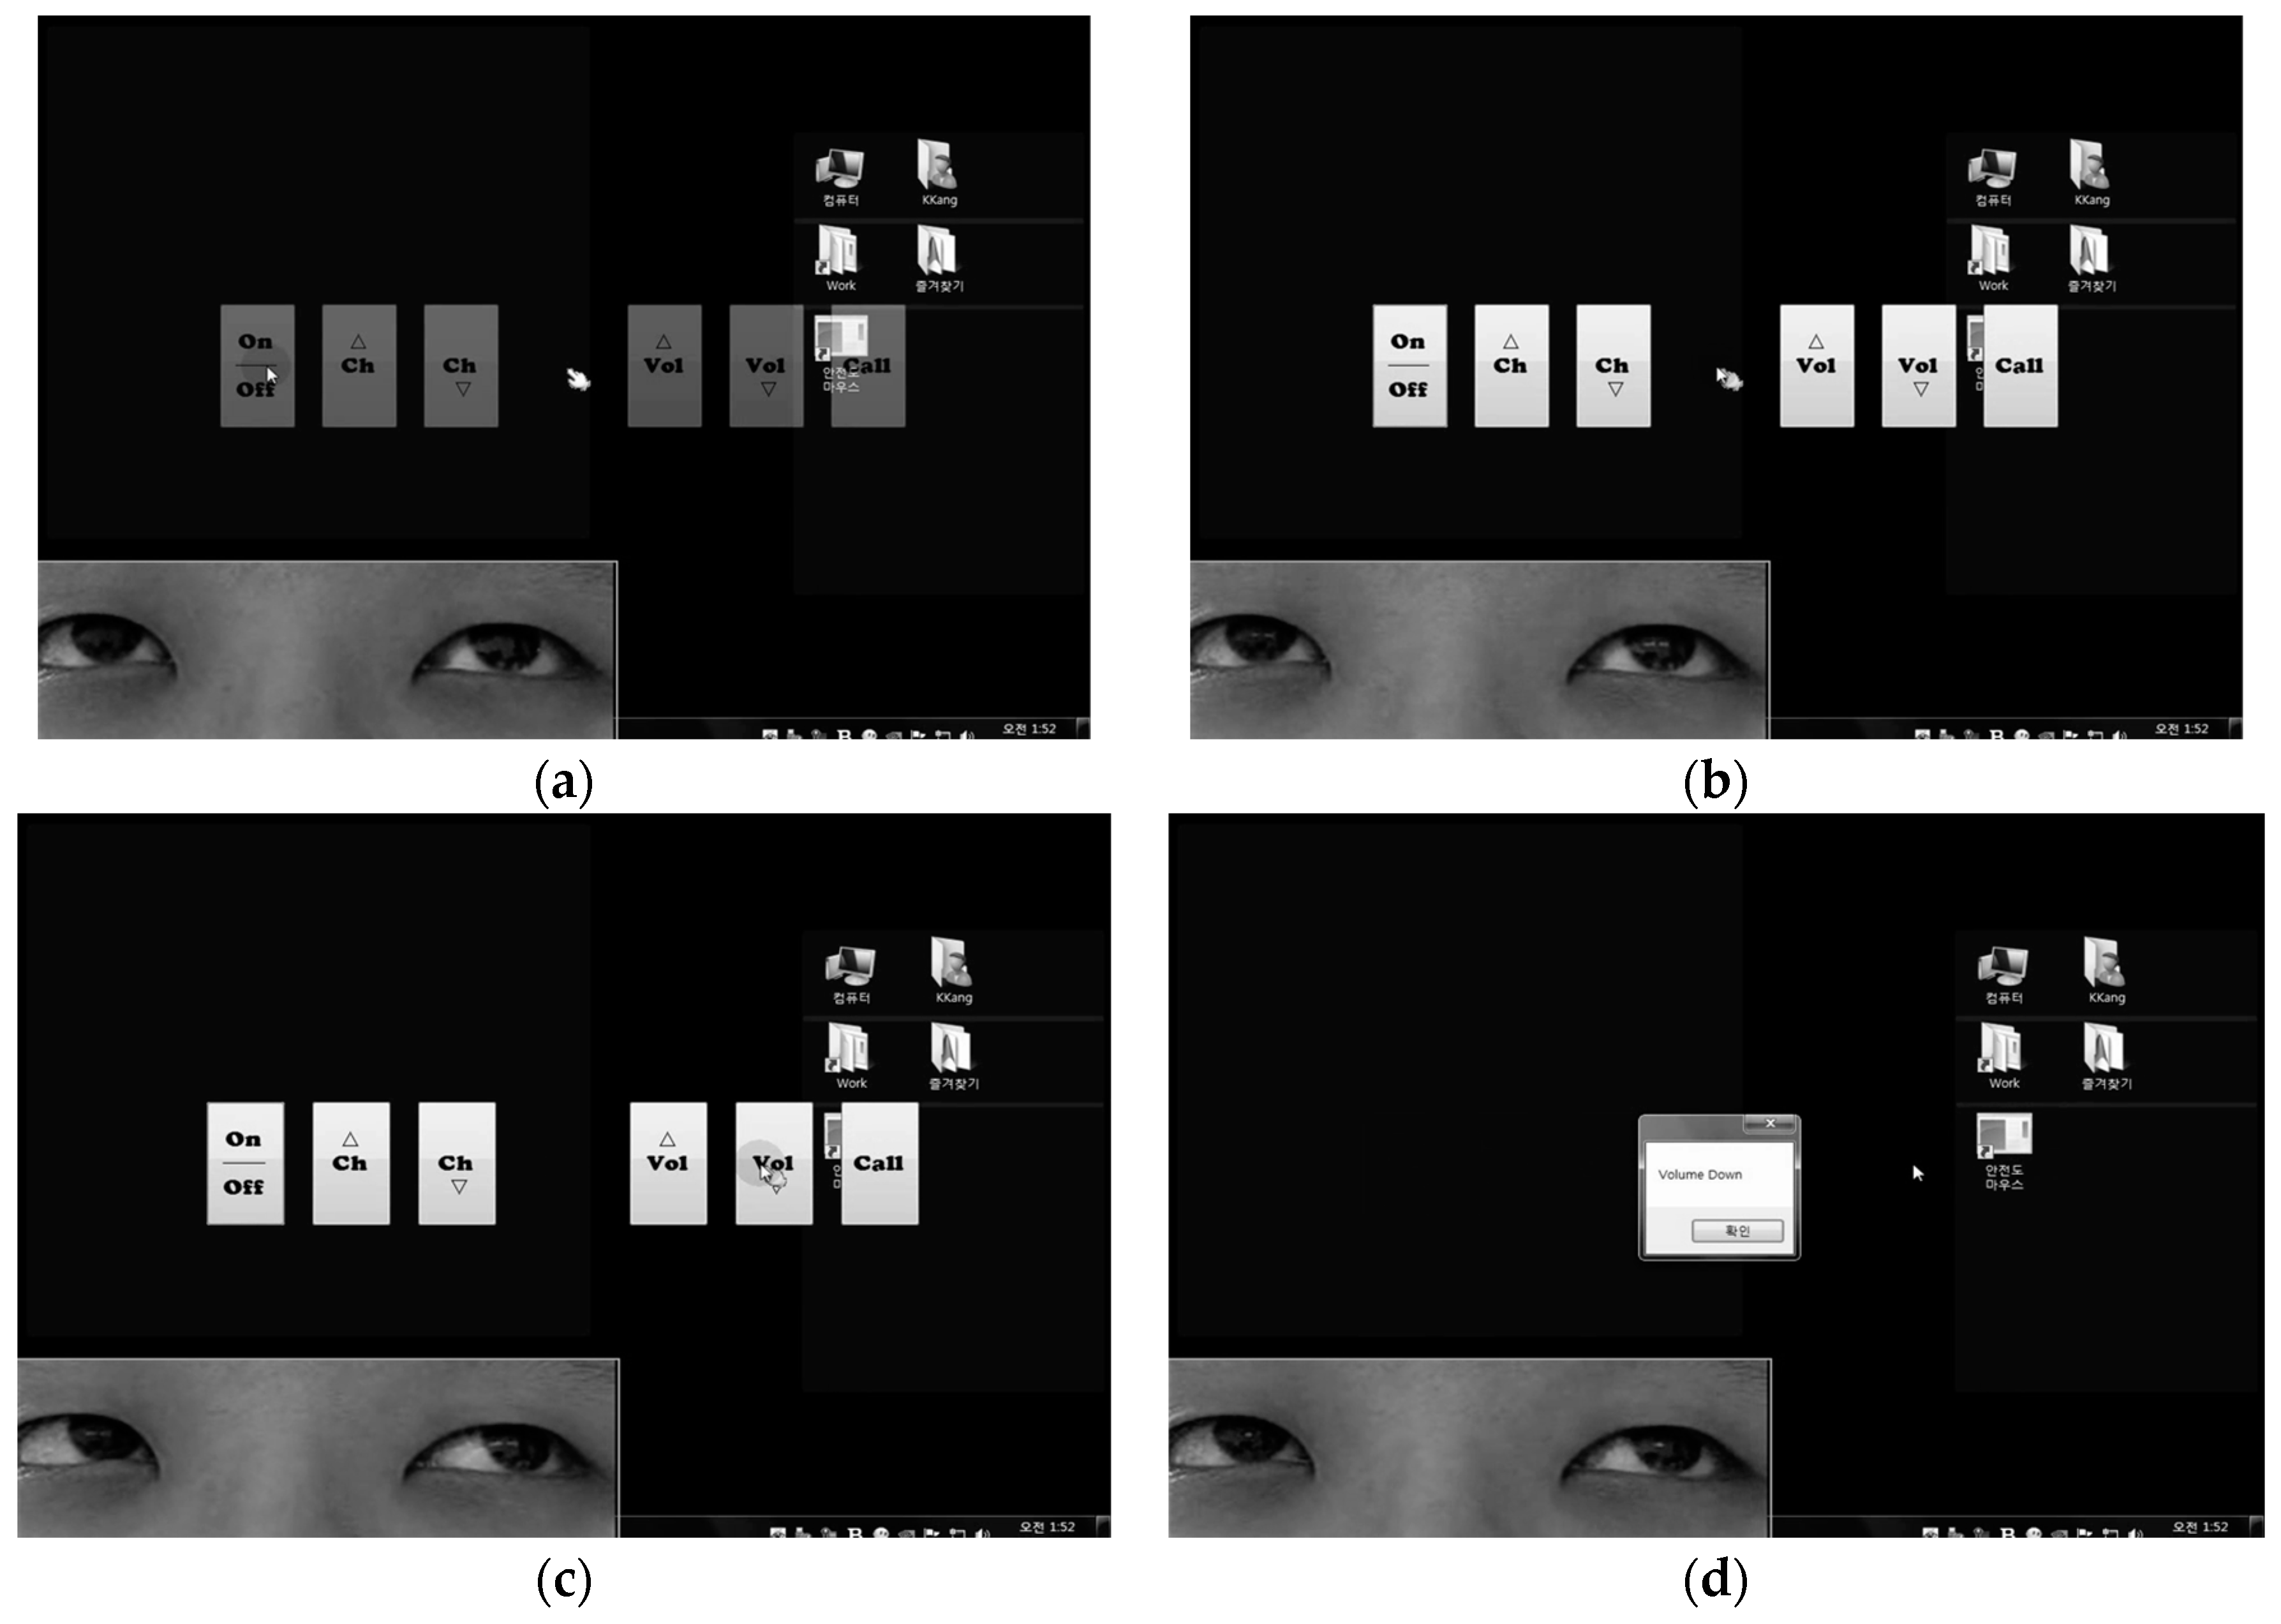
Figure 15 shows an example of a real demonstration of the developed system. The system initially waits until there is a bite action. When temporal muscle movements are detected, the finger-shaped pointer slowly appeared in the center of the screen and then six selection buttons appeared near the pointer as shown in
Figure 15a. After gazing at the central pointer, if the color of the pointer changes to blue, the user can move the pointer to the position of the selection buttons by moving the gaze as shown in
Figure 15b. One can click on the button when the eyeball moves over the desired button as shown in
Figure 15c and release the teeth biting force as shown in
Figure 15d. After all operations are completed by the button click, the pointer and the button that appeared on the screen disappear and the system enters the waiting state until user bites again. This series of operations can run a completed command to the PC or any type of machine including robot or computer through a simple operation. It is similar to the drag-and-drop operation that is similarly used with an existing mouse interface, so a user can adapt this method intuitively. Compare to camera-based HCIs that suffer from high false-positive rate in the idle state because of the unintended ocular movement, proposed system can make start and stop point of our commands and we do not have to worry about error from idle state by adding the EMG signal to EOG Additionally, during the standby state, there is no obstacle to the visual field displayed on the screen and the computational burden is very limited. Therefore, it is possible to execute a desired command through a simple operation for about five seconds without using a conventional mouse.
4. Discussion
As shown in previous experimental results including performance evaluation test and application test for menu-selection command interface for computer, the proposed system showed acceptable performance in terms of accuracy, speed, and usability. Compared to conventional EOG-based HCI, the proposed interface system has a different way in tracking gaze positions. In general, the EOG-based HCI or EOG mouse detects the up, down, left, and right movements or blinking of eyes using pattern recognition algorithms and uses them as commands. In other words, in conventional ways, only a series of discrete commands can be executed, and it cannot recognize variance of gazing positions since it cannot determine how much the eyeball has moved. In general, the performance of a EOG-based mouse system is measured using accuracy, sensitivity, specificity, or precision since it is in the form of pattern recognition for up, down, left, or right movements. However, we cannot use same performance measures since we continue to track the movement of the eyeball, so we used two kinds of performance measures, traction error and required time to operate as shown in the experimental results. The average difference between position of target circle and position from prediction of the proposed system showed only 1.4 cm difference on 51 cm screen. Since we set the diameter of target circle to 3 cm on a 51 cm screen, 1.4 cm is small enough to use for mouse control. The maximum variation of tracking error according to the subjects is less than 0.3 cm, so we can say that the proposed system is not user-specific. In terms of required time to drag-and-drop command, the system showed 1.97 s of average time, indicating an acceptable level as alternative interface method without using hands. The maximum variation of required time according to the subjects is 0.9 s. Compared to the average of required time to command, 0.9 s is not small, but it cannot be considered as a difficult problem since this difference was based on the familiarity of the subject.
To enhance traction accuracy, we need to consider that human eyeball movement is a rotational motion not linear motion. To find the gazing position on the screen, the proposed system was designed based on an approximation that the eyeball movement is a linear motion. In this case, the error will increase as the difference between linear motion and rotational motion becomes larger as the position deviates from the position where the eyeball motion starts. In addition, for wider application to practical system, it is required to solve the dependency problems of screen size and user position. For successful implementation of a developed system on HCI, it is good interface method for a disabled person with quadriplegia to access computer or mobile device including head mount display (HMD). Also, various applications can be considered for the proposed method. For a direct application, as we show the experimental results, it can be used as a hands-free menu selection interface for systems including TV, smart phone, or computer. By combining eyeball position and EMG signal information, various commands set for mobile robot also can be considered. Also, this can be an alternative way to control the wheelchair for disabled person with quadriplegia. As an indirect application of this method, eyeball position data can be stored as life log and it can be applicable in various ways such as monitoring in healthcare, attention assessment tests and test of human attention. Since the proposed system is designed considering the computational complexity for real-time processing, it can be easily implemented on open source electronics platforms including Arduino and Raspberry-compatible modules. Also, proposed system can be merged into various open-source electronics platforms-based applications including game, IoT, automation and robotics and it enhance the ranges of application for proposed system.
5. Conclusions
In this paper, we developed a single channel bio-signal-based HCI system using PLA and SVR. With only two electrodes, a developed bio-signal sensing system can measure and use EOG and EMG signals independently at the same time by frequency division and signal processing. For real-time processing, a modified sliding window PLA algorithm is developed to reduce the signal complexity. To enhance the eye tracking performance, SVR algorithm is applied and it can enhance the generalization capability. A developed HCI system can perform operations similar to dragging and dropping used in a mouse interface in less than 5 s with only eyeball movement and bite action. Compared to conventional EOG-based HCIs that detects the position of eyeball only in 0 and 1 levels, a developed system can continuously track the eyeball position less than 0.2 s. In addition, compared to conventional EOG-based HCIs, the reduced number of electrodes can enhance interface usability.
6. Patents
The patent of Korea, KR-A-101539923, “Bio-signal-based eye tracking system using dual machine learning structure and eye tracking method using same” invented by Gyeong Woo Gang and Tae Seon Kim is partially resulting from the work reported in this manuscript.

