Article

Study on Crash Injury Severity Prediction of Autonomous Vehicles for Different Emergency Decisions Based on Support Vector Machine Model

College of Transportation, Shandong University of Science and Technology, Huangdao District, Qingdao 266590, China
*
Author to whom correspondence should be addressed.
Electronics 2018, 7(12), 381; https://doi.org/10.3390/electronics7120381
Submission received: 24 October 2018 / Revised: 28 November 2018 / Accepted: 29 November 2018 / Published: 3 December 2018

Abstract

:
Motor vehicle crashes remain a leading cause of life and property loss to society. Autonomous vehicles can mitigate the losses by making appropriate emergency decision, and the crash injury severity prediction model is the basis for autonomous vehicles to make decisions in emergency situations. In this paper, based on the support vector machine (SVM) model and NASS/GES crash data, three SVM crash injury severity prediction models (B-SVM, T-SVM, and BT-SVM) corresponding to braking, turning, and braking + turning respectively are established. The vehicle relative speed (REL_SPEED) and the gross vehicle weight rating (GVWR) are introduced into the impact indicators of the prediction models. Secondly, the ordered logit (OL) and back propagation neural network (BPNN) models are established to validate the accuracy of the SVM models. The results show that the SVM models have the best performance than the other two. Next, the impact of REL_SPEED and GVWR on injury severity is analyzed quantitatively by the sensitivity analysis, the results demonstrate that the increase of REL_SPEED and GVWR will make vehicle crash more serious. Finally, the same crash samples under normal road and environmental conditions are input into B-SVM, T-SVM, and BT-SVM respectively, the output results are compared and analyzed. The results show that with other conditions being the same, as the REL_SPEED increased from the low (0–20 mph) to middle (20–45 mph) and then to the high range (45–75 mph), the best emergency decision with the minimum crash injury severity will gradually transition from braking to turning and then to braking + turning.

Graphical Abstract

1. Introduction

Traffic crashes have caused significant loss to society such as life and property loss, traffic congestion, etc. Rear-end crashes are considered to be the most frequently occurring type of traffic crashes in many countries [1]. In the United States, the 2015 crash records showed that rear-end crashes caused by the emergency braking of the frontal vehicles accounted for 27.7% of the total crashes, causing about 13% of serious injuries and fatalities [2]. One potentially important factor in aggravating crash severity is the inappropriate decisions made by drivers due to the inadequate surveillance and risk perception, lack of responsiveness, and misjudgment [3].

1.1. Research Status of Autonomous Vehicles

In recent years, in order to reduce crash casualties and alleviate traffic congestion, autonomous vehicles have attracted worldwide attention. The autonomous vehicle is an advanced stage of intelligent vehicle development. It can comprehensively utilize its ability of perception, decision-making, and manipulation to replace human drivers and independently execute vehicle driving tasks in specific environments. Because road environments and weather conditions are complicated and changeable, the crucial task of realizing autonomous driving is to empower vehicles with a high degree of artificial intelligence, then the autonomous vehicles can make real-time judgment on the driving status and environment changes in all regions and weather conditions so as to ensure vehicle safe driving [4].
At present, the research on autonomous vehicles is mostly focused on safety control [5], and the crash injury severity prediction for decision-making under emergency situation are seldom studied. In this paper, the emergency situation refers to the situation where the crash is unavoidable. Under this situation, the experienced drivers usually need to first observe and judge the current scene, then rely on their own driving experience to weigh the risk of the crash target, and make an emergency decision with the minimum crash injury severity, such as braking, turning, or braking + turning. Due to the fact that drivers’ driving experience is characterized by the driving data of regular vehicles, in order to adapt to complex traffic environment and reduce crash casualties, autonomous vehicles must be trained by these data based on machine learning to establish the crash injury severity prediction model corresponding to each emergency decision. In this way, autonomous vehicles can weigh the hazards of various emergency decisions in advance, like drivers, in order to make emergency decisions with the minimum injury severity [6].

1.2. Research Status of Crash Injury Severity Prediction Model

1.2.1. Statistical Models

At present, most studies used driving characteristics (age, gender), accident characteristics (time, date, weather, light conditions), vehicle characteristics (vehicle type, limit speed), road characteristics (curvature, slope, road adhesion coefficient, number of lanes), traffic control equipment, etc. as the impact indicators of crash injury severity, and based on the statistical models to model crash injury severity prediction [7,8,9,10,11,12]. Traditionally, the most used basic statistical models are binary logit/probit models [9,10] and multinomial logit/probit model [11,12]. In order to improve the predictive performance of these models, some studies considered the ordinal nature of injury severity variables and used the ordered logit/probit models instead of traditional models [13,14,15]. There are also some studies that take the heterogeneity and intrinsic relevance of the crash data into account, and develop more advanced statistical models. For example, Lee et al. [16] considered the heterogeneity of explanatory variables, and developed the heteroscedastic ordered logit (HOL) model for severity analysis of single- and multi-vehicle crash. Shaheed et al. [17] considered the intrinsic relevance in injury severity, and developed fully Bayesian hierarchical multinomial logit (BHML) model to correctly analyze the factors affecting occupant injury severity in winter seasons. Most of the above models assumed that the crash data had a certain distribution, and used the linear function to fit the relationship between dependent and explanatory variables. However, a common shortcoming of the above statistical models is that once the assumption is overturned, it will make an error in the estimation and prediction.

1.2.2. Machine Learning Model and Data Mining Techniques

In order to overcome the shortcoming of statistical models, some studies applied machine learning algorithms and data mining techniques to predict crash injury severity. For example, Kashani et al. [18] used classification and regression trees (CART) to analyze traffic crash data of the main two-lane, two-way rural roads of Iran, the results showed that CART could easily find important variables and improve the prediction accuracy of the fatality. Mujalli et al. [19] proposed a new Bayesian networks (BN) model to model the crash injury severity prediction, the results showed that the proposed BN model could simplify the prediction structure of the model without reducing the prediction performance. Zeng et al. [20] used the neural network model to predict crash injury severity combining with a convex combination (CC) algorithm, the results showed that the fitting and forecasting effect of the neural network model were better than that of OL model. Delen et al. [21] analyzed and compared the prediction performance of artificial neural network (ANN), support vector machine (SVM), decision trees (DT), and logistic regression models on crash injury severity using the crash data of the national automotive sampling system/general estimation system (NASS/GES), the results showed that SVM model had the best prediction performance with the highest accuracy.

1.3. Impact of Relative Speed and Vehicle Weight on the Crash Injury Severity

Although the above studies have analyzed the important impact indicators and their influencing mechanisms on the crash injury severity, the relative speed between two crash vehicles (REL_SPEED) and the gross vehicle weight rating (GVWR) on crash injury severity have been seldom taken into account. Some empirical studies have shown that the REL_SPEED and GVWR have a great impact on the crash injury severity [22,23,24,25]. Tolouei et al. [22] analyzed the relationship between the crash injury severity and the mass ratio of crash vehicles by using the relevant theory of crash mechanics, the results showed that under certain conditions, the increase of vehicle mass would make crash accidents more serious. Jurewicz et al. [23] analyzed the relationship between the relative speed of two crash vehicles and the crash injury severity using the theory of crash dynamics, the results showed that in rear end crashes, the increase of the relative speed would increase the serious injury or death rate. The National Transportation Safety Board developed the range of vehicle speed variation for each crash injury severity level using a logical parameter of assessing the probability of injury [24], and Xu [25] used the conservation law of kinetic energy to establish the relationship between the relative speed of two vehicles before the crash and the speed variation. Under certain emergency scenarios, combined with these two studies [24,25], the correlation between the relative speed and the crash injury severity would be obtained indirectly. It can be seen that the REL_SPEED and GVWR play important roles in the crash injury severity prediction, so they need to be analyzed in depth in the process of establishing a prediction model.

1.4. Objectives of This Study

The present study intends to take the emergency situation of two-vehicle crash caused by emergency braking of the frontal vehicle as the research object, and studies the crash injury severity under three emergency decisions based on the NASS/GES data, including braking, turning, and braking + turning. By introducing the REL_SPEED and the GVWR into the impact indicators of crash injury severity, the support vector machine (SVM) is used to establish crash injury severity prediction models for autonomous vehicles. Specifically, this study makes the following contributions:
(1)
A detailed description of the emergency decision-making process for autonomous vehicles under emergency situation is conducted;
(2)
Based on the NASS/GES crash sample data and SVM model, the braking-SVM (B-SVM), turning-SVM (T-SVM), and braking + turning-SVM (BT-SVM) injury severity prediction model corresponding to braking, turning, and braking + turning are established for autonomous vehicles through the parameter optimization and kernel function selection process of particle swarm optimization (PSO). Then the ordered logit (OL) and back propagation neural network (BPNN) models are established to verify the efficiency of SVM in prediction accuracy;
(3)
Based on the B-SVM, T-SVM, and BT-SVM model, a sensitivity analysis is conducted to quantify the impact of REL_SPEED and GVWR on the crash injury severity;
(4)
Based on the same crash sample, statistically analyze and compare the ratios of crash injury severity output from B-SVM, T-SVM, and BT-SVM, and provide reference of emergency decision-making for autonomous vehicles in emergencies;
(5)
The research contents and conclusions are summarized, and the future research work is prospected.

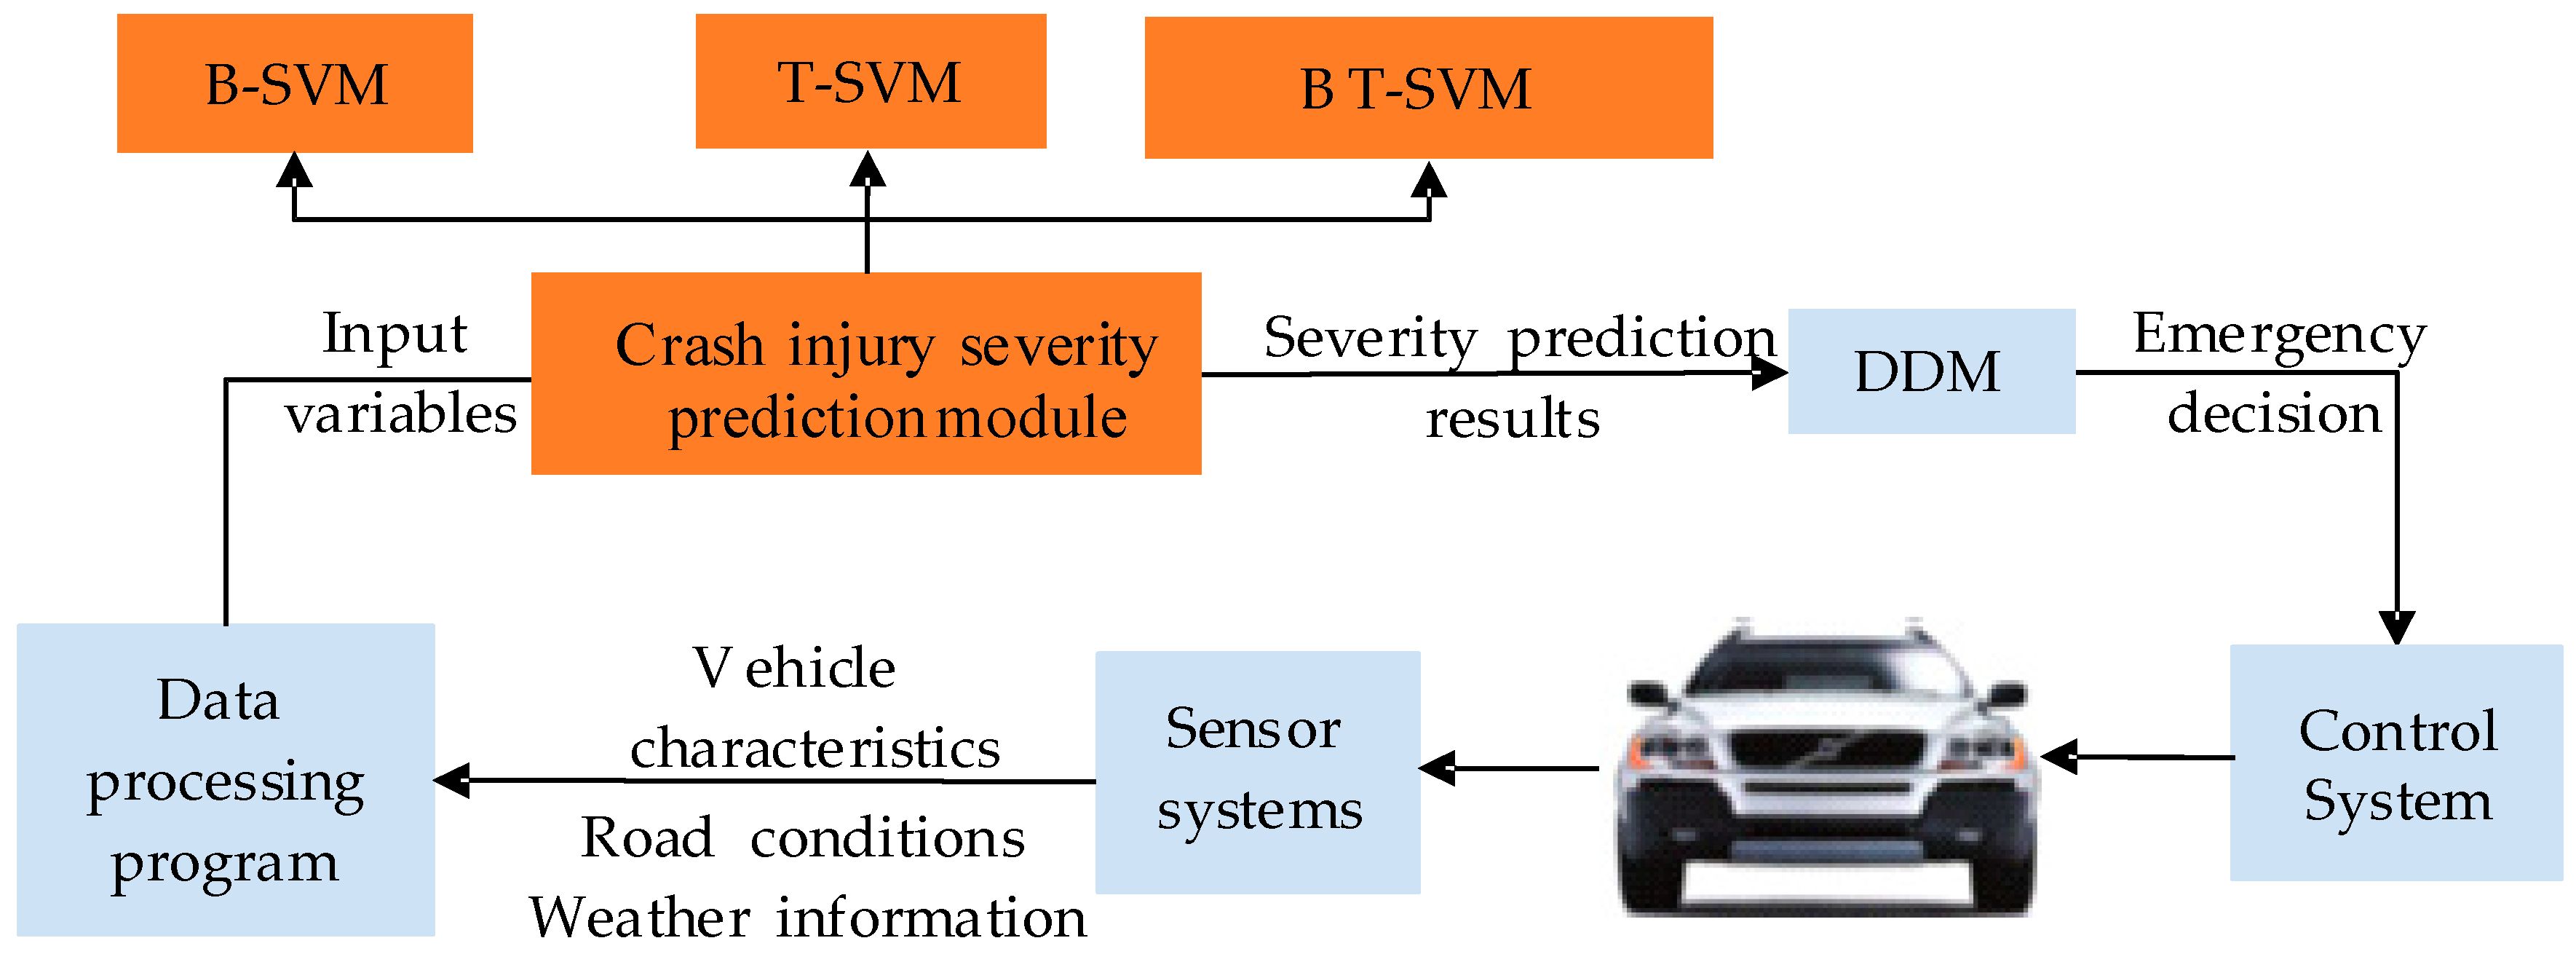
2. Emergency Decision-Making Process of Autonomous Vehicles under Emergency Situations

The emergency situations studied in this paper refer to the situations where the two-vehicle crash cannot be avoided when the frontal vehicle is in emergency braking, and we assumed that there are no conflicting vehicles in the adjacent lanes. The emergency decision-making process of autonomous vehicles under emergency situations is shown in Figure 1. Firstly, the autonomous vehicle collects the environment information using the sensor device, and inputs them into the data processing program for information selection, fusion and extraction, to obtain the input variables required by the B-SVM, T-SVM, and BT-SVM models. Then, the three models output their corresponding crash injury severity for decision-making mechanism (DDM), by comparing them, DDM outputs the emergency decision instruction with the minimum injury severity to the control system for operate the corresponding actions. The scenes of vehicle braking, turning, and braking + turning in emergency situation are showed in Figure 2.
During the whole process of information collection, transmission, processing, and execution, the crash injury severity prediction module plays an important role. It is a thinking and analysis device of the autonomous vehicles’ central system and is related to the loss of life and property caused by traffic accidents. Therefore, the crash injury severity prediction model is an urgent need to ensure autonomous vehicles to run on the road safely. The following will use the historical accident data to model the crash injury severity prediction for different emergency decisions.

3. Data Preparation

3.1. Crash Data Description

In this study, the vehicle crash data come from the 2012–2015 GES data set in the NASS database system established by the Transportation Department of the United States [2], which has a certain authority, and is a nationally representative sample of police reported motor vehicle crashes of all types, from minor to fatal. The system was created to identify traffic safety problems area, estimate how many motor vehicle crashes of different kinds take place, and what happens when they occur. In addition, the quality of these accident data are further checked through computer processing and data supervisors, they are often used to answer motor vehicle safety questions from congress, lawyers, doctors, students, researchers, and the general public. For the sufficient reliability of GES data set, many experts in the field of vehicle active safety used them for vehicle crash analysis and prediction [21,26].
The data set is mainly composed of three sub-data sets, namely accident, vehicle, and crash participant data set [21]. The accident data set includes road conditions, environmental conditions and other accident-related features. The vehicle data set includes a large number of characteristic variables of the involved vehicles—such as the vehicle speed before the crash, the attempted avoidance decision, etc.—and the crash participant data set includes a large number of characteristic variables of the participation members (drivers, passengers, pedestrians, cyclists, etc.), such as crash injury severity, age, and gender. Each crash record contained in the three sub-data sets is matched by a uniform crash number (CASENUM). The maximum injury severity involved in a crash is the dependent variable of the prediction models in this study. In the GES data set, the maximum injury severity is divided into five types: no apparent injury, possible injury, suspected minor injury, suspected serious injury and fatal.

3.2. Data Processing

3.2.1. Data Screening

(1) This paper only studies the crash mechanism of two vehicles in the same lane in urban road environment, and the autonomous vehicle is a standard passenger vehicle. Therefore, from the GES data set, we only extract the two-vehicle crash data of the urban road environment caused by the emergency braking made by the frontal vehicle, and the rear vehicle is a standard passenger vehicle.
(2) In order to ensure the accuracy of the later modeling, crash records with missing or wrong data will be eliminated to obtain complete and accurate samples.
(3) Removing some variables in the GES data set that are independent of the crash injury severity, such as driver’s zip code (DR_ZIP), vehicle identification number (VIN).
(4) In this paper, the autonomous vehicle has no driver and obeys the traffic rules, so we remove the crash records caused by driver’s faults in the rear vehicle, such as drunken driving, drug driving, violating traffic rules, etc.
After the above data screening, a total of 15,164 crash records are obtained, of which 58.7% correspond to emergency braking decision, 18.4% to turning, and 22.9% to braking + turning. In addition, 14 variables are selected as the impact indicators of the crash injury severity prediction models, among them, REL_SPEED refers to the relative speed of vehicles at the moment before the crash, their related descriptions are showed in Table 1.

3.2.2. Input and Output Variables of the Crash Injury Severity Prediction Models

(1) Input Variables
As seen in Table 1, there are 14 impact indicators for each sample in this paper. Excessive impact indicator characteristics will affect the search of impact rules, and sometimes several impact indicators can only reflect certain aspect characteristics of the data, which can easily cause a high degree of overlap between indicator characteristics and then cause data analysis obstacles. In order to reduce the computational complexity and improve forecasting efficiency of the crash injury severity prediction models, the Principal Component Analysis (PCA) method is used to reduce the dimensions of the impact indicators, so as to obtain a small amount of irrelevant new indicators on the basis of ensuring the integrity of the original information as much as possible [27,28]. The new indicators are used as the input variables to the prediction models.
We randomly selected 1000 groups of samples for PCA, and the calculated results of PCA for each principal component are shown in Table 2. The cumulative variance contribution rate of the first six principal components has reached 89.7% (>85%), and their eigenvalues is greater than one. Therefore, we use the first six principal components instead of the original indicators for each sample.
(2) Output Variables
In the crash data samples obtained above, the samples corresponding to no apparent injury, possible injury, suspected minor injury, suspected serious injury and fatal, account for 54.2, 16.6, 16.8, 7.5, and 4.9% respectively. To balance the proportion of each injury severity, we classify them into three groups as the output variables of the prediction models, namely, no injury (no apparent injury), non-incapacitating injury (slight injury, suspected minor injury), incapacitating/fatal (suspended serious injury, fatal), as seen in Table 3.

4. Methodology

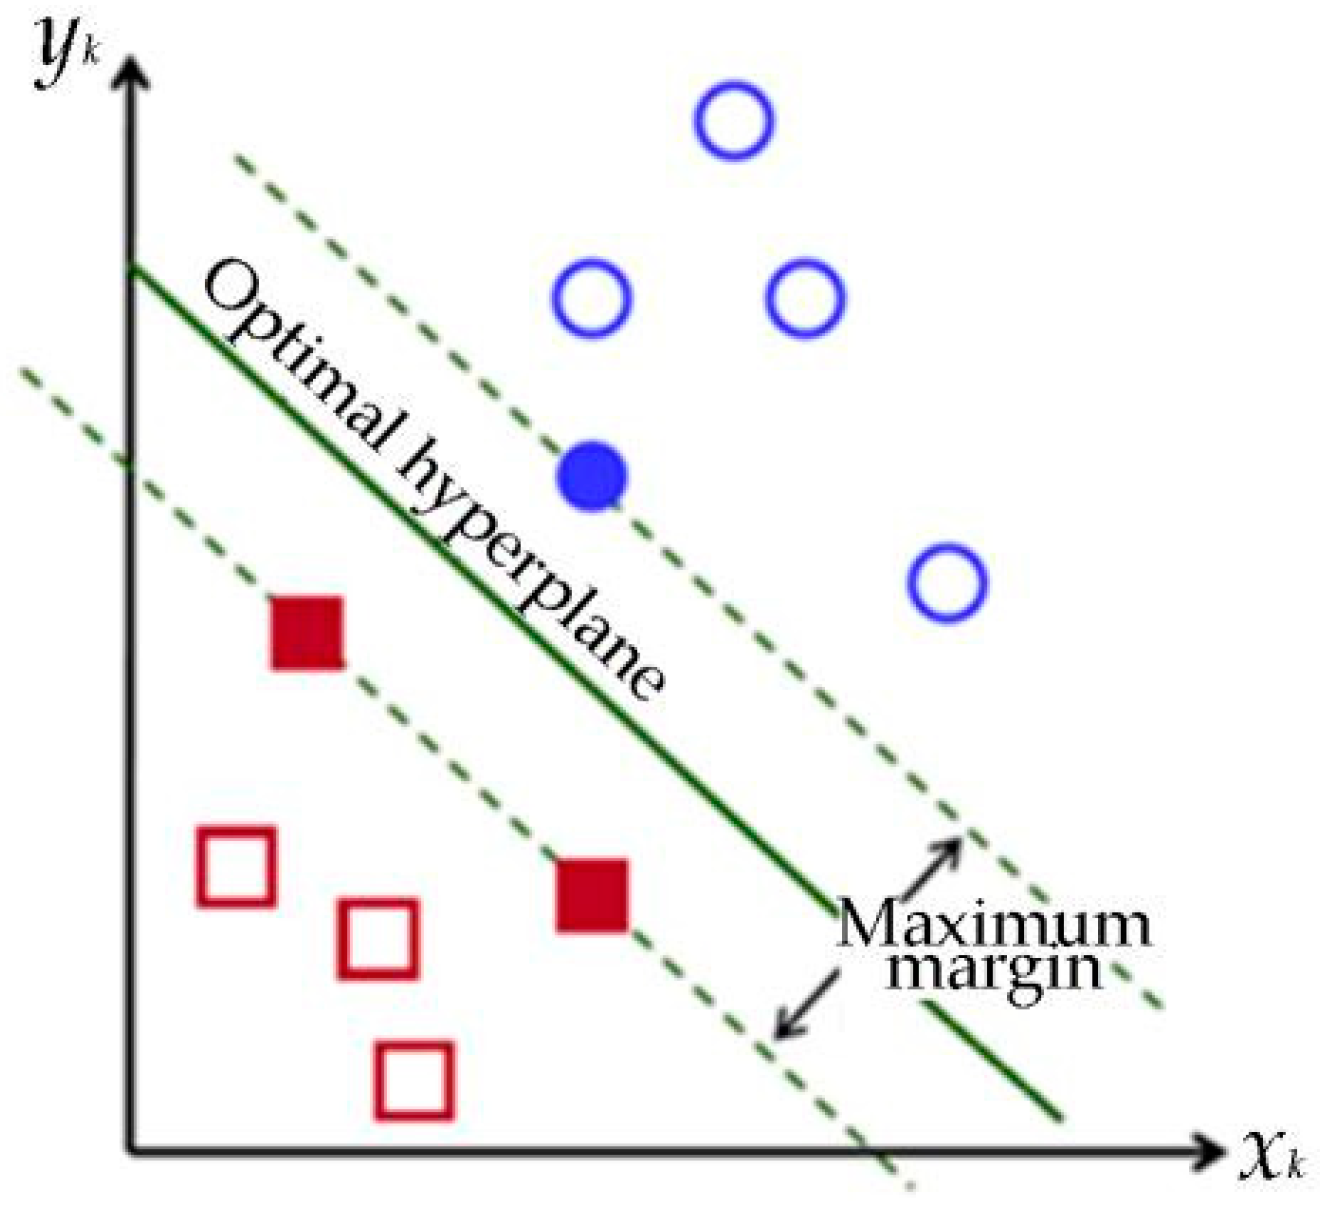
4.1. Support Vector Machine Model

Support vector machine (SVM) is a machine learning method based on statistical learning theory, which was put forward by C. Cortes and H. Drucker [29]. It has the characteristics of strong learning ability for small samples and good model generalization performance [30]. In recent years, SVM has achieved a breakthrough in theoretical research and algorithm implementation, and has been successfully applied to classification, function approximation, and time series prediction.
SVM was first used to solve the binary classification problem of linear discrete data. As shown in Figure 3, the basic principle is to find an optimal hyperplane that satisfies the data classification requirements, and obtain the maximum margin between two sample points while ensuring the classification accuracy.
In the case of linear classification, suppose the training sample is S V = { ( x 1 , y 1 ) , ( x 2 , y 2 ) , , ( x m , y m ) } , x R d , y k { 1 , 1 } , k = 1 , 2 , , m , among which x k is the input variable, y k represent the crash injury severity, m is the number of training samples, and R d is a d-dimensional real number space.
SVM linear classification means that there exists a hyperplane ω · x + b = 0 that can correctly classify all samples, where ω is an adjustable weight vector and b is the bias. The hyperplane needs to meet
y k ( ω · x k + b ) 1 , k = 1 , 2 , , m
Calculate the classification interval as
m i n { x k | y k = 1 } ω · x k + b ω m a x { x k | y k = 1 } ω · x k + b ω = 2 ω
The optimal hyperplane requires that the classification interval be maximized, that is, requires that the ω is minimized, then the optimal hyperplane problem can be expressed as a minimum function that satisfies the constraint of (1)
φ ( ω ) = 1 2 ω 2 = 1 2 ( ω · ω )
Using the Lagrangian duality transformation and choosing the appropriate penalty function c , the optimal hyperplane problem can be transformed into solving the maximum of the quadratic programming problem, i.e.,
ω ( a ) = k = 1 m a k 1 2 k , l = 1 m a k a l y k y l ( x k · x l ) s . t . { y k [ ( ω · x k ) + b ] 1 0 k = 1 m y k a k = 0 0 a k c , k = 1 , , m
where a k is the lagrange coefficient.
Finally, the optimal classification function in the case of linear classification can be obtained
f ( x ) = sgn { ω · x + b } = sgn { k = 1 m a k y k ( x k · x ) + b }
where a k , b are the parameters to determine the optimal hyperplane, ( x k · x ) is the dot product of two vectors.
When dealing with non-linear problems, it is necessary to map the input variables into the high-dimensional space and construct the optimal hyperplane in the high-dimensional space. At this time, we need to select appropriate kernel functions K ( x , x k ) to achieve linear classification of nonlinear problems. Then, the objective function of the optimal hyperplane problem becomes
ω ( a ) = k = 1 m a k 1 2 k , l = 1 m a k a l y k y l K ( x k , x l )
Then get the optimal classification function in the case of nonlinear classification
f ( x ) = sgn { k = 1 m a k y k K ( x , x k ) + b }
There are three types of commonly used kernel functions:
(1)
Polynomial kernel function: K ( x , x k ) = ( γ ( x · x k ) + 1 ) q
(2)
Radial basis kernel (RBF) function: K ( x , x k ) = e x p ( x x k 2 σ 2 )
(3)
Sigmoid kernel function: K ( x , x k ) = t a n ( v ( x · x k ) + c )
The crash injury severity prediction model constructed in this paper is a three-classification problem (no injury, non-incapacitating, incapacitating/fatal), i.e., y k { 1 , 0 , 1 } . Since the above traditional SVM model only considers the problem of binary classification, so the SVM model needs to be extended to build the multiple SVM classifiers. The multi-classifier construction of Libsvm (Libsvm is a fast and effective SVM software package) is implemented by combining multiple binary classifiers [31]. In the training, the three types of crash injury severity are classified into three binary combinations—including no injury and non-incapacitating, no injury and incapacitating/fatal, non-incapacitating and incapacitating/fatal—as shown in Figure 4. After training, three binary-class SVM training models are obtained. In the testing, these three SVM training models are used to classify each sample, and then the category with the largest number of classification results is selected as the sample category.
Since the purpose of predicting crash severity for autonomous vehicles is to make the emergency decision with the minimum injury severity, it is necessary to establish crash injury severity prediction models corresponding to different decisions (braking, turning, and braking + turning), so as to provide a comparative basis for autonomous vehicles in emergency situations. The three models are referred as B-SVM, T-SVM, and BT-SVM, respectively.
In this paper, the sample set corresponding to each emergency decision is selected from the above crash records, and 70% samples are randomly selected from each sample set for training, and the remaining 30% for testing. In order to obtain the optimal B-SVM, T-SVM, and BT-SVM, the B-SVM, T-SVM, and BT-SVM with different kernel functions are trained and compared using the corresponding training sample set.

4.2. Process of Parameter Optimization and Kernel Function Selection

After input the training samples into the SVM models, we use the particle swarm optimization (PSO) algorithm to search for the optimal parameters. PSO is a parallel algorithm, which has been applied in many fields for its advantages of ease of execution, high accuracy, and fast convergence [32]. Its research method is to assume that the particles in the particle swarm are all individuals with no mass and volume. Relying on the independent particle’s adaptability and learning ability to the environment, the flight results of the individual particle and particle swarm are combined to adjust the particle’s own position and flight speed to achieve optimal search [33]. The optimal parameter selection process of SVMs based on the PSO algorithm is shown in the Figure 5 below. The classification accuracy is taken as the fitness function and the main parameters of PSO are set as follows: the population size is N = 50 , the inertial weight is μ = 0.9 , the particle acceleration constant is C 1 = 1.4 , C 2 = 1.6 , and the number of iterations is 500.

5. Results and Discussion

5.1. Estimation of SVM Crash Injury Severity Prediction Models

After several iterations, the parameter optimization results of B-SVM, T-SVM, and BT-SVM are obtained, as shown in the following Figure 6 and Table 4. It can be seen from the Figure 4 that the training accuracy of using RBF kernel function is the highest in the B-SVM, T-SVM, and BT-SVM, which are 93.176, 87.111, and 88.442% respectively, followed by the sigmoid kernel function with the training accuracy for 92.894, 83.338, and 83.225% respectively, and the polynomial kernel function with the training accuracy for 92.296, 79.275, and 83.113% respectively. The iterating numbers of the SVM models with RBF kernel function to achieve the highest training accuracy are less than that of the other kernel functions, which are 94, 148, and 132 for B-SVM, T-SVM, and BT-SVM respectively. The results show that the SVM models with RBF kernel function have the best performance on classification accuracy, which can be explained by the fact that the number of coefficients of RBF kernel function is less, and it is not limited by the spatial dimension and sample size.
Therefore, the RBF kernel function is selected as the kernel function of B-SVM, T-SVM, and BT-SVM model. The optimal parameters obtained by the training are shown in the Table 5.

5.2. Performance of SVM Models

This paper trains the most widely used statistical algorithm, OL algorithm, and the machine learning algorithm, BPNN with the same training samples to establish OL and BPNN crash injury severity prediction models, then compares their prediction accuracy with the above established SVM models to verify the superior performance of SVM in the crash injury severity prediction.

5.2.1. Establishment of OL Models and BPNN Models

(1) Establishment of OL Models
OL model is extended by the binary logit model, which provides a common and convenient framework for analyzing such data in which the dependent variable is both discrete and ordered. OL models only carry out regression analysis for significant variables. In this paper, we use the combined stepwise (CS) to research the significant variables affecting the injury severity for OL model. Based on all the candidate variables, CS removes the independent variables step by step which does not meet the required significant level, and then outputs the significant variables for the OL model. We make the significance level 0.05, when p < 0.05, the independent variable is retained. The OL prediction models corresponding to braking, turning, and braking + turning decision are recorded as B-OL, T-OL, and BT-OL, respectively. The parameter estimation results of each OL model are shown in the Table 6 below.
(2) Establishment of BPNN Models
BPNN is one of the most widely used learning algorithm, which is a multilayer feed forward neural network trained in accordance with the error back propagation algorithm. In order to full verify the performance of SVM model, the BPNN is established to compare SVM model on the performance of predicting the crash injury severity in this paper. Three BPNN models corresponding to braking, turning, and braking + turning decision are recorded as B-BPNN, T-BPNN, and BT-BPNN, which consist of an input layer, five hidden layers, and an output layer, as seen in Figure 7. The six principal components obtained above are the parameters of input layer, and the corresponding crash injury severity is set as the parameter of output layer. The number of nodes in the hidden layers is determined through checking the prediction accuracy of BPNN with different number nodes. h n l 1 refers to the output of the nth node in the (l − 1)th hidden layer. After setting up the relevant parameters, input the same 75% training samples into three BPNN models respectively for iterative training. When the iterative numbers of B-BPNN, T-BPNN, and BT-BPNN model arrived at 84, 152, 111, respectively, the error values of the three neural networks all converge to the target values, as seen in Figure 8. Then B-BPNN, T-BPNN, and BT-BPNN prediction model are obtained.

5.2.2. Performance Comparison of SVM, OL, and BPNN Models

We input the 25% test samples into the SVM models with RBF kernel function, OL and BPNN models to verify the performance of SVM model on the prediction accuracy. The prediction accuracy is the ratio of the accurate classification number in the samples. The prediction accuracy of the SVM, OL, and BPNN models is shown in the Table 7, Table 8 and Table 9 below.
It can be seen from the above Table 7, Table 8 and Table 9 that the classification performance of SVM model is the best, with the 93.176, 87.111, and 88.442% accuracy for B-SVM, T-SVM, and BT-SVM respectively in the training, and with 88.001, 84.712, and 85.229% accuracy in the testing, followed by the BPNN and OL models. This would be attributed to the fact that SVM can map high-dimensional data using the RBF kernel function, while the traditional statistical model has poor prediction performance with the high-dimensional data.
Also, the results show that the classification accuracy for no injury is the highest in SVM, BPNN, and OL models in the training and testing, and then followed by non-incapacitating and incapacitating/fatal, which can be explained by the fact that the probability of no injury caused by crash accident is higher than that of non-incapacitating and incapacitating/fatal.
For the three decisions, the prediction effect of the crash injury severity prediction model corresponding to the turning decision is lower than that of the other decisions. It reveals that the crash characteristic significance that makes the vehicle take turning avoidance decision are lower than that of braking and the braking + turning.

5.3. Sensitive Analysis of REL_SPEED and GVWR on the Crash Injury Severity

The previous literature has shown that the REL_SPEED and GVWR are important impact indicators of the crash injury severity, and the two variables have been selected as significant variables in the parameters estimation of OL models. So how does the REL_SPEED and GVWR affect the crash injury severity? In this paper, we quantitatively evaluate the effects of REL_SPEED and GVWR on crash injury severity by analyzing the sensitivity of B-SVM, T-SVM, and BT-SVM to the changes in REL_SPEED and GVWR, as follows:
(1)
Firstly, for all the crash samples with GVWR in low range (less than 10,000 lbs) and the REL_SPEED of 0 to 20 mph, we reset other impact indicators as the standard values i.e., ( l 3 , l 4 , , l 14 ) = ( 0 , 0 , , 0 7 , 1 , 0 , , 0 4 ) (considered as the normal road and environmental condition) and then input them into B-SVM, T-SVM, and BT-SVM model respectively, and calculate the ratio of each crash injury severity output from each SVM model at different REL_SPEEDs.
(2)
Then, based on the samples with the REL_SPEED of 20 mph, control other impact indicators unchanged, we gradually increase the REL_SPEED with an increase unit of 2.5 mph and the maximum limit of 75 mph. Every time the REL_SPEED changes, a new set of crash samples is obtained and input into each SVM model. From the output of each SVM model, the ratio of each crash injury severity corresponding to the REL_SPEED is calculated. In this way, we can get the trend that the ratio of each crash injury severity varies with the REL_SPEED when GVWR is in the low range.
(3)
Finally, based on the above obtained crash samples with GVWR in the low range and the REL_SPEED of 0 to 75 mph, change the GVWR from low range to middle (10,001~26,000 lbs), high (more than 26,001 lbs) range, respectively. By calculating the ratio of each crash injury severity output from B-SVM, T-SVM, and BT-SVM model respectively, we can get the trend that the ratio of each crash injury severity varies with the REL_SPEED when GVWR is in the low, middle, and high range, respectively.
After the operations and data statistics, the quantitative effects of the REL_SPEED and GVWR on the crash injury severity with the B-SVM, T-SVM, and BT-SVM model are shown respectively in the Figure 9 below.
As can be seen from the above Figure 7, in the B-SVM, T-SVM, and BT-SVM model, each injury severity ratio has the similar changing trend when the GVWR is in different ranges. Take the B-SVM model at the low GVWR range as an example.
(1)
When the REL_SPEED is in the low range (0–20 mph), the no injury ratio decreases rapidly, and the non-incapacitating ratio increases rapidly, while the ratio of incapacitating/fatal has no significance change. This phenomenon indicates that in the low REL_SPEED range, with the increase of the REL_SPEED, most of the decreased no injury accidents is converted to non-incapacitating accidents.
(2)
When the REL_SPEED is in the middle range (20–45 mph), the increasing rate of the non-incapacitating ratio decreases gradually, while the increasing rate of the incapacitating/fatal ratio increases gradually, which indicates that in the middle REL_SPEED range, the conversion from the decreased no injury accidents to incapacitating/fatal accidents is increasing gradually, and the conversion from the decreased no injury accidents to the non-incapacitating accidents is decreasing gradually.
(3)
When the REL_SPEED is in the high range (45–75 mph), the no injury ratio tends to 0 gradually, and the non-incapacitating ratio decreases rapidly, while the ratio of incapacitating/fatal increases rapidly, which reveals that in the high REL_SPEED range, most of the increased incapacitating/fatal accidents are converted from the decreased non-incapacitating accidents.
(4)
The results show that, with the same other conditions, the consequence of vehicle crash will become more serious as the REL_SPEED increases.
In addition, the figures also show that with the three SVM models, when GVWR changes from the low range to the middle and high range, the no-injury ratio decreases to a greater extent, and the incapacitating/fatal ratio increases to a greater extent, which indicates that with the same other conditions, the increase of GVWR will increase the vehicle crash severity.

5.4. Comparison of the Crash Injury Severity under Various Emergency Decisions

In emergency situation, the autonomous vehicle must first compare the crash injury severity by making each emergency decision, and then make the decision with the minimum crash injury severity. Therefore, it is necessary to make a comparative analysis of the crash injury severity corresponding to each emergency decision and mine the decision-making rules in different emergency conditions from the driving data of regular vehicle.
In this paper, we take the REL_SPEED and GVWR as examples, maintain the other impact indicators to take standard values ( l 3 , l 4 , , l 14 ) = ( 0 , 0 , , 0 7 , 1 , 0 , , 0 4 ) , and respectively change REL_SPEED from 0 to 75 mph and GVWR from the low to the high range gradually, to compare and analyze the changing trend of the output of B-SVM, T-SVM, and BT-SVM with the change of REL_SPEED and GVWR, respectively. The results are as shown in Figure 10. In fact, the results of these figures are the same as those in the previous section. However, the line combinations in each figure are different in the two section, which have different exploring purposes.
As can be seen from the Figure 10, when the GVWR is in the low range, in the low REL_SPEED range (0–20 mph), the ratio of each crash injury severity is basically the same in the output of the three SVM models, which shows that the crash injury severity caused by making three emergency decisions is the same in the case of an emergency. In the middle REL_SPEED range (20–45 mph), there is no significant difference in the ratio of each crash injury severity for the output of T-SVM and BT-SVM models, but they output a lower ratio of non-incapacitating and incapacitating/fatal than B-SVM, and a higher ratio of no injury than B-SVM, this means that compared with the braking decision, making turning and braking + turning can reduce the crash injury severity and have the same contribution effect. In the high REL_SPEED range (45–75 mph), among the three SVM models, the BT-SVM model output the highest no injury ratio, and the lowest non-incapacitating and incapacitating/fatal ratio, which indicates that under this situation, to reduce the crash injury severity, autonomous vehicles need to make braking and turning decisions simultaneously.
When the GVWR changes from the low range to middle, high range in turn, the low and middle REL_SPEED ranges that can achieve the above results are gradually moving forward, which makes the low and middle REL_SPEED range smaller and smaller, and the high REL_SPEED range larger and larger.
For the same input, when the crash injury severity between emergency decisions is consistent, in order not to affect the traffic operation of other lanes and make the driving habits of autonomous vehicles consistent with regular vehicles, autonomous vehicles should try to take the simplest action.

6. Conclusions

In this paper, the two-vehicle crash caused by the emergency braking of the frontal vehicle was taken as the research object. Based on the SVM model and the NASS/GES crash samples, the SVM crash injury severity prediction models corresponding to three emergency decisions (namely B-SVM, T-SVM, and BT-SVM) were trained for autonomous vehicles through the process of the parameter optimization and the optimal kernel function selection. Compared with the other two kernel functions, the training accuracy of three SVM models with the RBF kernel function was the highest, which are 93.1758, 87.1112, and 88.4422% respectively. Then, with the test samples the SVM model were compared with the OL and BPNN models for classification accuracy, the comparison results showed that the SVM model had the best classification performance on the crash injury severity with the classification accuracy for more than 84%.
Secondly, based on the B-SVM, T-SVM, and BT-SVM model, the sensitivity analysis was conducted to explore the effects of REL_SPEED and GVWR on the crash injury severity. The results showed that with the same conditions, increasing the REL_SPEED and GVWR would make the crash more serious. Therefore, in the prediction models, these two variables could not be ignored.
Finally, in order to make the best emergency decision for autonomous vehicles in emergencies, this paper input the crash samples with normal road and environmental conditions into B-SVM, T-SVM, and BT-SVM model respectively, then calculated and compared the ratio of the crash injury severity output from each model. This study found that in the emergency situations, when the GVWR was in the low range, with the same other conditions, as the REL_SPEED increased from the low to middle and then to the high range, the best emergency decision with the minimum crash injury severity would gradually transition from braking to turning and then to braking + turning. As the GVWR increased, the low and middle REL_SPEED ranges that could achieve the above results would be narrowed, and the high REL_SPEED range would be enlarged. To a certain extent, the results were basically consistent with the actual driving experience, which further demonstrated the rationality of the SVM prediction models in this paper.
Although the SVM crash injury severity prediction models established in this study can help autonomous vehicles to make the emergency decision with the minimum crash injury severity under emergency conditions, and the prediction performance is better than the other models, there are still some weak points and limits. For example, due to the limited data sources, we only start from the crash accident scenario on a simple single lane to explore the feasibility of the prediction methods proposed in this paper. In future research, we will factor adjacent lanes into our prediction methods, and we will use V2X equipment to deploy long-term micro-data collection strategy in the future to explore this research in depth and establish a better crash injury severity assessment model for autonomous vehicles.

Author Contributions

All authors contributed to the paper. Y.L. and J.Z. conceived and designed the experiments; S.W. and Y.L. performed the experiments and analyzed the data; J.H., S.L., and J.Z. contributed reagents/materials/analysis tools; J.Z. and Y.L. wrote the paper.

Funding

This research was funded by the National Natural Science Foundation of China (grant numbers 51678320 and 71801144); the Science & Technology Innovation Fund for Graduate Students of Shandong University of Science and Technology (grand number SDKDYC180373); the Education Innovation Project for Graduate Students of Shandong University of Science and Technology (grant number KDYC16026).

Conflicts of Interest

The authors declare no conflict of interest.

References

  1. Shawky, A.M.; Kishta, M.; Al-Harthi, H.A. Investigating Factors Affecting the Occurrence and Severity of Rear-End Crashes. Transp. Res. Procedia 2017, 15, 2098–2107. [Google Scholar]
  2. United States Department of Transportation. The General Estimates System (GES) 2012–2015, National Automotive Sampling System (NASS). Available online: https://www.nhtsa.gov/research-data/national- automotive-sampling-system-nass (accessed on 5 April 2018).
  3. Clinton, V.O.; John, S.S. Analyzing Road Safety in the United States. Res. Transp. Econ. 2013, 43, 98–111. [Google Scholar]
  4. Lv, W.; Song, W.G.; Liu, X.D.; Ma, J. A Microscopic Lane Changing Process Model for Multilane Traffic. Phys. A Stat. Mech. Appl. 2013, 392, 1142–1152. [Google Scholar] [CrossRef]
  5. Zhang, J.Y.; Liao, Y.P.; Wang, S.F. Study on Driving Decision-Making Mechanism of Autonomous Vehicle Based on an Optimized Support Vector Machine Regression. Appl. Sci. 2018, 8, 13. [Google Scholar] [CrossRef]
  6. Zheng, J.; Suzuki, K.; Fujita, M. Car-following Behavior with Instantaneous Driver-vehicle Reaction Delay: A Neural-network-based Methodology. Transp. Res. Part C Emerg. Technol. 2013, 36, 339–351. [Google Scholar] [CrossRef]
  7. Lord, D.; Mannering, F. The Statistical Analysis of Crash-frequency Data: A Review and Assessment of Methodological Alternatives. Transp. Res. Part A Policy Pract. 2010, 44, 291–305. [Google Scholar] [CrossRef]
  8. Wu, Q.; Zhang, G.H.; Ci, Y.S.; Wu, L.N.; Tarefder, R.A. Exploratory Multinomial Logit Model-based Driver Injury Severity Analyses for Teenage and Adult Driver in Intersection-related Crashes. Traffic Inj. Prev. 2016, 17, 413–422. [Google Scholar] [CrossRef]
  9. Young, R.K.; Liesman, J. Estimating the Relationship Between Measured Wind Speed and Overturning Truck Crashes Using a Binary Logit Model. Accid. Anal. Prev. 2007, 39, 574–580. [Google Scholar] [CrossRef]
  10. Manan, M.M.A.; Várhelyi, A.; Çelik, A.K.; Hashim, H.H. Road Characteristics and Environment Factors Associated with Motorcycle Fatal Crashes in Malaysia. IATSS Res. 2017. [Google Scholar] [CrossRef]
  11. Shankar, V.; Mannering, F. An Exploratory Multinomial Logit Analysis of Single-vehicle Motorcycle Accident Severity. J. Saf. Res. 1996, 27, 183–194. [Google Scholar] [CrossRef]
  12. Ye, F.; Lord, D. Comparing Three Commonly Used Crash Severity Models on Sample Size Requirements: Multinomial Logit, Ordered Probit and Mixed Logit Models. Anal. Methods Accid. Res. 2014, 1, 72–85. [Google Scholar] [CrossRef]
  13. Abdel-Aty, M. Analysis of Driver Injury Severity Levels at Multiple Locations Using Ordered Probit Models. J. Saf. Res. 2003, 34, 597–603. [Google Scholar] [CrossRef]
  14. Ayuso, M.; Santolino, M. Predicting Automobile Claims Bodily Injury Severity with Sequential Ordered Logit Models. Insur. Math. Econ. 2007, 41, 71–83. [Google Scholar] [CrossRef]
  15. Garrido, R.; Bastos, A.; Almeida, A.D.; Elvas, J.P. Prediction of Road Accident Severity Using the Ordered Probit Model. Transp. Res. Procedia 2014, 3, 214–223. [Google Scholar] [CrossRef]
  16. Lee, C.; Li, X. Analysis of Injury Severity of Drivers Involved in Single- and Two-vehicle Crashes on Highways in Ontario. Accid. Anal. Prev. 2014, 71, 286–295. [Google Scholar] [CrossRef] [PubMed]
  17. Shaheed, M.S.; Gkritza, K.; Carriquiry, A.L.; Hallmark, S.L. Analysis of Occupant Injury Severity in Winter Weather Crashes: A Fully Bayesian Multivariate Approach. Anal. Methods Accid. Res. 2016, 11, 33–47. [Google Scholar] [CrossRef]
  18. Kashani, A.T.; Mohaymany, A.S. Analysis of the Traffic Injury Severity on Two-Lane, Two-Way Rural Roads Based on Classification Tree Models. Saf. Sci. 2011, 49, 1314–1320. [Google Scholar] [CrossRef]
  19. Mujalli, R.O.; Oña, J.D. A Method for Simplifying the Analysis of Traffic Accidents Injury Severity on Two-lane Highways Using Bayesian Networks. J. Saf. Res. 2011, 42, 317–326. [Google Scholar] [CrossRef]
  20. Zeng, Q.; Huang, H. A Stable and Optimized Neural Network Model for Crash Injury Severity Prediction. Accid. Anal. Prev. 2014, 73, 351–358. [Google Scholar] [CrossRef]
  21. Delen, D.; Tomak, L.; Topuz, K.; Eryarsoy, E. Investigating Injury Severity Risk Factors in Automobile Crashes with Predictive Analytics and Sensitivity Analysis Methods. J. Transp. Health. 2017, 4, 118–131. [Google Scholar] [CrossRef]
  22. Tolouei, R.; Maher, M.; Titheridge, H. Vehicle Mass and Injury Risk in Two-Car Crashes: A Novel Methodology. Accid. Anal. Prev. 2013, 50, 155–166. [Google Scholar] [CrossRef] [PubMed]
  23. Jurewicz, C.; Sobhani, A.; Woolley, J.; Dutschke, J.; Corben, B. Exploration of Vehicle Impact Speed—Injury Severity Relationships for Application in Safer Road Design. Transp. Res. Procedia 2016, 14, 4247–4256. [Google Scholar] [CrossRef]
  24. Performance of Lap/Shoulder belts in 167 Motor Vehicle Crashes (Volume I); NTSB/SS-88/02; National Transportation Safety Board: Washington, DC, USA, 1926; pp. 14–17.
  25. Hongguo, X. Vehicle accident mechanics. In Automobile Accident Engineering; China Communications Press: Beijing, China, 2004; ISBN 7-114-05044-5. [Google Scholar]
  26. Shelley, B.; Rajesh, P.; Lacramioara, B. A Modified Rank Ordered Logit model to analyze injury severity of occupants in multivehicle crashes. Anal. Methods Accid. Res. 2017, 14, 22–40. [Google Scholar]
  27. Saha, P.; Roy, N.; Mukherjee, D.; Sarkar, A.K. Application of Principal Component Analysis for Outlier Detection in Heterogeneous Traffic Data. Procedia Comput. Sci. 2016, 83, 107–114. [Google Scholar] [CrossRef]
  28. Nagendra, S.M.S.; Khare, M. Principal component analysis of urban traffic characteristics and meteorological data. Transp. Res. Part D Transp. Environ. 2003, 8, 285–297. [Google Scholar] [CrossRef]
  29. Shafizadeh-Moghadam, H.; Tayyebi, A.; Ahmadlou, M.; Delavar, M.R.; Hasanlou, M. Integration of genetic algorithm and multiple kernel support vector regression for modeling urban growth. Comput. Environ. Urban Syst. 2017, 65, 28–40. [Google Scholar] [CrossRef]
  30. Hong, W.-C.; Dong, Y.C.; Zheng, F.F.; Lai, C.-Y. Forecasting urban traffic flow by SVR with continuous ACO. Appl. Math. Model. 2011, 35, 1282–1291. [Google Scholar] [CrossRef]
  31. Zhu, L.L.; Liu, L.; Zhao, X.P.; Yang, D. Driver Behavior Recognition Based on Support Vector Machine. J. Transp. Syst. Eng. Inf. Technol. 2017, 17, 92–97. [Google Scholar]
  32. Babazadeh, A.; Poorzahedy, H.; Nikoosokhan, S. Application of Particle Swarm Optimization to Transportation Network Design Problem. J. King Saud Univ. Sci. 2011, 23, 293–300. [Google Scholar] [CrossRef]
  33. Deng, W.; Zhao, H.M.; Yang, X.H.; Xiong, J.X.; Meng, S.; Bo, L. Study on an Improved Adaptive PSO Algorithm for Solving Muli-Objective Gate Assignment. Appl. Soft Comput. 2017, 59, 288–302. [Google Scholar] [CrossRef]
Figure 1. Emergency decision-making process of autonomous vehicles under emergency situation. (B-SVM, T-SVM, and BT-SVM refer to the SVM crash injury severity prediction model corresponding to braking, turning, and braking + turning, respectively, i.e., braking-support vector machine, turning-support vector machine, and braking + turning-support vector machine).
Electronics 07 00381 g001
Figure 2. The crash scenarios of three emergency decisions under the emergency situation ( v auto refers to the speed of autonomous vehicle before making emergency decisions; v front refers to the speed of the front vehicle; V1 is the autonomous vehicle, and V2 is the emergency braking vehicle).
Electronics 07 00381 g002aElectronics 07 00381 g002b
Figure 3. Concept of optimal hyperplane.
Electronics 07 00381 g003
Figure 4. Multi-classifier construction of Libsvm.
Electronics 07 00381 g004
Figure 5. Optimal parameter selection of SVM based on the PSO algorithm.
Electronics 07 00381 g005
Figure 6. Parameter optimization of three SVM models with different kernel functions.
Electronics 07 00381 g006
Figure 7. The structure of BPNN.
Electronics 07 00381 g007
Figure 8. Iterative results of three BPNNs.
Electronics 07 00381 g008
Figure 9. The changing trend of crash injury severity ratio under different conditions. (a) With the B-SVM model, the changing trend of each injury severity ratio with the REL_SPEED when the GVWR is in different ranges. (b) With the T-SVM model, the changing trend of each injury severity ratio with the REL_SPEED when the GVWR is in different ranges. (c) With the BT-SVM model, the changing trend of each injury severity ratio with the REL_SPEED when the GVWR is in different ranges. From left to right, each column represents the changing trend of no injury ratio, non-incapacitating ratio and incapacitating/fatal ratio with the REL_SPEED when the GVWR is in different ranges, respectively.
Electronics 07 00381 g009aElectronics 07 00381 g009b
Figure 10. The changing trend of crash injury severity ratio with different SVMs. (a) When GVWR is in the low range, the changing trend of each crash injury severity ratio with the REL_SPEED in different SVM models. (b) When GVWR is in the middle range, the changing trend of each crash injury severity ratio with the REL_SPEED in different SVM models. (c) When GVWR is in the high range, the changing trend of each crash injury severity ratio with the REL_SPEED in different SVM models.
Electronics 07 00381 g010
Table 1. Description of the related variables of the crash injury severity.
Variable CodingSymbolDescriptionData TypeDescriptive Statistics *
REL_SPEED l 1 Relative speed of the two vehicles/mphNumeric36.72 (15.55)
GVWR l 2 Gross vehicle weight ratingNominal 10,000 lbs or Less (Low range): 0/64.0%;
10,001 lbs–26,000 lbs (Middle range): 1/22.3%;
26,001 lbs or More (High range): 2/13.7%
BODY_TYP l 3 Vehicle type of the frontal vehicleNominalStandard passenger car: 0/77.9%;
Bus: 1/14.6%;
Motorcycle: 2/5%;
Medium/heavy truck: 3/2.5%
SPEEDREL l 4 Speeding (The frontal vehicle)BinaryNo: 0/73.4%;
Yes: 1/26.6%;
DAY_WEEK l 5 Crash occurrence dateNominal Working day: 0/75.3%;
Off day: 1/24.7%
HOUR_IM l 6 Crash timeNominal6:00 a.m.–9:59 a.m.: 0/12.7%;
10:00 a.m.–2:59 p.m.: 1/22.1%;
3:00 p.m.–5:59 p.m.: 2/19.8%;
6:00 p.m.–8:59 p.m.: 3/20.9%;
9:00 p.m.–5:59 a.m.: 4/24.5%
LGTCON_IM l 7 Light conditionNominal Daylight: 0/53.8%;
Dawn or Dusk: 1/3.8%;
Dark-lighted: 2/23.1%;
Dark-unlighted: 3/19.3%
WEATHR_IM l 8 Weather conditionNominal Clear/Cloudy: 0/73.2%;
Fog: 1/8.7%;
Rain: 2/17.0%;
Snow: 3/0.8%;
Wind: 4/0.3%
VTRAFWAY l 9 Lane typeNominalOne-Way: 0/7.0%;
Two-Way, Not Divided: 1/76.6%;
Two-Way, Divided: 2/16.4%
VNUM_LAN l 10 Number of lane(s)Numeric3.07 (1.32)
VALIGN l 11 Curvature of lane(s)NominalStraight: 0/81.7%;
Curve: 1/18.3%
VPROFILE l 12 Slope of lane(s)NominalLevel: 0/93.1%;
Grade: 1/3.7%;
Hillcrest: 2/2.2%
VSURCOND l 13 Road surface conditionsNominalDry: 0/81.4%;
Wet: 1/15.4%;
others: 2/3.2%
VTRAFCON l 14 Traffic control equipmentNominalRegulatory Sign: 0/10%;
Traffic Signals: 1/42.5%;
No Controls: 2/46.4%;
Warning signs: 3/1.1%
* Numeric: mean (St. Dev.); Binary and Nominal: assignment/frequency percentage (%).
Table 2. Eigenvalues and contribution rates.
Principal ComponentEigenvalueVariance Contribution RateCumulative
110.3750.4940.494
22.8140.1340.628
32.0370.0970.725
41.3860.0660.791
51.1970.0570.848
61.0290.0490.897
70.8400.0400.937
80.2730.0130.950
90.2100.0100.960
100.2310.0110.971
110.1680.0080.979
120.1680.0080.987
130.1470.0070.994
140.1260.0061.000
Table 3. Output variables of the crash injury severity.
Crash Injury SeverityDescriptionRepresented ValueStatistics
No injuryno apparent injury−154.2%
Non-incapacitatingpossible injury033.4%
suspected minor injury
Incapacitating/fatalsuspected serious injury112.4%
fatal
Table 4. Training classification accuracy of SVMs/% with different kernel functions.
ModelB-SVMT-SVMBT-SVM
Kernel
Polynomial92.29679.27583.113
RBF93.17687.11188.442
Sigmiod92.89483.33883.225
Table 5. Optimal parameters of SVMs with RBF kernel functions.
Parameterscσ
Model
B-SVM3.74130.4857
T-SVM21.07440.0277
BT-SVM8.11210.1854
Table 6. Parameter estimation based on the OL model.
VariableB-OL ModelT-OL ModelBT-OL Model
Estimatep ValueEstimatep ValueEstimatep Value
REL_SPEED0.0320.0160.0290.020.0170.019
GVWR1.2150.0071.1410.0171.4720.008
LGTCON_IM0.1750.000----0.2770.000
WEATHR_IM0.4070.000--------
VNUM_LAN----−0.070.000−0.2510.001
VALIGN----0.2860.0000.3320.003
VPROFILE----1.1320.0011.2410.000
VSURCOND0.1390.0070.8020.0030.9980.015
Cutoff point 12.944--3.872--5.405--
Cutoff point 24.503--6.743--9.277--
Table 7. Prediction accuracy of SVM model in the training and testing.
Crash Injury SeverityTraining (%)Testing (%)
B-SVMT-SVMBT-SVMB-SVMT-SVMBT-SVM
No injury94.12692.10792.57391.51488.90389.323
Non-incapacitating91.35586.64286.33989.03982.87184.680
Incapacitating/fatal87.41784.40885.01585.97781.07282.983
Overall93.17687.11188.44288.00184.71285.229
Table 8. Prediction accuracy of OL model in the training and testing.
Crash Injury SeverityTraining (%)Testing (%)
B-OLT-OLBT-OLB-OLT-OLBT-OL
No injury81.78779.47582.12776.52273.44274.627
Non-incapacitating77.08671.61873.50371.55362.78569.320
Incapacitating/fatal65.29659.69261.55159.35257.63259.468
Overall76.88369.26171.72771.42465.38468.488
Table 9. Prediction accuracy of BPNN model in the training and testing.
Crash Injury SeverityTraining (%)Testing (%)
B-BPNNT-BPNNBT-BPNNB-BPNNT-BPNNBT-BTNN
No injury87.25285.97286.02280.53276.74078.338
Non-incapacitating84.42178.88380.55473.10167.26371.679
Incapacitating/fatal79.33471.05379.89966.71159.57963.578
Overall82.76976.63781.26972.55966.75070.086

