Article

SINDVis: User-Centered Dynamic Interactive Visualization System for Space Information Networks

1
Science and Technology on Complex Electronic System Simulation Laboratory, Space Engineering University, Beijing 101416, China
2
Institute of Beijing Remote Sensing Information, Beijing 100192, China
*
Author to whom correspondence should be addressed.
Electronics 2018, 7(11), 316; https://doi.org/10.3390/electronics7110316
Submission received: 29 September 2018 / Revised: 5 November 2018 / Accepted: 8 November 2018 / Published: 12 November 2018
(This article belongs to the Section Computer Science & Engineering)

Abstract

:
As an important national strategy infrastructure, the Space Information Network (SIN) is a powerful platform for future information support. In this paper, we design and implement a user-centered, dynamic, interactive visualization system (SINDVis), and aim to assist multi-class users to understand, build, develop, maintain, and manage the SIN. We introduce the concept and architecture of SIN, summarize the key technologies of dynamic visualization and visual analysis, and analyze the basic characteristics of three types of users. Combining the content above, we design the architecture of SINDVis from an input module, a core-processing module, an output module, and a user body. We also describe eight basic functions of the entity domain view (GeoView) and topology domain view (TopolView). Meanwhile, we analyze the implementation methods of the GeoView and TopolView, including an improved Force-Directed Algorithm (FDA) layout, Fusion of Animation and Timeline (FAT) visualization, and Panning and Zooming (P&Z) interactions. We analyze the experiment platforms and running environments of the GeoView and TopolView and realize the main contents of both views with a typical SIN. The results also verify the validity and feasibility of the theories and methods proposed. Finally, we discuss and analyze experimental results and the advantages and disadvantages of the SINDVis and look forward to future work. With the development of visualization and visual analysis technology, both application-driven and user-interaction features are gradually highlighted. We introduce the visualization technology into the field of SIN in order to provide new ideas for the basic theory and key technology research of SIN.

1. Introduction

There are multiple types of network systems in human and virtual societies [1], such as communication networks, social networks, urban transportation networks, cooperation networks, trade networks, and command and control networks, etc. In fact, regardless of people’s livelihood needs, or military applications, most human beings are currently greatly dependent on networks. With the rapid development of science and technology, aerospace has gradually become the focus of many countries, especially in terms of the modernized armament game. The space information network (SIN) [2] plays an extremely important role in this game, and the major aerospace countries of the world are actively exploring and conducting related research [3].
As a huge, complex network system, the SIN has some typical characteristics, such as complexity, heterogeneity, and heterogeneity as well as being limited, multilayer and, most obviously, dynamic [4]. The dynamic characteristic of SIN can be subdivided into time-varying aspects in the time domain and space-varying aspects in the space domain. For SIN, because the time-varying and space-varying characteristics are simultaneously present, the irregularity and instability of the network topology is greatly increased, and this also brings many challenges to the construction, management, and use of SIN. In recent years, with the support of the National Natural Science Foundation of China, scholars have made many research achievements regarding the top-level design of SIN architecture, the theories and methods of high-speed transmission, and the sparse representation and fusion processing of space information [5]. However, through a comparative analysis, we identified that the following problems still need to be solved.
Question 1.
Although there are some technical schemes for SIN architecture, there is no effective demonstration system or integrated platform to show the concrete structure of SIN in the entity domain. As we know, there are a number of simulation platforms, such as the STK (Satellite Tool Kit) and SaVi. However, both of them are based on the client/server (C/S) architecture implementation, and the SaVi is mainly applied to academic verification. Therefore, the STK and SaVi are inconvenient for application and promotion. For multi-class users, it is very important to determine how to demonstrate effectively the composition structure and operation laws of the SIN in the entity domain.
Question 2.
With the increasing demand for the construction and development of SIN, its scale is expanding, and its composition structure is becoming more and more complex. For users who come from the department of construction and management of SIN, it is necessary to understand the system structure of SIN with scale enlargement. Meanwhile, we also need to understand the topology structure model of SIN and explore the key nodes and core links of the SIN. All of the above aspects are very important for maintaining normal operation and daily management. At present, there is no relevant molding platform to show the topology structure and demonstrate its topology evolution laws of SIN in the topology domain.
For the above questions, we introduce some relevant techniques and methods of visualization, and design and implement a dynamic interactive system of SIN, named SINDVis. The system can satisfy multiple needs of multi-class users at the same time. The rest of the paper is organized as follows: In Section 2, we explain the related work, including the concepts and architecture of SIN, the technology principles of dynamic visualization and visual analysis, and multi-class users’ characteristics. In Section 3, we build the architecture of SINDVis, analyze the specific functions of the visual views of GeoView and TopolView, and discuss relevant theories and methods of realizing the above views. Section 4 presents the verification of the instances, and we use a typical SIN as an example for the implementation of GeoView and TopolView. Section 5 discusses the verification results. Section 6 concludes the paper.

2. Related Work

The purpose of this section is to introduce the concepts and architecture of SIN, analyze the technology principles of dynamic visualization and visual analysis, and discuss multi-class users’ characteristics.

2.1. SIN Concept and Architecture

Researchers have presented various interpretations for SIN [2,3,4,5,6]. Combined with the main research plan of the National Nature and Science Fund of China, “Space information networks based theory and key technology”, we define the concept of SIN as follows.
Definition 1.
SIN is an integrated information network system and network infrastructure that is carried by space platforms. It is composed of a satellite system (such as geostationary earth orbit (GEO) satellites, nonsynchronous medium earth orbit (MEO) satellites, nonsynchronous low earth orbit (LEO) satellites, mainly responsible for processing the load), other information systems HABs (Hot Air Balloons) or UAVs (Unmanned Aerial Vehicles) in near-space, or terminals (ground station, mainly responsible for control). It can support real-time data acquisition, transmission, and processing of mass data, and achieve systematic information service application through integrated network interconnecting. It provides integrated investigation, navigation, communications, and other services, and realizes battlefield situational awareness, such as communication broadcasting; investigation and surveillance; intelligence detection; navigation and positioning; missile warning; and weather, hydrology, and terrain.
By analyzing the structure of its backbone network and other supporting facilities, we determined the specific components of SIN. According to its function and Definition 1, SIN should be mainly composed of four layers: the GEO layer satellite system, the MEO/LEO layer satellite system, the Near Space layer information system, and the Ground layer terminals. Each section will be discussed in detail in the following text.
Definition 2.
(GEO Layer Satellite System). GEO is a special geosynchronous orbit with zero inclination with an orbital height of 35786 km and the same orbital period as the Earth’s rotation cycle. The satellite covering area of the orbit is large and static relative to the ground, so it is playing increasingly important roles in the civil and military fields, such as communication, navigation, warning, and meteorology. Therefore, in the SIN, we can rely on at least three GEO satellites to achieve the construction of the GEO layer satellite system, and the system can achieve 360° full-cycle coverage. The composition structure of the GEO layer satellite system is shown in Figure 1.
Definition 3.
(MEO/LEO Layer Satellite System). The MEO satellite orbital is 5000~20,000 km and the LEO satellite orbital is generally between 700 km and 1500 km. The satellites serving the MEO/LEO layer exist in the network form, and in the SIN, the MEO/LEO double-layer constellation network mode is adopted. Among them, the MEO satellites are mainly used as routing exchange stars and access stars. The LEO satellites are mainly used as access stars, and they can access the application stars and ground stations. The composition structure of the MEO/LEO layer satellite system is shown in Figure 2.
Definition 4.
(Near Space Layer Information System). The backbone networks of SIN are composed of satellite systems. However, the satellite systems cannot achieve all-weather, large-depth, and full-coverage. Therefore, it is necessary to rely on the Near Space layer aircrafts, including UAVs and HABs, to achieve the construction of the Near Space layer information system. The Near Space layer is convenient for its condition, so the construction of Near Space layer information system is more flexible and more formal. The composition structure of the Near Space layer information system is shown in Figure 3.
Definition 5.
(Ground Layer Terminals). In accordance with the original intention of the construction and development of SIN, it is mainly based on the space platforms to achieve information acquisition and processing as well as the task of information assurance. Therefore, the main tasks of the ground terminals are to maintain and manage space entities. We believe that the Ground layer of SIN is mainly composed of the following types of terminals: fixed-based stations, hand-held mobile-based stations, vehicle-based stations, and carrier-based stations. The composition structure of the Ground layer terminals is shown in Figure 4.
Based on Definitions 15, we can design the top-level of SIN architecture. The basic design ideas are building space-based backbone networks, including GEO and MEO/LEO layer satellite systems to solve global coverage issues, building a near-space backbone network including the Near Space layer information system to solve regional strengthening issues, and building Ground layer terminals to achieve command and control. Therefore, the SIN has a more obvious four-layer structure.

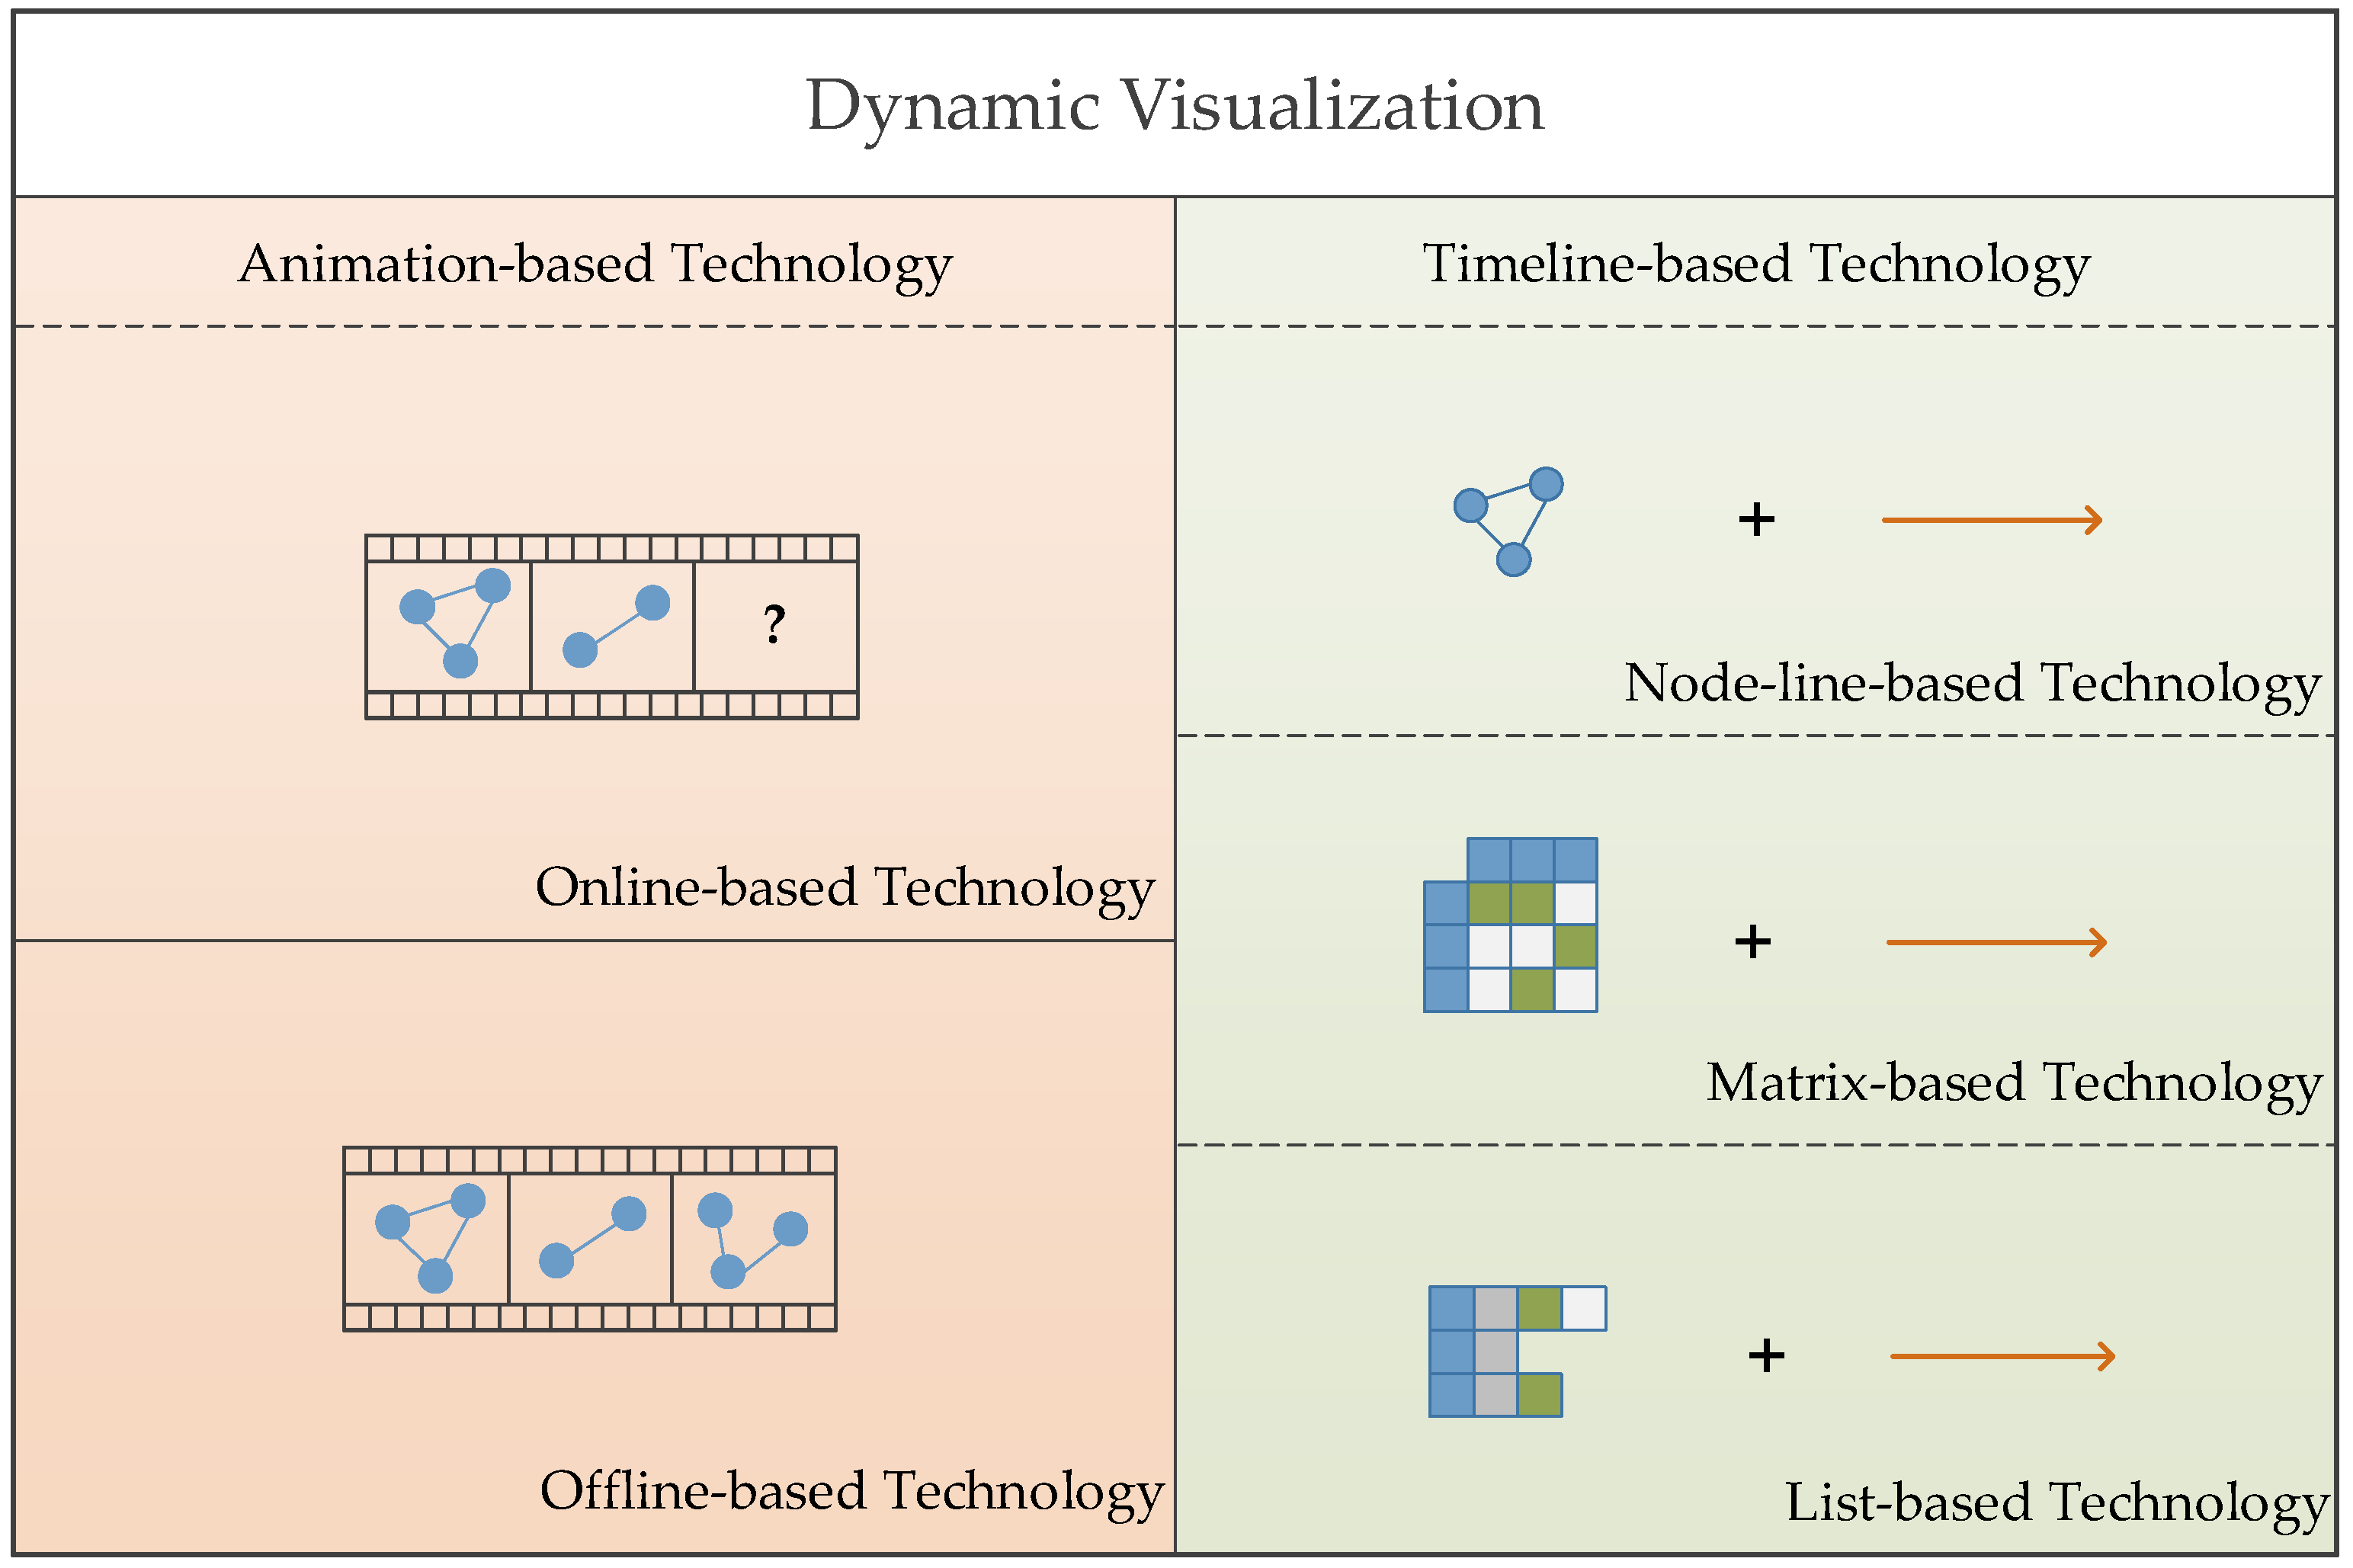
2.2. Dynamic Visualization and Visual Analysis

Network visualization is a branch of information visualization that can be traced back to static graph visualization [7]. With gradual research, people found that topology evolution has become a major feature of networks. Therefore, static network visualization was unable to meet the real needs. Since then, scholars have gradually introduced the concept of time and started to study dynamic visualization.
Dynamic visualization [8] is a relatively young cross-field. It is mainly used to research the visual view change laws due to the nodes and edge changes of the network over time. Dynamic visualization can make full use of the human visual perception system to display dynamic data graphically. On the one hand, it can help users to understand the internal structure of network, and on the other hand, it helps to uncover potential value, because dynamic data is constantly updated, and the impacts of the newly generated data on the original visualization are uncontrollable and unpredictable [9]. Therefore, this poses a challenge to the network dynamic visualization. Combined with the visual perception characteristics of the visual view, the design of dynamic visualization should aim to ensure continuity and consistency between frames.
People take visual analysis as the third paradigm after visualization in scientific computing (VISC) and information visualization, and it involves the inheritance and development of visualization technology. VISC and information visualization are more inclined towards the previous view, and the visual analysis is more inclined towards post-analysis based on the visual view [10]. Visualization technologies have covered many aspects of people’s daily lives and work. With the widespread popularization of the Internet and mobile terminals, people can not only enjoy the technology dividends, but also realize that “one picture speaks one thousand words”, based on the visualization technologies. After decades of development, visualization has gradually developed into a valid area of data analysis. In addition, it has gradually developed from VISC, information visualization to big data visualization, dynamic visualization, and visual analysis as well as other directions and branches.
Similar to other visualization technologies, there are some basic functional and performance requirements for dynamic visualization and visual analysis techniques. On the one hand, it is necessary to meet the basic aesthetic criteria throughout the visualization process [11]. On the other hand, the user’s mental map must always be maintained [12]. Meeting the above functional and performance requirements are the criteria for evaluating the effectiveness of the visualization.
The literature presents three aspects to realize network dynamic visualization: network layout, network attribute visualization, and user interaction [4,8]. After the development over several years, scholars have also made many contributions concerning the three aspects presented above. A list of the common methods for the realization of dynamic visualization and visual analysis is shown in Table 1.
As shown in Table 1, the network layout methods mainly include the Force-Directed Algorithm (FDA) layout and its improvements. The methods of network attribute visualization mainly include the animation method and the timeline method. The interactive methods mainly include the fisheye view method, the focus and context method, and the multi-view association coordination method. In this paper, we refer to and improve the methods described above to implement the SINDVis. Therefore, the specific contents of the above methods are not discussed in this section too much. In addition, development of dynamic visualization at home and abroad has been carried in prophase work [13], and this section does not elaborate on them further.

2.3. User Feature Analysis

As mentioned in Section 1, the purpose of designing SINDVis is to assist multi-class users to achieve effective understanding, construction, development, maintenance, and management of SIN. Therefore, users are the core factor of the SINDVis design, and users’ requirements determine the SINDVis functions. That is to say, the various functions of SINDVis are designed to meet the multiple needs of multi-class users. Therefore, in order to put the idea of user-centered into practice and to provide guidance for the design and description of SINDVis functions in Section 3.2, this section carries out a user feature analysis of SINDVis.
One of the main indicators for verifying visualization is satisfaction degree of the user’s visual experience. The primary indicator and original intention of the SINDVis system was to meet the needs of multi-class users. Therefore, we analyzed the characteristics of the existing users and potential users of the SIN to provide a reference for the development of the system function module. According to the needs of the similarities and differences of SINDVis, the main users were divided into three categories as follows:
  • USE-1: (Understanding Class Users). The first-class users are new to SIN, and they do not have much relevant background knowledge of SIN. Meanwhile, they need to have preliminary understanding of the composition and structure of SIN with the SINDVis.
  • USE-2: (Construction and Development Class Users). The second-class users come from the demonstration and construction departments of SIN, and they have a certain understanding of SIN. However, they need to optimize and improve SIN. Therefore, they not only need to grasp the architecture of SIN in real-time, but also need to understand the evolvement laws and development situation of SIN with the SINDVis.
  • USE-3: (Maintenance and Management Class Users). The third class users come from the maintenance and management departments of SIN, and they need to grasp the structure and change laws of SIN in real time. Meanwhile, they should grasp the position and relationship of key nodes and core links of SIN in the topology domain and effectively avoid the damage and interference of SIN. In addition, they can effectively maintain the normal operation of the SIN with the SINDVis.
In short, according to the different needs of users, we divided the SINDVis users into the three categories presented above. To show how different users focus on SINDVis views, we present a tabular representation of how much the user needs to use the SINDVis views. We use ★ to express the users’ demands for SINDVis, and a greater number of ★ indicates a greater need for views. The requirements of the users for the views are shown in Table 2. The contents of entity view, named GeoView, and topology view, named TopolView, are discussed in Section 3.2.

3. Theory and Methods

The purpose of this section is to introduce the related theory and methods of SINDVis. As we know that framework is a guidance for system design and implementation, we constructed the architecture of SINDVis first. Based on this, we illustrate the functions of GeoView in the entity domain and TopolView in the topology domain, respectively. The GeoView and TopolView play key roles in SINDVis, and the implementation principles of them are different, so we separately explain theory and methods of the GeoView and TopolView. In addition, we focus on the implementation methods of the TopolView in the topology domain, including an improved FDA (Force-Directed Algorithm) layout, FAT (Fusion of Animation and Timeline) visualization and P&Z (Panning and Zooming) interaction.

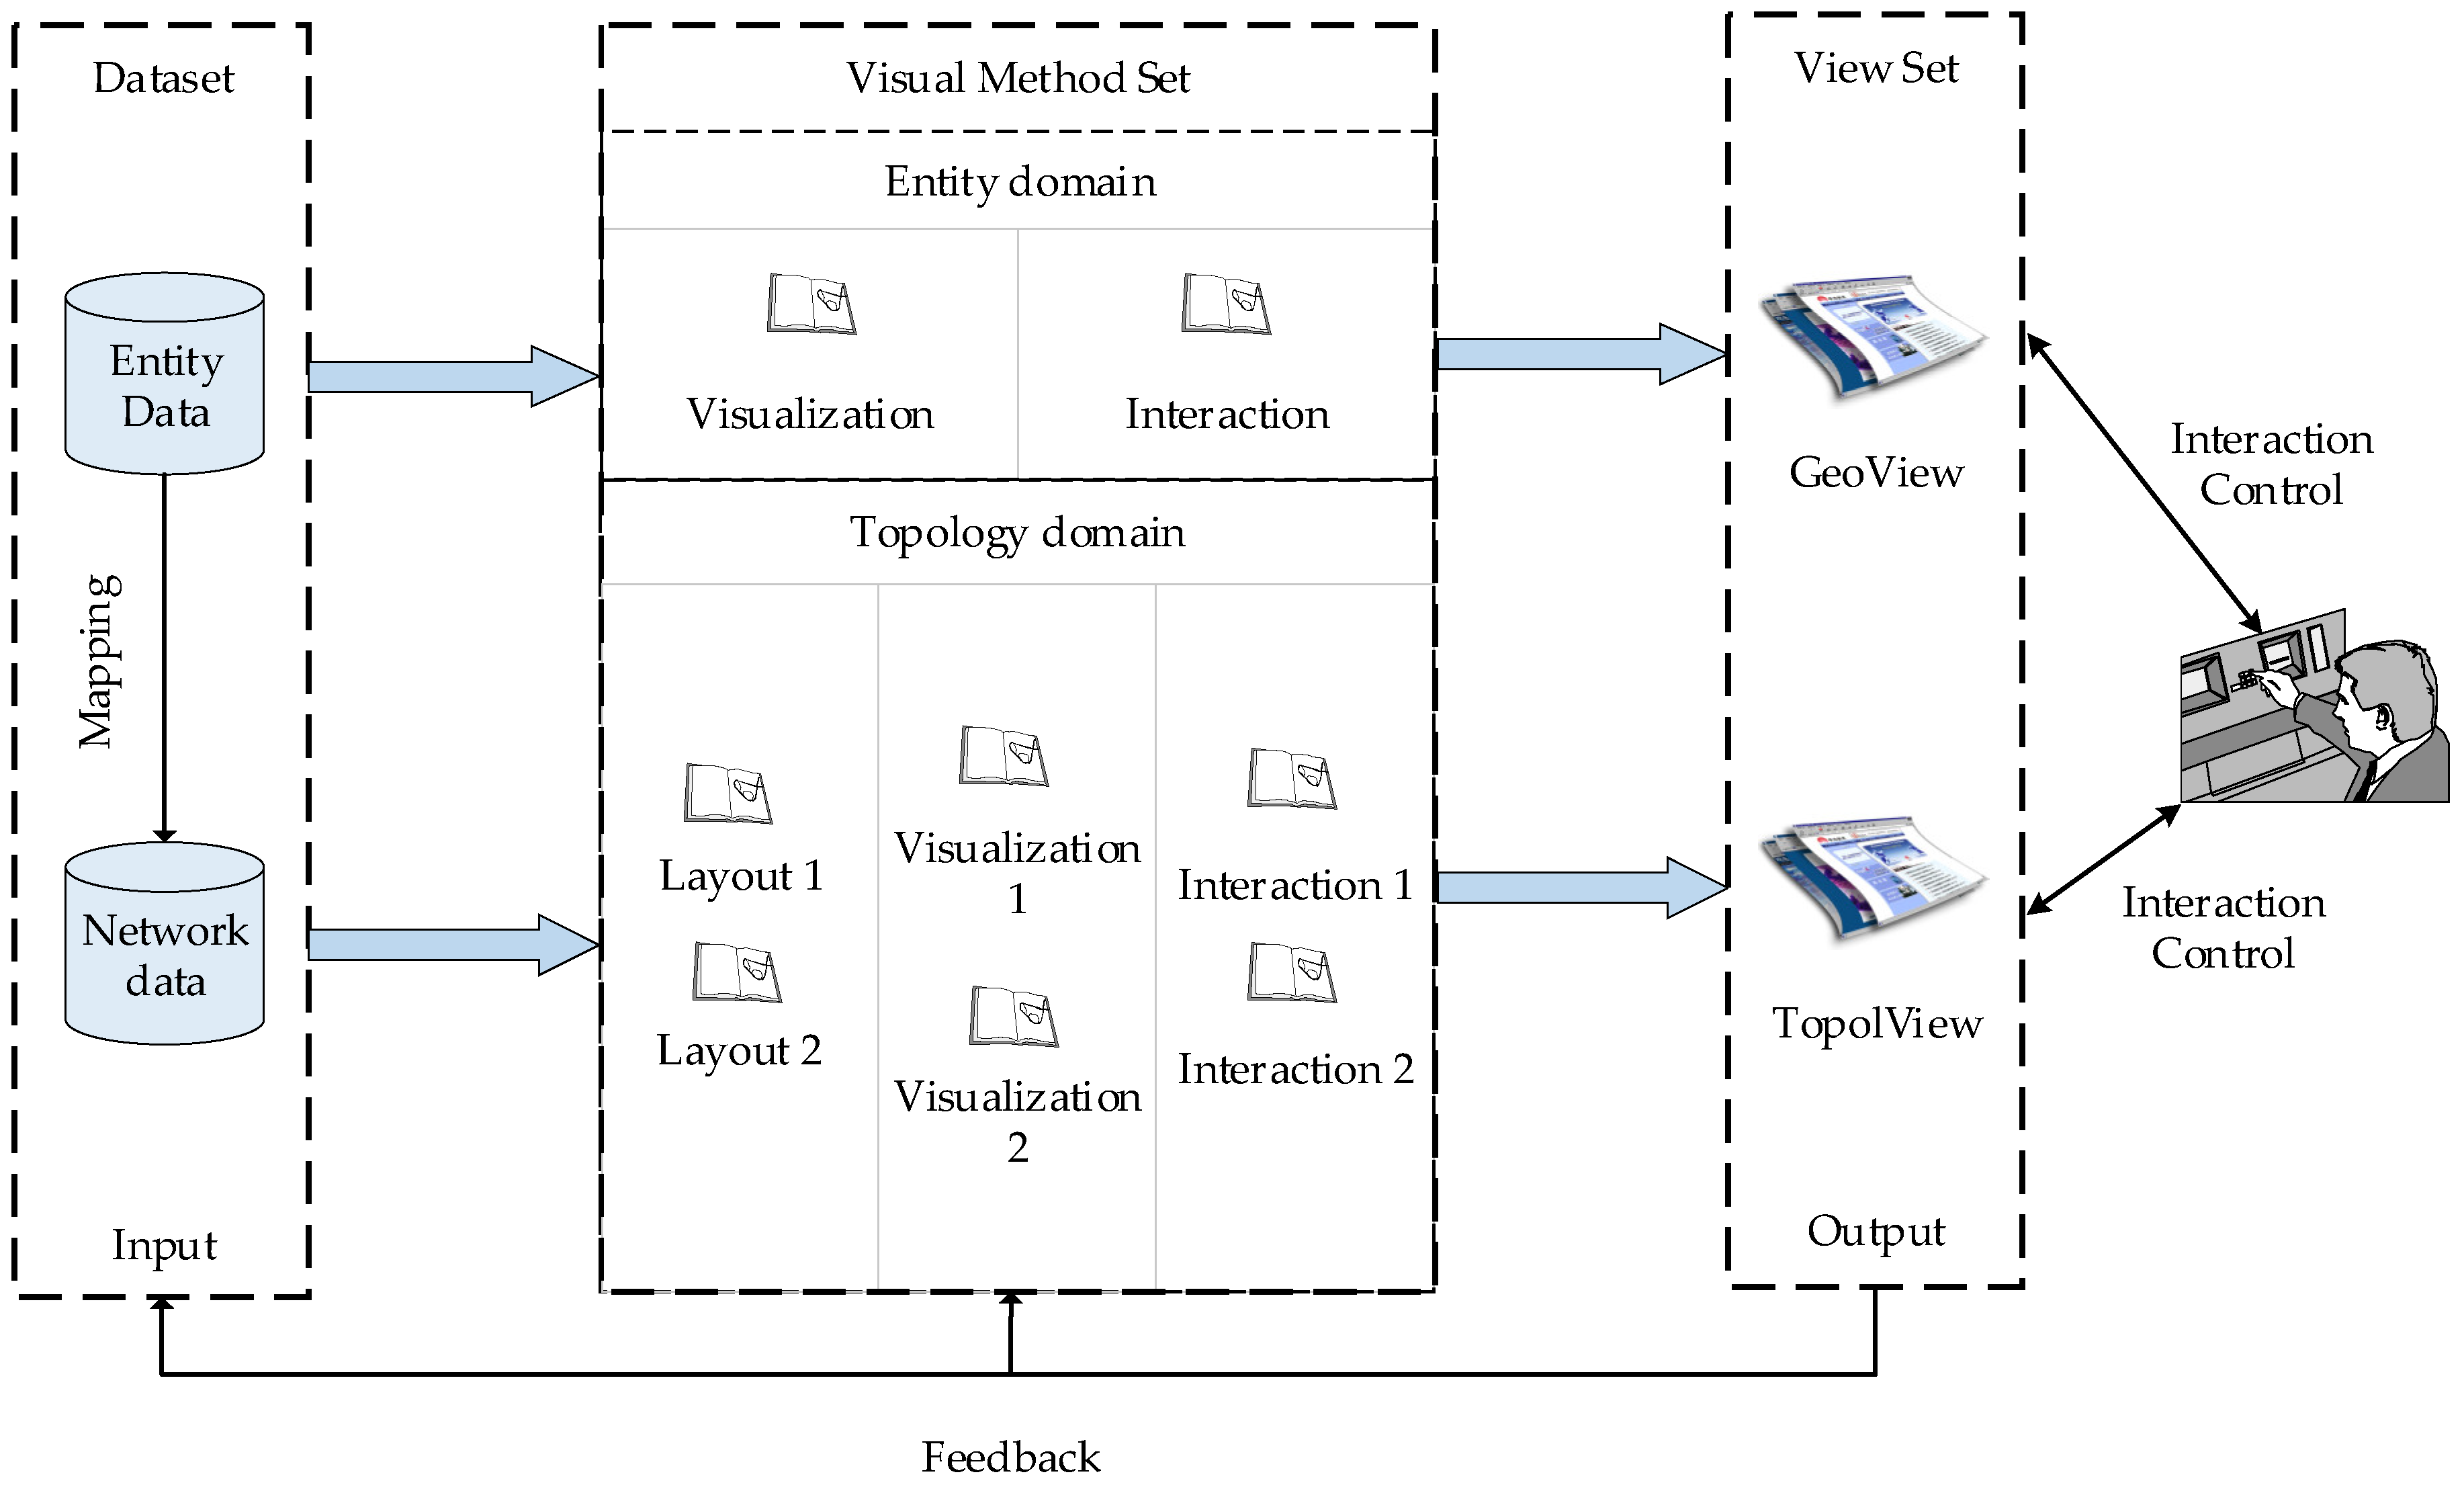
3.1. SINDVis Architecture

The main purpose of visualization technologies is to satisfy users’ visual experience, and to realize the requirements of data analysis based on visual views. Network dynamic visualization is no exception. Therefore, we think that the SINDVis framework should include dynamic data input, visual view generation, visual view output, and users. Based on this, we designed the SINDVis framework as shown in Figure 5.
As shown in Figure 5, the SINDVis framework was constructed from a dataset (input module), a visual method set (core-processing module), a view set (output module), and a user body. To demonstrate the SINDVis architecture more clearly, we analyzed its composition in more detail, as shown below.
  • Dataset: The dataset is an input module for SINDVis, consisting of an entity dataset and a network dataset, and the network data in topology domain is mapped from the entity data in the entity domain. The entity dataset consists of space data, such as satellite orbital parameters, satellite operating satellite cycles, satellite coverage, data transfer between satellites, etc. By mapping space entities to nodes and by mapping relationships between entities as edges, we formed the network dataset. Both of the above provide input to the SINDVis.
  • Visual method set: The visual method set is a core-processing module of SINDVis and it includes the entity domain methods and topology domain methods. For the entity domain, we refer to the visual views of STK and SaVi and realize the dynamic display of the structure and running state of the SIN in the entity domain. For the topology domain, we realize the dynamic display of evolution laws of the SIN topology structure. The visual method set is a large collection of methods, and the essence of the visual method set is a black box. The implementation methods of the entity domain mainly include visualization and interaction methods. The implementation methods of the topology domain mainly include layout, visualization and interaction methods. Because of the different principles and different objects of the entity domain and topology domain, the implementation methods of each are also different.
  • View set: The view set is the output module of the SINDVis, including the entity domain view, named GeoView, and the topology domain view, named TopolView. As we know, the visual view is a direct embodiment of the implementation of visualization technologies, and it is also a medium for showing information and implementing user interactions. Meanwhile, we think of the visual method set as processing, and the view set as results. Therefore, we constructed the visual method set and the view set separately. In SINDVis, the GeoView and TopolView appear on different pages at the same time. Of course, the specific display forms of the GeoView and TopolView depend on the specific visual methods selected. Meanwhile, the view set can feed the user’s new requirements into the input module and the core-processing module, thus generating output modules that meet users’ new requirements.
  • Users: Users are the center of the SINDVis, and users’ requirements are the basis reference for SINDVis function settings. Visual interaction is built between the view set and users. Meanwhile, the users enable real-time interaction with the view, and the users can control the views in real-time. Because the SINDVis is a dynamic visualization system, the main interaction is the time control of users. In addition, due to the limitations of page size, users can zoom in, zoom out, or pan the views according to their own interests. It is also one of the main visual interactive functions of the SINDVis.
In fact, the data is the input, the views are the output, and the visual methods are a black box. In this paper, we introduce visualization technologies into SIN and aim to design and realize the SINDVis. Therefore, to highlight the key methods and theory of SINDVis, we replace the black box with the visual method set in Figure 5. Meanwhile, we think that the visual method set in the SINDVis architecture is necessary. The datasets involved in the architecture are more focused on data collection and storage. Therefore, we rely on the SIN database for the storage of space data. The SIN database is a distributed file system (Hadoop distributed file system, HDFS) that is used for the development of a column-oriented distribution storage system. Project groups built it on the Hadoop platform. The specific contents [14] of the SIN database are not explained further in this article. The content of the visual method set and the interactive control technologies involved in the SINDVis framework architecture are explained in Section 4.

3.2. SINDVis Description of Functions

The views reflect the functions of SINDVis. In Section 2.3, we presented an analysis of the different needs of different users for visual views, and in Table 2, we also mentioned GeoView and TopolView. GeoView is the short name for the entity domain view, and TopolView is the short name for the topology domain view. GeoView is a direct embodiment of the entity organization relationship of SIN, and TopolView is used to show dynamic evolution processes and grasp the topology evolution laws of SIN after the entity data has been mapped to the network data. In addition, they complement each other. Detailed information is shown below.

3.2.1. Descriptions of GeoView Functions

Based on the inspiration of the STK [15], and in order to complement the TopolView, we developed a web-oriented visual view, GeoView. This view is not only able to implement the features that STK contains, but also partially expands. The specific functions are as follows.
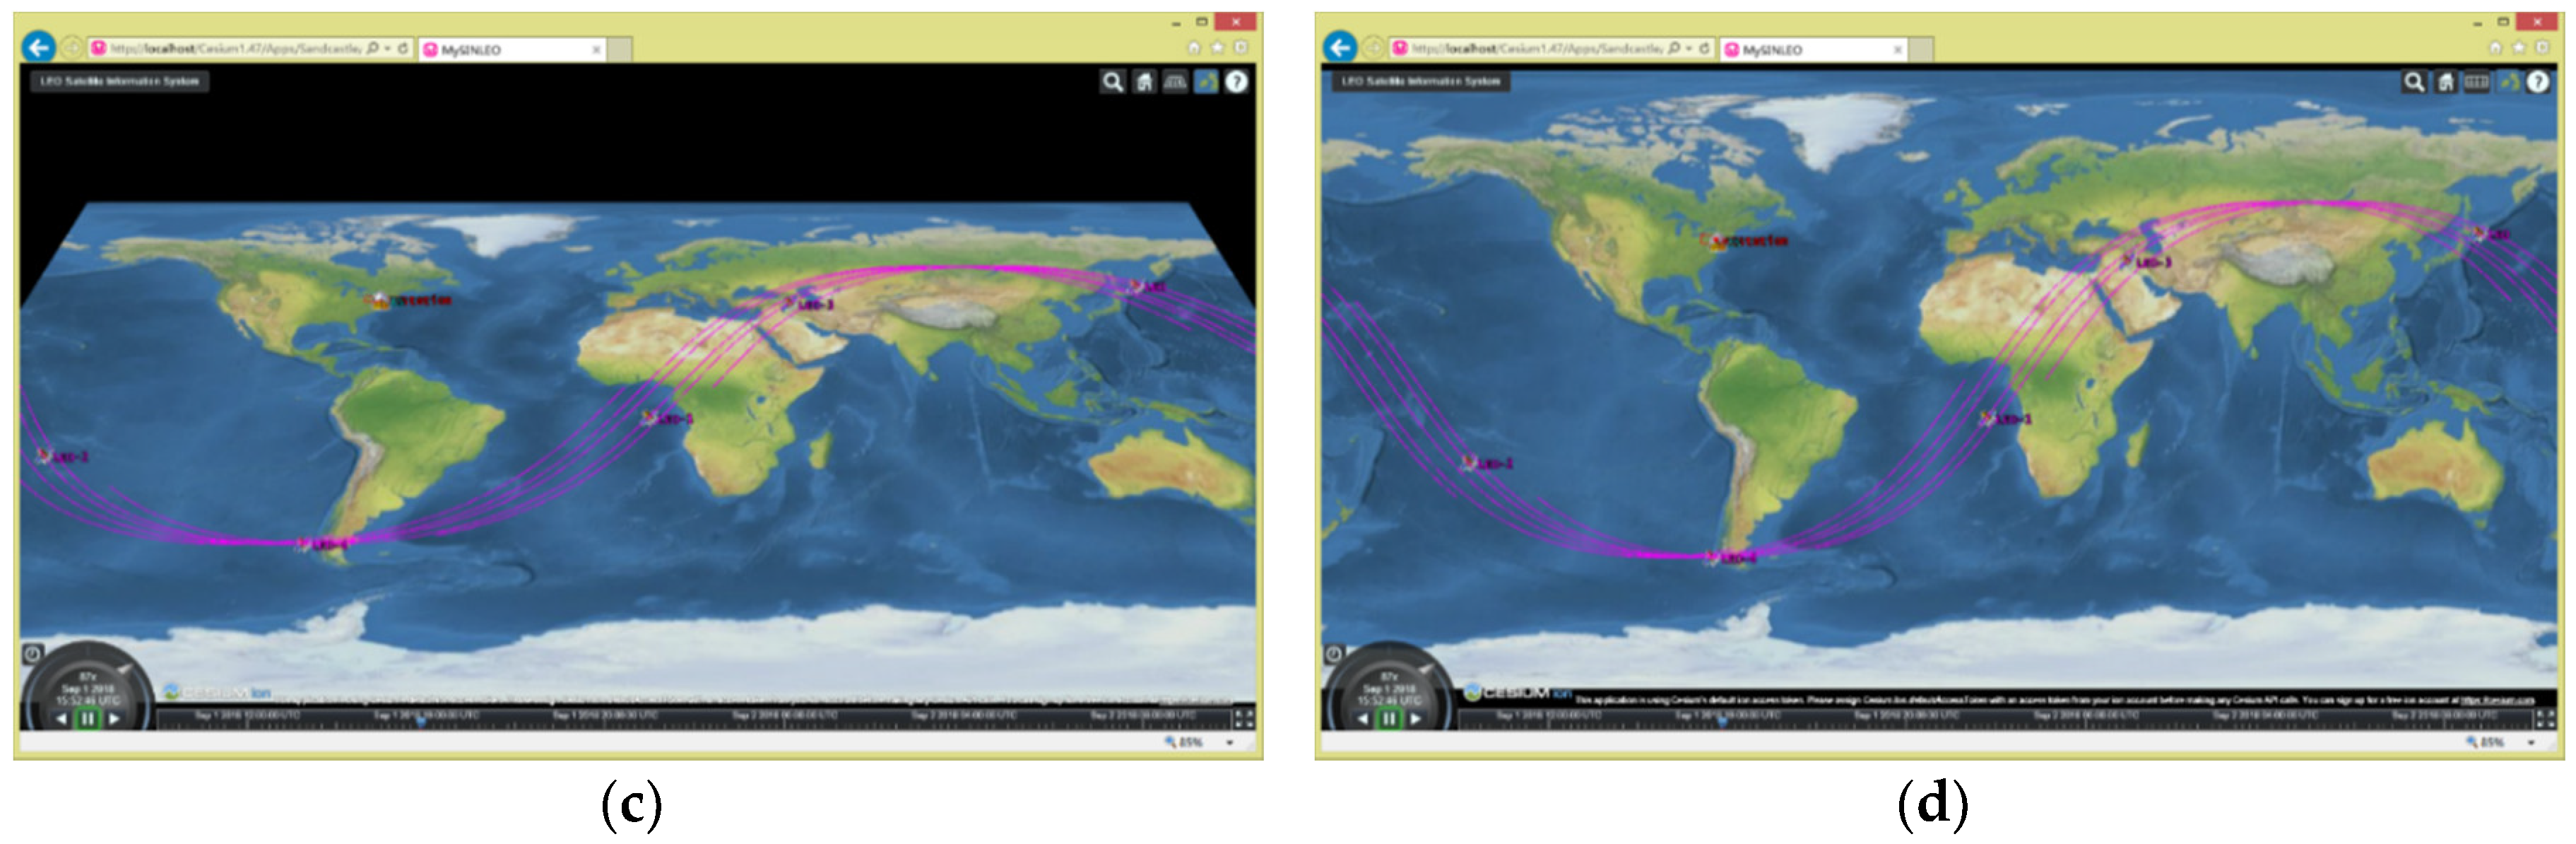
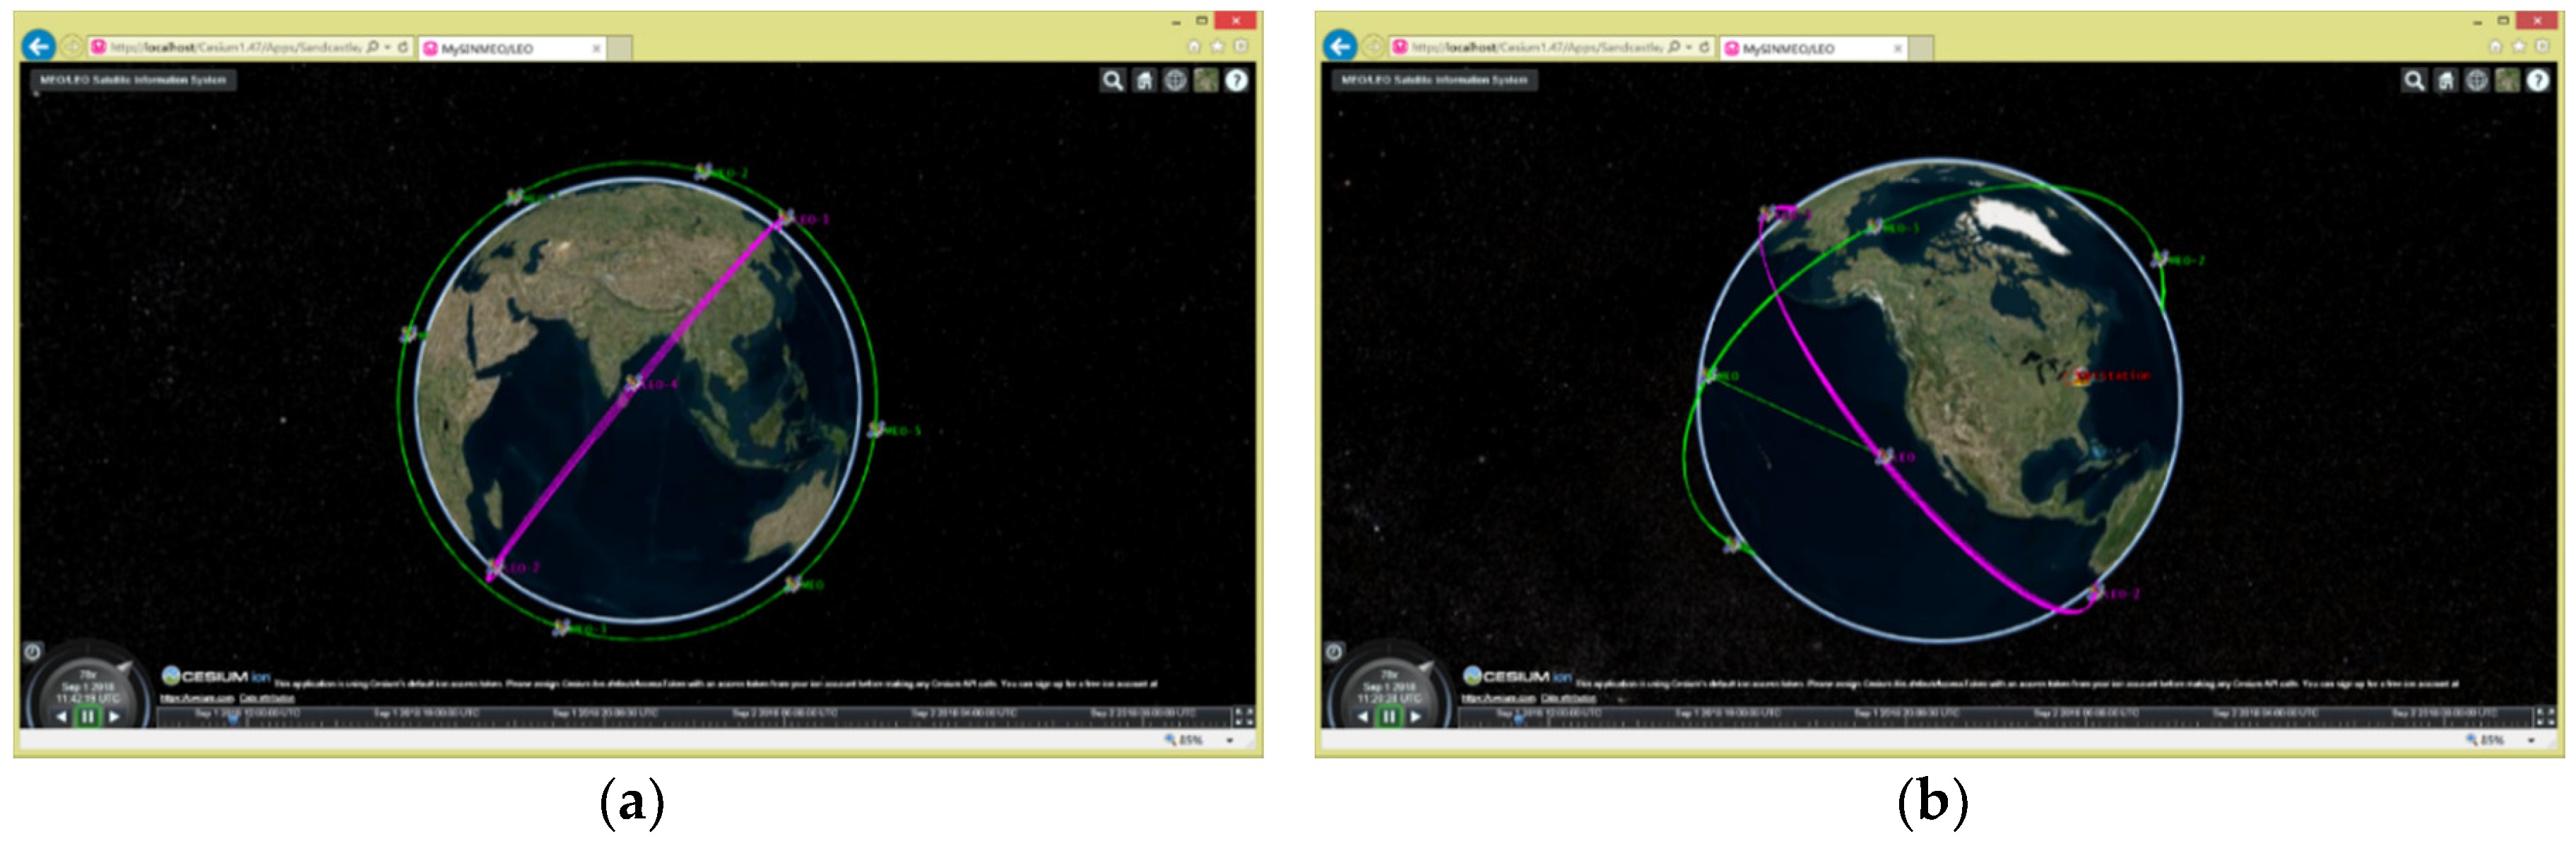
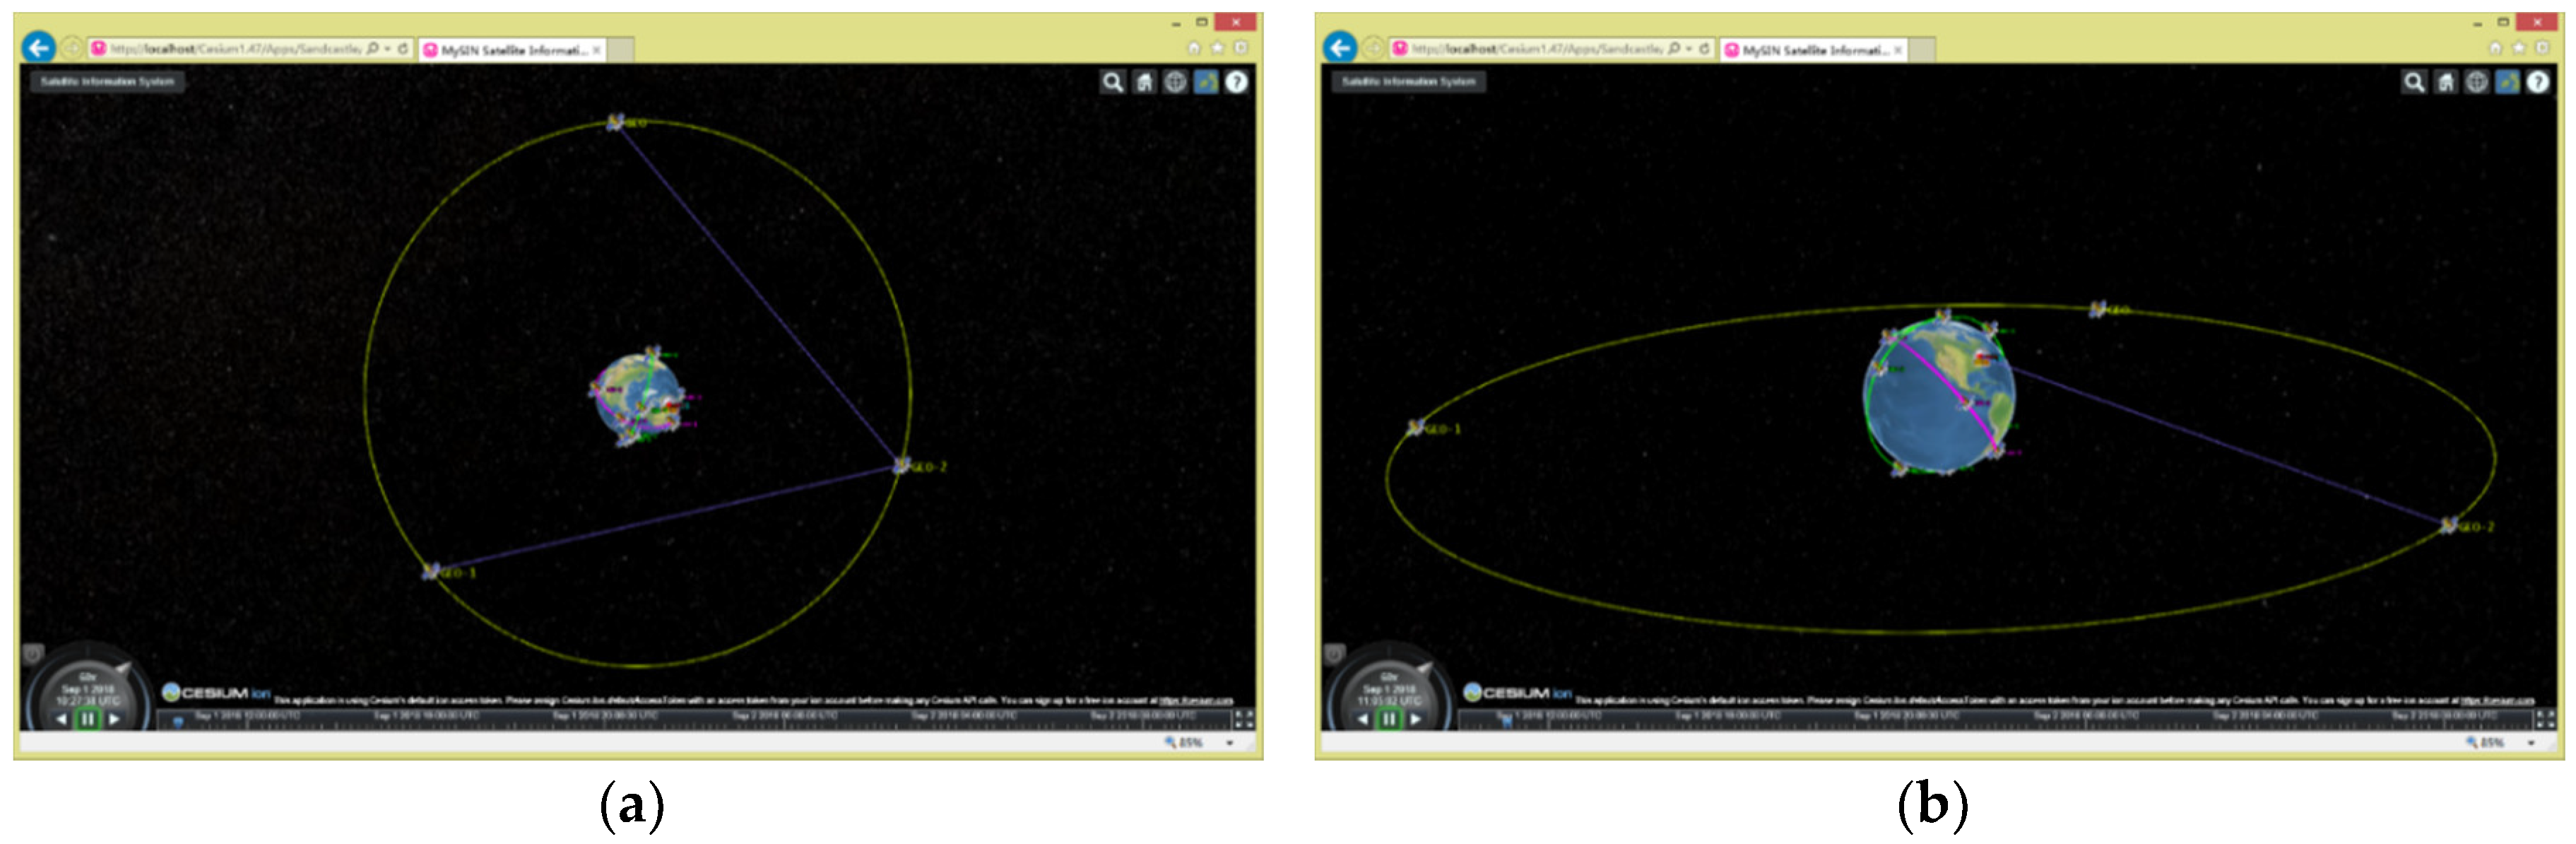
  • Function 1: GeoView can realistically simulate and demonstrate the composition and operational status of SIN, and it can achieve a stereoscopic display (3D) and planar display (2D). Meanwhile, the view also can display the relevant geospatial environment.
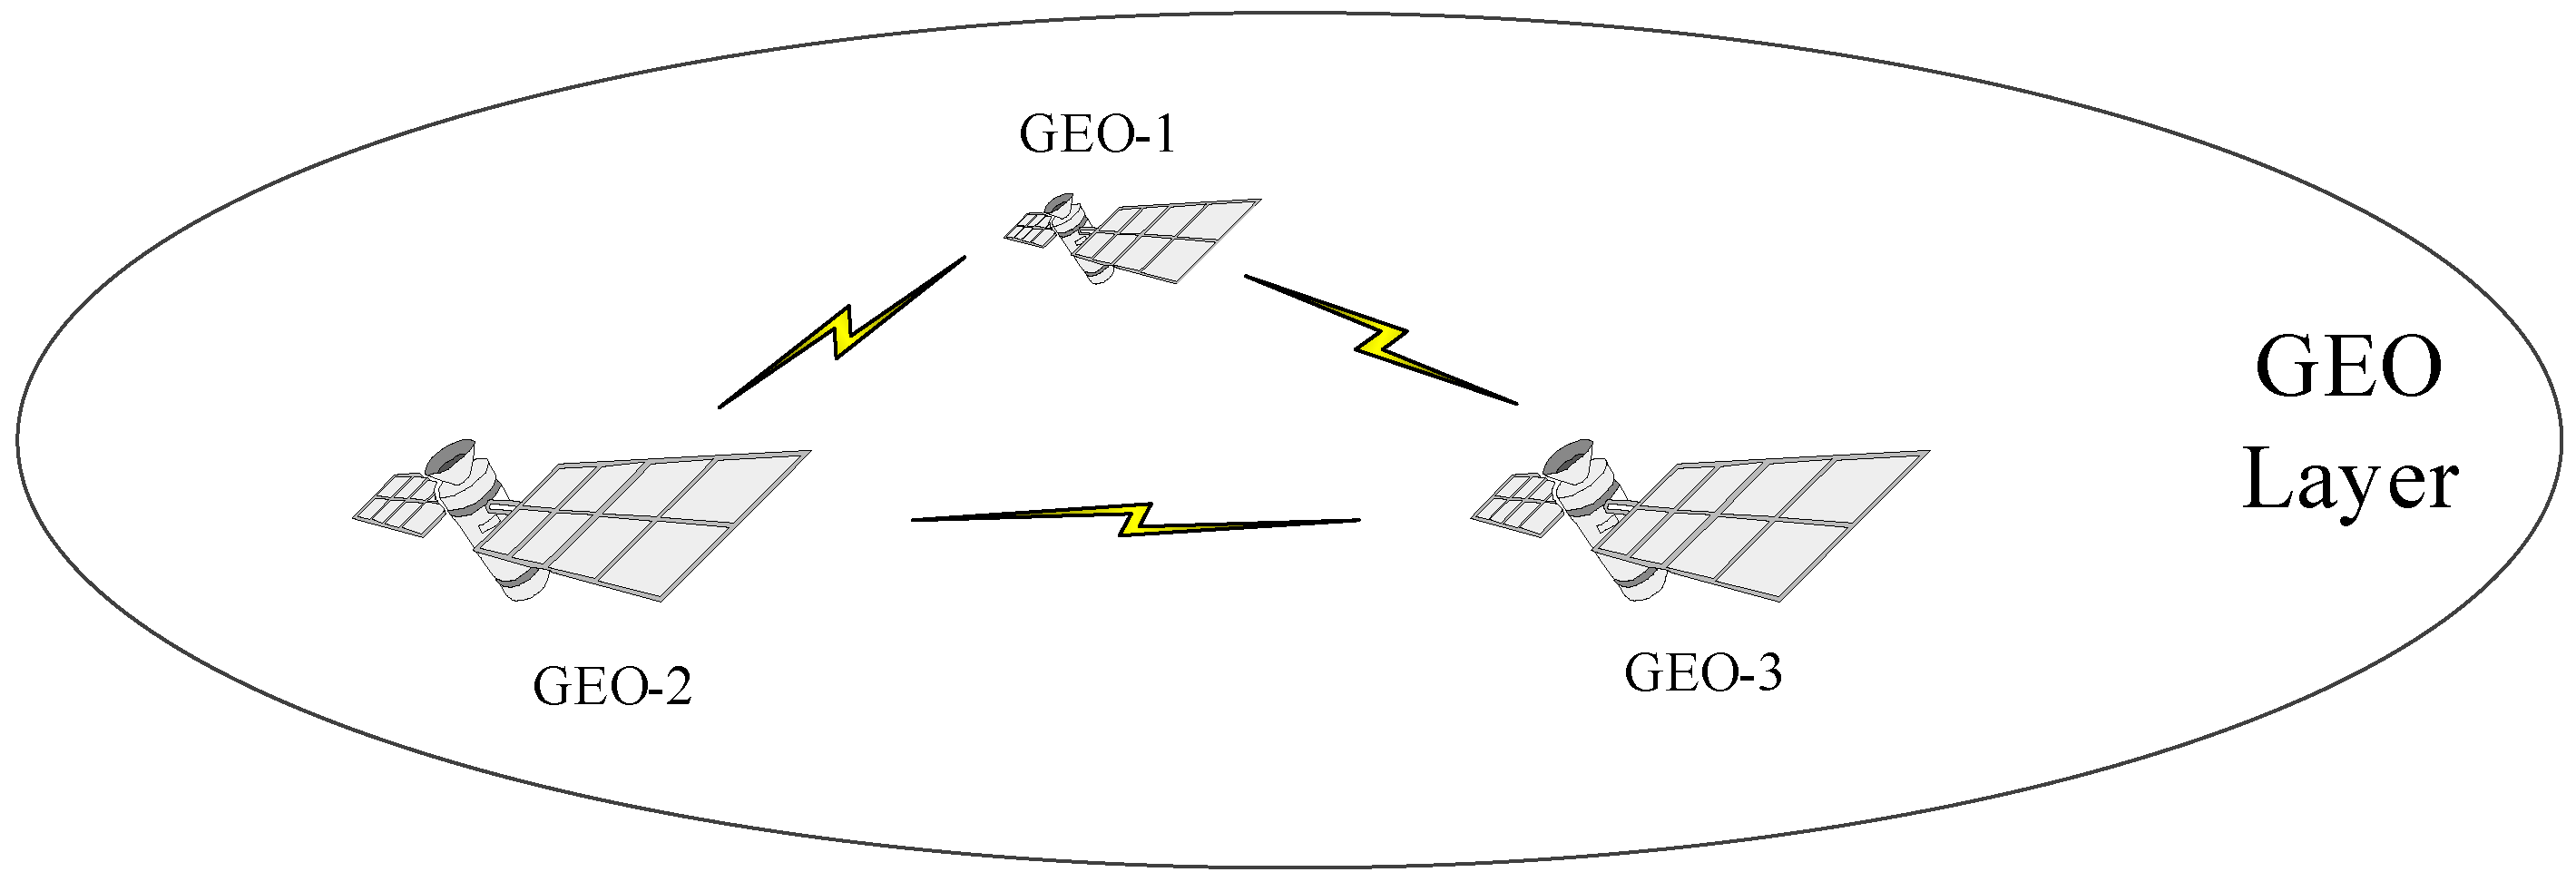
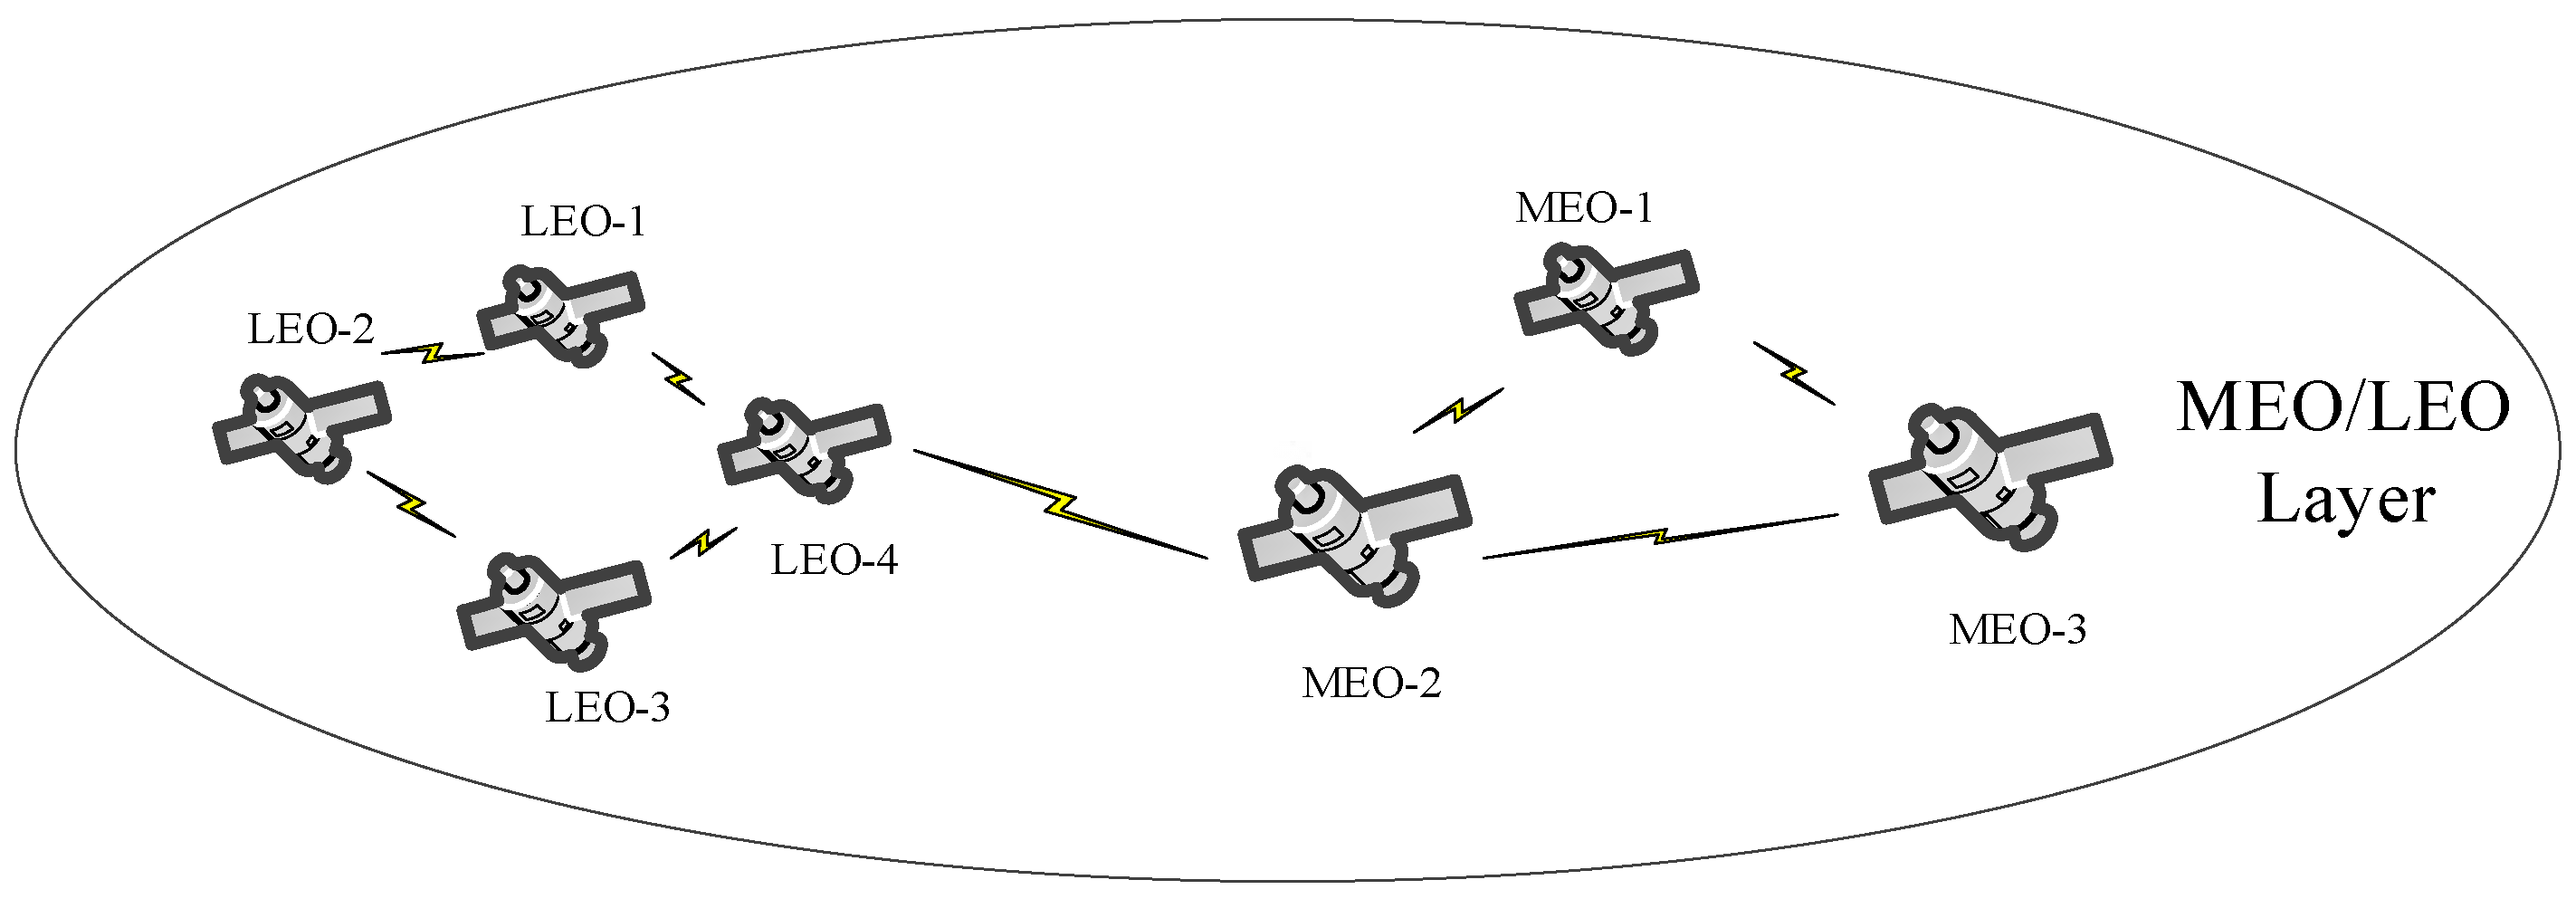
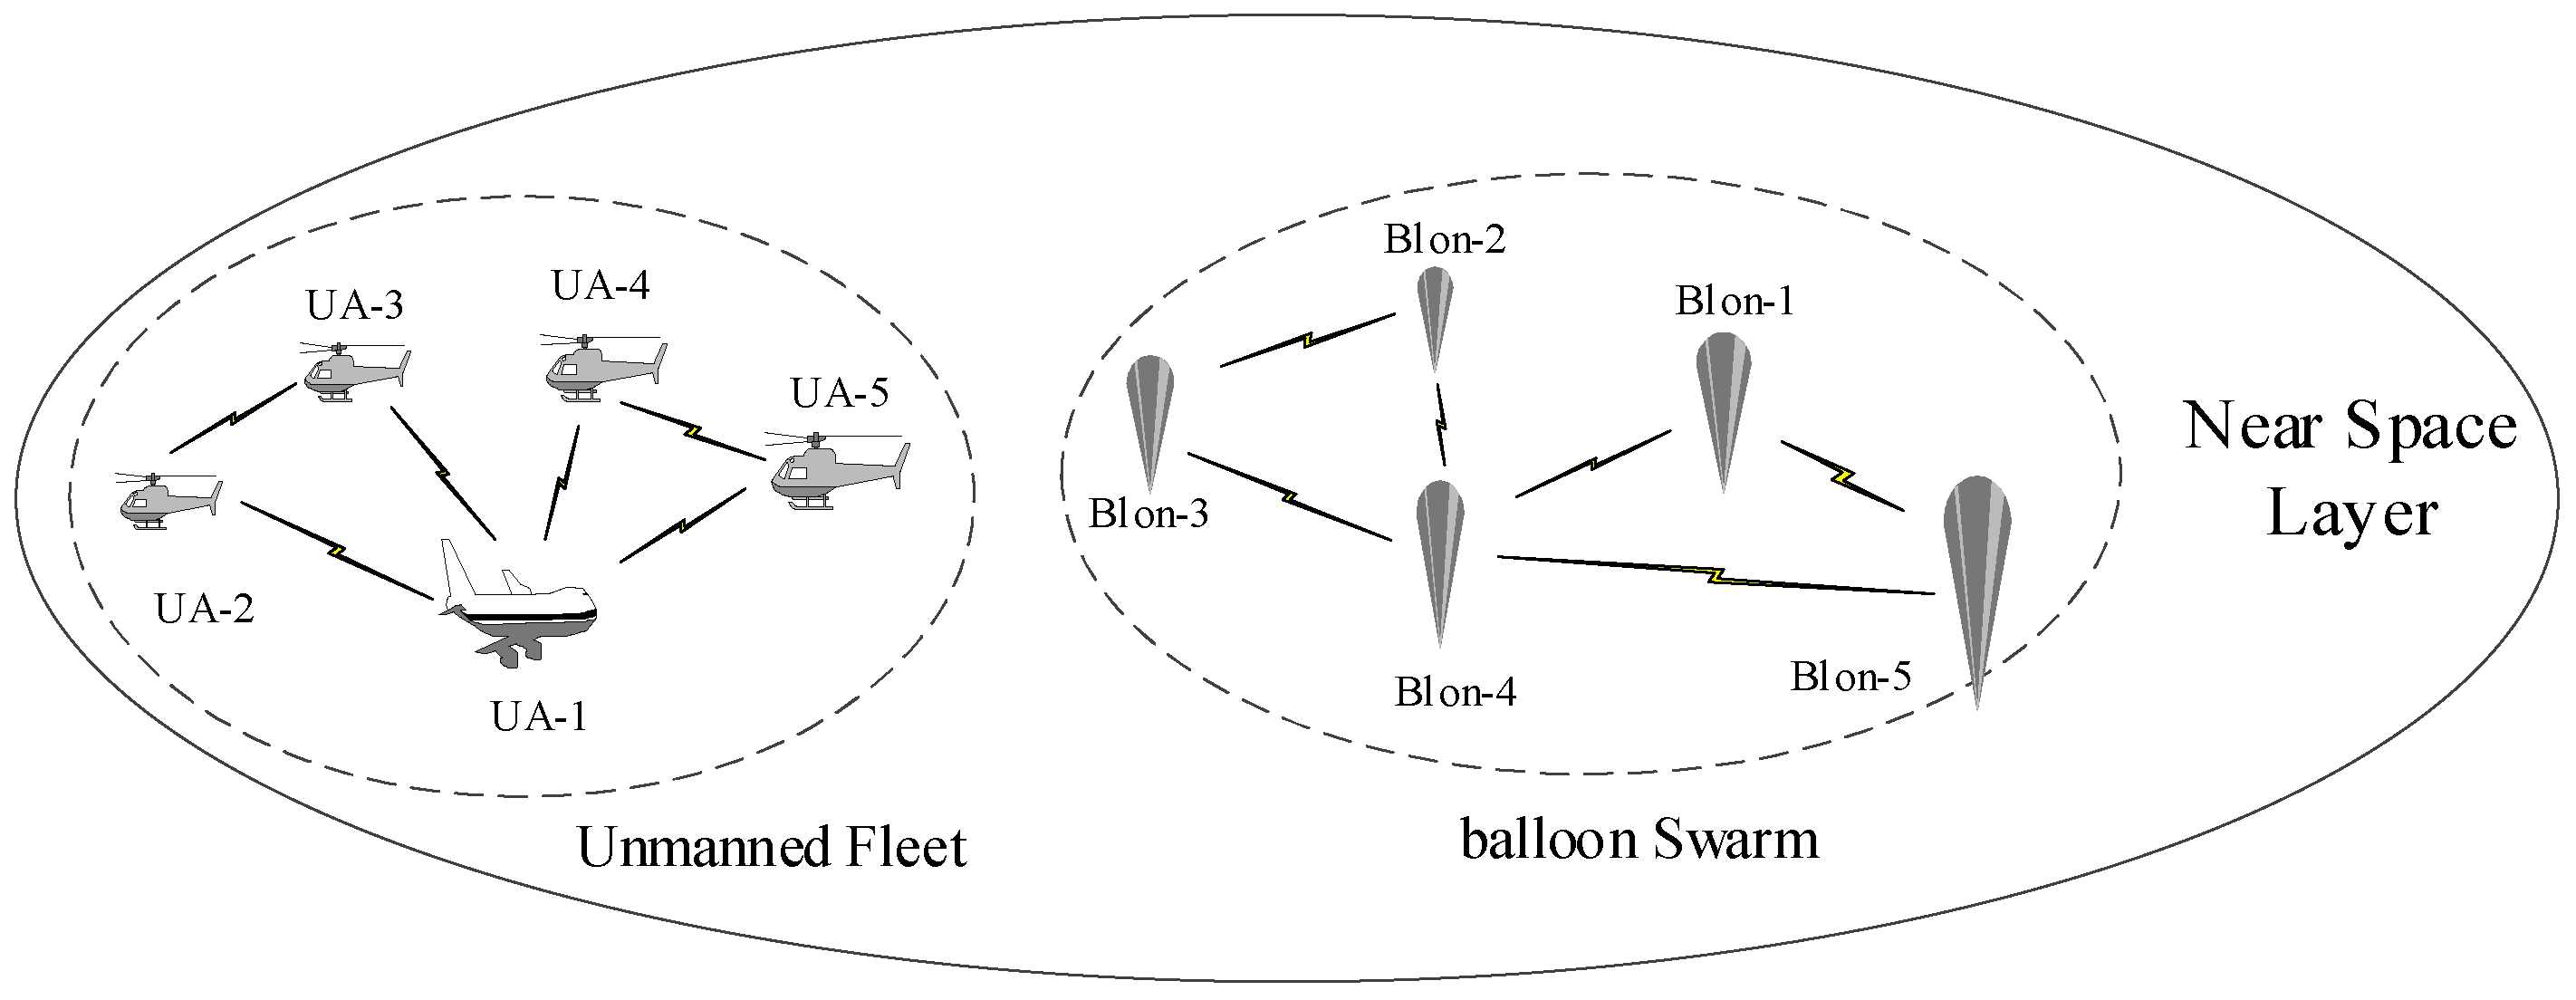
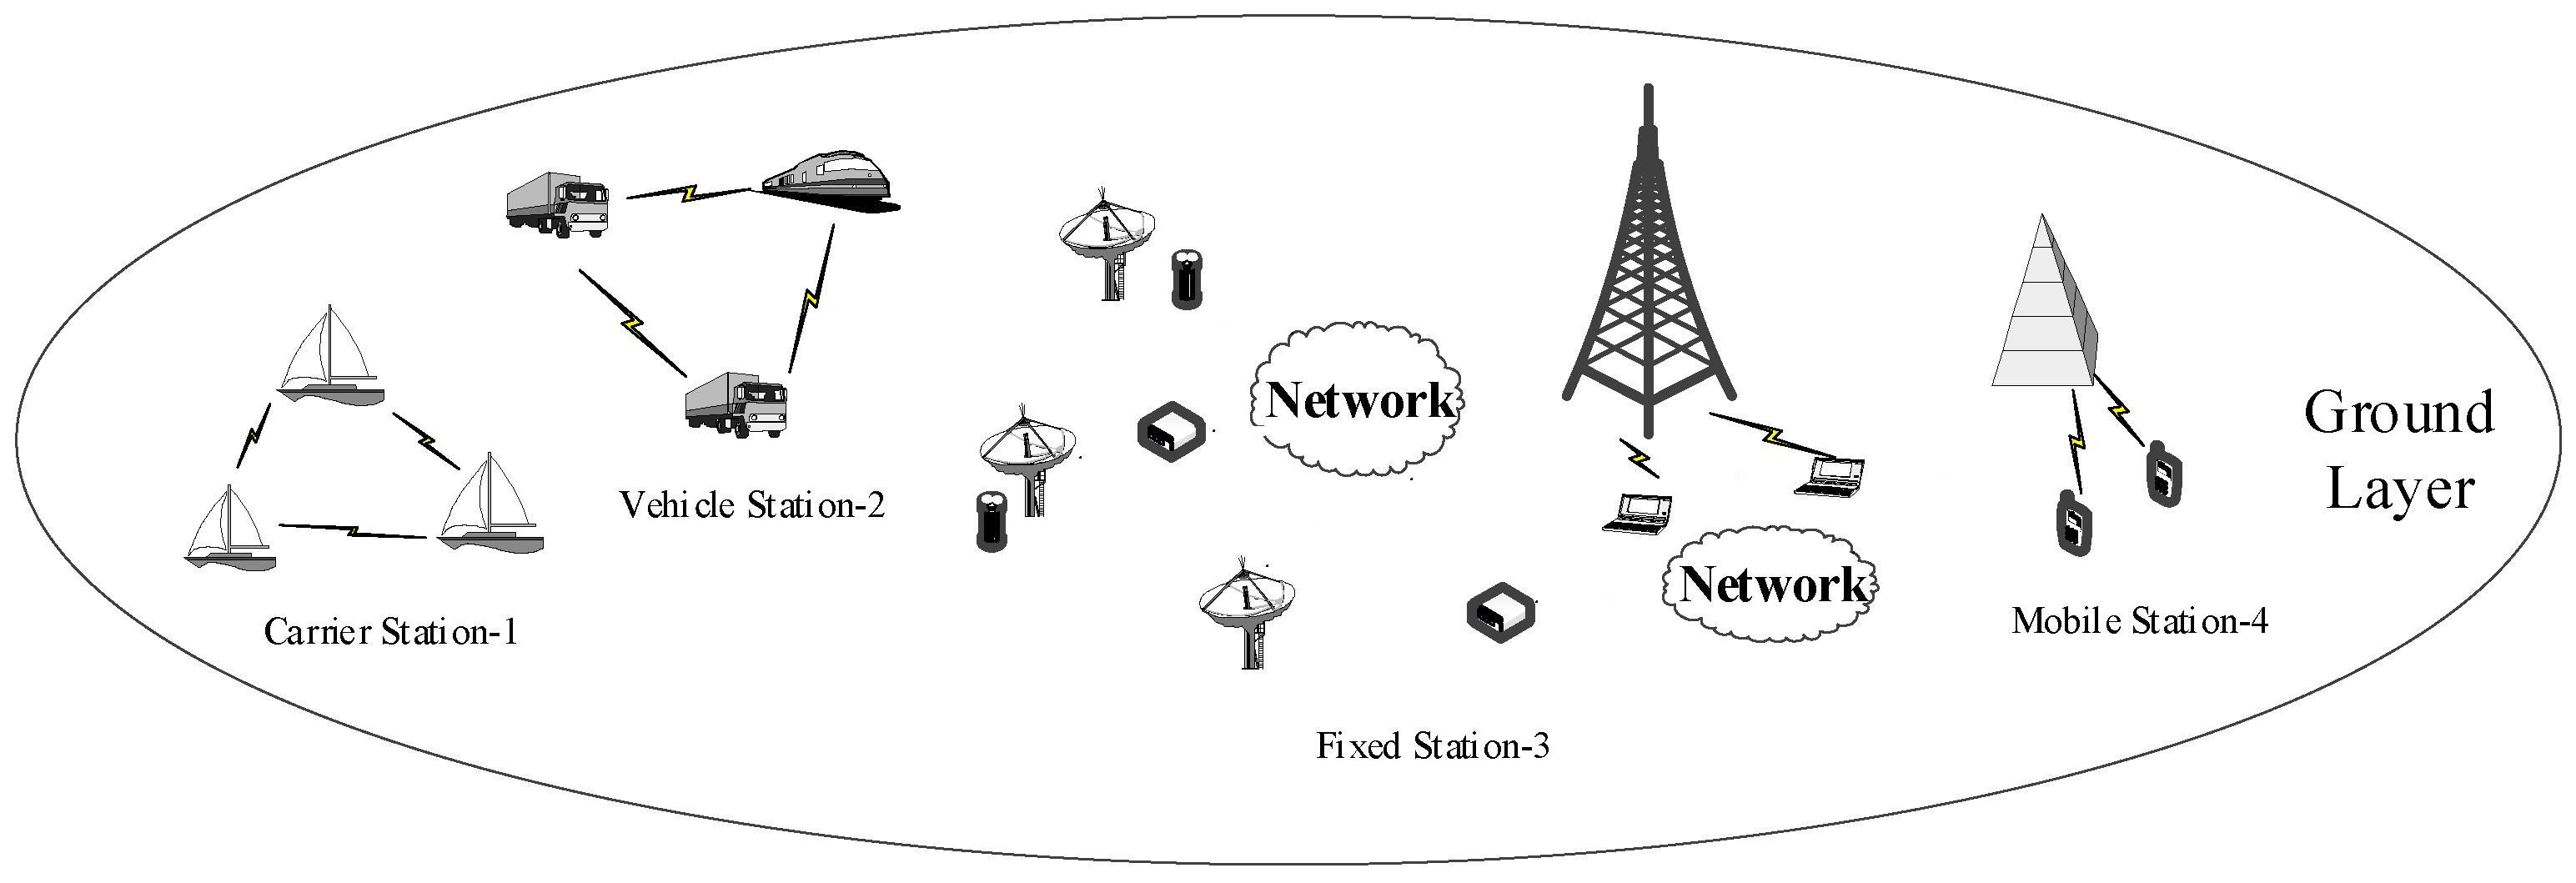
  • Function 2: GeoView can show the specific network structure and connection relations of the GEO layer satellite system and the MEO/LEO layer satellite system. It can show the orbit and coverage of the satellite systems. In addition, GeoView can display the group style, running mode, and coverage range of unmanned aircrafts (UAs) and the hot air balloons (HABs) in the Near Space layer information system. Meanwhile, it can also show the specific locations of Ground layer terminals and their connections with other information systems.
  • Function 3: GeoView can determine the parameters of visual elements by setting a hot zone, and demonstrating the dynamic transmission of data information among different links.
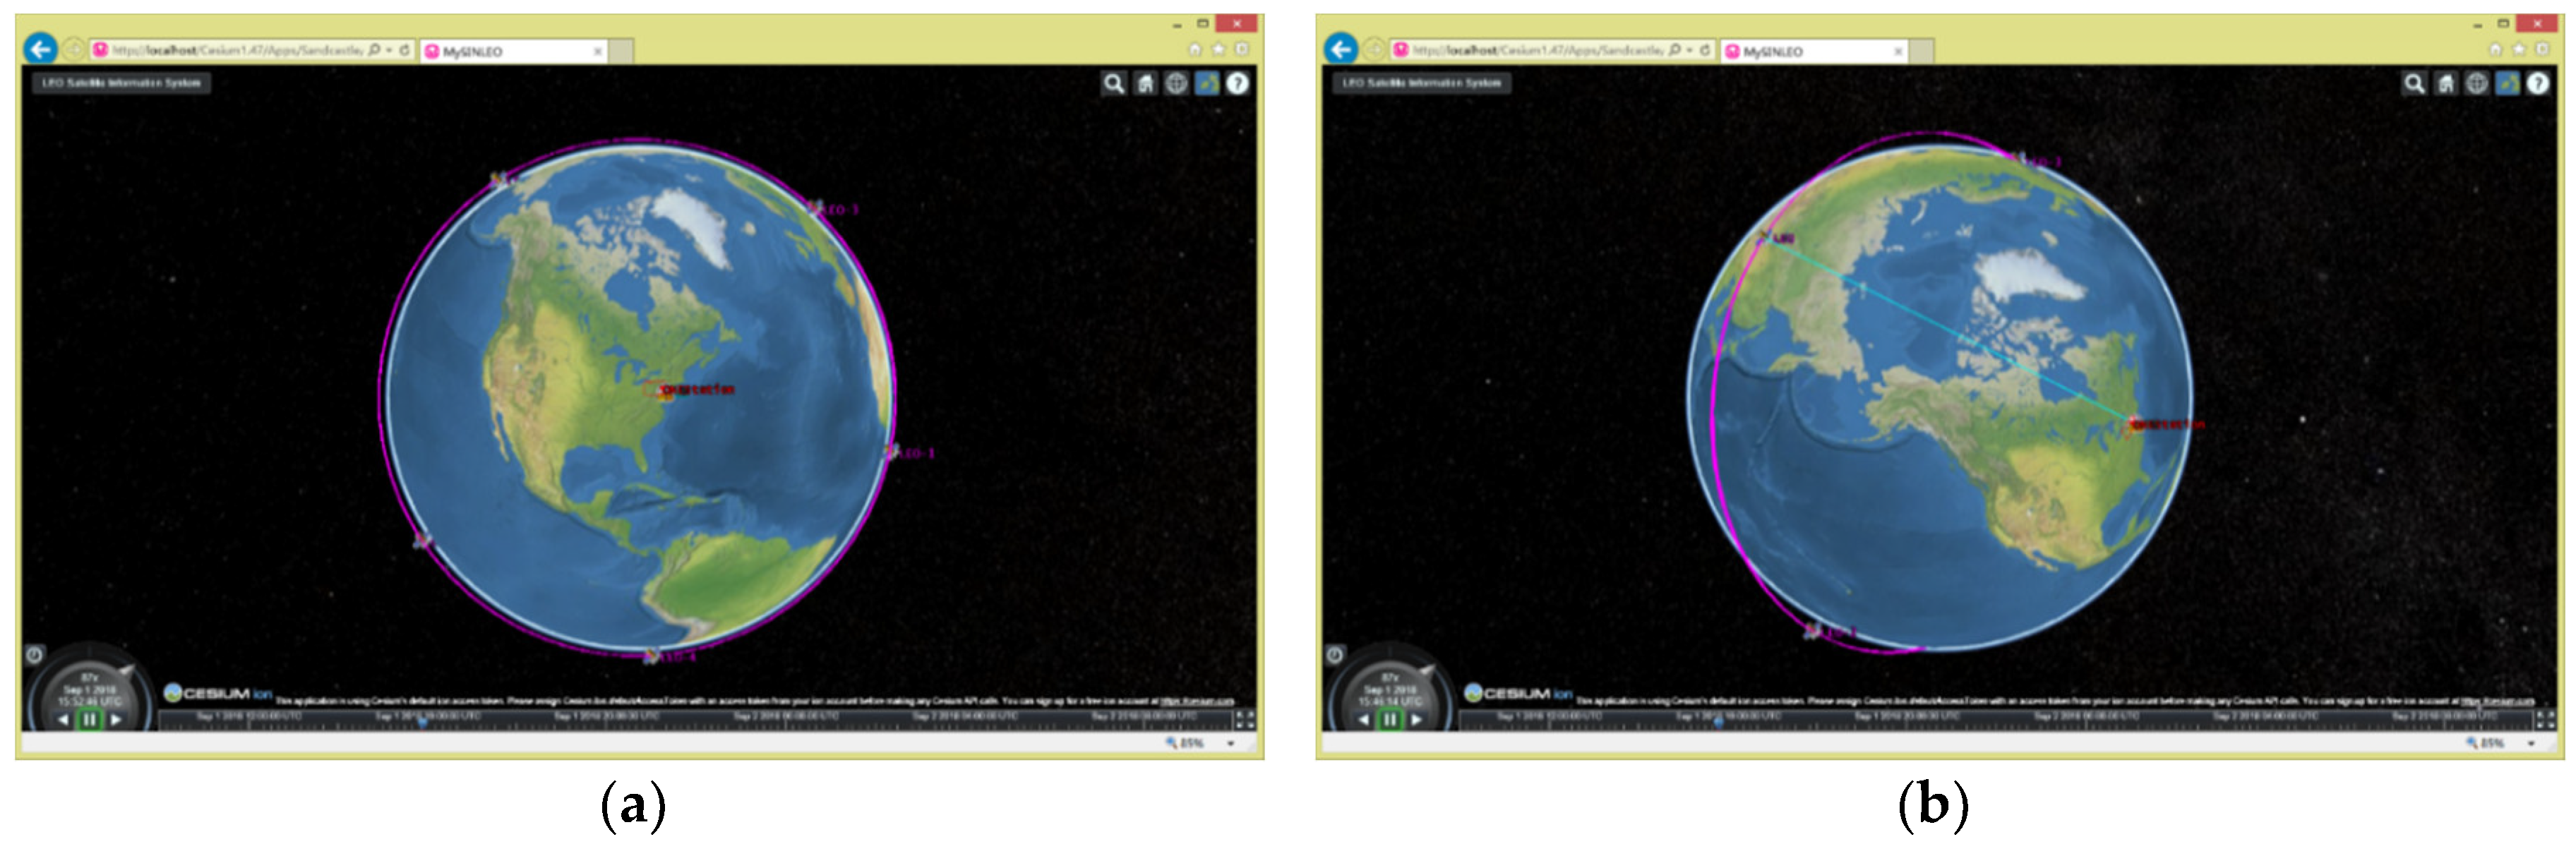
  • Function 4: GeoView can enable freely switching of 3D, 2.5D, and 2D information, and it can also switch multiple map backgrounds and operating environments. Meanwhile, it can realize the real-time synchronization of data information. Users can zoom in and zoom out of the views freely based on individual needs. This means that the overall view information can be displayed as well as the detailed view information, and the whole process will not cause the distortion of the view.
According to the users’ needs, we initially set the functions of GeoView in the entity domain presented above. Wherein, the functions may have repetition. In order to express different goals, and we carried out the elaboration separately. Of course, there are many more GeoView functions, and they can be developed and expanded according to the needs of users.

3.2.2. Descriptions of TopolView Functions

GeoView is responsible for the visual presentation and analysis of the entity domain. However, the expansion of SIN, and the increase in functions require an analysis of its topology structure and topology evolution. Therefore, it is necessary to make use of the ideas of the complex network. The space entities of SIN were mapped into network nodes, and relations between entities were abstracted as network links to analyze the network performance of SIN. Based on this, we designed TopolView in the topology domain. The aim of building the TopolView is to determine the network performance and network characteristics of SIN based on visual means, such as the importance of nodes, the key links, and the dynamic topology evolution laws. Therefore, we think that the TopolView should have the following functions.
  • Function 1: TopolView should show the complete topology structure of the SIN and realize the network expansion display of the four-layer structure. It should show the tight coupling relationships within the layers and the loosely coupled connections between the layers.
  • Function 2: TopolView should show the network features, such as the key nodes and important links of SIN, on the same page. The key nodes and important links are the core of the whole network, and they are the cornerstone of normal operation of SIN. Therefore, it is important for all people involved in the construction, development, maintenance, and management of SIN to master this information.
  • Function 3: TopolView should show the dynamic evolution laws of SIN. Under the guidance of topology evolution rules, including node increment, node deletion, link increment, and link deletion, it is possible to display the vibrations and changes in the network topology. Which are caused by the changes in nodes and edges in SIN. Within a certain time by the sliding of the time slice, it will keep a new stable state.
  • Function 4: TopolView should assist in the optimization of SIN through the cleanup of network topology-independent nodes and unrelated links, including the deletion of unimportant nodes and unrelated links. It should also optimize the SIN structure scale and reduce duplication in construction.
TopolView is the main research part of SINDVis. The simulation and display of the TopolView of SINDVis is an effective method and means to construct and manage the SIN for USE-2 and USE-3. Therefore, the dependency on TopolView is also strong. This section describes the four functions above in relation to the different requirements. Similar to the GeoView, the topology domain view has many more functions than those described above, and they can be developed and expanded according to the needs of users.
As discussed in the introduction, with the construction and development of SIN, its scale will increase continuously, and its structure will become more and more complex. Meanwhile, real-time changes in SIN topology will bring more uncertainties. All of them bring many challenges to the maintenance and management of SIN. In previous work, we established a weighted, dynamic evolution model based on local-world SIN [16]. The model combines the local-world phenomenon and edge-right features of SIN. However, the model only validates some characteristics of SIN from the network theory perspective. As we know, 70% of information acquired by people is done with the eyes. Meanwhile, visualization technologies not only formalize display views, but also can excavate hidden information behind views. Therefore, we think that we can also explore the dynamic evolution laws of SIN based on the dynamic visual view. Therefore, we initiated the idea of designing TopolView in the topology domain. On the one hand, TopolView can display the dynamic evolution processing of SIN. On the other hand, it can be used to analyze the changing relationships between the key nodes and core links of SIN. Based on this, the dynamic evolution laws of SIN can be summarized to provide some guidance for the construction, development, management, and maintenance of SIN. This also involves the specific implementation of visualization technologies to support the analysis of the network.

3.2.3. Description of the Fusion Usage of Views

As mentioned above, for multi-class users, the GeoView and TopolView complement each other. The principles of specific supplemental use are summarized as follows.
Firstly, The GeoView is the entity domain view, and when the scale of SIN is small, it is simple to show its composition structure and operation laws. However, the scale of SIN is constantly increasing, and the structure of SIN is becoming more complex. When the scale of SIN develops to a certain degree, the GeoView will only be able to display its constituent structure but will not analyze its operation laws.
Secondly, The TopolView is the topology domain view, and it is an abstract form with the space entities of SIN mapped into network nodes, and relations between entities are abstracted as the network links of SIN. The TopolView demonstrates the dynamic evolution process of SIN from a network perspective. Meanwhile, the dynamic evolution process is demonstrated without considering the scale of SIN. In addition, TopolView also can support the visual analysis of the changing relationships between the key nodes and core links of SIN.
To sum up, TopolView can be used to complement an insufficient GeoView with limited presentation. The GeoView can complement the abstract features of TopolView by providing an intuitive display. Therefore, only by using these two complementary views in combination can the SINDVis can play its role to the fullest.

3.3. GeoView Methods

As a scripting language, Cesium was created for a cross-platform virtual globe display by AGI (Analytical Graphics, Inc., Exton, PA, USA) in 2011. Initially, people primarily used Cesium for dynamic data visualization in space and defense industries. Later, Cesium gradually developed into a 3D map and is used in multi-fields, including geographical space, oil, gas, agriculture, entertainment, and sports [17]. According to data from Cesium’s homepage, over 140 cases have been successfully implemented based on Cesium.js. They cover space, defense, smart cities, geo-space, sports, entertainment, and so on. Combined with the functions of GeoView and the successful application of Cesium in other fields, the implementation of GeoView based on Cesium.js is feasible. Therefore, we implemented the GeoView based on Cesium.js in this study. The specific technologies are not discussed much in this section. However, because the GeoView is dynamic, the Cesium time panel was used to achieve time control, as shown in Figure 6.
As shown in Figure 6, the left part of Cesium time panel is the control panel, including the clockwise/counterclockwise, play/pause, and fast forward/slow operation buttons. The right side is the specific timeline display, where the default time interval was set as 24 h in this study.

3.4. TopolView Methods

As mentioned in Section 2.2 and Section 3.1, the realization of network dynamic visualization mainly consists of three aspects: network layout, network attribute visualization, and user interaction. Layout determines the network structure and is the most important element. Therefore, in accordance with the sequence above, we analyzed the theory and methods of realizing the TopolView. Therefore, we proposed an improved FDA layout method, discussed the FAT visualization method, and analyzed the P&Z interactive method. The specific implementation of the methods mentioned above is shown in Section 4.2.

3.4.1. FDA Layout

As the first step of visualization, the layout determines the basic structure of the network and is the premise and basis for follow-up work. Typically, the visualization layout is divided into nine kinds, including the layer layout, circular layout, time layout, relative space layout, cluster layout, map layout, manual layout, random layout, and Force-Directed Algorithm (FDA) layout [18]. According to the statistics of the layout algorithms published in a paper on the IEEE Visualization and Computer Graphics (TVCG) of network visualization, 72.12% of the articles used the FDA layout based on the elastic model. The main idea of the FDA layout is that all nodes are randomly arranged in two-dimensional space at the beginning, and the node positions are iteratively optimized by simulating the gravitational and repulsive forces in the physical model to improve the layout effect gradually. The advantages of the FDA layout are mainly embodied in two aspects, one is easy to implement in operation, and the other is easy to understand and explain in cognition. The FDA mainly includes a basic algorithm and its improvement, such as the Kamada–Kawai (KK) algorithm, the Davidson–Harel (DH) algorithm, the Fruchterman–Reingold (FR) algorithm or the multi-scale algorithm [18]. For the time-varying network visualization layout, the article [19] improves the FR algorithm and considers the connection and disconnection of the edge in the concrete operation. For the SIN, different space entities play different roles in the entity domain, and the different nodes have different degrees of importance in the mapping of the topology domain. However, the importance of nodes affects the connections of edges. An algorithm that highlights the nodes’ levels of importance can accurately reflect the real performance of SIN. In the preliminary study, we established the topology evolution rules for the topology evolution of SIN, and they include not only the connection and disconnection of edges, but also the increment and deletion of nodes.
Therefore, under the guidance of the topology evolution rules and the FR algorithm, we introduced clustering coefficients to calculate the importance of nodes and took node addition, node deletion, link addition, and link deletion into account to realize the effective layout of the dynamic visualization of SIN. The basic principle of the FR algorithm is the simulation of the motion of atoms and celestial bodies by analyzing the attraction and repulsion between the vertices and edges of the network. This method considers that there is attraction between the vertices and edges and that the vertices are mutually exclusive [19]. In the concrete implementation, spatial coordinate changes between the nodes are calculated by simulating the forces of the atom balls, and then the temperature variable and the cooling function are introduced, and the positions of all vertices are calculated by multiple iterations using the simulated annealing algorithm. The three steps taken to complete each iteration are as follows:
  • Step 1: Calculation of the repulsion forces between vertices and determination of the displacement vector (disp1) according to the repulsion forces.
  • Step 2: Calculation of the attraction and final displacement vector (disp2) according to the gravitational and displacement vector (disp1).
  • Step 3: Use of the cooling function to limit the range of motion of the vertex.
The FR algorithm optimizes the iterative calculation process by means of space grid partitioning. It reduces the computational complexity by considering the repulsion effect between the network nodes and the internal nodes of the adjacent network. For the problem of network dynamic visualization, we modified the FDA layout method based on the FR algorithm and achieved a dynamic layout by considering the phenomenon of node increment, node deletion, edge increment, and edge deletion.
For the phenomenon of the increment and deletion of edges in dynamic problems, we designed fade-in and fade-out functions and made the network edges increase or disappear in an orderly manner to allow the layout to be smoothly and dynamically changed. This follows the same principle as the FR algorithm, and assumes that the edges only affect attraction and do not affect the repulsion. M represents the number of iterations, and l represents an iterative index. The expressions of the fade-in and fade-out functions are
f i n ( d ) = d 2 ( l 1 ) k ( M 1 ) , 1 l M
f o u t ( d ) = d 2 ( M l ) k ( M 1 ) , 1 l M
where, for the fade-in function f i n ( d ) , the value of attraction is 0 when there is no connection, and the value of attraction is f a ( d ) in the last iteration, and for the fade-out function f o u t ( d ) , the value of attraction is f a ( d ) at the initial moment, and the value of attraction is 0 in the last iteration.
For the phenomenon of the increment and deletion of nodes in dynamic problems, because attraction and repulsion exist in each pair of nodes, the importance of nodes was considered in the improved algorithm. The attraction and repulsion between nodes depend not only on their distance, but also on the importance of nodes. When the new node v i joins, there is a connection with its neighboring node v j , and the attraction and repellant between the two nodes is affected by the node’s importance. Therefore, we introduced the clustering coefficients of complex networks [20] to calculate the importance of nodes, and the clustering coefficient was calculated as follows:
C i = 2 E i k i ( k i 1 )
where, k i indicates that there are k i edges connected to node i , and E i represents the number of edges between i and k i . Meanwhile, when k i = 0 or k i = 1 , then C i = 0 , and in order to avoid this situation, we improved C i by adding the number 1. The expression is
N C i = 2 E i k i ( k i 1 ) + 1 .
I M i j denotes the importance of nodes v i and v j , and the calculation formula is
I M i j = N C i + N C j .
After the introduction of I M i j , the attraction and repulsion between the nodes will change with the clustering coefficients, which is well in line with the real network situation.
The greater the I M i j is between nodes v i and v j , the greater the attraction between them is and the smaller the repulsion is, or vice versa. Therefore, the attraction between the nodes should be proportional to the I M i j , and the repellant should be inversely related to the I M i j . Therefore, to improve the Formula (1), there is
{ f a i m ( d ) = I M i j · d 2 / k f r i m ( d ) = 1 I M i j · k 2 / d
where, f a i m and f r i m respectively represent attraction and repulsion, considering the nodes’ levels of importance. When node v i is deleted, the attraction and repulsion between the nodes connected to it disappear, which is relatively simple and has not been explored much.
According to the dynamic evolution rule of SIN, we proposed an improved FDA layout method based on the FR algorithm. Similar to other improved methods of the FDA layout, we think that this improved FDA layout method also belongs to the FDA family. Therefore, we categorized this section as having an FDA layout. In the implementation algorithm of the improved FDA layout method, we separated the node and the edge, and this part did not have a specific display. This section, combined with the characteristics of the dynamic change of SIN, we have described the design of the improved FDA layout based on the FR algorithm and on the foundation for the SIN dynamic visualization. Next, we describe the visualization method.

3.4.2. FAT Visualization

Dynamic visualization plays a key role in network performance analysis, but due to the complexity of dynamic data, the evolution process visualization is difficult to determine. Overall, the realization methods of dynamic visualization are generally divided into two categories including animation and timeline [13], and they have also become the current mainstream form. Figure 7 shows a detailed list of methods for implementing dynamic visualization.
As shown in Figure 7, the animation method maps time information to the time domain and user analyzes the dynamic network fluctuation mode by observing and analyzing the animation. This method requires the user to remember the differences between the network structure and time step, and then analyze the fluctuation mode of the dynamic network. Therefore, the key to the method is determining how to keep the user’s mind map at the same time as the network mutation. Animation methods mainly include two aspects: online and offline [8]. The timeline method maps time to the space domain, and users need to observe several snapshots at the same time to determine the difference by comparing the differences between each other. As the scope of the screen is limited, when there are many time steps, it is difficult to display all of network information at the same time, and this is the main difficulty of this method. The timeline consists mainly of node-links, adjacency matrices, and lists three methods.
As mentioned above, the development of visualization gradually highlights the application-driven characteristics. Only by fully considering the characteristics of SIN can the visualization be more effective. The local-world phenomenon edge-weight evolution of SIN is the key factor in studying the topological evolution of SIN [16], and the main objective of dynamic visualization is to analyze its topological evolution laws by a formal means. Therefore, we also need to focus on the analysis of the above-mentioned characteristics.
Data transmission is different depending on the SIN transmission direction, so, we needed to consider the transmission directionality; this part is introduced in Section 4. The dynamic changes in SIN mainly include the addition and deletion of nodes, the addition and deletion of edges, and so on. Through analyzing the advantages and disadvantages of the above methods, combined with the characteristics of the topological evolution of SIN, we tried to achieve the dynamic evolution visualization of SIN by fusing the animation and the time line method named FAT. Figure 8 shows a schematic diagram of the evolution of the local-world and edge-weight of SIN.
As shown above, Figure 8a–d are the evolutionary mechanisms for node increment, node deletion, edge increase, and edge deletion. Figure 8e represents the mechanism of the edge-weight evolution. The future sequence of SIN is unknown, forcing us to rely on online methods to determine its animation form. The use of gradual transition and other transitional technologies to protect the user’s mind map does not allow violent shocks so achieves an effective animation display.
For the local-world phenomenon of SIN, it is necessary to highlight the differences between the outside local-world and inside local-world, and there is a typical preferential connection mechanism in the local-world. Therefore, we need the constraint of double coding to highlight the similarities and differences between the factors outside and inside the local-world. Based on the relevant principle of centroid constraint in the community network [21], we produced a visual view of the local-world phenomenon in the SIN. The typical characteristic of the local-world is the preferential connection mechanism, and the centroid constraint is used to make the network nodes move closer to the centroid of their community and to realize the aggregation effect in the geometric space. Therefore, the above two aspects have the same effect on the display. The multi-centroid constraint diagram is shown in Figure 9.
The centroid constraint is implemented based on FDA and the effect of clustering and clustering is formed under the action of nodal centroid attraction [22]. Therefore, the centroid constraint concretely implements the content same strain with FDA, which also provides the possibility for practice in this paper. Considering the local-world has C r = { v i , , v k } , and the location of its arbitrary node v t is ( x t , y t ) , the position of the centroid v r inside the local-world C r is v r = ( x r , y r ) , and there is
{ x r = 1 k i = 1 k x t y r = 1 k i = 1 k y t .
Assuming that the constrained attraction of the node v t is f ( v r ) , and the direction of the current node points to the centroid, there is
f ( v r ) = d × s t r e n g t h ( C r )
where, d is the distance from the node v t to the centroid v t of the local-world, and s t r e n g t h ( C r ) is the attraction strength. Therefore, there is
d = | | v t v r | | = d x 2 d y 2 = ( x t x r ) 2 ( y t y r ) 2 .
Combining Equation (8), the constrained attraction of v t in the x-direction and y-direction, respectively, gives
{ f ( v r ) X = d x d × f ( v r ) = d x × s t r e n g t h ( C r ) f ( v r ) Y = d y d × f ( v r ) = d y × s t r e n g t h ( C r ) .
Along the same vein, we can obtain the constrained attraction of other nodes v j of C r and other local-world regions. Therefore, the resultant force of the v t after considering the constrained attraction is
f = f ( v r ) + f a + f r .
For the phenomenon of the edge-weight evolution of SIN, we intended to construct the visual view by double coding including the thickness and color of the connection curve. Because this part is easier, we do not discuss it in detail.
In the visual view of GeoView, the time of the current scene is displayed and controlled by the “widget Cesium timeline”. In order to correspond to the view of GeoView, we also added a timeline in the visual view of TopolView for the user to manipulate and track the details of the network evolution of interest to the user in different moments or periods. Therefore, we designed and added the timeline module in TopolView, as shown in Figure 10.
As shown in Figure 10, the timeline module of TopolView consists mainly of two parts: A is the control module including play/pause and fast forward/rewind, and B is the time bar which is used to display moment and time fragments.
To sum up, this section discussed the theory of FAT visualization including the specific theoretical components and implementation methods. Since the implementation of FAT is based on improved FDA, the FAT visualization algorithm is no longer specific.

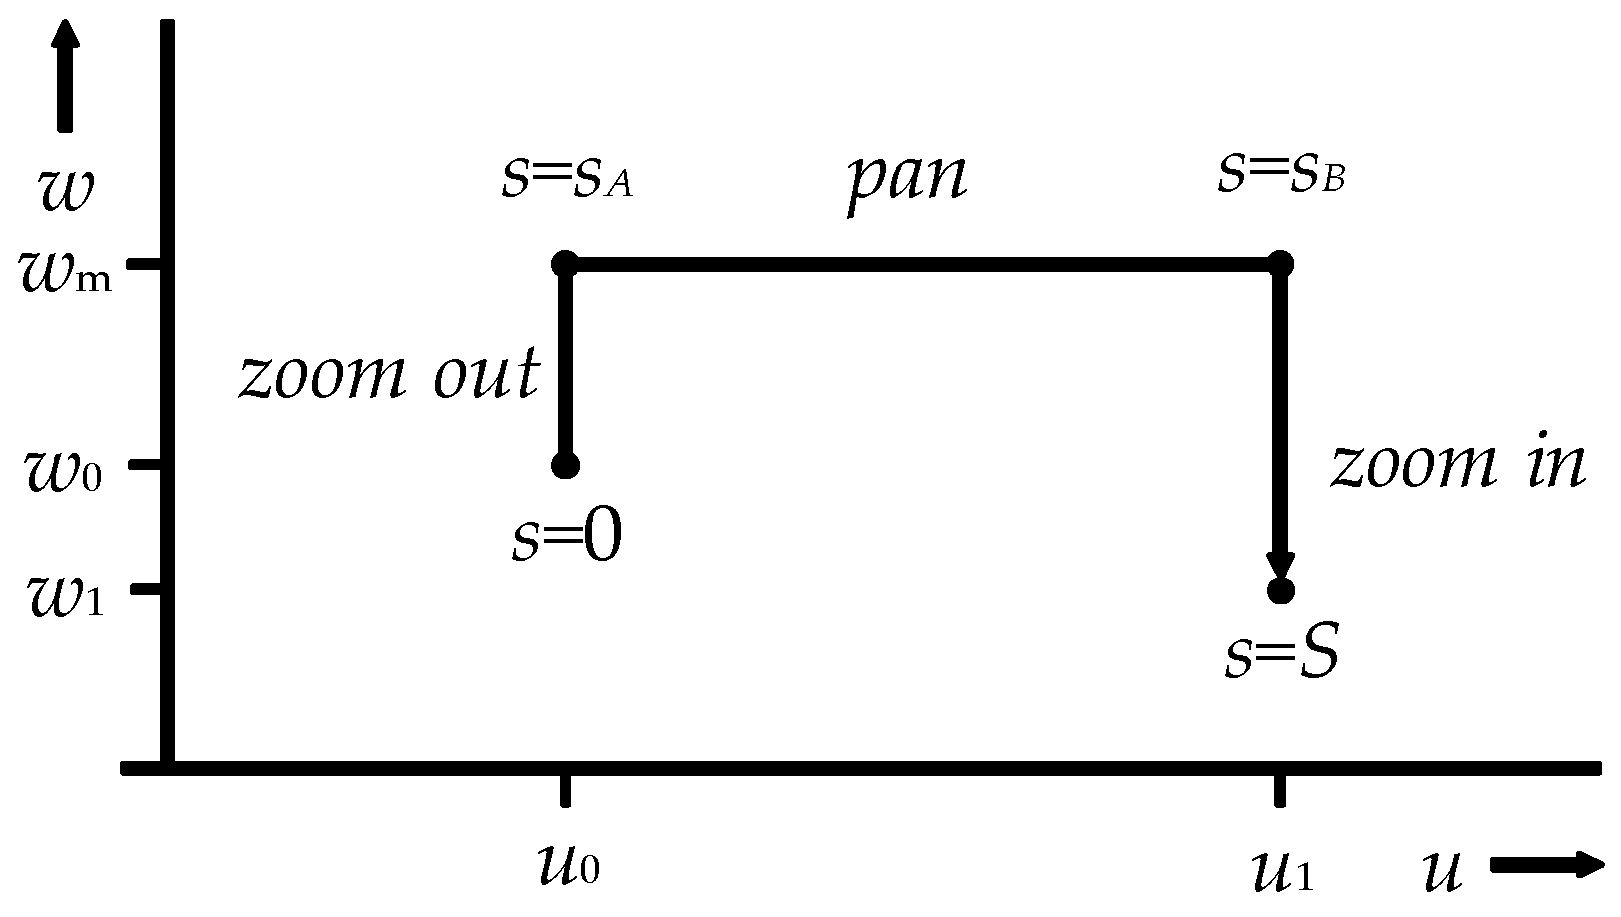
3.4.3. P&Z Interaction

Interaction technology is inseparable from the visual analysis, and all interaction technologies are only meaningful when combined with a visual interface. There are some representative technologies of interactive visual analysis of detailed information, and most of them are based on deformation technology.
As shown in Table 1, the current interactive techniques commonly used in the field of visualization can be summed up by the following categories: ① fisheye views, ② focus and context, ③ overview and details, ④ panning and zooming, ⑤ multiple coordinated views, and so on [23]. We carried out a detailed review of the above-mentioned methods in previous research work [4,13], and we do not elaborate much on it in this section. Admittedly, the canvas area used to draw the network dynamic topology is limited, and the nodes and edges of the SIN topology have a certain scale. To clearly display all the information in the TopolView, we used the panning and zooming (P&Z) interactive technology to realize the dynamic interactive function of the user.
P&Z is an interactive technology, and it solves the problem of fitting large amounts of data onto a smaller screen [24]. In this study, we borrowed the P&Z interaction model proposed by Wijk and Nuij to implement the TopolView; the basic principles are shown in Figure 11.
As shown in Figure 11, path s represents the reduction from 0 to s A , that is, from ( u 0 , w 0 ) to ( u 0 , w m ) . Path s is translated from s B to S , that is, from ( u 1 , w m ) to ( u 1 , w 1 ) . Wijk and Nuij completed path optimization work based on the above-mentioned basic principles, as shown in the following equations [25]:
u ( s ) = { u 0 ,                                   s [ 0 , s A ) w m ( s s A ) ρ + u 0 ,           s [ s A , s B ) u 1 ,                                   s [ s B , S ]
w ( s ) = { w 0 e x p ( ρ s ) ,                           s [ 0 , s A ) w m ,                                       s [ s A , s B ) w m e x p ( ρ ( s B s ) ) ,             s [ s B , S ]
{ s A = l n ( w m w 0 ) ρ s B = s A + ρ ( u 1 u 0 ) w m S = s B + l n ( w m w 1 ) ρ ,
where, u ( s ) means to pan along a straight line, and w m = m a x ( w 0 , w 1 , ρ 2 ( u 1 u 0 ) / 2 ) . ρ depends on the user’s subjective feelings, and when the value of ρ is different, the moving path is different when moving from point A to point B, and the gap is more obvious.
In summary, based on the smooth and efficient P&Z method proposed by predecessors [25,26], we analyzed the visualization interaction problem of TopolView in SIN. To implement the TopolView based on the P&Z method, we used the improved FDA and the FAT method described above. Next, we describe the specific implementation of GeoView and the TopolView.

4. Results

The purpose of this section is to describe the analysis of the validity and feasibility of the previously proposed model from both theory and simulation perspectives. Because the implementation mechanisms of the entity domain view and topology domain view are different, we introduce them separately.

4.1. GeoView Implementation

For the entity domain of SINDVis, firstly, we introduce the experimental platform and the operating environment, and then carry out the implementation of the methods based on Cesium; the specific content is as follows.

4.1.1. Experimental Platform and Operating Environment

The specific experimental platform and operating environment are as follows:
  • Operating system: Windows 8.1 Professional edition_x64;
  • Processor: Intel (R) Core (TM) i7-4790 [email protected] GHz;
  • Memory (RAM): 8 GB;
  • Graphics: NVIDIA GeForce GTX 745;
  • Local server: wampserver3.0.6_x64;
  • Browser: Internet Explorer, Avast Secure Browser, Google Chrome;
  • Development tools: Brackets, Atom, Adobe Dreamweaver CS6, Eclipse, Cesium.js.

4.1.2. GeoView Function Implementation

As described in Section 3.2.1, we used the LEO satellite system as an example to determine the whole function of the system. It was assumed that the LEO satellite system consists of five LEO satellites and one ground station. The GeoView not only supports a 3D view display, but also supports 2.5D and 2D view modes, and users can switch between pages.
Figure 12a shows the specific network form of the LEO satellite system from the ground station point, and the purple curve in the diagram shows the orbit of the satellite in the information system. When the satellite is operating in an effective range with the ground station, the satellite is connected with the station and the data is transmitted, as shown in the cyan line in Figure 12b. Figure 12c shows the 2.5D view, and Figure 12d shows the 2D view, in which the purple curve is the orbit of the satellite.
Based on LEO satellite information system, an MEO/LEO satellite system based on MEO/LEO constellation can be realized by increasing the MEO constellation. In this section, six MEO satellites were added to construct the MEO/LEO satellite information system based on the LEO satellite information system, as shown in Figure 13.
As shown in Figure 13, the green curve is the orbit of the MEO satellite in Figure 13a, and it shows the satellite layout and the specific distribution of the MEO constellation. When the MEO satellites and LEO satellites run into a valid range, they are connected to each other for data transmission. The green line in Figure 13b shows that the MEO satellite and LEO satellite are transmitting data.
Based on the above-mentioned system, we built the integral satellite information system by adding the GEO satellite information system. By considering the characteristics of GEO satellites, we used three GEO satellites, evenly distributed in the GEO orbit, to establish full coverage of the GEO satellite information system, as shown in Figure 14.
In Figure 14, the yellow curve is the orbit of the GEO satellite, and Figure 14a,b show the connections between the GEO satellites and the data transmission status of GEO-2 and the ground station named BS. The purple line in the diagram is the transmission link. Thus, now, we have established the satellite information system of the SIN. Compared to the four-story structure of the Near Space layer, due to its particular structure and location and the page range limitation of the SINDVis system, the specific network situation is not clear in the overall view of Near Space.
Next, we use the HABs as an example to display the concrete network of the Near Space layer information system. For terrain complex areas, people can only rely on the Hab group to complete the task. Therefore, we chose the terrain complex mountainous area as the background environment, with 12 HABs forming a group, as shown in Figure 15.
As shown in Figure 15, by loading the balloon model in the Cesium library, a balloon swarm is constructed with 12 balloons. We selected the balloon surrounded in the green box as a data transmission center that can connect with the ground station and 11 other balloons.
To sum up, combining the architecture of SIN and the function of view in GeoView in the entity domain, we constructed the GeoView. The GeoView and TopolView complement each other, and mainly demonstrate the specific composition and structure of the SIN from the physical entity perspective to let users have an intuitive visual experience of SIN. Meanwhile, the web-oriented model developed in this paper is more popular and more convenient for Internet-based users. Based on Cesium.js for the display of entity domain view of SIN, there many ancillary functions can be developed. The purpose of this section was only to carry out mapping with the SIN architecture and the basic functions of GeoView. Its subsidiary functions will be further developed in future studies, and we have not elaborated on them too much in this section.

4.2. TopolView Implementation

For the topology domain of SINDVis, firstly, we introduce the experimental platform and the operating environment. Then, we carry out the implementation of the methods from the layout, visualization and interaction perspectives. The specific content is as follows.

4.2.1. Experimental Platform and Operating Environment

The specific experimental platform and operating environment are as follows:
  • Operating system: Windows 8.1 Professional edition_x64;
  • Processor: Intel (R) Core (TM) i7-4790 [email protected] GHz;
  • Memory (RAM): 8 GB;
  • Graphics: NVIDIA GeForce GTX 745;
  • Local server: wampserver3.0.6_x64;
  • Browser: Internet Explorer, Avast Secure Browser, Google Chrome;
  • Development tools: Brackets, Atom, Adobe Dreamweaver CS6, Eclipse, D3.js, Vis.js, Echarts.js, Cytoscape.js.

4.2.2. TopolView Function Implementation

As described in Section 3.2.2, we show the overall structure of the SIN in the topology domain; that is, the entity and connection relationships are mapped to the nodes and the edges respectively to show their relational structure.
Corresponding to Section 4.1.2, it is assumed that the SIN consists of the following components: three GEO satellites (ref.: GEO_1~GEO_3), six MEO satellites (ref.: MEO_1~MEO_6), five LEO satellites (ref. LEO_1~LEO_5), 10 hot air balloons (ref.: Hab_1~Hab_10) and two ground stations (ref.: F_1~f_2). This is in accordance with others in terms of the connection rules. A formation schematic diagram of the initial topology is shown in Figure 16.
Figure 16 shows the dynamic networking of SIN in the SINDVis system from a topology domain perspective. Based on the architecture of the SIN that was discussed earlier, the basic elements of the SIN, including the GEO, MEO and LEO satellite systems and ground stations, are presented at the initial moment in diagram (a), and we assume that the internal connection relationship is established. Figure 16b demonstrates the process of connecting the MEO satellite system and the LEO satellite system to form a MEO/LEO-layer satellite system. Figure 16c shows a three-layer, interconnected SIN consisting of the GEO-layer satellite system, the MEO/LEO-layer satellite system, and the ground station, and to solve the problem of the Near Space layer, the Hab group is added to represent the Near Space layer information system. As shown in Figure 16d, the Near Space layer information system is connected to the entire network, and then the prototype of SIN is formed.
Next, we show the specific evolution of the SIN TopolView and demonstrate the dynamic interaction capabilities of the SINDVis system.
In Figure 17, Figure 17a shows the interactions between the user and the node. When the user puts the mouse over a node, the details of the node appear at the top right of the page, including the node name, node degree, output stream, and input stream. The detailed information is hidden when the mouse is moved. Figure 17b shows the interactions between the user and the edge. When the user puts the mouse over a connecting edge, information about the edge of the details, including the target node and the source node’s name and the connection level appear in the upper right of the page. The detailed information is hidden when the mouse is moved. Figure 17c shows a translation of the interactive function. To display only the details of the GEO layer on the page, the other parts of the network can be translated out of the visual page. Figure 17d shows a zoom function based on Figure 16d, that is, it displays details on the same size page by scrolling the mouse to zoom in the page.
By combining the content shown in Figure 16 and Figure 17, the partial functionality of the TopolView for the SINDVis system can be described as a whole, as follows:
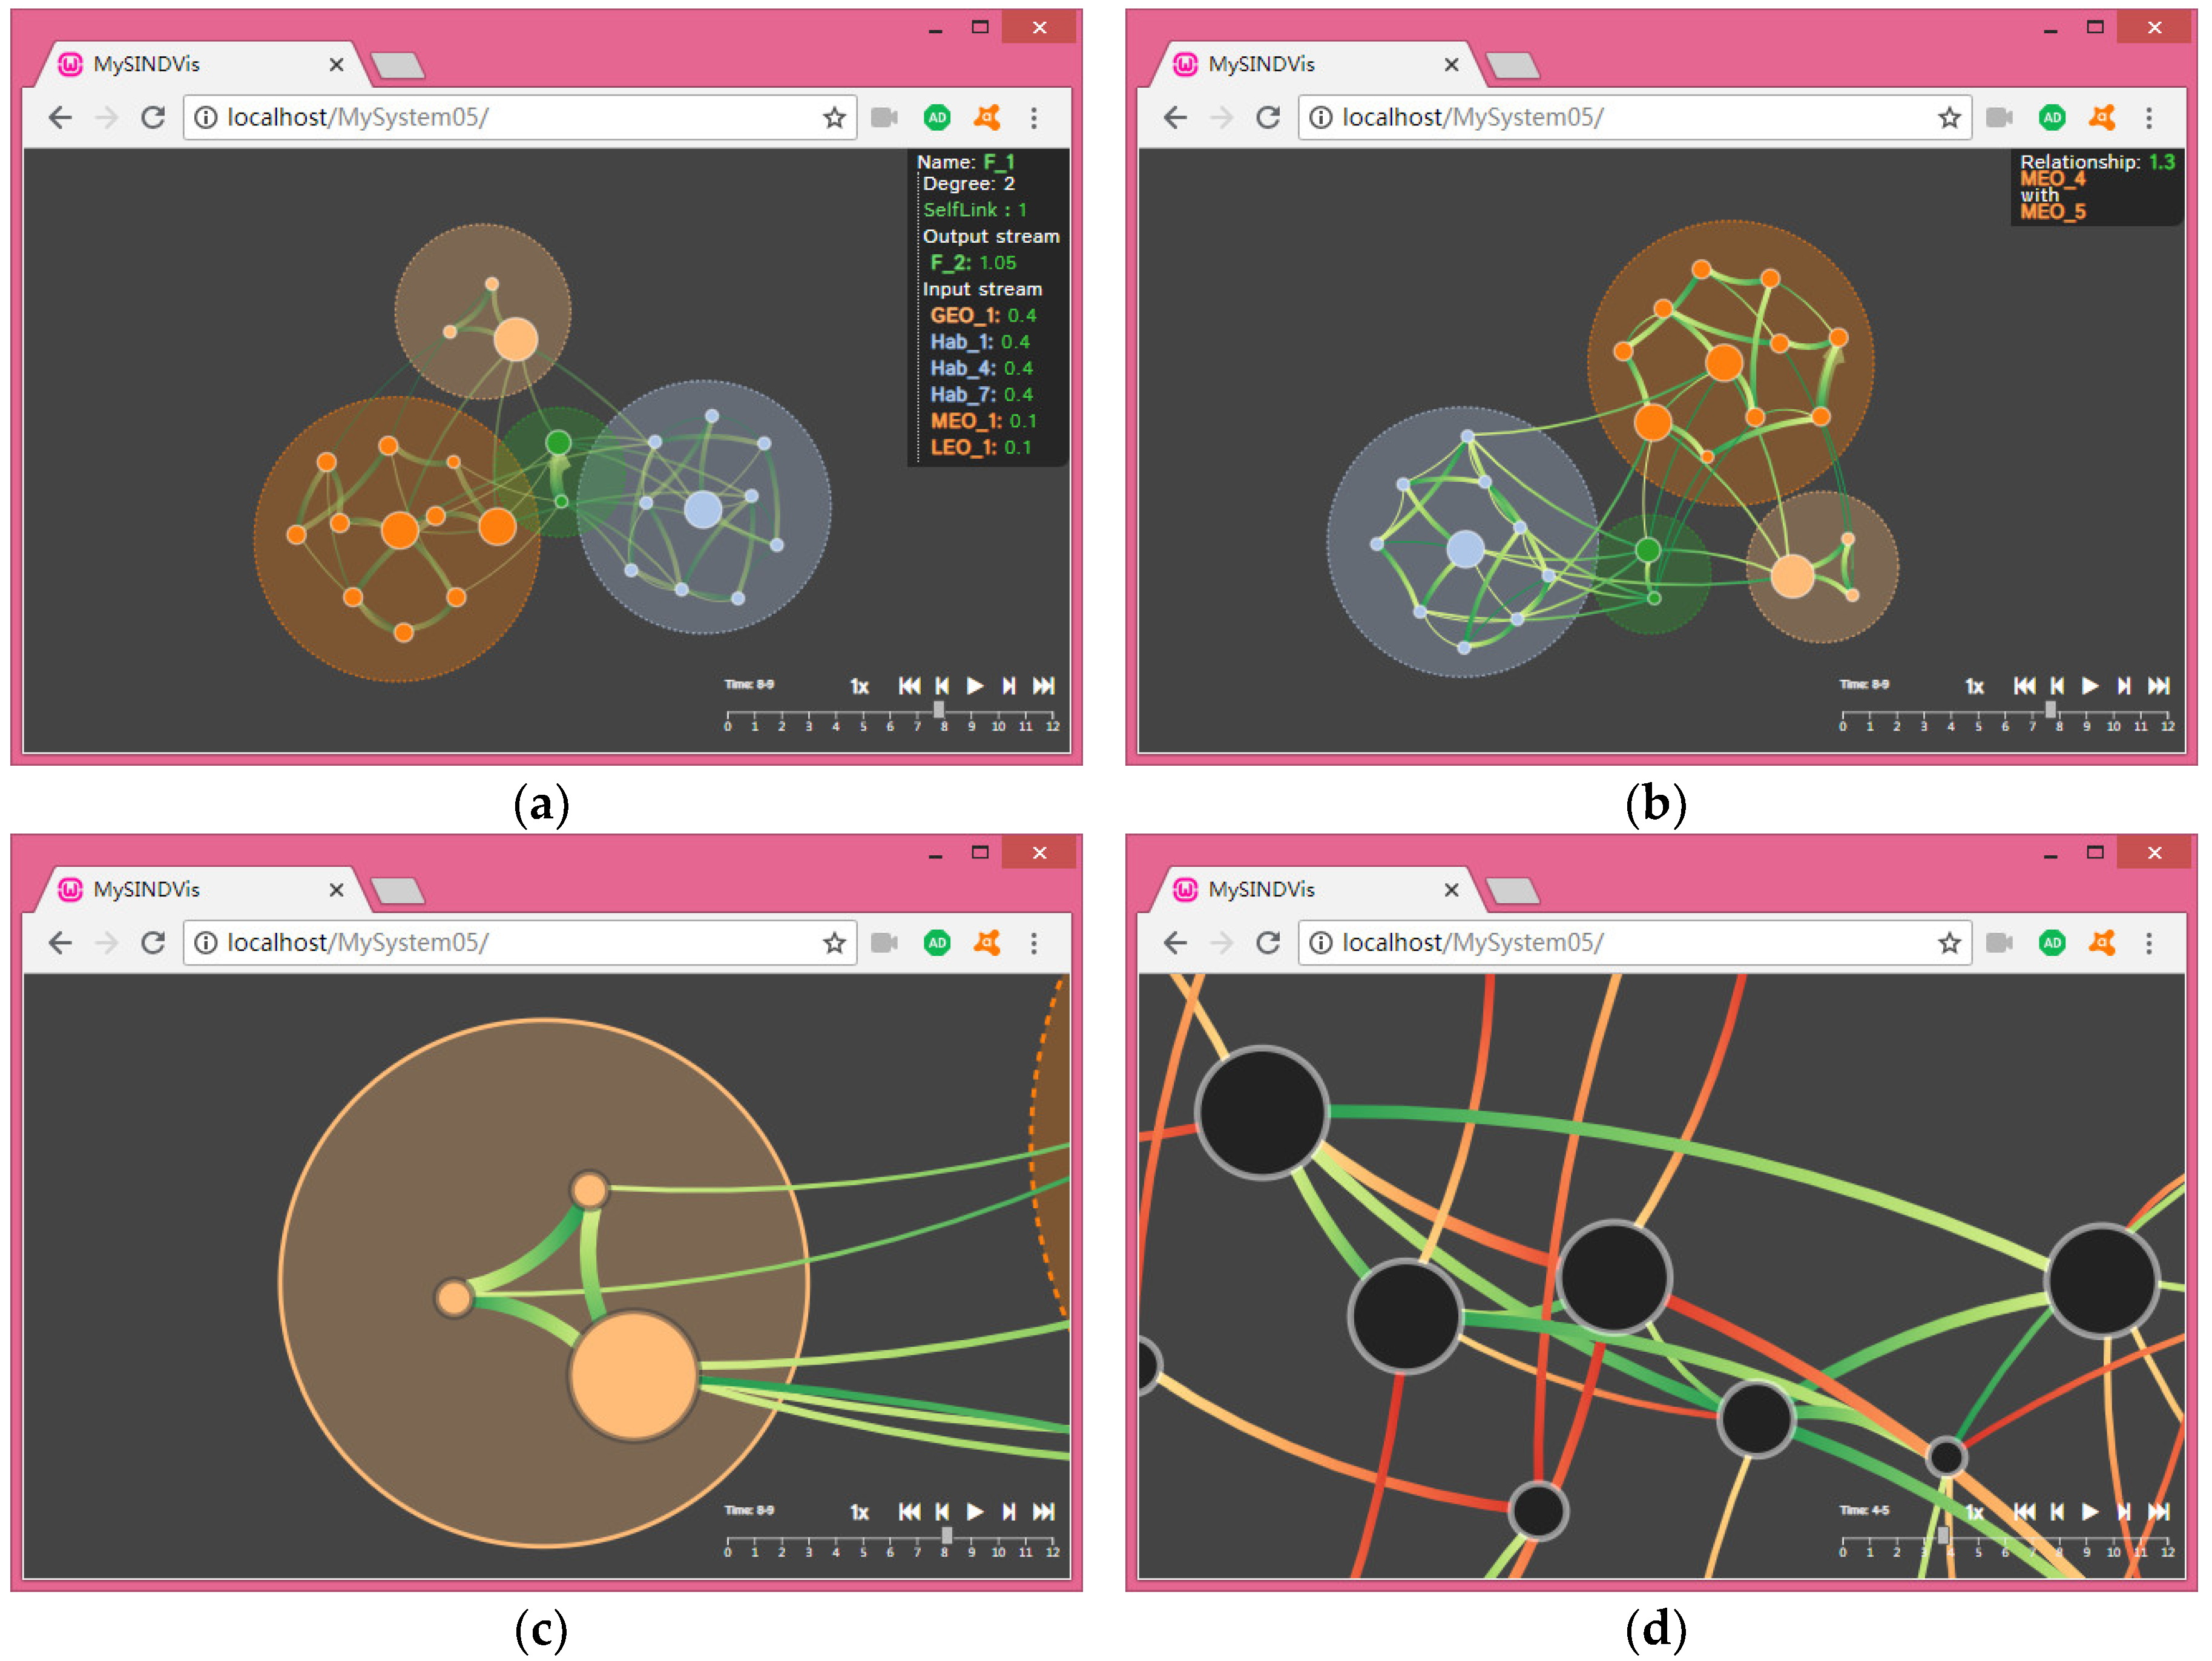
  • Description 1: Both of Figure 16d and Figure 17a are views with the same network structure, and due to the limitations of the network structure itself, it is difficult for a user to understand the four-layer architecture of the SIN through Figure 16d. Therefore, we constrained the network nodes at different levels by introducing clustering coefficients. For the four-layer structure in SINDVis, the effect of Figure 17a is achieved by setting four different constraint values. After the constraint with the clustering coefficient, the network composed of four circular faces was included in the network nodes of the respective level, a clearer level display was realized without affecting the network’s overall topology structure.
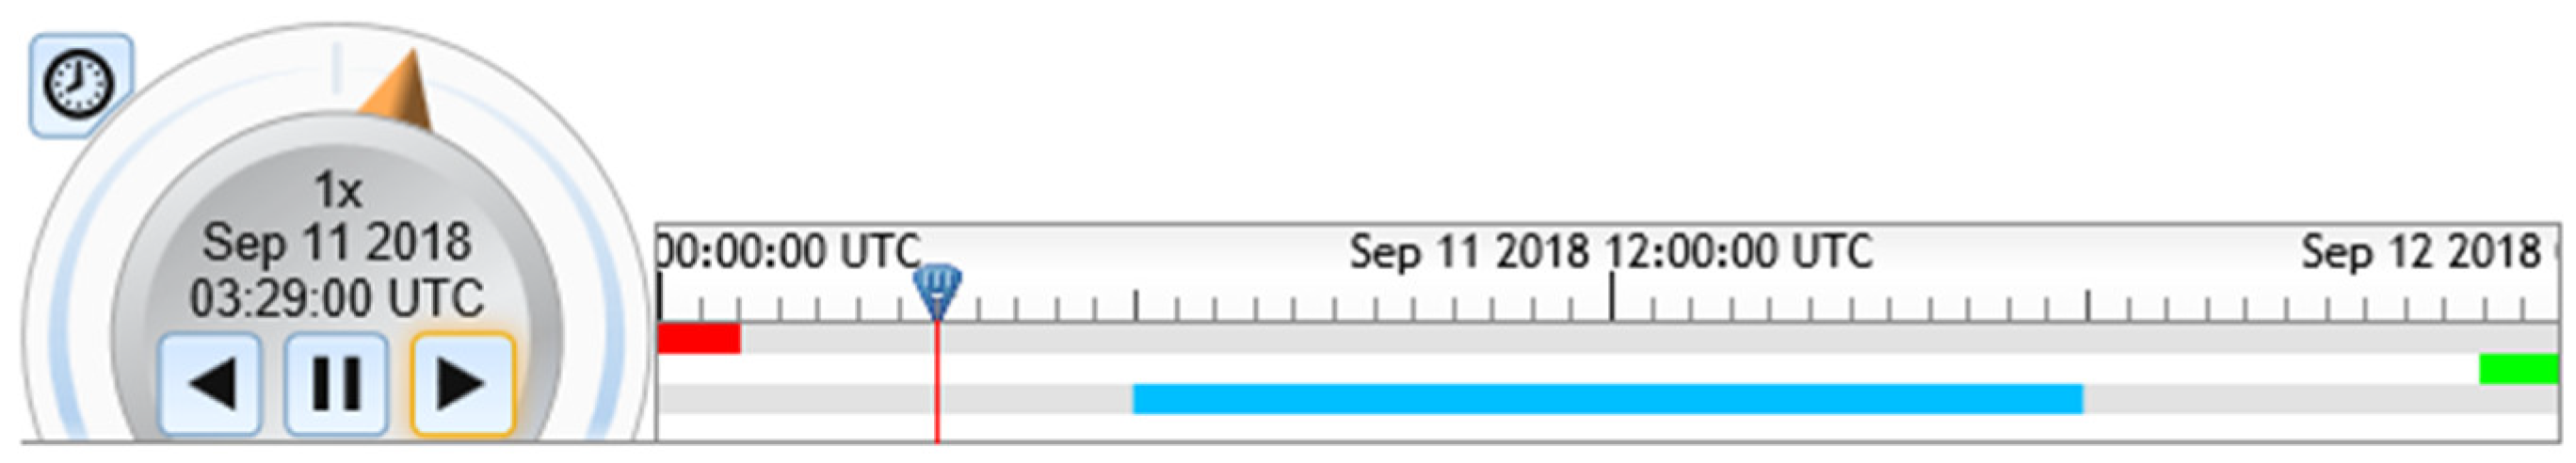
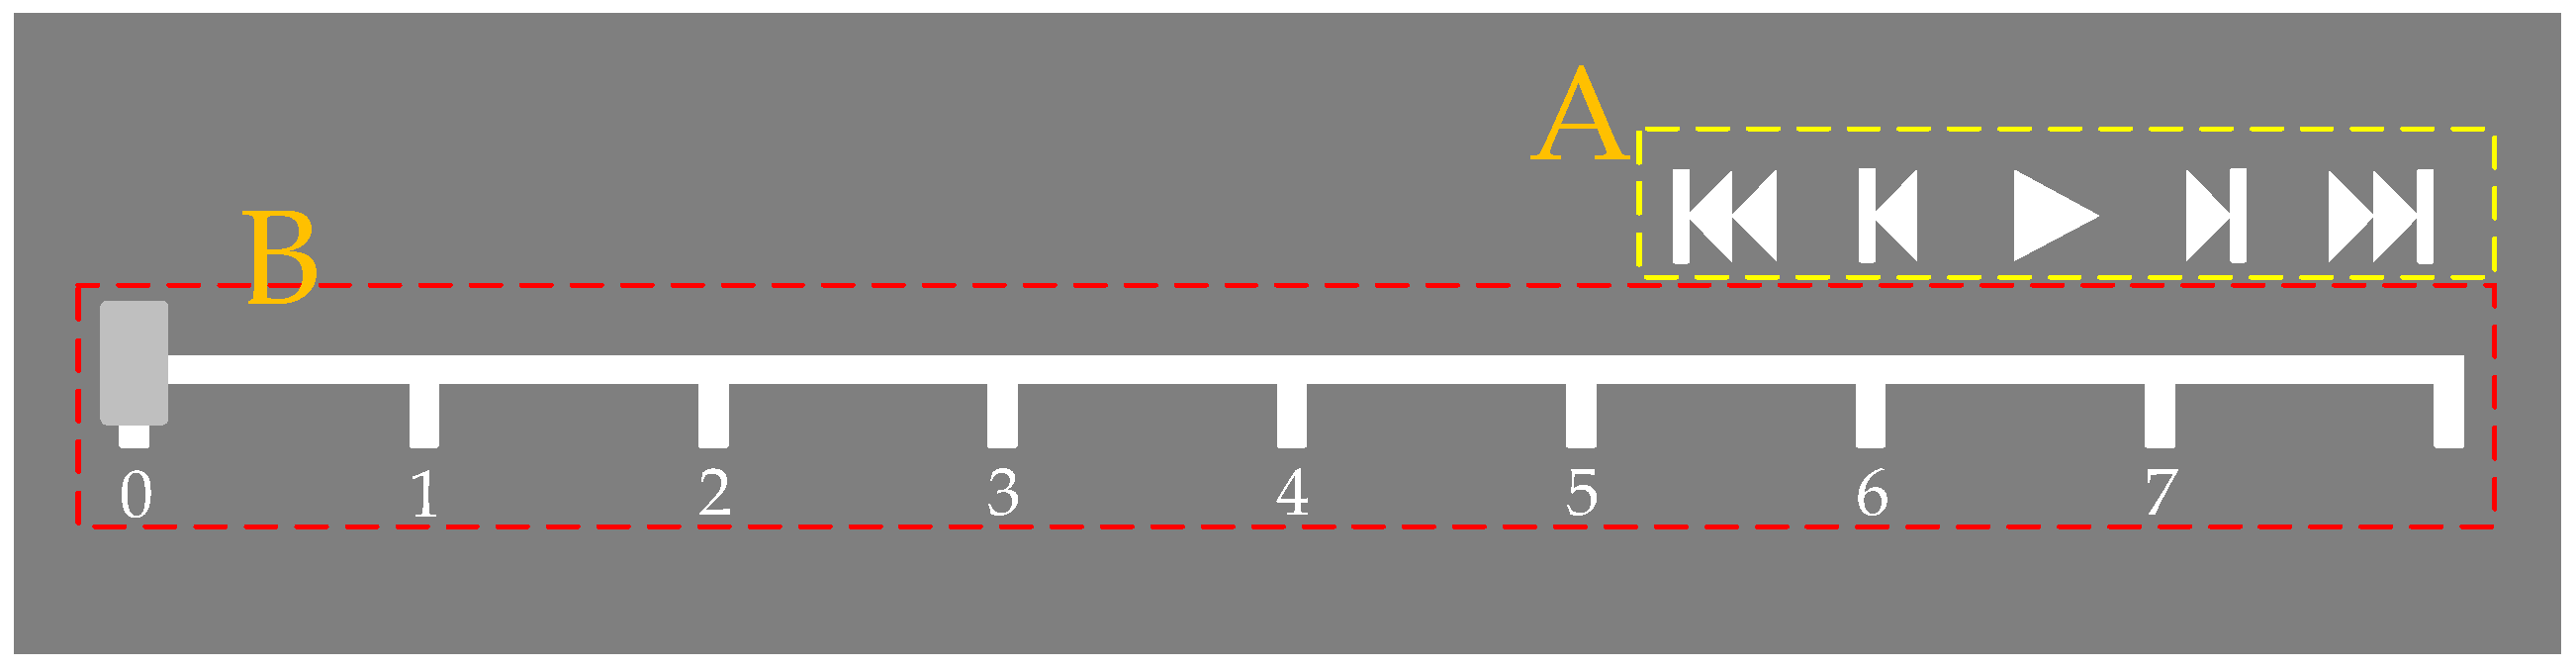
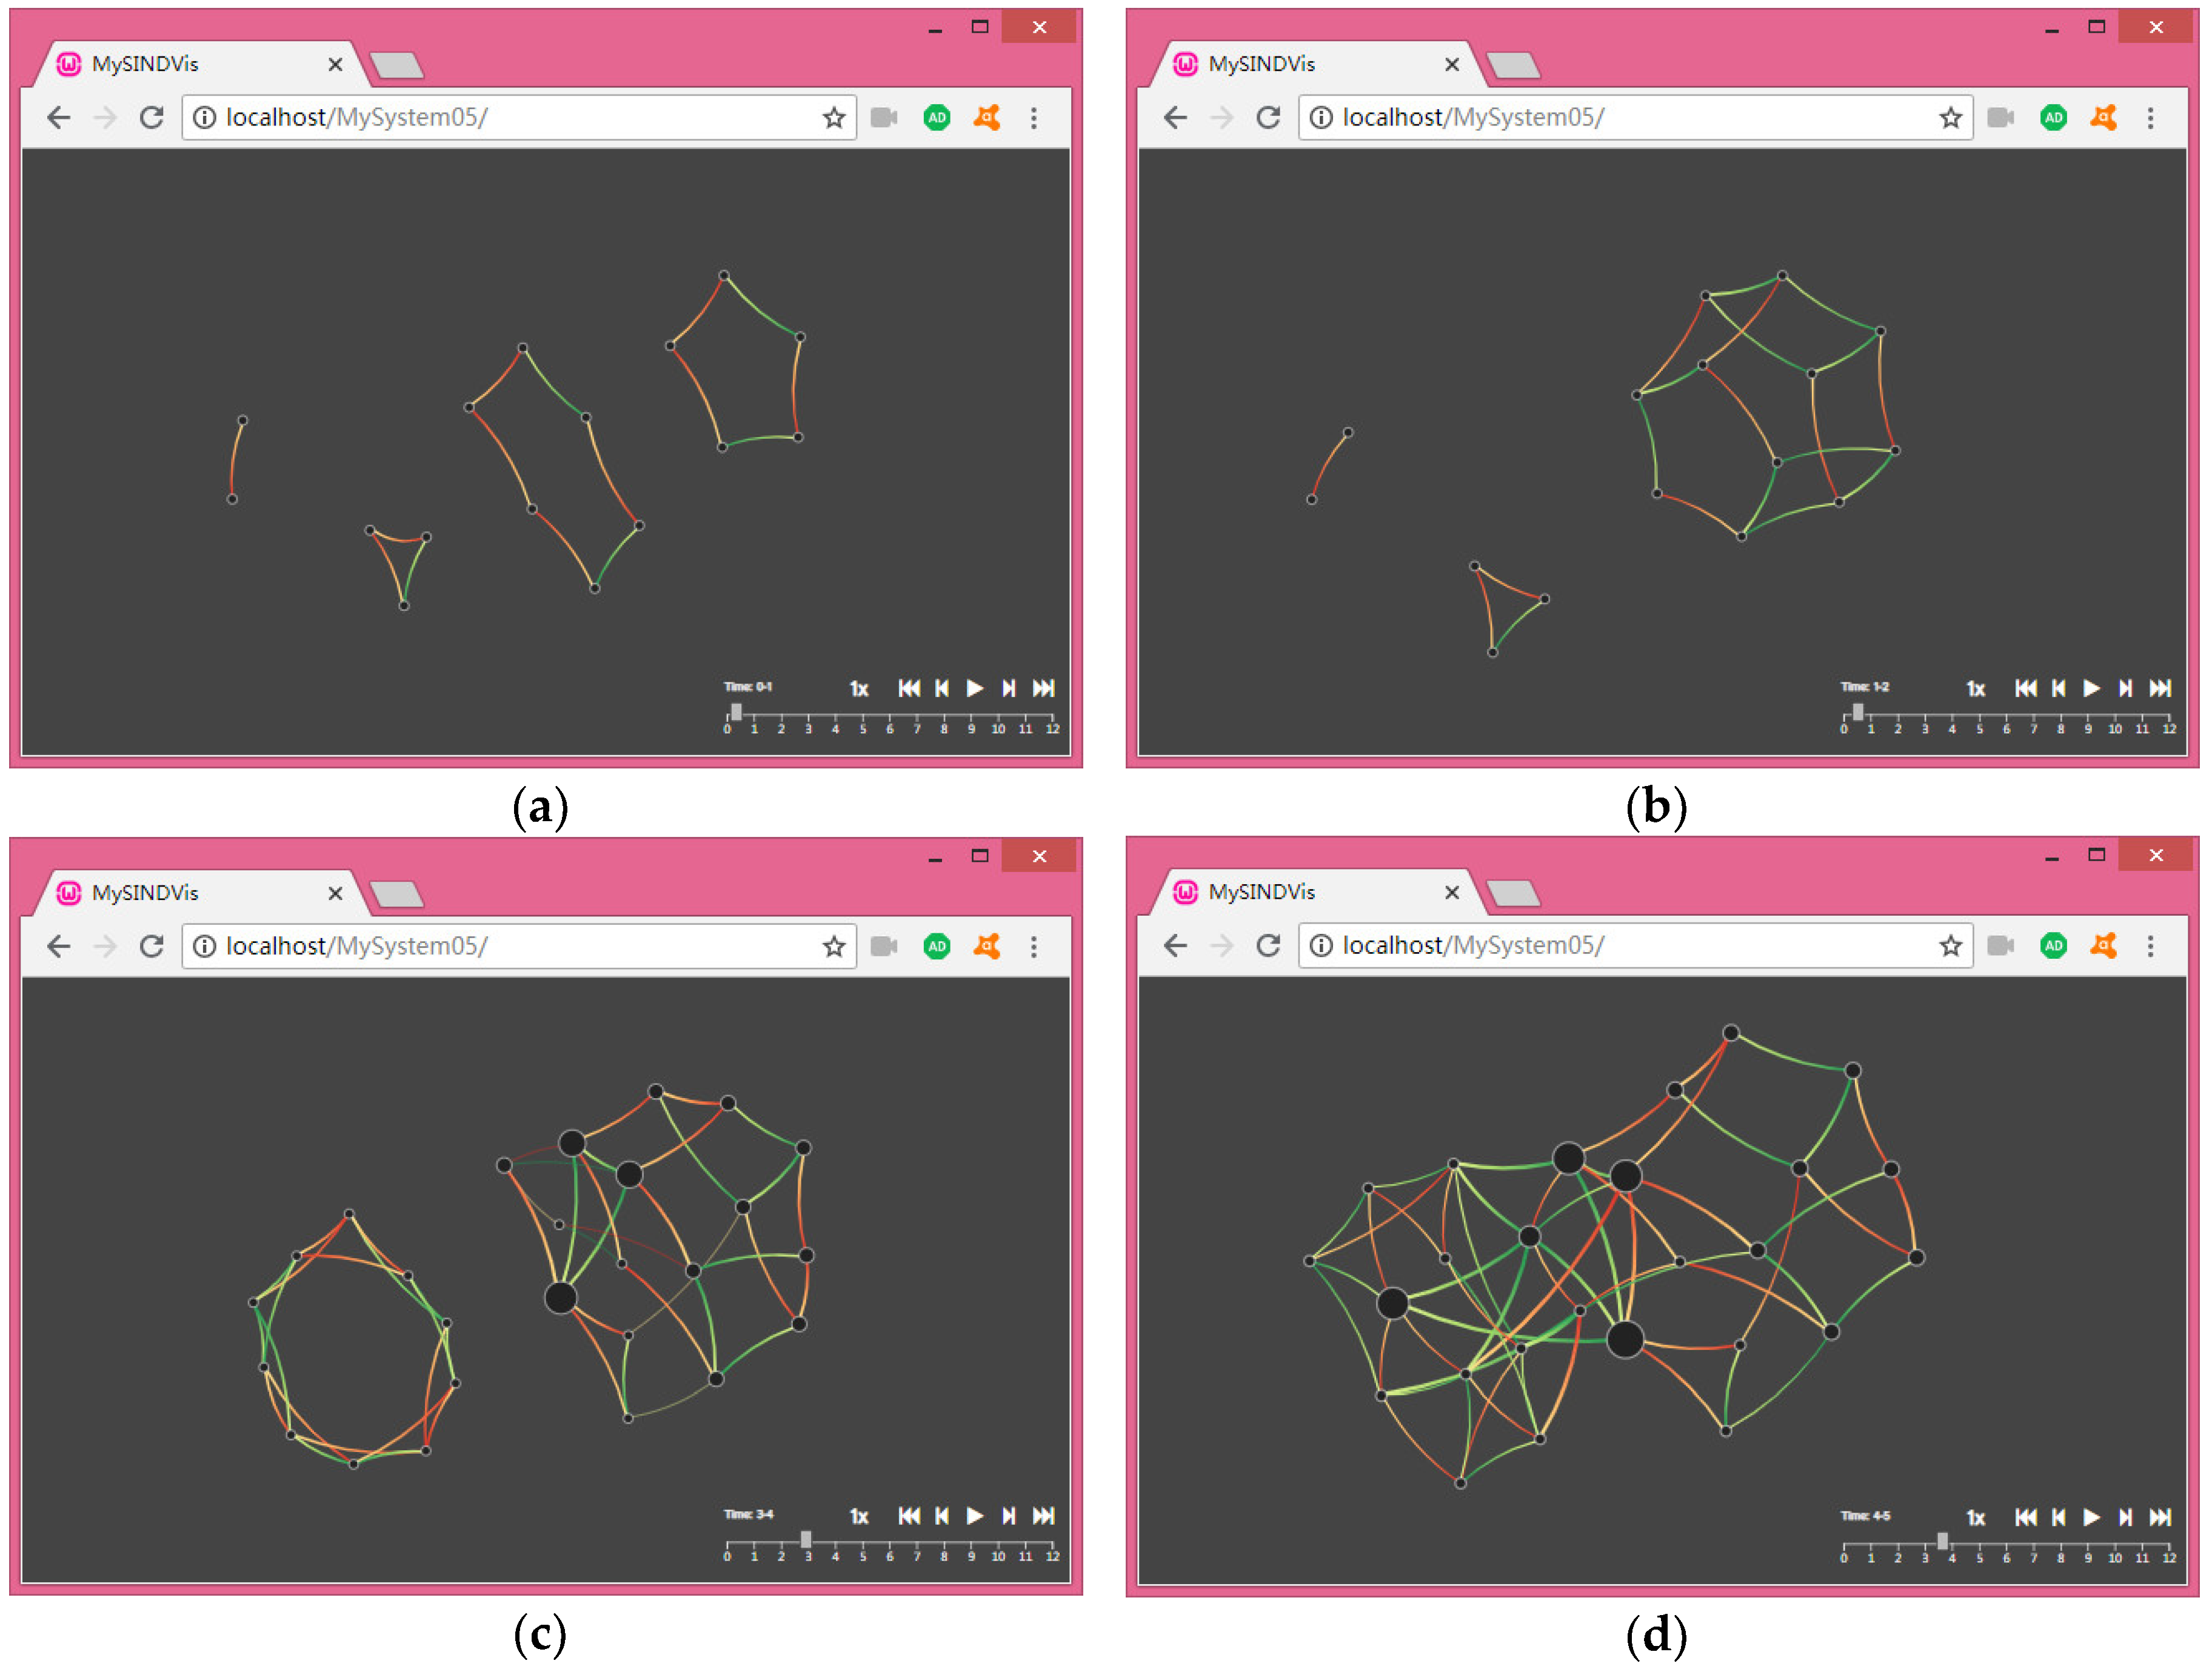
  • Description 2: In combination with Figure 10 in Section 3.4.3 above, we used a timeline-based approach to accomplish animation control of the SINDVis system, as shown in Figure 16 and Figure 17 on the bottom, right corner of the page. We set the animation time zone to [0, 12], and carried out an animation demo in two ways. One way was through the mouse drag slider, according to the needs of users in real-time animation conversion. The other was by clicking the “Play/Pause” button to achieve an automatic display of animation. Meanwhile, in order to achieve a friendlier function design and meet the needs of more users, we added acceleration/deceleration control buttons to the timeline module.
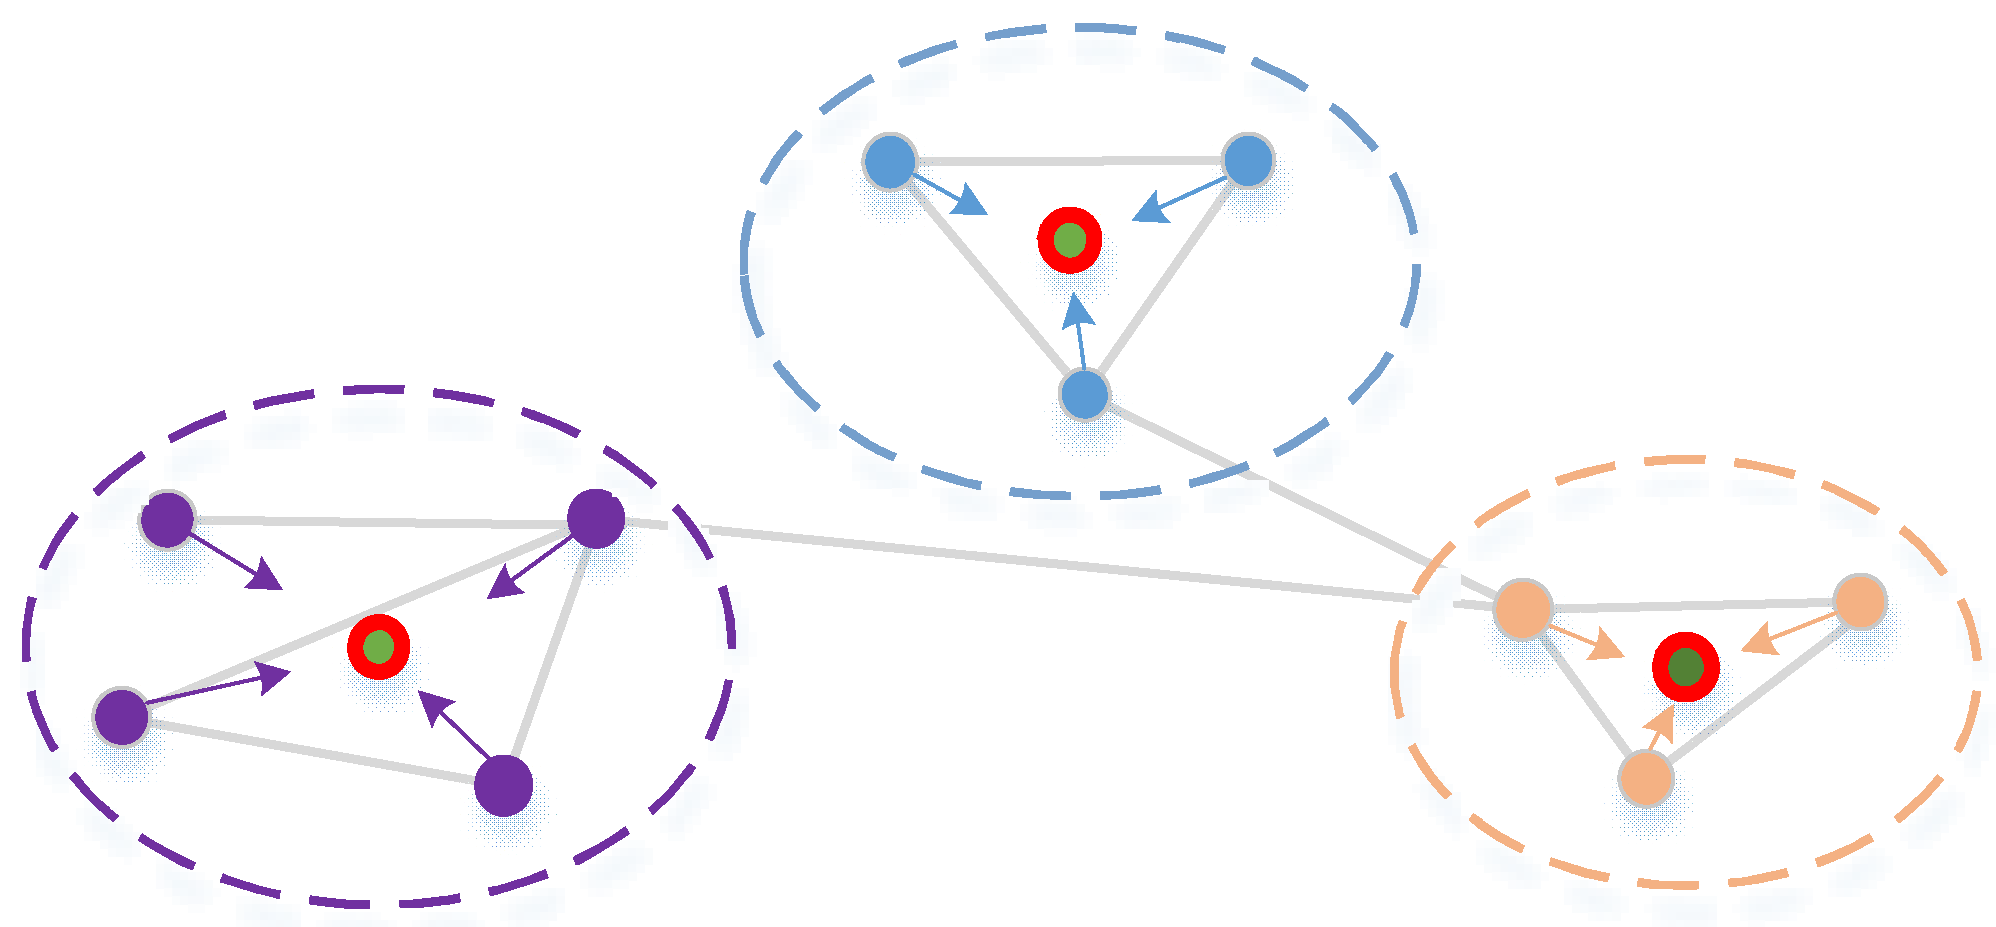
  • Description 3: In order to highlight the differences in the importance levels of different nodes in the whole network, we used area coding to display the different degree values of the network nodes in TopolView. A big degree value corresponds a large area, or vice versa. Of course, given the limited scope of the view page, the node degree values mentioned above are relative values. Meanwhile, given the directionality of data transmission in the network, we used color-coding to show the differences between inputs and outputs, as shown in the gradient red and gradient green in the Figure.
To sum up, by combining the architecture of SIN and the function of the TopolView in the topology domain, we constructed the TopolView. TopolView and GeoView complement each other, and mainly demonstrate the dynamic topological evolution laws of SIN from the topology perspective. Meanwhile, the web-oriented model developed in this paper is more popular and more convenient with Internet-based users. The TopolView shows the dynamic networking process of the SIN from scratch, and we integrated the users’ needs into the view page and achieved real-time interactions with users. Figure 17 can also be used to understand the increases and deletions of the nodes and edges mentioned above, but this paper does not show the specific details. The main purpose of this section was to demonstrate the basic functionality of TopolView, and more versatility will be developed based on this view.

5. Discussion

This article focused on designing and implementing a user-centered interactive visualization system, SINDVis. The system abandons the traditional C/S architecture and satisfies many kinds of user needs in web-oriented form. The users of the SIN can be broadly divided into three categories based on their sources and characteristics. Firstly, there are people who are interested in SIN but know little about it. The second includes users involved in the design and construction of SIN. The third is that of users involved in the management and maintenance of SIN. Due to the difference of background knowledge and expertise of different users, we proposed designing the main view of the system as the entity domain view GeoView and the topology domain view TopolView together to meet the different needs of many users. In the theory and method analysis, combined with the characteristics of SIN, we designed the SINDVis architecture and elaborated on the various functions of GeoView and TopolView. For the view realization, we emphatically discussed the TopolView realization method, including improving the FDA layout and proposing a FDA layout method, as well as proposing and analyzing the FAT and P&Z methods.
For the entity domain, GeoView, we showed the process of dynamic networking of SIN from the perspective of the entity domain. This included the operation and networking of different levels of the information system. By combining this with the architecture of SIN, finally, users can realize the initial understanding of the SIN. To determine the advantages and disadvantages of the STK, SaVi, and SINDVis, we performed a comparative analysis of four aspects: architecture, service type, interactivity, and scope. The details is shown in Table 3.
For the topology domain, TopolView, we showed the process of dynamic networking of SIN from the perspective of the topology domain. The included the increase of nodes and edges, the establishment of the connection, and the real-time operation of the network. Meanwhile, we focused on the realization of a real-time interactive view function for users.
The development process of the visualization system was a continuous iterative process. The user-oriented visualization system was based on the analysis of the user’s initial requirements, and through the design of its basic functions, the design and realization of the initial SINDVis was completed. Based on the initial version, through users’ continuous use, combined with their feedback, suggestions, and comments, we will improve the system. Through continuous modifications, trials, feedback, new requirements and recommendations, we will develop useful SINDVis and products. Therefore, the most important factor is the development of the user-centered SINDVis, and only the users can know what their purpose is based on the SINDVis. In addition, timely and effective communication between developers and users is the precondition and foundation to ensure the continuous optimization of the SINDVis.

6. Conclusions

6.1. Summary

As a national infrastructure, SIN has important significance for the military and for people’s livelihoods, and it also has become a hot research field in recent years. In order to allow the effective construction and efficient management of SIN, we applied the relevant technology and methods of visualization to the SIN. Meanwhile, a user-centered interactive visualization system for SIN was designed and implemented based on the topology domain view and entity domain view to meet the multiple needs of multi-class users.
By designing the SINDVis architecture and then directing the system to design, and by describing the different functions of the views, we presented the validation indicators for the SINDVis. In the concrete realization of the method, we can draw on its successful application in other fields, but also combine the characteristics of the SIN to improve and optimize it. Finally, the results not only satisfied the described functions of GeoView and TopolView, but also verified the validity and feasibility of the proposed and related theories and methods.

6.2. Limitations

As we know, although we designed the SINDVis, and displayed and analyzed the results through a typical SIN, we think that there were the following insufficiencies in our study.
  • In order to illustrate the problem and simplify the operation, we controlled a certain small range of SIN (26 nodes, 58 edges) in the case description. However, the real network is much larger and more complex, and how to achieve a clearer display based on this system is not mentioned in this article.
  • This study was implemented only to determine the underlying functionality and achieve a preliminary view display. Therefore, the integrity of the system was weakened during validation and the SINDVis system is not a complete system that can be used by users at its current stage.
  • System development is a continuous iterative process, and we only constructed the SINDVis system based on the users’ initial requirements. At present, there is no mature product can consider the users’ real-time operation and use requirements. Whether the SINDVis can better achieve the different functions of users’ needs to be researched and demonstrated at a later stage. Meanwhile, we also improve and optimize the system in the future.

6.3. Prospect

Combined with the research contents and shortcomings of this paper, future studies will be carried out based on existing research, as follows.
  • Reasonable layout and integration of GeoView and TopolView. That is, we aim to achieve a reasonable layout of the two views in one interface. One view is primary, the other is supplemented, and a smooth conversion between the main and secondary views is possible.
  • Increasing the interactive operation modules of GeoView and TopolView. For example, the operation modules in the GeoView of the user should include the addition or deletion of entities according to a user’s own needs, changes in the entity running track, and so on. The operation modules in the TopolView of the user should include the addition or deletion of nodes and edges, changes in the scope of the local-world, and so on. This will allow users to achieve better understanding, control, and management of SIN.
  • Constructing the primary version of the SINDVis system for users and collecting feedback and suggestions from different users to upgrade and optimize the system. Through a number of trials, feedback and optimization, the final version SINDVis system should be able to meet the needs of multi-class users.

Author Contributions

S.Y., X.Z. and X.M. completed the overview; S.Y. and L.W. structured the theory and method; S.Y. accomplished the verification of results; L.W. and P.C. helped with the verification; S.Y. wrote the paper. X.Z. and X.M. helped with writing.

Funding

This work was supported by the Equipment Pre-Research Foundation under Grant No. 6142010010301.

Conflicts of Interest

The authors declare no conflicts of interest.

References

  1. Víctor, M.; Fernando, B.; Juan, C.C. A survey of link prediction in complex networks. ACM Comput. Surv. 2016, 49, 69. [Google Scholar]
  2. Zhou, J.G. Research on Key Technology of Spatial Information Network Based on DTN; Wuhan University: Wuhan, China, 2013; pp. 1–5. [Google Scholar]
  3. Li, D.R.; Shen, X.; Gong, J.Y.; Zhang, J.; Lu, J. On construction of China’s space information network. Geomat. Inf. Sci. Wuhan Univ. 2015, 40, 711–715. [Google Scholar]
  4. Yu, S.B.; Wu, L.D.; Zhang, X.T.; Li, C.; Ma, H.J. Survey of multi-feature visualization for space information network. J. China Acad. Electron. Inf. Technol. 2018, 13, 201–208. [Google Scholar]
  5. Zhang, W. Topological Control Theory and Method of Space Information Network; PLA University of Science and Technology: Nanjing, China, 2016; pp. 1–10. [Google Scholar]
  6. Yu, Q.Y.; Meng, W.X.; Yang, M.C.; Zheng, L.M.; Zhang, Z.Z. Virtual multi-beamforming for distributed satellite clusters in space information networks. IEEE Wirel. Commun. 2016, 23, 95–101. [Google Scholar] [CrossRef]
  7. Inícius, T.G.; Carla, M.D.; Sasso, F.; Ramin, S.; Liane, M.R.T.; Lisandro, Z.G. A survey on information visualization for network and service management. IEEE Commun. Surv. Tutor. 2016, 18, 285–323. [Google Scholar]
  8. Fabian, B.; Michael, B.; Stephan, D.; Daniel, W. A taxonomy and survey of dynamic graph visualization. Comput. Graph. Forum 2017, 36, 133–159. [Google Scholar]
  9. Burch, M. The dynamic graph wall: Visualizing evolving graphs with multiple visual metaphors. J. Vis. 2017, 20, 461–469. [Google Scholar] [CrossRef]
  10. Johannes, K.; Helwig, H. Visualization and visual analysis of multifaceted scientific data: A survey. IEEE Trans. Vis. Comput. Graph. 2013, 19, 495–513. [Google Scholar]
  11. Shneiderman, B.; Aris, A. Network visualization by semantic substrates. IEEE Trans. Vis. Comput. Graph. 2006, 12, 733–740. [Google Scholar] [CrossRef] [PubMed]
  12. Helen, C.P.; Eve, H.; Carsten, G. How important is the “mental map”?—An empirical investigation of a dynamic graph layout algorithm. In Proceedings of the 14th International Conference on Graph Drawing, Karlsruhe, Germany, 18–20 September 2006; Springer: Berlin/Heidelberg, 2007; pp. 184–195. [Google Scholar]
  13. Yu, S.B.; Wu, L.D. A key technology survey and summary of dynamic network visualization. In Proceedings of the 2017 IEEE 8th International Conference on Software Engineering and Service Science, Beijing, China, 24–27 November 2017; pp. 474–478. [Google Scholar]
  14. Yu, S.B.; Li, X.M.; Liu, D. Design of weapons and equipment system of systems evaluation based on B/S and MVC pattern. J. Terahertz Sci. Electron. Inf. Technol. 2015, 13, 635–640. [Google Scholar]
  15. Hu, H.Q.; Wu, L.D.; Yang, C. Multiple-view framework of visual analytics for time-varying satellite topology network. Syst. Eng. Electron. 2014, 36, 312–316. [Google Scholar]
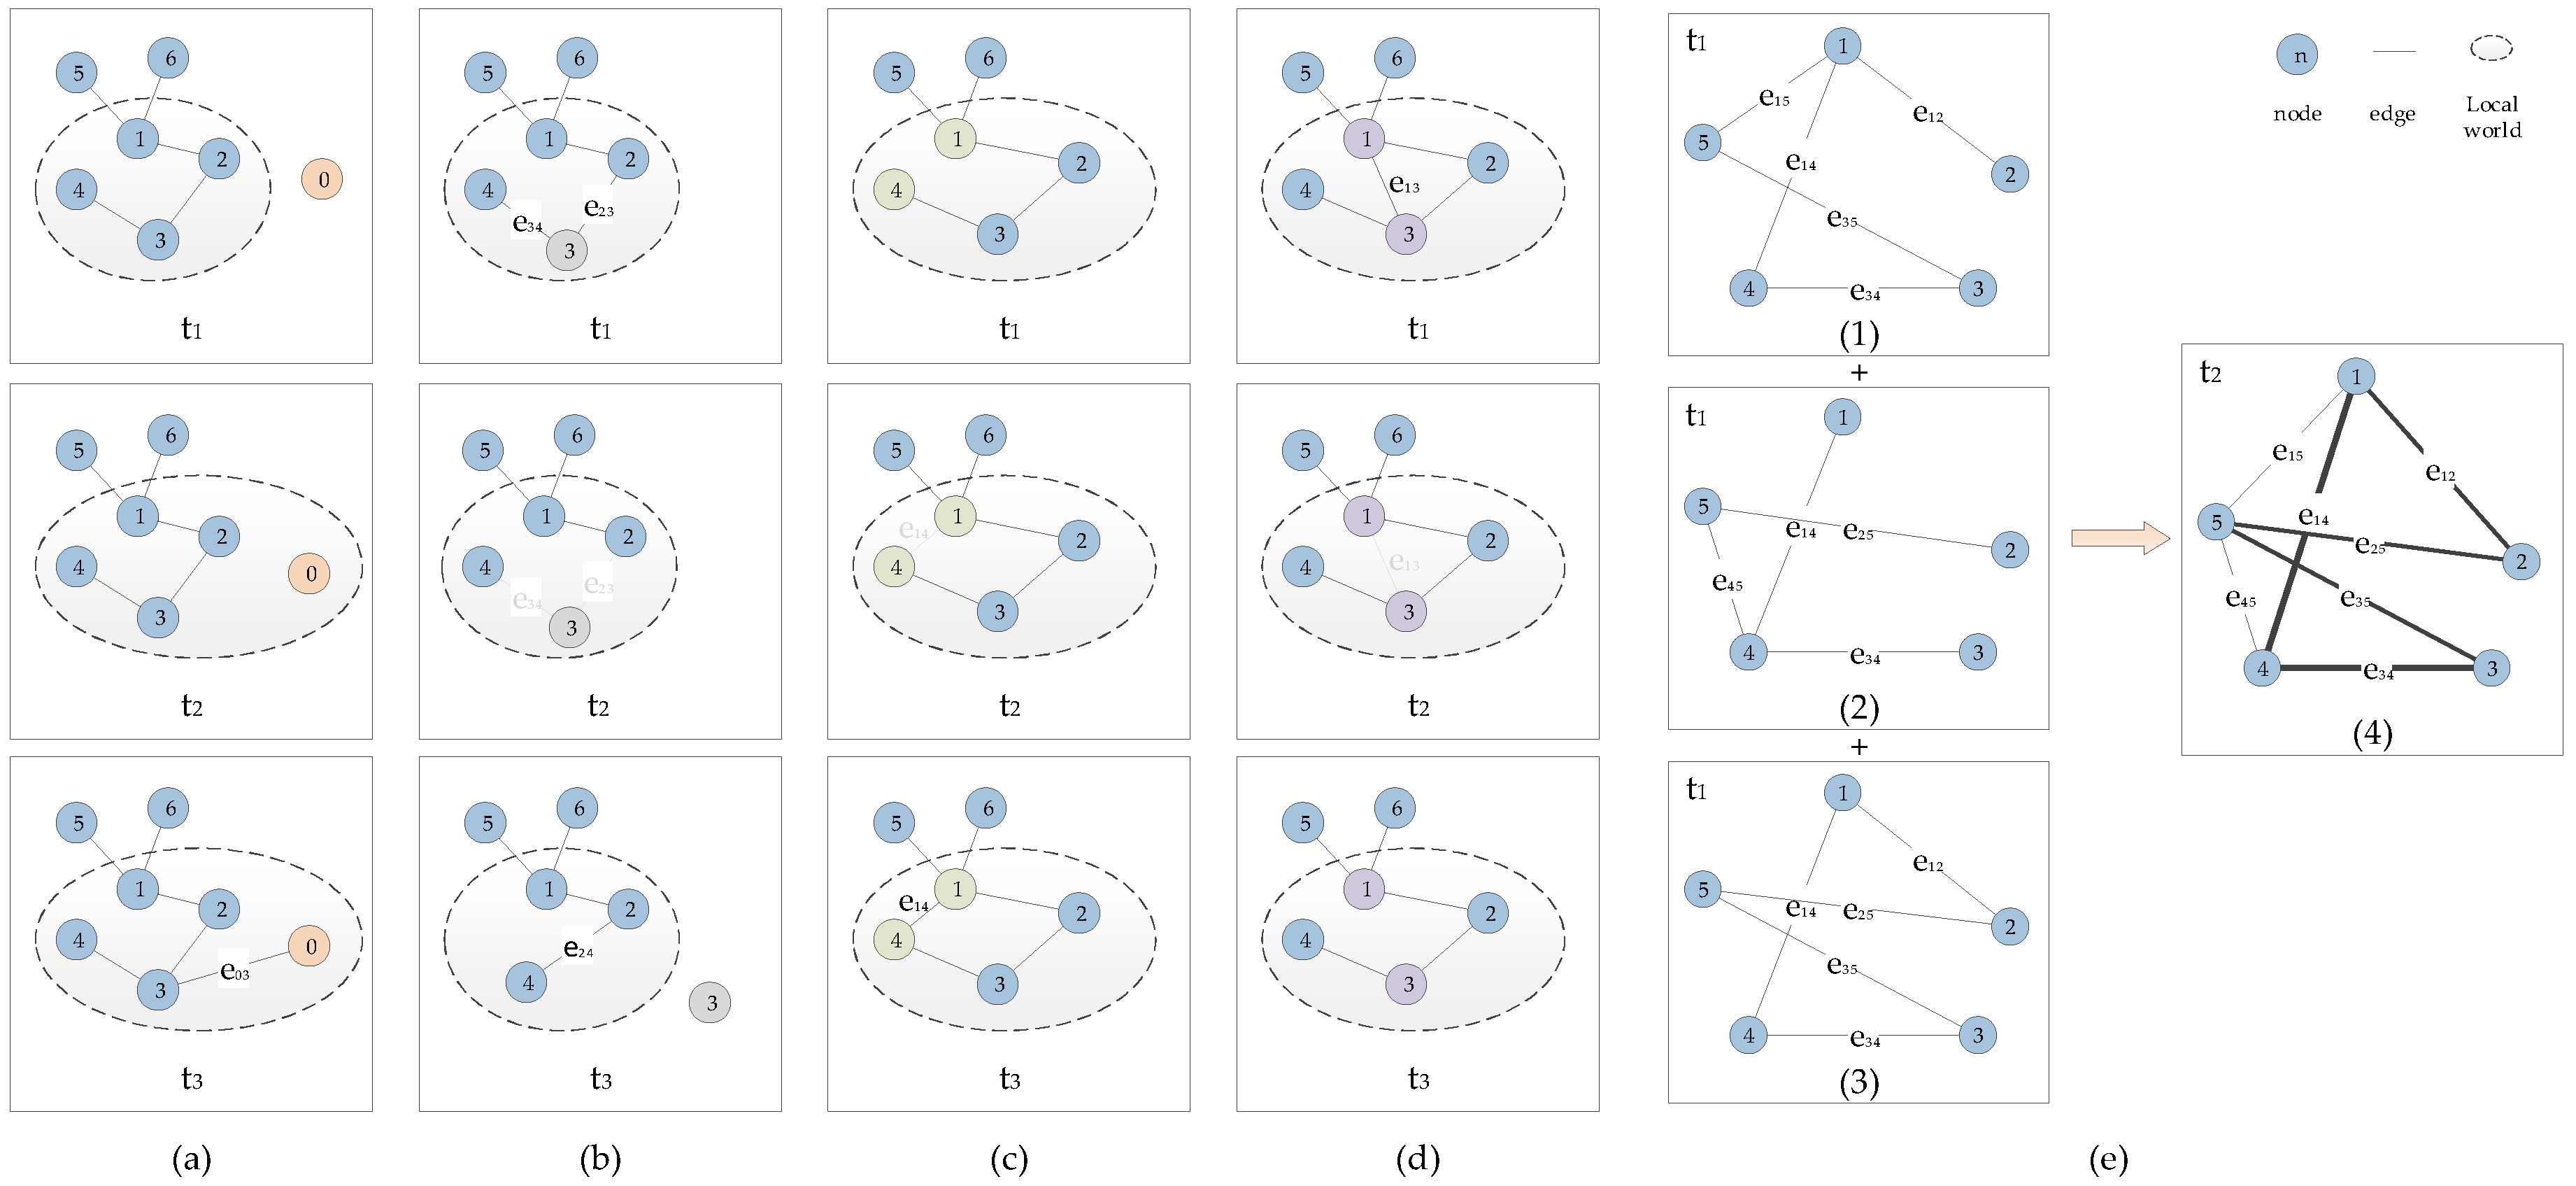
  16. Yu, S.; Wu, L.; Mu, X.; Xiong, W. Research on the weighted dynamic evolution model for space information networks based on local-world. Information 2018, 9, 158. [Google Scholar] [CrossRef]
  17. Pan, D.X.; Fu, Y.P.; Chen, J. Visualization and studies of ion-diffusion kinetics in cesium lead bromide perovskite nanowires. Nano Lett. 2018, 18, 1807–1813. [Google Scholar] [CrossRef] [PubMed]
  18. Yao, Z.H. Research on Key Technologies of Visual Analysis of Large Scale Network Topology Structure; Space Engineering University: Beijing, China, 2018; pp. 15–25. [Google Scholar]
  19. Dong, W.Q.; Fu, X.Y.; Xu, G.L.; Huang, Y. An improved force-directed graph layout algorithm based on aesthetic criteria. Comput. Vis. Sci. 2013, 16, 139–149. [Google Scholar] [CrossRef]
  20. Angus, G.; Andrew, B.; Kristine, L.; Xing, L.; Pierre, B.; Jean, K.; Walter, F. Dynamic influence networks for rule-based models. IEEE Trans. Vis. Comput. Graph. 2018, 24, 184–194. [Google Scholar]
  21. Sun, Z.; Deng, Z. An improved force-directed algorithm based on emergence for visualizing complex network. In Proceedings of the 2013 Chinese Intelligent Automation Conference, Yangzhou, China, 23–25 August 2013; Springer: Berlin/Heidelberg, 2013; pp. 305–315. [Google Scholar]
  22. Mustafa, H.; Wang, B.; Carlos, S.; Paul, R. Visual detection of structural changes in time-varying graphs using persistent homology. In Proceedings of the IEEE Pacific Visualization Symposium, Kobe, Japan, 10–13 April 2018; pp. 1–10. [Google Scholar]
  23. Tominski, C.; Gladisch, S.; Kister, U.; Dachselt, R.; Schumann, H. Interactive lenses for visualization: An extended survey. Comput. Graph. Forum. 2017, 36, 173–200. [Google Scholar] [CrossRef]
  24. Cockburn, A.; Karlson, A.; Bederson, B.B. A review of overview + detail, zooming, and focus + context interfaces. ACM Comput. Surv. 2009, 41, 1–31. [Google Scholar] [CrossRef]
  25. Wijk, J.J.; Nuij, W.A. Smooth and efficient zooming and panning. In Proceedings of the Ninth Annual IEEE Conference on Information Visualization, Seattle, WA, USA, 19–21 October 2003; pp. 15–23. [Google Scholar] [Green Version]
  26. Andrew, M.R.; Chris, N. Smooth, efficient, and interruptible zooming and panning. IEEE Trans. Vis. Comput. Graph. 2018. [Google Scholar] [CrossRef]
Figure 1. Composition structure of the geostationary earth orbit (GEO) layer satellite system.
Electronics 07 00316 g001
Figure 2. Composition structure of the nonsynchronous medium earth orbit/nonsynchronous low earth orbit (MEO/LEO) layer satellite system.
Electronics 07 00316 g002
Figure 3. Composition structure of the Near Space layer information system.
Electronics 07 00316 g003
Figure 4. Composition structure of Ground layer terminals.
Electronics 07 00316 g004
Figure 5. SINDVis architecture.
Electronics 07 00316 g005
Figure 6. GeoView time control module.
Electronics 07 00316 g006
Figure 7. List of visualization methods.
Electronics 07 00316 g007
Figure 8. The local-world and edge-weight evolution mechanism of the space information network (SIN): (a) node increase mechanism; (b) node deletion mechanism; (c) edge increase mechanism; (d) edge deletion mechanism; (e) edge-weight evolution mechanism (adopted from Yu et al. [16]).
Electronics 07 00316 g008
Figure 9. Multi-centroid constraint diagram.
Electronics 07 00316 g009
Figure 10. The timeline schematic of TopolView.
Electronics 07 00316 g010
Figure 11. Diagram of the 2D space of panning and zooming (P&Z) reduction, translation, and amplification (adopted from Wijk et al. [25]).
Electronics 07 00316 g011
Figure 12. The view display of the LEO satellite information system: (a) The specific network form of the LEO satellite system from the ground station point; (b) the satellite is connected with the station and the data is transmitting; (c) 2.5D view of the LEO satellite information system; (d) 2D view of the LEO satellite information system.
Electronics 07 00316 g012aElectronics 07 00316 g012b
Figure 13. The 3D view display of the MEO/LEO satellite information system: (a) The satellite layout and the specific distribution of the MEO constellation; (b) the MEO satellite and LEO satellite are transmitting data.
Electronics 07 00316 g013
Figure 14. The 3D view display of the GEO satellite information system: (a) The connections between the GEO satellites; (b) the data transmission status of GEO-2 and the ground station.
Electronics 07 00316 g014
Figure 15. The 3D view display of the Near Space information system.
Electronics 07 00316 g015
Figure 16. The process displays of dynamic networking of SIN: (a) The basic elements of SIN at the initial moment; (b) the formation process of the MEO/LEO-layer satellite system; (c) the formation process of satellite systems; (d) the process of prototype formation of SIN.
Electronics 07 00316 g016
Figure 17. Interactive function displays of the SIN TopolView: (a) the interactions between the user and the node; (b) the interactions between the user and the edge; (c) the translation interaction function; (d) the zoom interaction function.
Electronics 07 00316 g017
Table 1. A list of the mainstream methods of dynamic visualization.
Network LayoutNetwork VisualizationNetwork Interaction
Force-Directed AlgorithmAnimationFisheye view
Improvement 1TimelineFocus and context
Improvement 2Fusion of aboveMulti-view association
Table 2. Degree of requirement of multi-class users.
User ClassGeoViewTopolView
USE-1★★★
USE-2★★★★★
USE-3★★★★★
Table 3. Simulation platform contrast analysis in the entity domain.
NameArchitectureService TypeInteractivityScope
STKC/SHeavy-weightWeakCommercial software
SaViC/SLight-weightWeakResearch software
SINDVisB/SLight-weightStrongComprehensive software

