1. Introduction
Based on global policy on control and reduction of greenhouse gas (GHG) emissions peak by 2020, numerous studies have suggested the implementation of renewable energy sources (RES) in future electrical power systems. These comprehensive multidisciplinary studies cover the science and technologies of energy harvesting devices and details of delivering the demand energy [
1,
2].
The main focus of current studies in this area is to provide an effective alternative for non-renewable energy systems by addressing the major drawbacks of renewable energy based electrical power systems. Economic attraction is one of the key features for any power system because of its capability to obtain reasonable financial support in the energy industry. As a result, numerous studies [
3,
4,
5] in this area have been conducted to show the economic benefits of RES utilization. In addition, technical challenges related to the intermittency of the RES have been a subject of large quantity of research in order to meet the required reliability and quality standards [
5,
6,
7].
Grid integration and energy storage are the two commonly used solutions, which can enhance the RES based power system performance. These technologies are responsible for extracting energy from the available renewable energy resource and injecting high quality energy to the grid [
8,
9]. Energy storage systems in conjunction with RES can provide some environmental [
8], technical [
9], and financial benefits [
10] to a power system. Energy storage technologies can reduce the overall greenhouse gas emissions and enhance the reliability of renewable power generation systems. As a result, the main focus of future technologies research and development should be devoted to cost effective implementation of energy storage systems in renewable power generation.
Different types of storage techniques are theoretically and operationally available to remedy the RES fluctuations and to match an application. A variety of parameters can be used to develop a control scheme or compare the storage system characteristics with other alternative storage systems [
8,
9,
11]. Cost, efficiency, energy density, life cycle, and environmental impact, are some examples of these parameters. In order to choose a storage technology for an application, the geographical characteristics of the implementation site, the application size, and the availability of RES are key parameters that should be considered. Therefore, a comprehensive economic and technical performance assessment is necessary for the energy storage comparison. Consequently, no unique storage technology can be considered as the best option for all energy storage purposes. In this paper, an additional criterion for the assessment of an energy storage system is proposed, which enhances the accuracy of the performance investigation. This criterion targets the limited storage capacity of the energy storage system, and reveals its benefits in energy storage systems with expandable capacities, such as compressed air energy storage (CAES) systems in location with considerable renewable energy.
Compressed air energy storage systems utilize the excess energy in a power system to store air in a high pressure container [
9]. Despite its environmentally friendly nature, high life cycle, and inexpensive configuration; the overall efficiency and attractiveness of a typical CAES system has been subject to question in energy related industries. However, this doubt originates from a traditional point of view, where the excess energy was provided by burning fossil fuel in power plants. A valuable economic benefit assessment of using CAES system in a hybrid energy system is performed in [
12] in order to compare several energy storage technologies. As a result of such studies, the CAES system was not considered an attractive option in several market pricing strategies and different wind penetration levels. However, these results were obtained because the CAES system and combined heat and power (CHP) plant had limited capacity. The main difference in a wind based hybrid power system (HPS) for an isolated application in comparison to a grid connected hybrid power system is the origin of the available excess energy for storage. In a grid connected hybrid power system (HPS), the storage system consumes the electricity that has been produced by power plants by burning fossil fuels and might not be financially attractive option, as is shown in [
10]. On the other hand, the maintenance cost after installing energy harvesting equipment is the only expense required by a RES based power system. It can benefit from a vast amount of free energy to compensate for its lower efficiency in comparison with other technologies. This enhancement can be more attractive considering the environmentally friendly nature of the CAES system, and its high durability. Proper design, along with developing suitable control strategy considering the physics of energy conversion in a CAES system, can result in the improved performance of a RES-based power system.
In this paper after presenting a brief overview of energy storage system and current comparison methods, the anatomy of a wind based hybrid power system is explained. Following this, a new criterion based on the limited storage capacity of storage systems is developed. This concept is then used for the control and performance assessment of a small-scale wind-based hybrid power system (HPS) for possible application in a remote community.
2. Brief Survey of Typical Energy Storage Systems
There are different types of energy storage systems, based on various physical principles, and each of these technologies is well suited for a specific power or energy range [
8]. Flywheel [
13], hydrogen [
8], pumped hydro [
9], compressed air energy storage (CAES) [
13], electrochemical double layer capacitor [
11,
15], batteries [
11], superconducting magnetic energy storage (SMES) [
11,
15] and virtual energy storage systems [
15], are some examples of available energy storage systems. The performance of these storage systems can be evaluated by considering a variety of factors such as the capability of the storage system to provide energy for a long or short time, efficiency, energy density, life cycle, cost (including initial, operational and maintenance costs), depth of discharge, self-discharge rate, reliability, environmental aspects, and energy/power rating. Some applications require specific characteristics of the storage system to meet technical constraints such as high energy density for limited space conditions or transportability for portable applications, power/energy rating and cost.
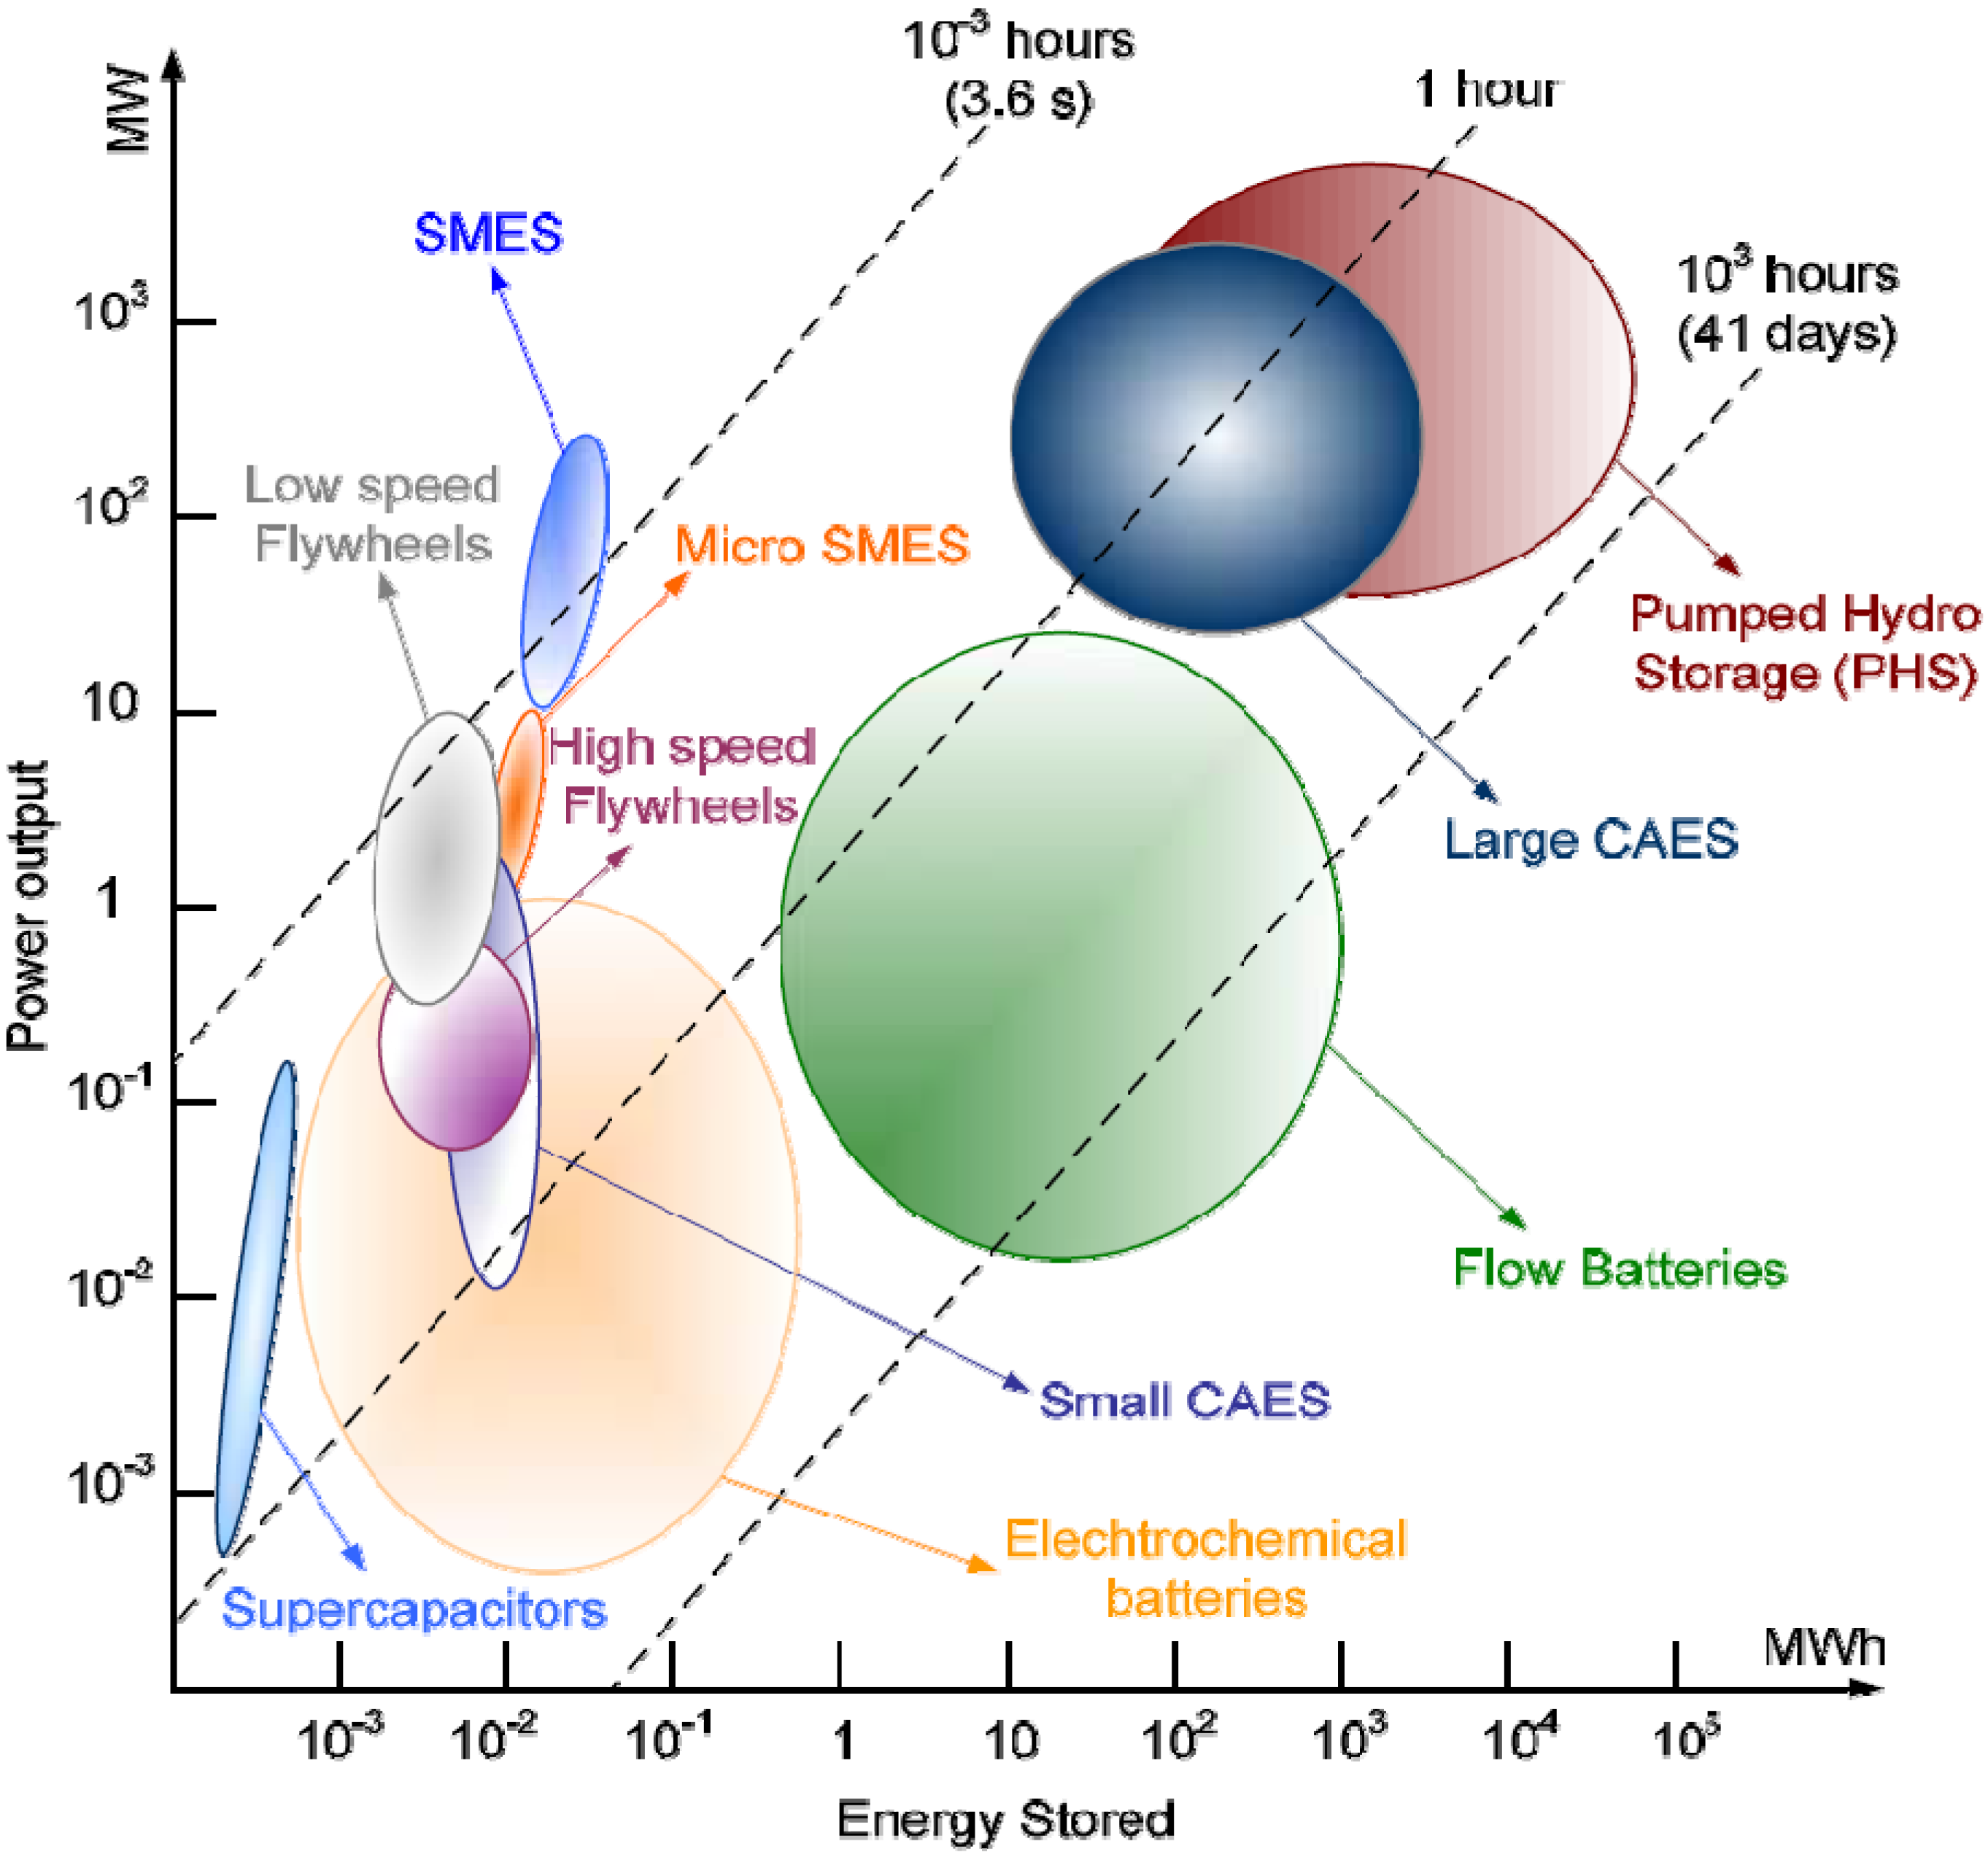
Two main comparison approaches can be considered in the choice of a storage system for a given application. In the first approach, the storage system may be selected based on its capability to provide energy for a long or short time. Such a comparison is shown in
Figure 1.
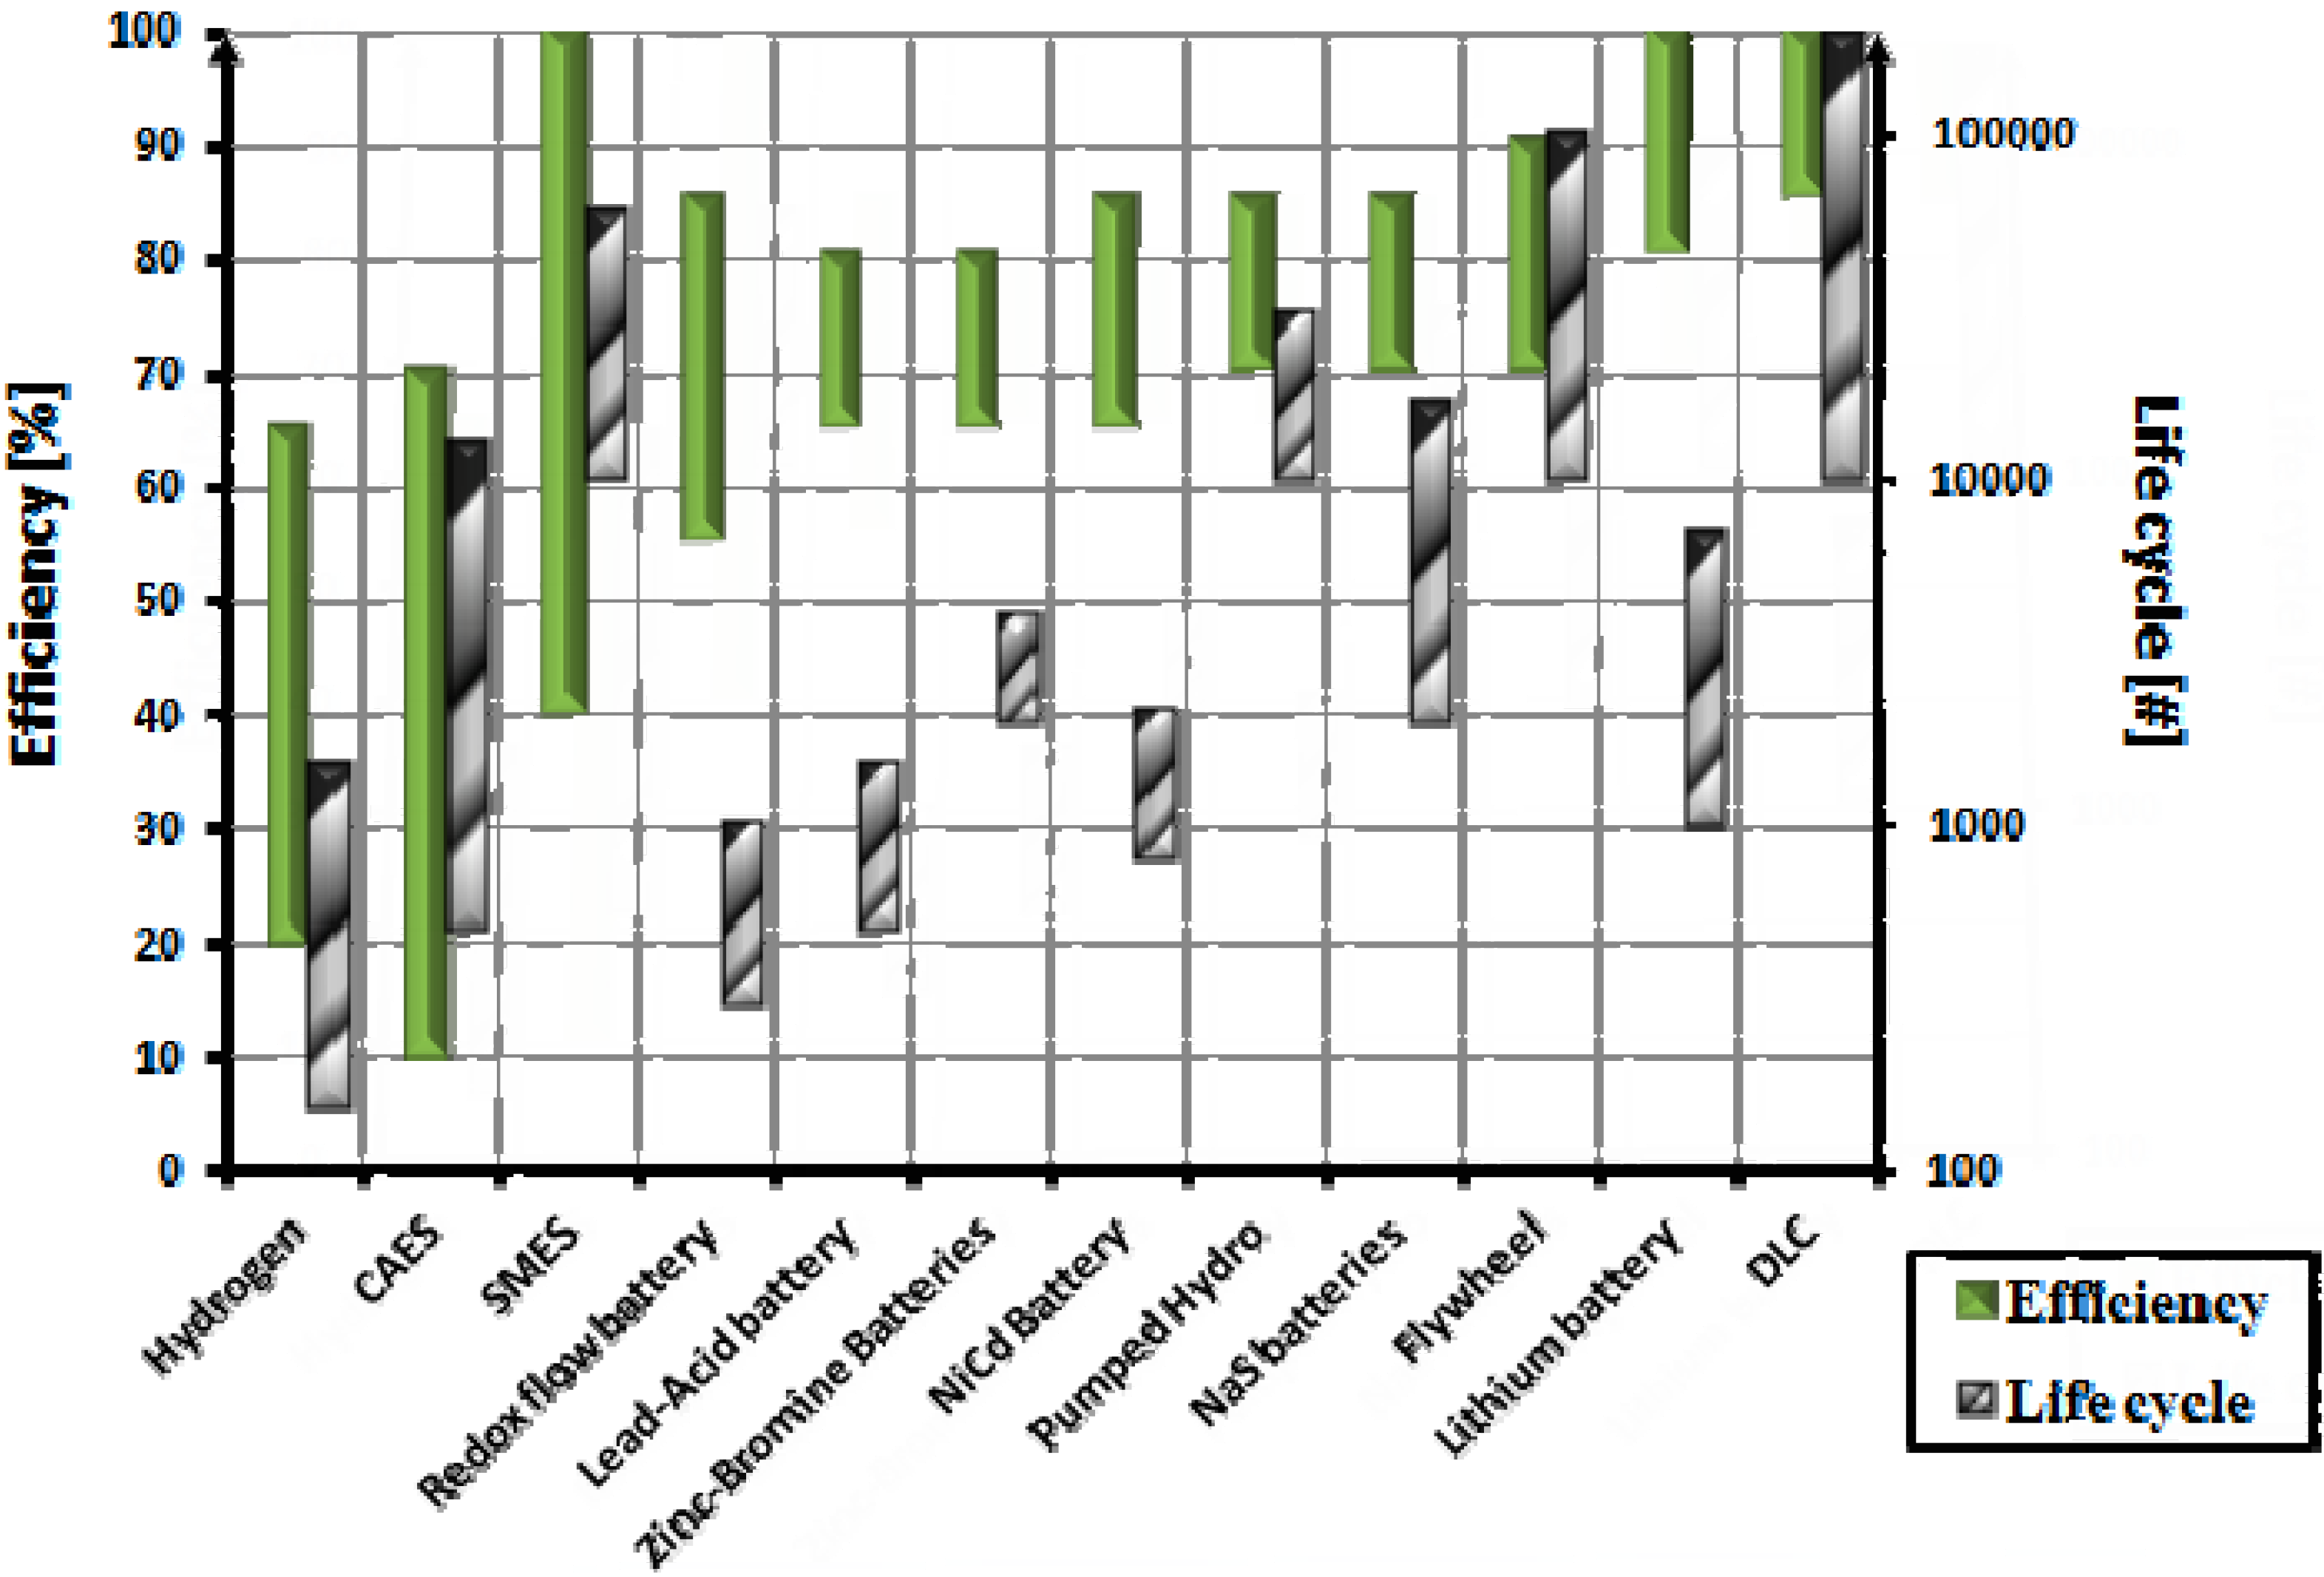
The second approach is based on the efficiency and life cycle comparison of energy storage systems. This approach is suitable for economic evaluation of the possible options, special application with limited available energy source and a high number of cycling requirement. Such a comparison is shown in
Figure 2. In this illustration, energy storage systems are arranged based on increasing efficiency.
Considering the storage capacity of different storage systems shown in
Figure 1, an appropriate energy storage system may be selected using a comparison chart based on efficiency and life cycle, as shown in
Figure 2. Flywheels and batteries are highly efficient, while CAES and pumped hydro storage systems can be used in applications that require high energy with reasonable efficiency and significant life cycle.
The energy storage capacity of each storage system can be calculated using a steady state representative of the energy conversion procedure. Based on their energy conversion process, four main categories for energy storage systems can be considered for the following technologies: Batteries, Flywheels, Pumped Hydro, and CAES. These energy storage technologies have been chosen in this paper in order to develop the novel comparison criterion based on their energy harvesting capacity. In order to compare their energy storage capability, the required equations to describe the storage behavior of each energy storage system will be provided in the next part of this overview.
Figure 1.
Energy storage systems with different storage capacity [
9].
Figure 1.
Energy storage systems with different storage capacity [
9].
Figure 2.
Energy storage comparison, based on efficiency and life cycle.
Figure 2.
Energy storage comparison, based on efficiency and life cycle.
The energy capacity of a battery is usually defined based on the cell voltage product to its nominal discharge current rate known as ampere-hours (Ahr), which is provided by the manufacturer. The charge and discharge characteristics of a battery can be examined utilizing a mathematical model. A comprehensive model of a typical battery comprises three sub-models: a thermal sub-model to represent the electrolyte temperature based on the thermal properties of the material and battery losses; the charge and capacity model to depict the state of the charge (SOC) and depth of discharge current (DOC); and an equivalent circuit to simulate the dynamic performance of the battery [
18]. Although utilizing this model results in an accurate battery model, it requires a large number of parameters, for which obtaining their exact value can be a complicated and time consuming procedure. On the other hand, a generic battery model that represents a battery’s performance during charging and discharging procedures can be satisfactory in studies, and this only requires steady state analysis [
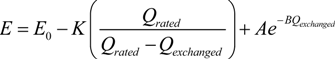
19]. As a general description, its terminal voltage can be approximated by an exponential mathematical equation as follow [
19]:
where its parameters can be directly obtained from the manufacturer’s datasheet. The exchanged electrical charges during charge and discharge cycles can be obtained by integrating its current.
The battery capacity can be considered steady during the discharge hours by neglecting discharge effect on temperature and output voltage characteristics.
In a flywheel energy storage system, the excess energy is stored in a rotating mass in kinetic energy form. This system, based on its fast energy conversion mechanism, is appropriate in applications that require high power capability. In such a system, the total kinetic energy stored within a flywheel can be calculated using the following equation [
13]:
where
mf is the rotating mass of the flywheel in kg and
V is the circular velocity of the flywheel in m/s.
The pumped hydro energy storage system is the oldest energy storage technology in the world. This system includes a pump-turbine, a higher reservoir and a lower reservoir. During low demand periods, the excess energy is applied to pump water to a higher reservoir. The stored water will be released to a lower reservoir while the stored energy is delivered to the customers utilizing the turbine. Based on required infrastructures in such an energy storage system, pumped hydro storage is more suitable for utility scale energy storage systems. The mass power output of a pumped hydro energy storage system can be determined by the stored potential power in its reservoir using the following equation [
8]:
where
ρ is density of water in kg/m
3,
g is acceleration due to gravity in m/s
2,
Q is discharge through the turbines in m
3/s,
H is effective head in m and
ηP is efficiency of the pump. The delivered energy of a pumped hydro storage system can be determined by the product of the output power obtained in Equation (4) and the time duration.
In a CAES system, energy can be stored as high pressure air in a high pressure reservoir by applying work to the compressor. The energy storage procedure in this technology follows the thermodynamic law of energy conversion for air. The stored energy depends on reservoir volume, pressure, temperature, and its energy conversion process, which can be isothermal, adiabatic, or isentropic. The amount of work, in a polytropic process, is expressed as [
2,
20]:
where
n is the polytropic exponent (
cp/
cv),
P1 and
P2 are the atmospheric and the tank pressure in a compression cycle respectively.
These energy equations assemble all the limiting parameters in each energy storage capacity. Considering the energy capacity representative of each energy storage technology, it can be concluded that each storage system has physical limitations on the maximum storage capacity. For example, the volume of the reservoir in a pumped hydro system or the rotational speed and mass of a flywheel is limited. This maximum capacity can be considered as a criterion for storage capability assessment of energy storage technologies, which is critical in a wind based energy system. Consequently, this constraint on energy storage capacity is the core focus of this paper in the evaluation of the performance of the selected energy storage technologies.
4. Proposed Hybrid Power System (HPS) Description
Incorporating RES in electrical generation by connecting them to existing power systems, results in a HPS. Although, a HPS can be either a grid-connected or isolated power system, this study focuses on an isolated community. Utilizing a backup energy source is essential for isolated application in order to increase the reliability of the wind-based energy system.
In a grid-connected energy system, wind energy fluctuation can be compensated by the power system. On the other hand, remote communities, which are not connected to the electrical power grid, are generally dependent on diesel generators as their backup energy source, a polluting and relatively expensive electricity production option. In northern, isolated communities, additional transportation difficulties for supplying fuel during winter months make electricity production by diesel generators unreliable (e.g., the required fuel cannot be delivered on time and the stored fuel is not sufficient). In recent years, attention to wind energy has increased as an important RES in such communities with good wind resource. Incorporating an effective energy storage system could improve the smoothness of the wind farm energy output, make the system less dependent on weather prediction, and result in a desirable less uncertain energy source.
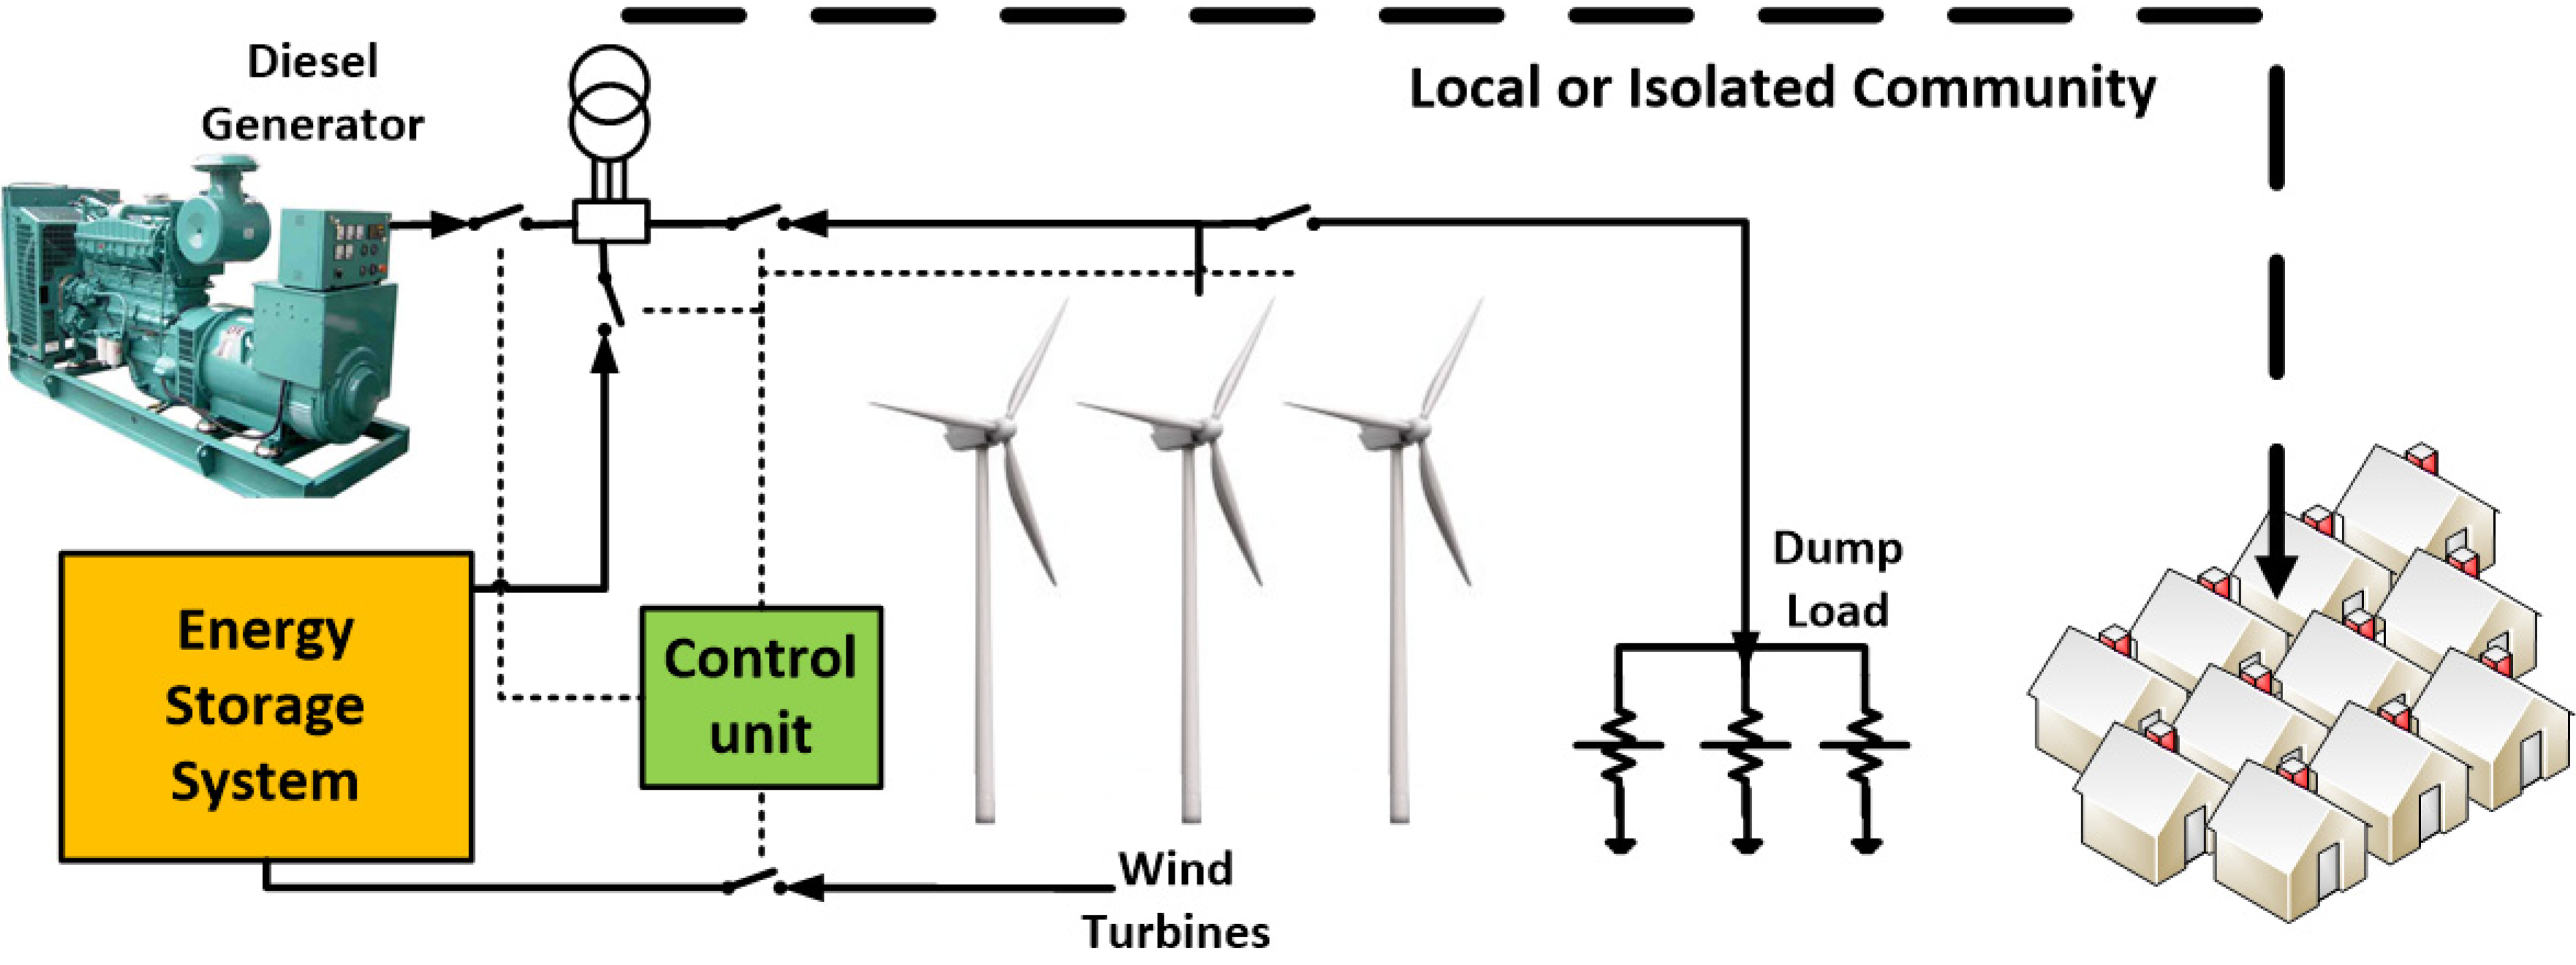
The main objective is to develop a reliable and efficient source of electricity with proper control strategy that can harvest the maximum amount of available wind energy in order to provide continuous service to customers connected to an isolated grid. In the system proposed in this paper, when the output energy of a wind turbine is greater than the energy demand, the excess energy is converted into another energy form and stored. In the case that the wind turbine cannot deliver the required energy, the stored energy is converted to electrical energy. A general schematic of a hybrid wind based energy system for an isolated application is shown in
Figure 3.
Figure 3.
Schematic of the proposed hybrid system.
Figure 3.
Schematic of the proposed hybrid system.
To ensure a continuous and reliable supply of electricity to the isolated community, it is assumed that the existing diesel generators can be utilized for backup purposes. The main purpose of using the diesel generator as a backup is to support the unreliable wind based power system and guarantee the reliable operation of the HPS. The diesel generator operates when the total output power of wind turbine and storage system is not sufficient to meet the power demand. On the other hand, in order to retain the stability of the power system in high wind regimes when the storage system is fully charged, a dump load will be connected to the wind turbine output. Consequently, the proposed hybrid system includes the existing diesel generators, wind turbines, an energy storage system, dump loads, and a control unit for dynamic energy management. The objective of such an implementation is to reduce the diesel generator’s total fuel consumption. Two different mode of operation can be considered for the diesel generators in a wind based HPS: Standby and On-Off mode of operation. In an On-Off mode of operation, an energy storage system eliminates the no load operation of the diesel generator and results in more economical operation of the diesel generator. On the other hand, the standby mode of operation requires more fuel consumption as a result of no load fuel consumption.
The proposed system is used in this study to assess the performance of the design and control strategy development of a CAES systems based on its energy storage capacity.
The available wind power output on the rotor of a wind turbine can be approximated as [
7,
21]:
where
Cp is the wind power coefficient,
Ar is the cross section area swept by rotor and
Vw is the wind speed. The air density
ρ can be taken as 1.225 kg/m
3. In this study, the Bergey Excel-S 10 kW wind turbine is chosen, based on the available average wind speed and demand. Considering the power curve provided by the manufacturer, the
Cp value can be considered as a function of wind speed, and it can be obtained using a Gaussian Equation in the following form:
where
Vw is the wind speed and other parameters are provided in
Table 1.
Table 1.
The Gaussian Equation parameters for Cp approximation.
Table 1.
The Gaussian Equation parameters for Cp approximation.
| Parameter | Value | Parameter | Value | Parameter | Value |
|---|
| ɑ1 | 0.2 | b1 | 5.963 | c1 | 2.218 |
| ɑ 2 | 0.1555 | b2 | 3.825 | c2 | 1.228 |
| ɑ 3 | 0.2439 | b3 | 10.06 | c3 | 4.004 |
| ɑ 4 | 0.1056 | b4 | 15.59 | c4 | 5.769 |
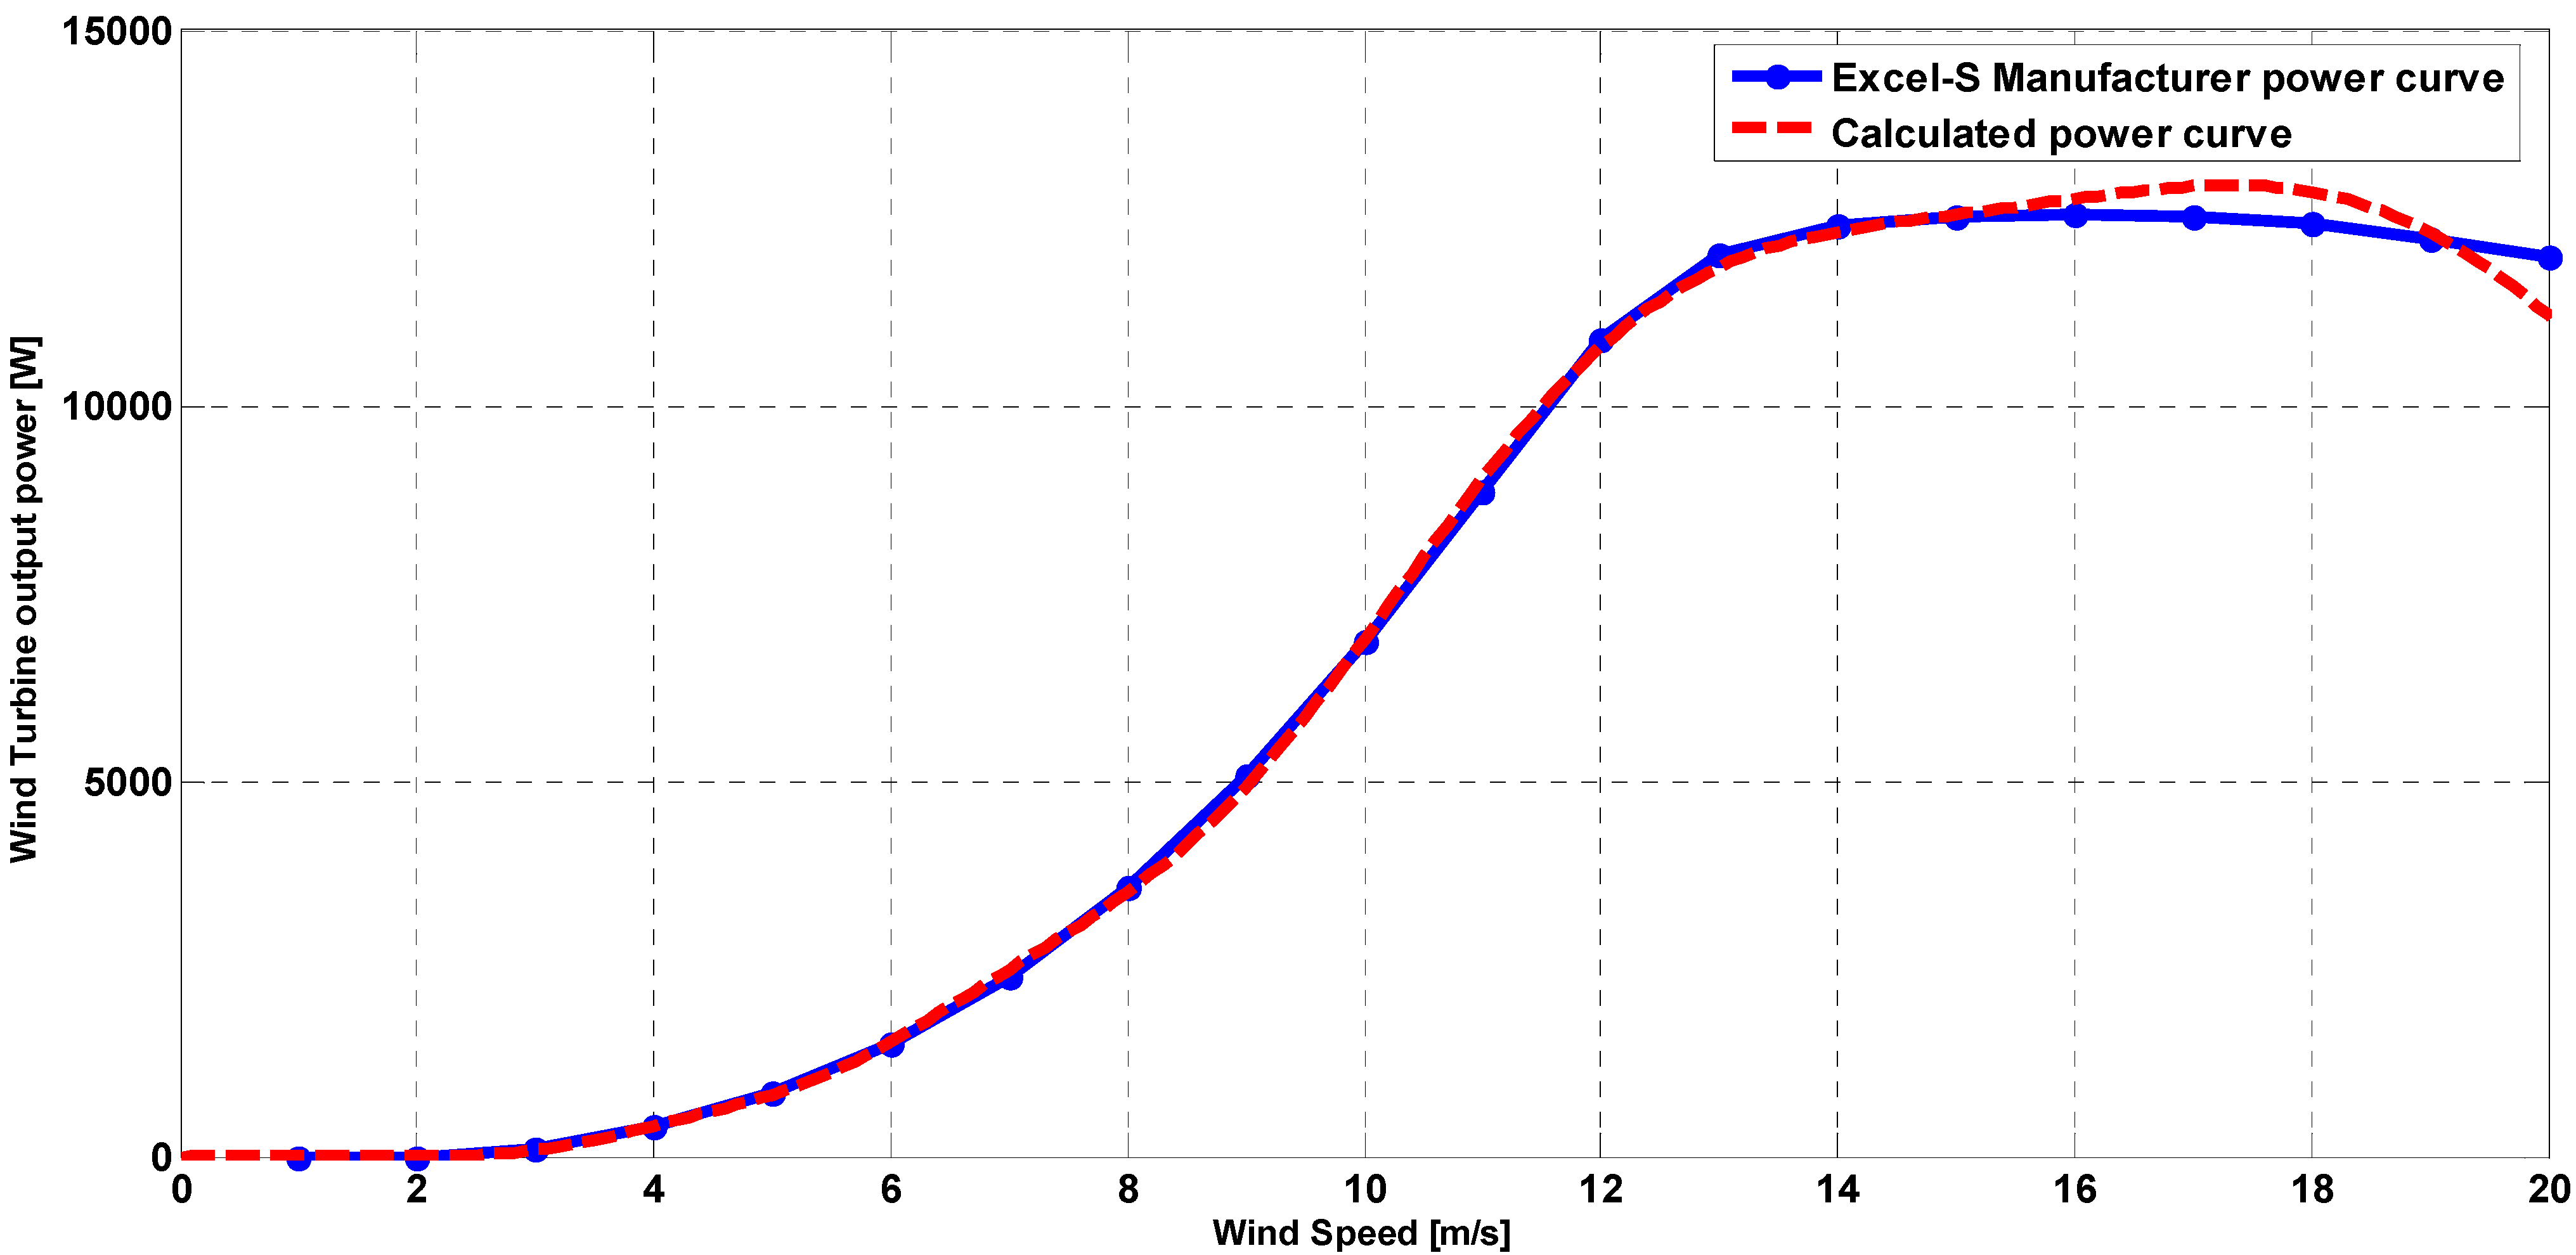
The calculated
Cp value as a function of wind speed variation was applied to Equation (7), and the obtained power curve is shown in
Figure 4, where it has been compared to the Bergey Excel-S 10 kW wind turbine power curve from its manufacturer’s datasheet. The resulting power curve is almost identical to its catalog values for wind speeds lower than 16 m/s. This approximation is sufficient for wind farms located in sites where the wind speed average value is less than 16 m/s, which is valid for the objective site of this case study (Ramea, NL, Canada).
Figure 4.
The calculated power curve V.S the manufacturer datasheet.
Figure 4.
The calculated power curve V.S the manufacturer datasheet.
The obtained power Equation (7) for the wind turbine can be utilized to calculate the wind farm power output. The available wind power during a day can be calculated using the average hourly wind speed data. The wind speed data for our object location was available based on one sample per hour measurement frequency. Therefore, the wind speed was assumed to be constant hourly, which is acceptable in this analysis considering its steady state nature. More detailed measurements, based on a higher frequency data logging system, might have better resolution than the present study. In addition, the wind speed measurement data in this study was recorded at a 10 m height and its value has been modified based on the required Bergey Excel-S 10 kW wind turbine tower.
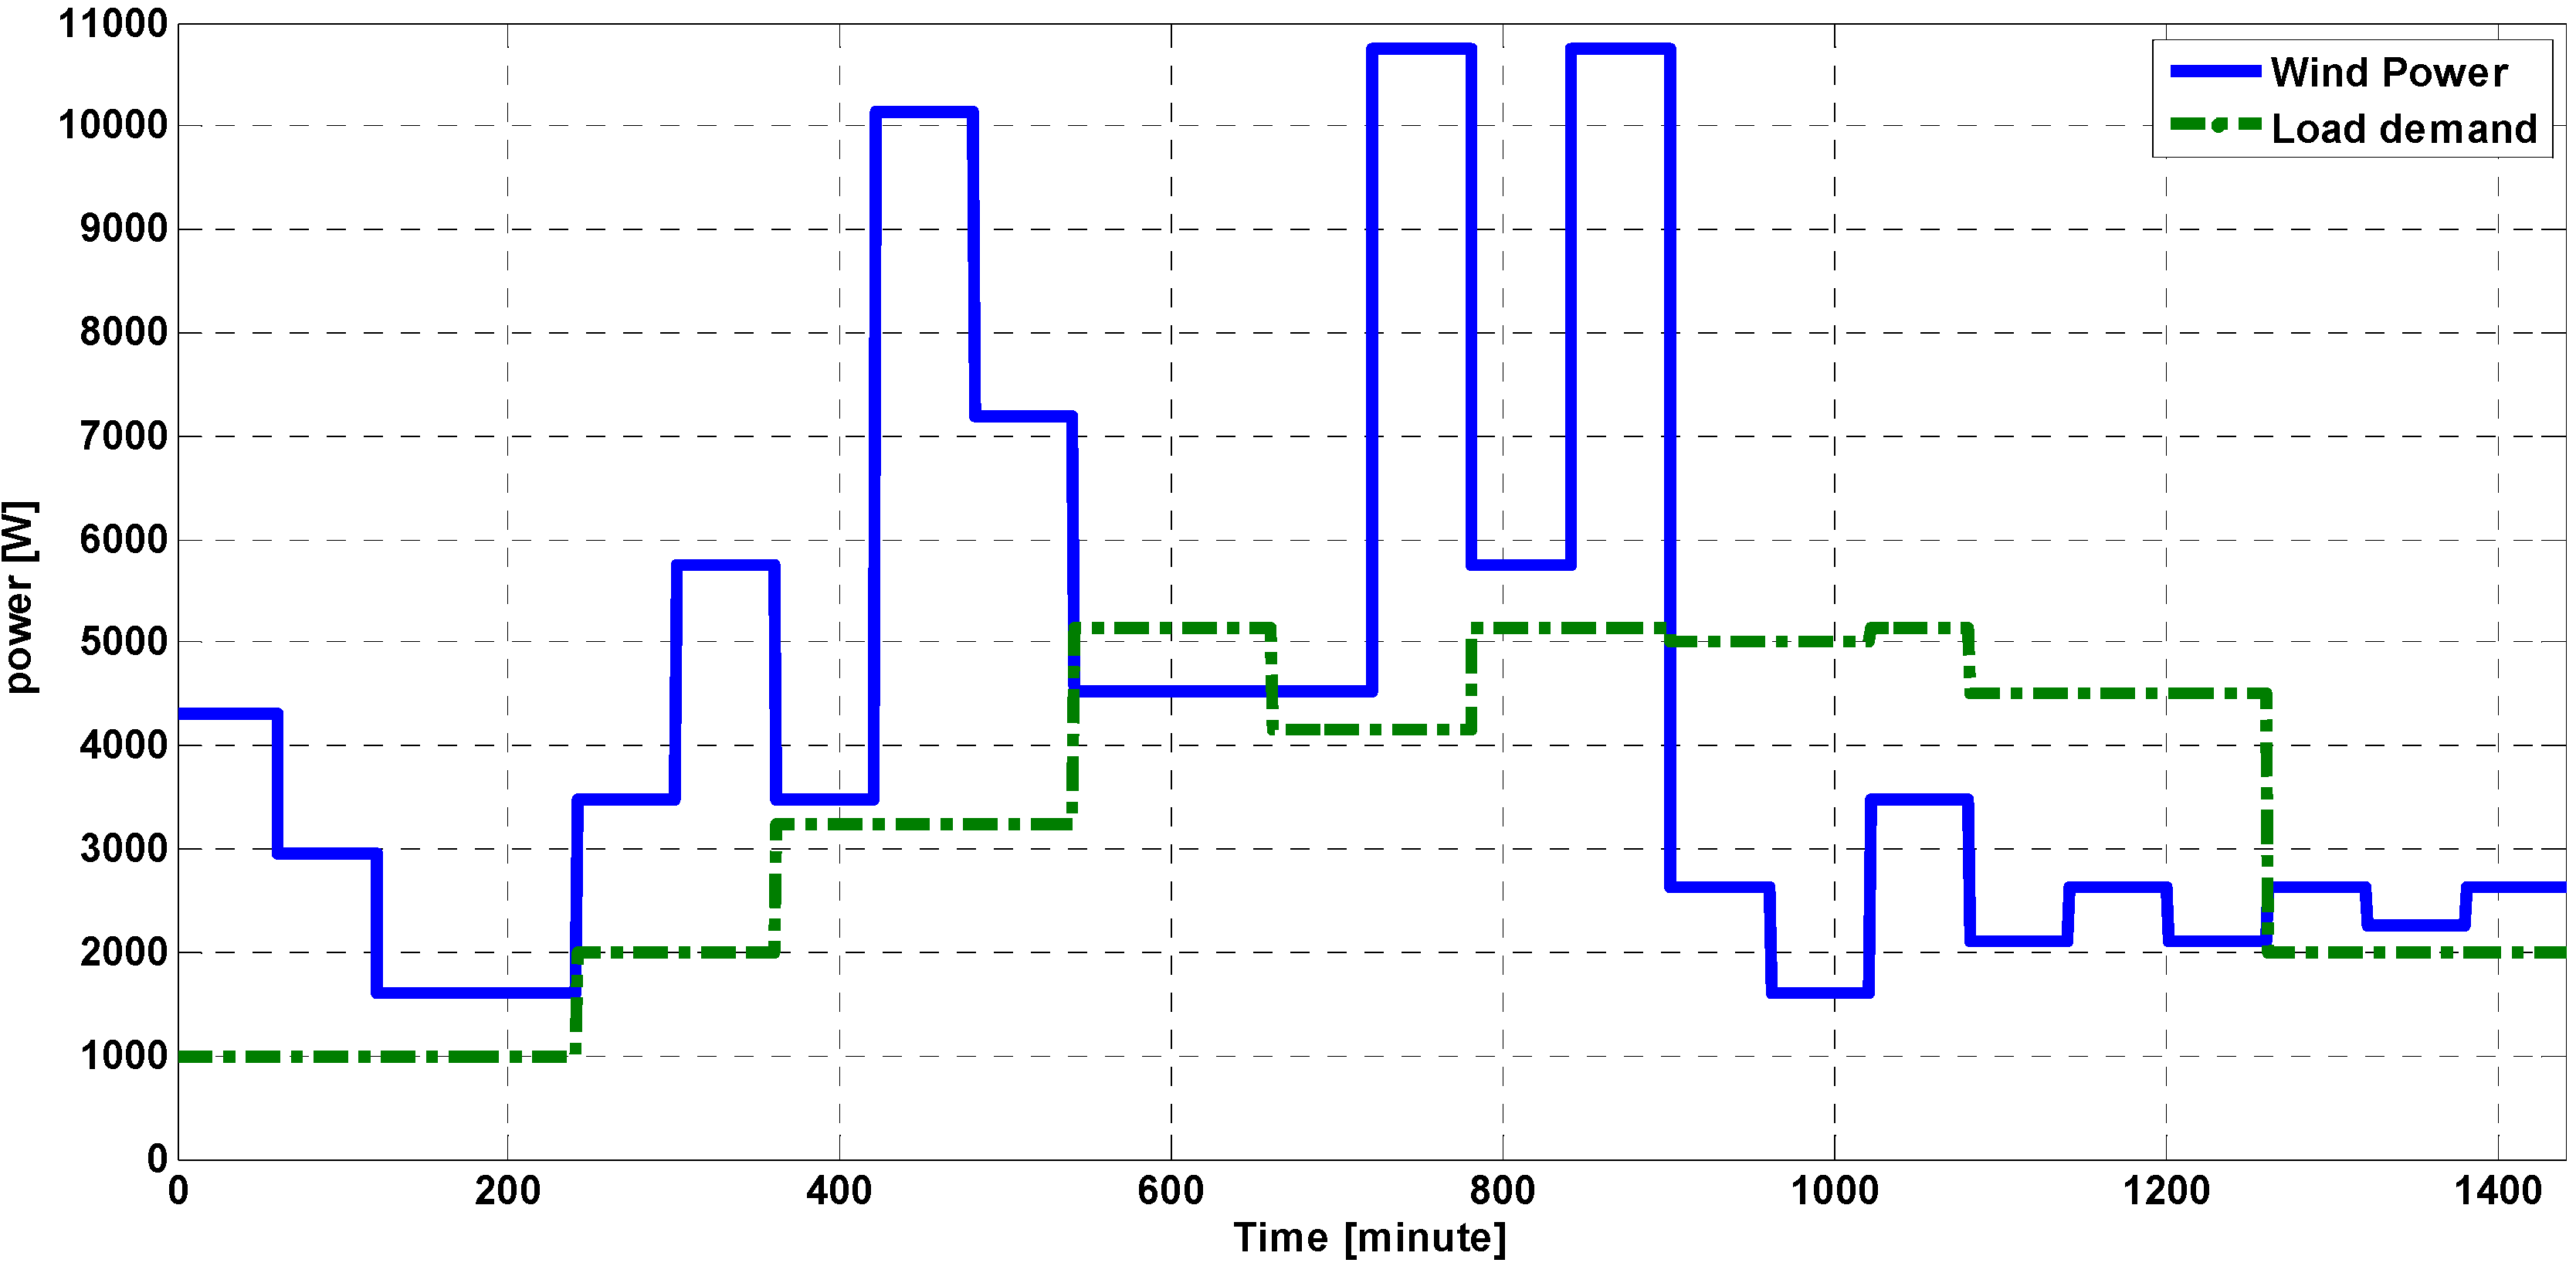
Figure 5 shows the wind power variation and demand power curve in a minute time scale in a single day. A comprehensive performance assessment should be applied to an accurate demand and wind speed database for a long period of the time. However, the analysis was performed in a limited 24 h case study in order to show the effectiveness of the proposed method with a higher time resolution for locations that can benefit from significant wind potential.
Figure 5.
The wind power and demand power curve in minute time scale.
Figure 5.
The wind power and demand power curve in minute time scale.
A comparative study, based on efficiency, life cycle, cost (including initial and operational costs), and energy/power rating, as well as simplicity of implementation and its expandability [
8,
10,
14], leads to the selection of the CAES as the most suitable energy storage system for application in a remote community power supply.
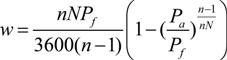
A typical CAES plant includes the following components: power system including expander(s), compressor(s) and generator; control equipment including supervisory control unit, switchgear, cooling and heating system; and high pressure reservoir with airflow piping. Considering Equation (5), the stored energy in a fixed volume is related to the pressure ratio, and by increasing the pressure ratio both the stored energy and energy density of a CAES system can be increased. The energy density of the storage system is a critical parameter. The energy storage density (
w) in kWh/m
3 can be expressed by the following equation:
where
n is the polytropic coefficient,
N is the number of stages,
Pa is the atmospheric pressure and
Pf is the final pressure.
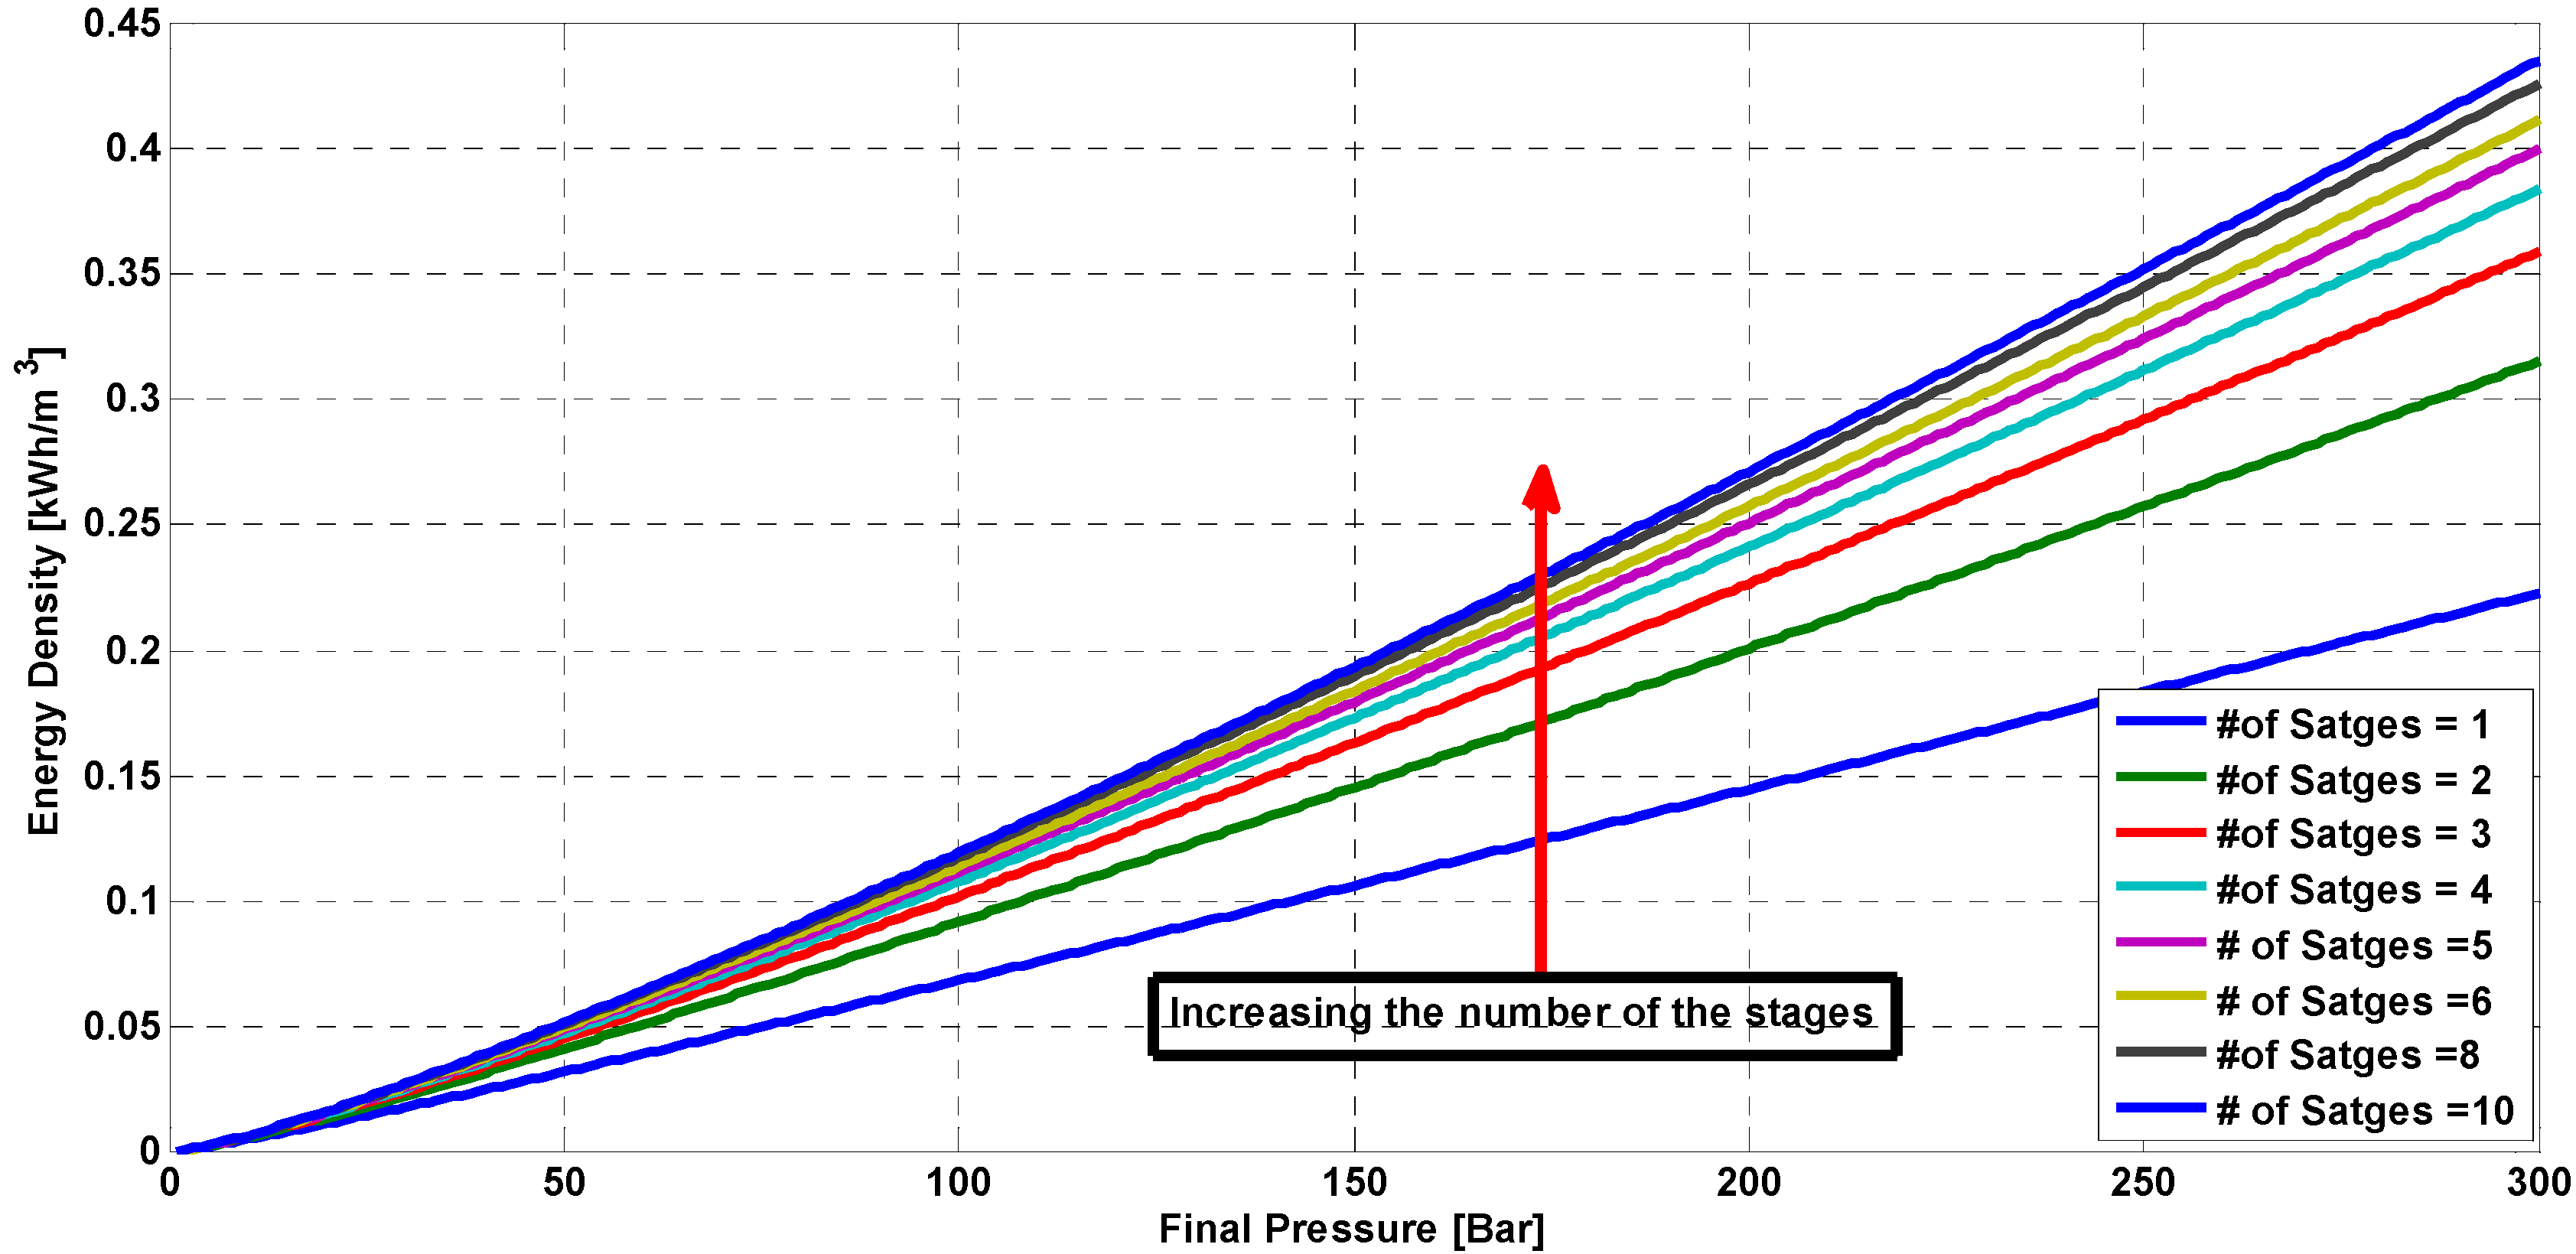
Figure 6 shows the variation of the pneumatic CAES storage energy density with changes in the number of energy conversion stages and working pressure. It can be observed that it is essential to increase the maximum pressure in the tank in order to increase the energy density of the storage system. In addition, increasing the number of stages can improve the energy density characteristics of the storage system. However, the effect of increasing the number of stages on the energy density will be decreased in all pressure ratios, especially after five stages. This result should be considered in general design of a CAES system in order to define the optimum number of stages and its working pressure.
Figure 6.
Energy density variation as function of number compression stages and pressure.
Figure 6.
Energy density variation as function of number compression stages and pressure.
The efficiency of CAES systems has been considered as the main drawback in many studies [
8,
9,
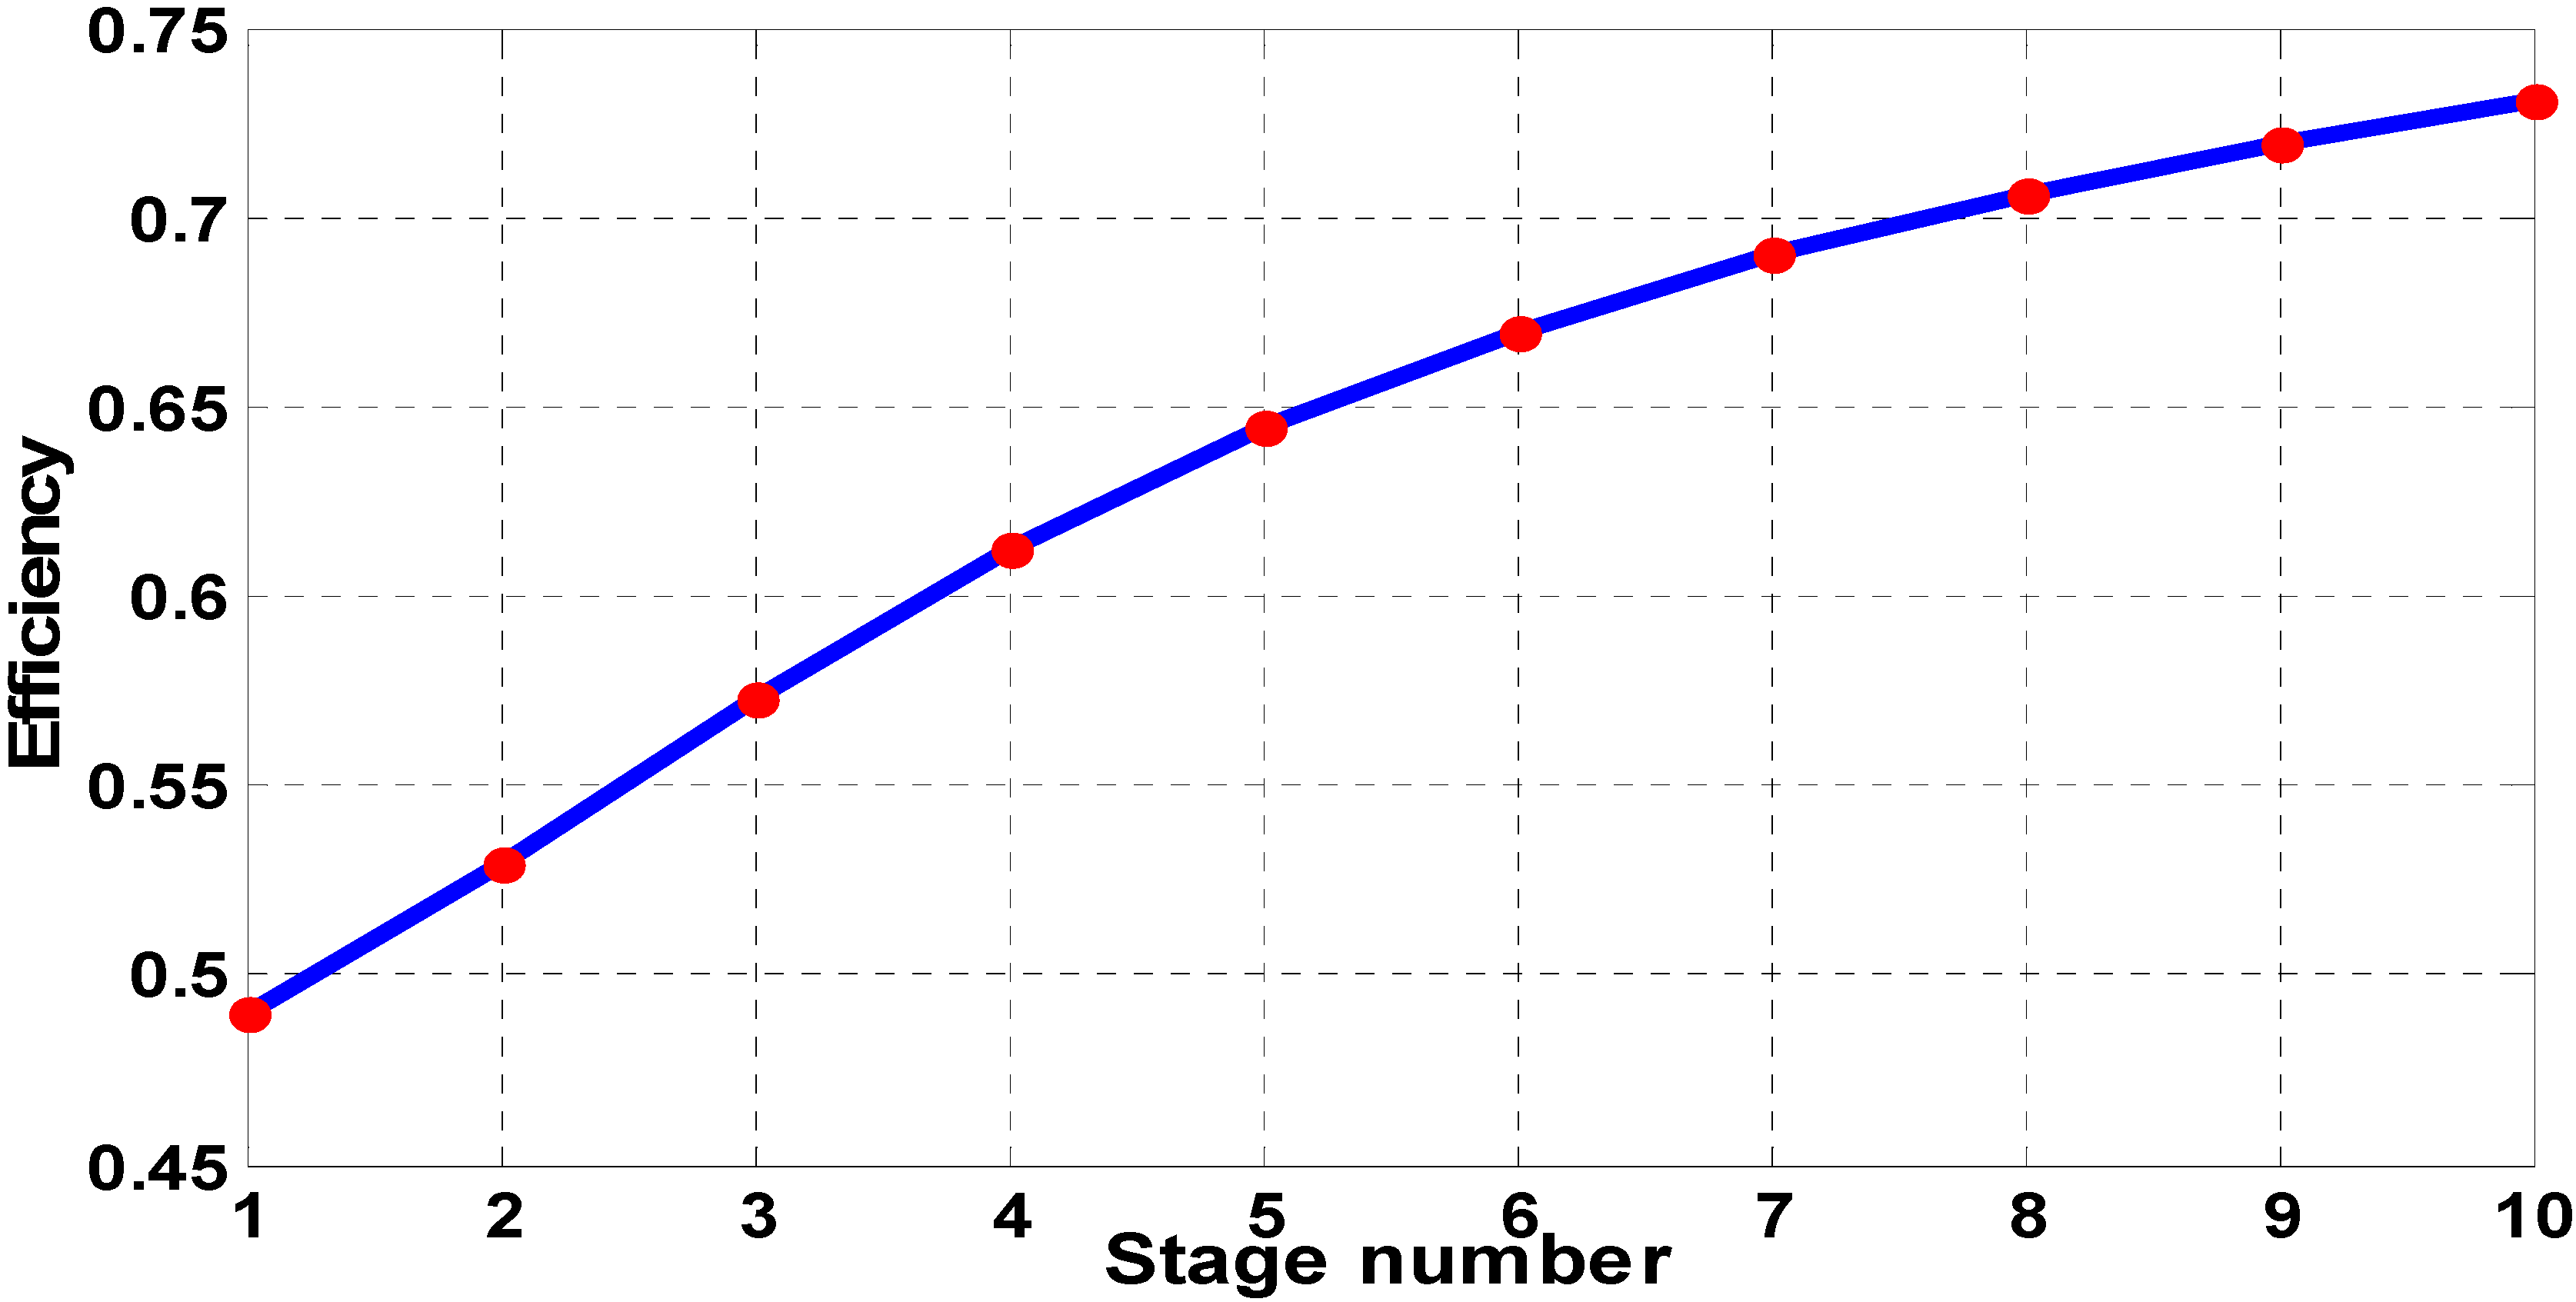
11]. Low efficiency for single-stage compression and expansion is the limiting factor of a very high pressure system. However, an efficient design of such a system can lead to an enhanced performance of a CAES system. Highly efficient heat exchangers for after compression cooling and pre heating between expansion stages can be utilized to overcome this limitation. In addition, compressing air in multi-stages instead of one stage can improve the overall energy conversion efficiency (see
Figure 6). For example, changes in efficiency of the compression cycle with higher compression stages are shown in
Figure 7. As the Figure illustrates, the efficiency can be increased using more compression stages. As a result, the challenge will be to compromise between the performance, complexity and the total cost of a CAES system.
Figure 7.
Change in efficiency with different compression stages.
Figure 7.
Change in efficiency with different compression stages.
5. Using the Harvested Energy Index in CAES Systems
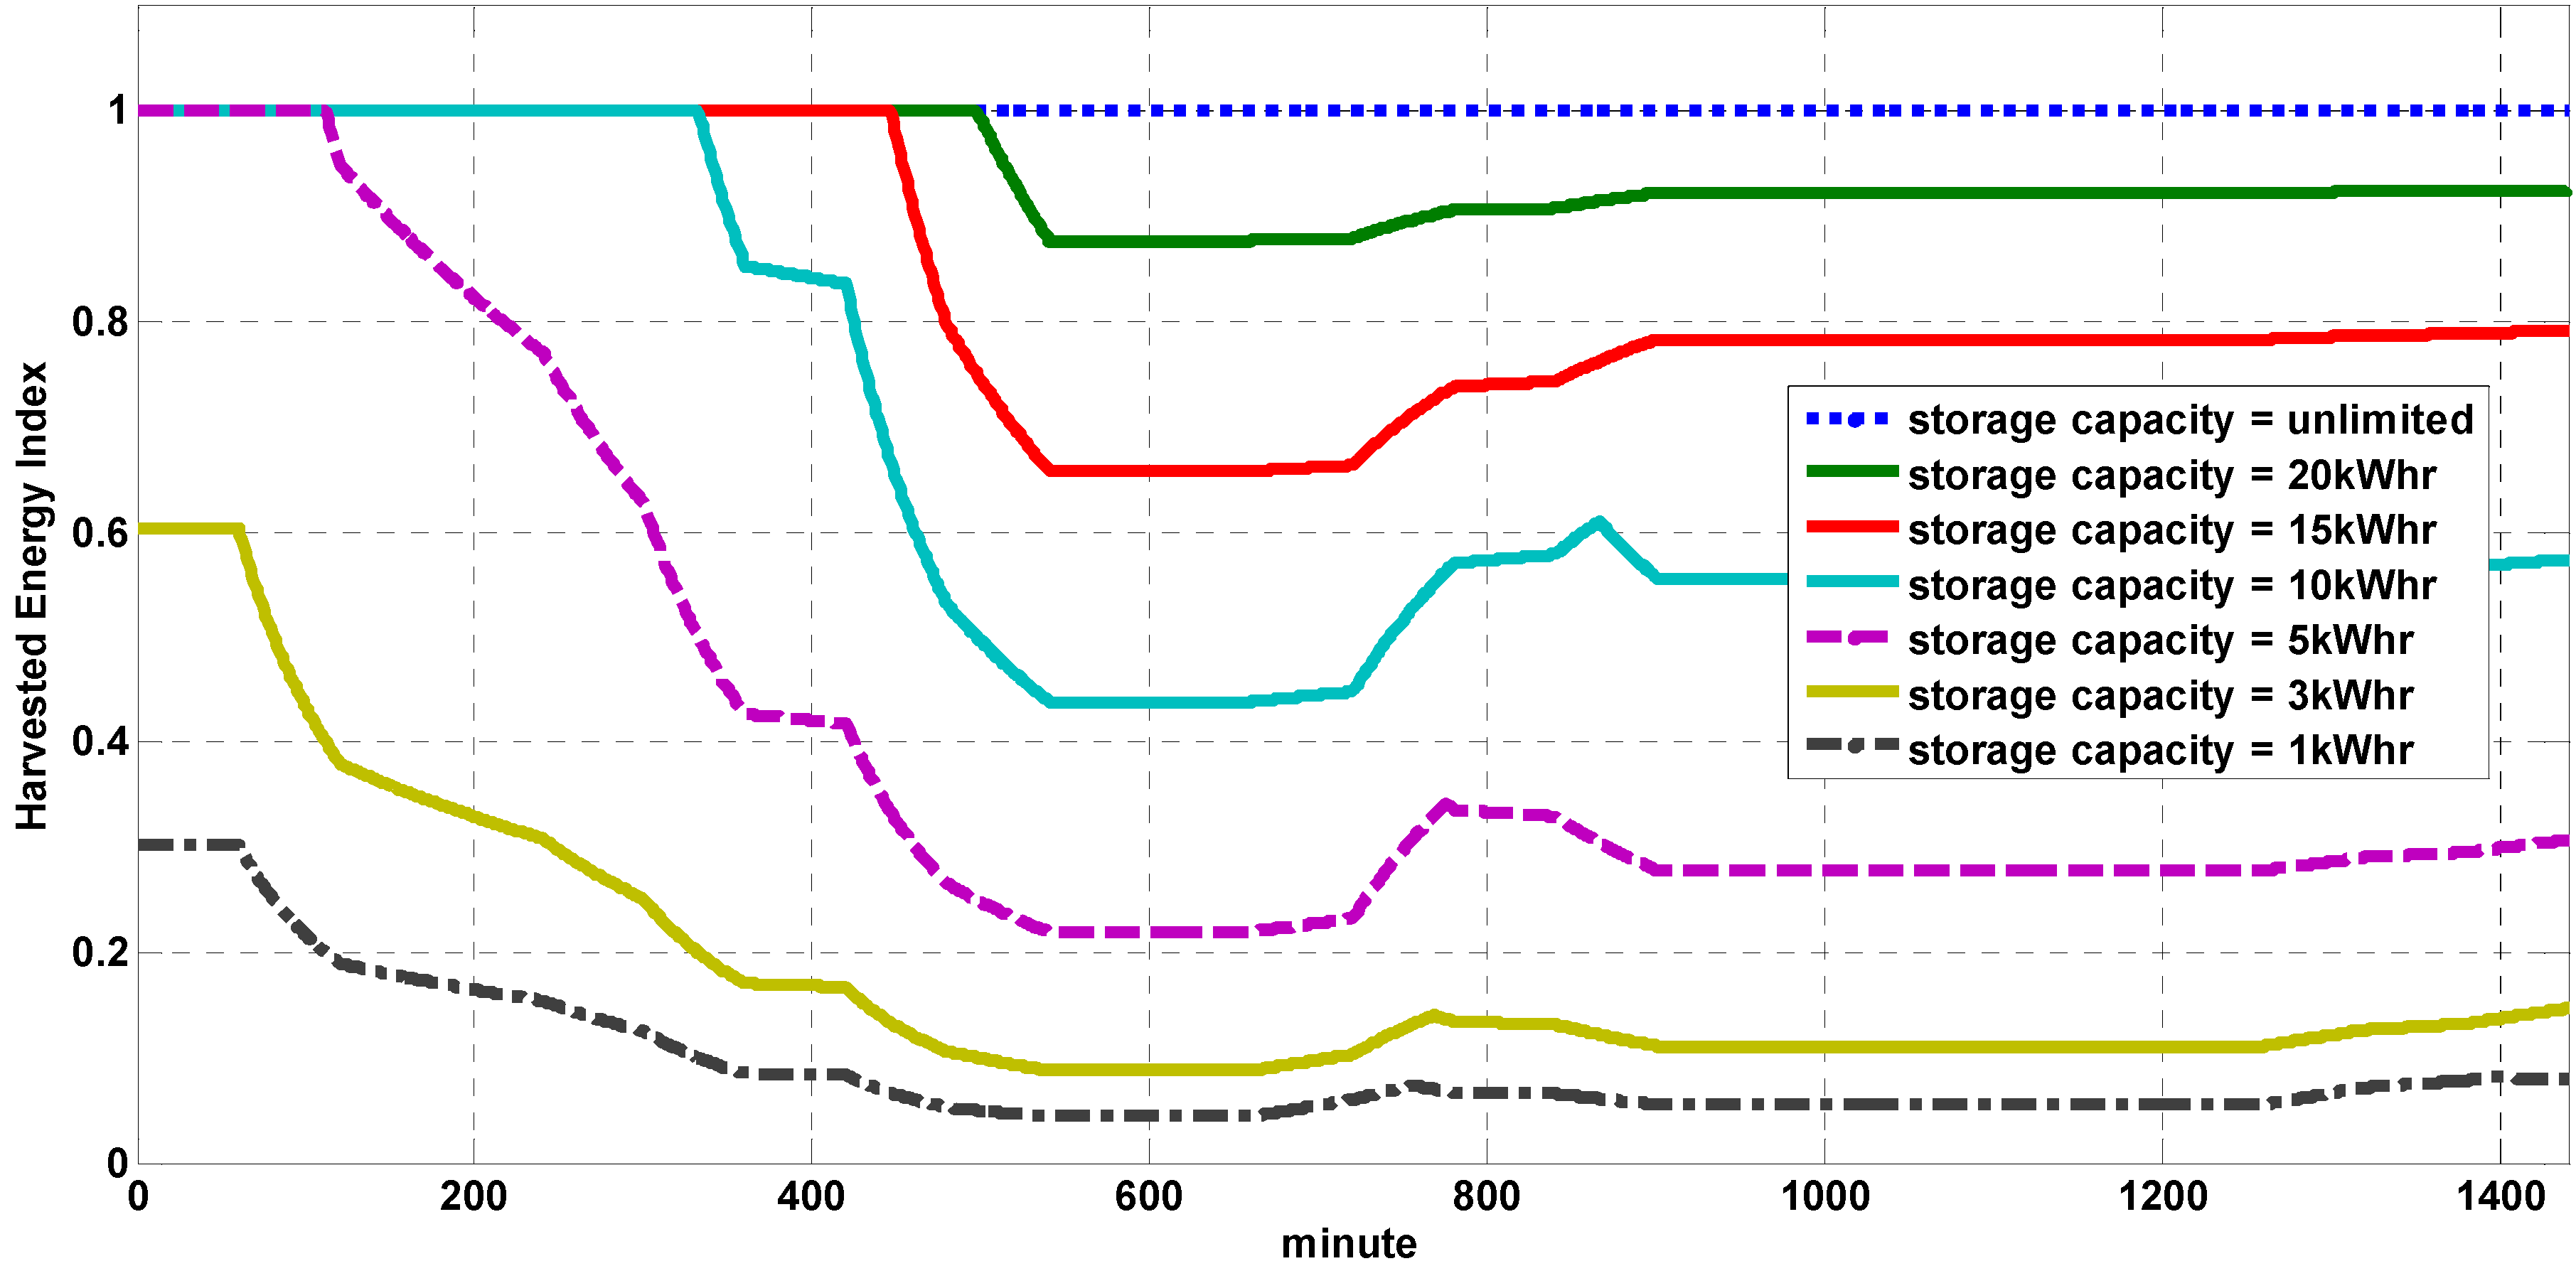
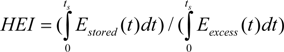
To show the effect of the proposed performance index on the overall design of a wind based hybrid energy system, the Harvested Energy Index (HEI) for different energy storage systems and different capacities is calculated. The analysis of the proposed HEI in performance assessment of an energy storage system can be done through a case study. The challenges in this analysis are to design a storage system with proper sizing. In addition, an optimum control strategy should be developed in order to harvest the maximum energy from the available wind source. Using Equation (6), the harvested energy indices for different energy storage capacities are calculated and shown in
Figure 8 over a minute time scale during a day. According to this result, increasing the size of the storage system will result in more captured energy from wind.
Figure 8.
Harvested Energy index for different energy storage capacity.
Figure 8.
Harvested Energy index for different energy storage capacity.
According to Equation (6), when the storage system reaches its nominal capacity it cannot store more energy and the numerator of the Equation (6) will be a constant. Assuming that excess energy availability continues for say, two more hours, the denominator of Equation (6) will increase during these two hours while its numerator is constant. This accumulation on the denominator leads to a reduction in the HEI and shows the limitation of the storage system to gain more excess energy. This limitation is shown in
Figure 8, where the storage system with lower capacities saturate faster in comparison with the systems with higher capacities. This behavior reveals the limitation of such systems in extracting available free wind energy which can improve the wind penetration profile of the HPS during the presented case study time. Among all the energy storage systems, the system with unlimited capacity is the only system that is able to harvest all the excess energy in the presented example. The corresponding HEI for such a system, with 100% energy harvesting capability, is shown by the line with fixed value of 1. However, a storage system with unlimited storage capacity is not feasible, and compromise between the capital cost and the technical advantage of high capacity storage system should be made by the system designer. In this case study, all calculated indices are obtained by assuming that the energy conversion systems have the required power rating to convert the excess energy into the desired energy form.
As can be concluded from
Figure 8, an energy storage systems with limited energy storage capacity cannot benefit from the excess wind energy when they reach their nominal capacity, and their HEI will decline from its maximum value. As mentioned before, all other energy storage systems except CAES have physical limitations on their storage capacity. A CAES system capacity can be expandable using higher working pressure considering the maximum permissible stress on the reservoir. Considering HEI, the scalability characteristic is the major advantage that the CAES system has over other storage systems. Simple modifications to the energy storage equipment of the CAES system not only increases the storage efficiency, but also improves its energy harvesting capability and makes it a unique alternative among all the energy storage technologies.
In order to investigate the effect of the HEI on the overall performance of a hybrid system installed at Ramea Island in Newfoundland is considered. The wind speed at the wind farm during a day is applied to the modeled Bergey Excel-S 10 kW wind turbine and the load profile (
Figure 5) of a single user is considered for modeling the variable load demand.
The required power of compressors can be calculated by derivation of the work equation with respect to time. All the working parameters of a compressor, except flow rate (
Q), can be considered constant (assuming an efficient heat exchange with the environment). The power of the compressor can be obtained from Equation (5) as:
where
PR is the ratio of the compressor output pressure to its input pressure (
P1). Assuming a polytropic process for both compression and expansion, the polytropic exponent of air for the compression process can be considered 1.45 for compression and 1.36 for expansion [
14]. The pressure of the tank will increase depending on the amount of the entered air mass to the reservoir based on Equation (11), where the change in air mass can be calculated using Equation (12):
where
R is the gas constant and
T is the working air temperature.
The change of the compressed air stored in the reservoir can be calculated and it depends on the available power for the high pressure compressor. The change in stored energy is formulated using presented equations (5) and (7 to 12). The available wind power output defines the working condition of the other components of the hybrid power system. Based on this value, the following scenarios was considered for the HPS:
- 1-
The charging cycle: This condition happens when the output power of the wind turbine is more than the load, and the storage system has available storage capacity. In this condition, the excess power is applied to the compressor and the output flow rate of the compressor is calculated using Equation (10). The total air mass entered to the high pressure tank can be obtained using Equation (12) and the tank pressure can be obtained using Equation (11). The tank pressure will continue to increase as long as the excess power is available and the tank pressure is lower than its nominal value.
- 2-
The rejection cycle: In this cycle, the energy storage is charged to its maximum capacity and any additional power cannot be stored. Considering the fixed blade configuration for the wind turbine, this rejected power will be consumed by the dump load in order to maintain the system stability.
- 3-
The discharge cycle: The storage system starts to deliver power to the load, when the output power of the wind turbine is not sufficient to meet the demand. This cycle will be terminated when the storage system is fully discharged or the wind speed increases and the wind turbine output power is sufficient for the load.
- 4-
The shortage cycle: Diesel generator will operate in this mode in order to compensate the wind turbine output power. In this situation, the total power of the wind turbine and storage system is less than the required power for the load. The fuel consumption of the diesel can be calculated by using its power-fuel consumption equation.
In this study, a four-stroke Yanmar Powered 6.5 kW diesel generator was chosen and its power-fuel consumption curve was approximated by the following equation, based on its manufacturer datasheet.
where
PDG is the diesel generator power in W and
FCDG is the diesel generator fuel consumption in L/h.
The tank volume was considered 6.06 m
3 in order to store 5 kWhr in 16 bar working pressure. This value was chosen, based on the obtained HEI for different energy storage capacities shown in
Figure 8. As seen in this Figure, the system with the 5 kWhr capacity is the first storage system which can reach 100 percent HEI, and has a capacity close to the maximum load. The working pressure of the 16 bar was chosen for the base working pressure of the system by considering four-stage compression with reasonable energy density (
Figure 6) and efficiency (
Figure 7). It was assumed that the compressor unit has the ability to change its configuration to reach required flow rate and the working pressure. This assumption was made in order to assess the impact of the working pressure on the performance of the HPS. In practice, a system with working pressure of 3, 9, 27, and 81 can be obtained using four-stage compression and compression ratio of 3 for each stage to reach higher energy densities. The assumed parameters were chosen based on the available data for the wind and demand in order to show the impact of the proposed HEI on increasing the captured energy. The impact of the developed control strategy on the fuel consumption of the diesel generator will be compared with other control strategies.
In order to show the importance of considering the HEI concept in an energy storage system design and control strategy development, and based on the presented procedure, in each time step (one minute in this study) excess energy, stored energy, the change in the tank pressure, rejected energy, delivered energy, and the shortage energy is calculated. The excess energy and the stored energy are used in Equation (6) to calculate the HEI value for each time step. The shortage power is provided by the diesel generator and its value in each time step determines the diesel fuel consumption as shown in Equation (13).
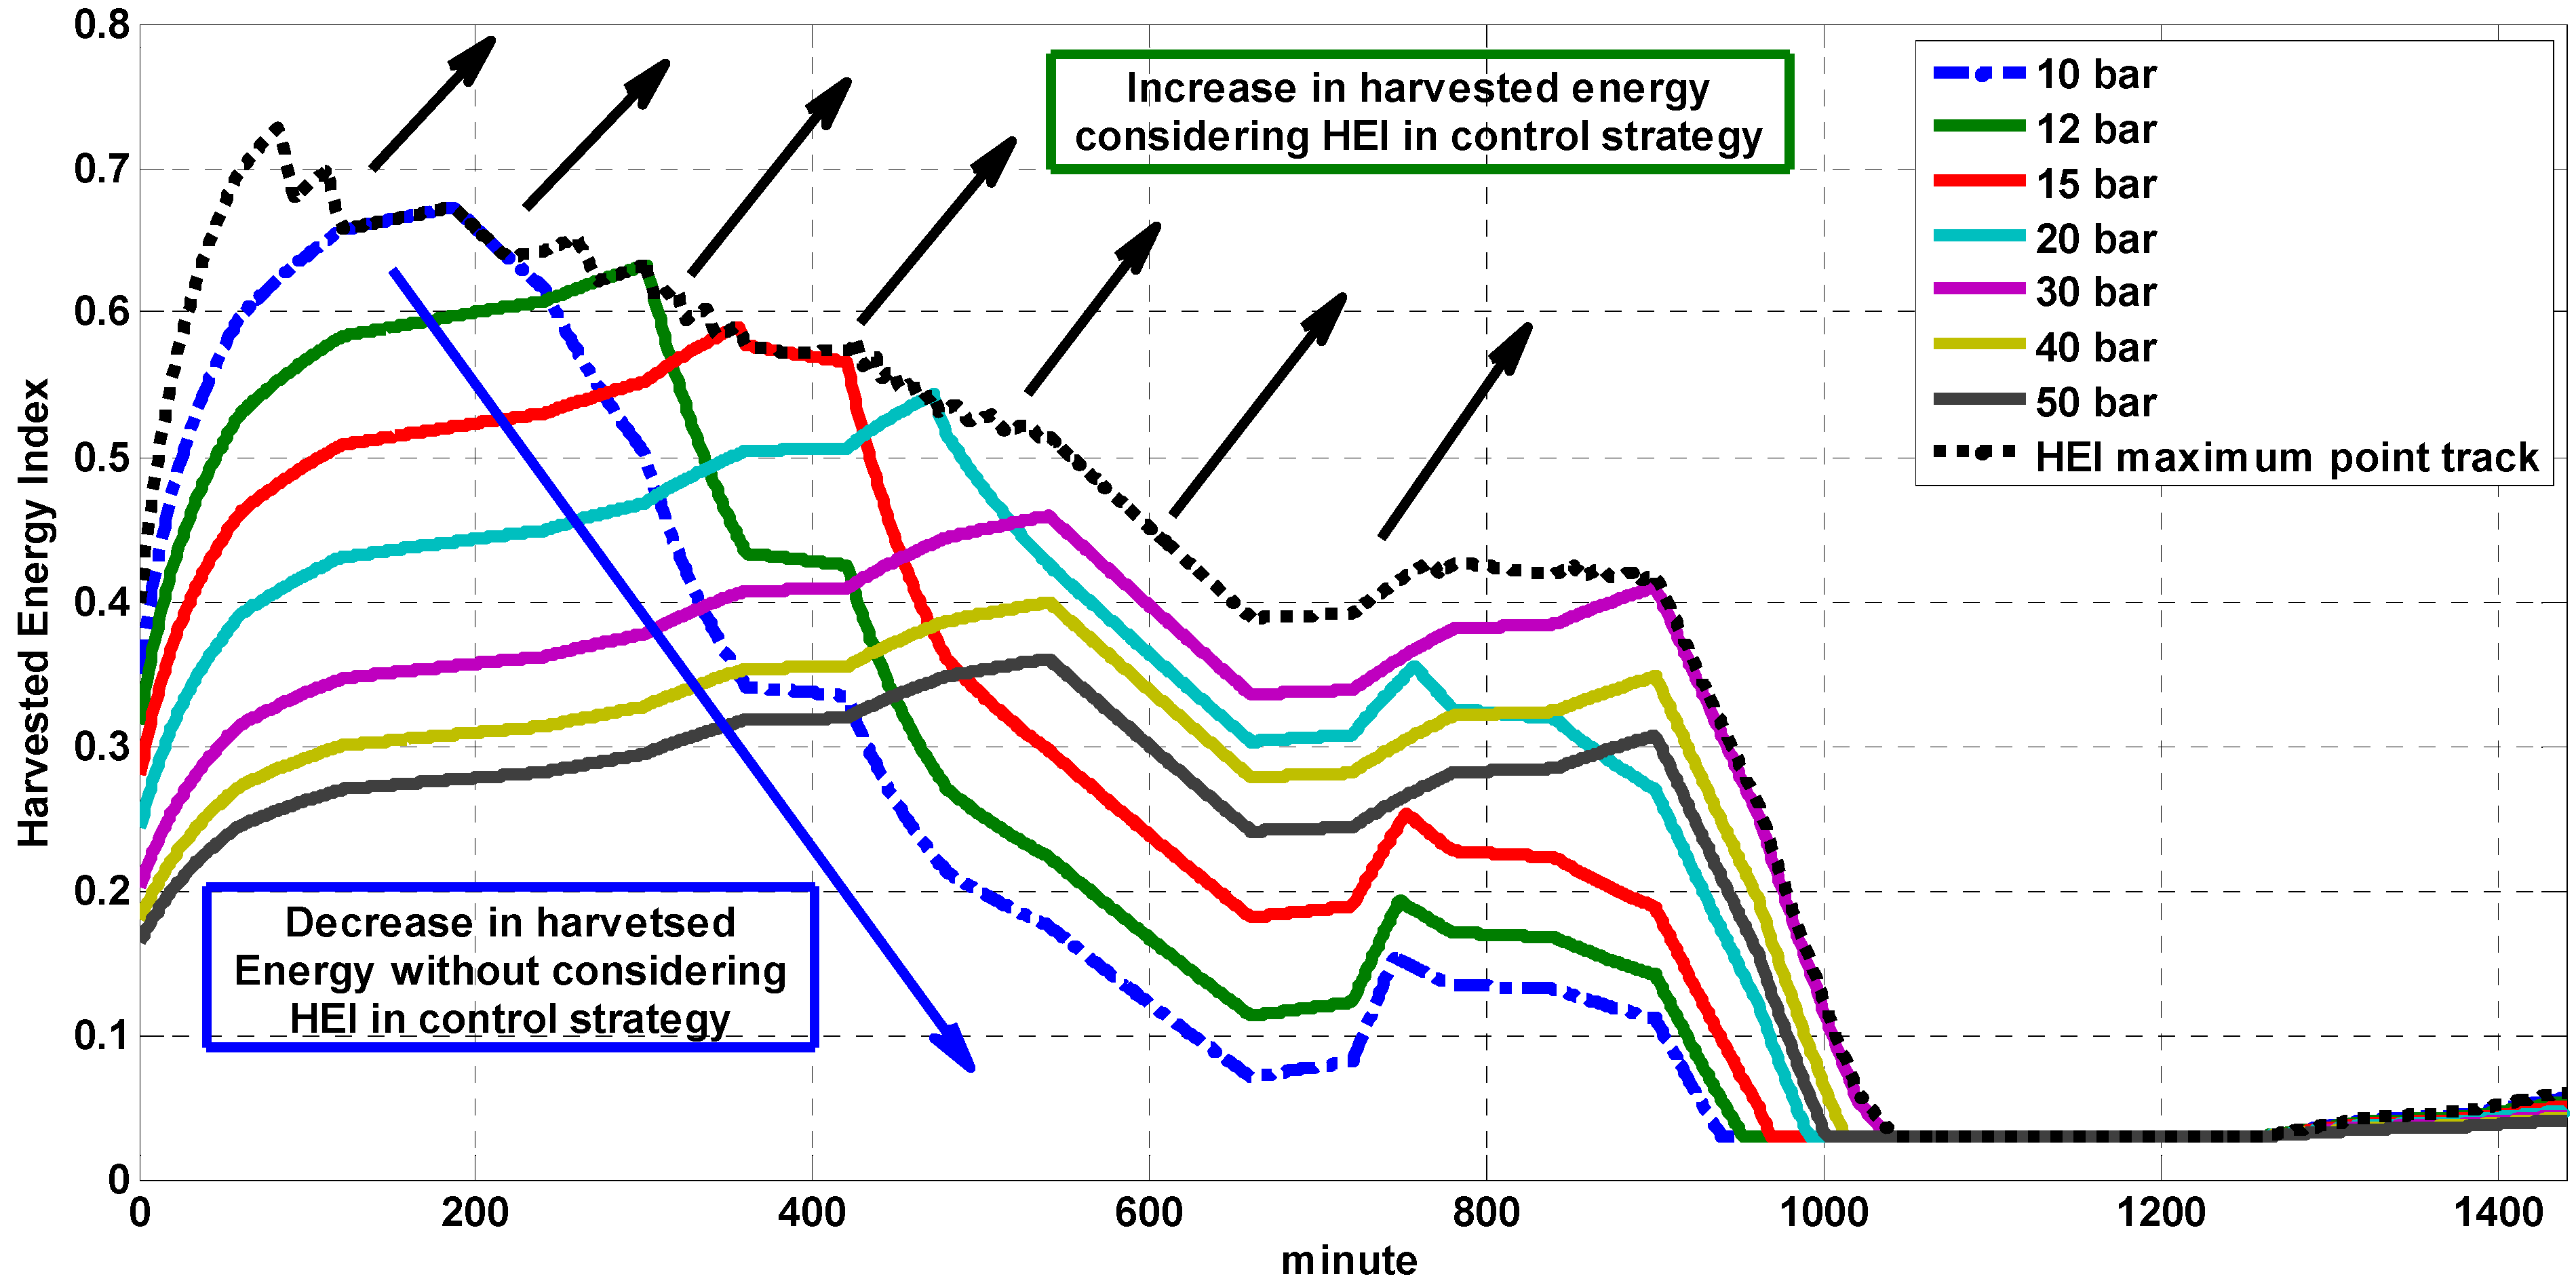
Figure 9 shows the calculated HEI for a CAES system at different working pressures. The HEI index for each working pressure increases when the storage system is able to capture the excess energy of the wind. This corresponds to the increment of the nominator value in Equation (6). On the other hand, the HEI value will decline when the storage system has reached its saturation capacity and available excess energy on the wind turbine is rejected and applied to the system dump load in order to retain the system stability. This situation corresponds to an increase in the denominator in Equation (6) while its denominator is constant.
Figure 9.
The calculated harvested energy index in different working pressures.
Figure 9.
The calculated harvested energy index in different working pressures.
As seen from
Figure 9, at the beginning of a charging cycle, energy storage systems with low working pressure are able to reach higher HEI index in comparison with systems with higher working pressure. On the other hand, these low working pressure systems saturate faster, and the decline in their HEI values occurs earlier in comparison to high pressure systems. As an example, the CAES system working at a fixed 10 pressure ratio can reach the maximum HEI of 68% at time = 187 min, while this index will be 28% for a system working with a fixed 50 pressure ratio. On the other hand, the HEI value for a fixed 10 pressure ratio drops to 18% when a system with a fixed 50 pressure ratio reaches its maximum value (35%). In other words, at the beginning of a charging cycle, the system can harvest approximately twice the energy when it works at 10 bar in comparison to 50 bar, while this performance will be inversed at the end of the charging cycle where the higher pressure systems exhibit significant better performance in comparison to the systems with low working pressures.
An average value for HEI can include the HEI variation in required time duration. In this study, the average daily HEI for different working pressures can be calculated by integrating their stored energy during a day and dividing by the total available excess energy at the same day, which is identical to area under their HEI curve in
Figure 9. The area was calculated only for the time duration with excess energy to concentrate on the harvesting capability of the system when it is available. Therefore, the integration was excluded during the shortage cycle.
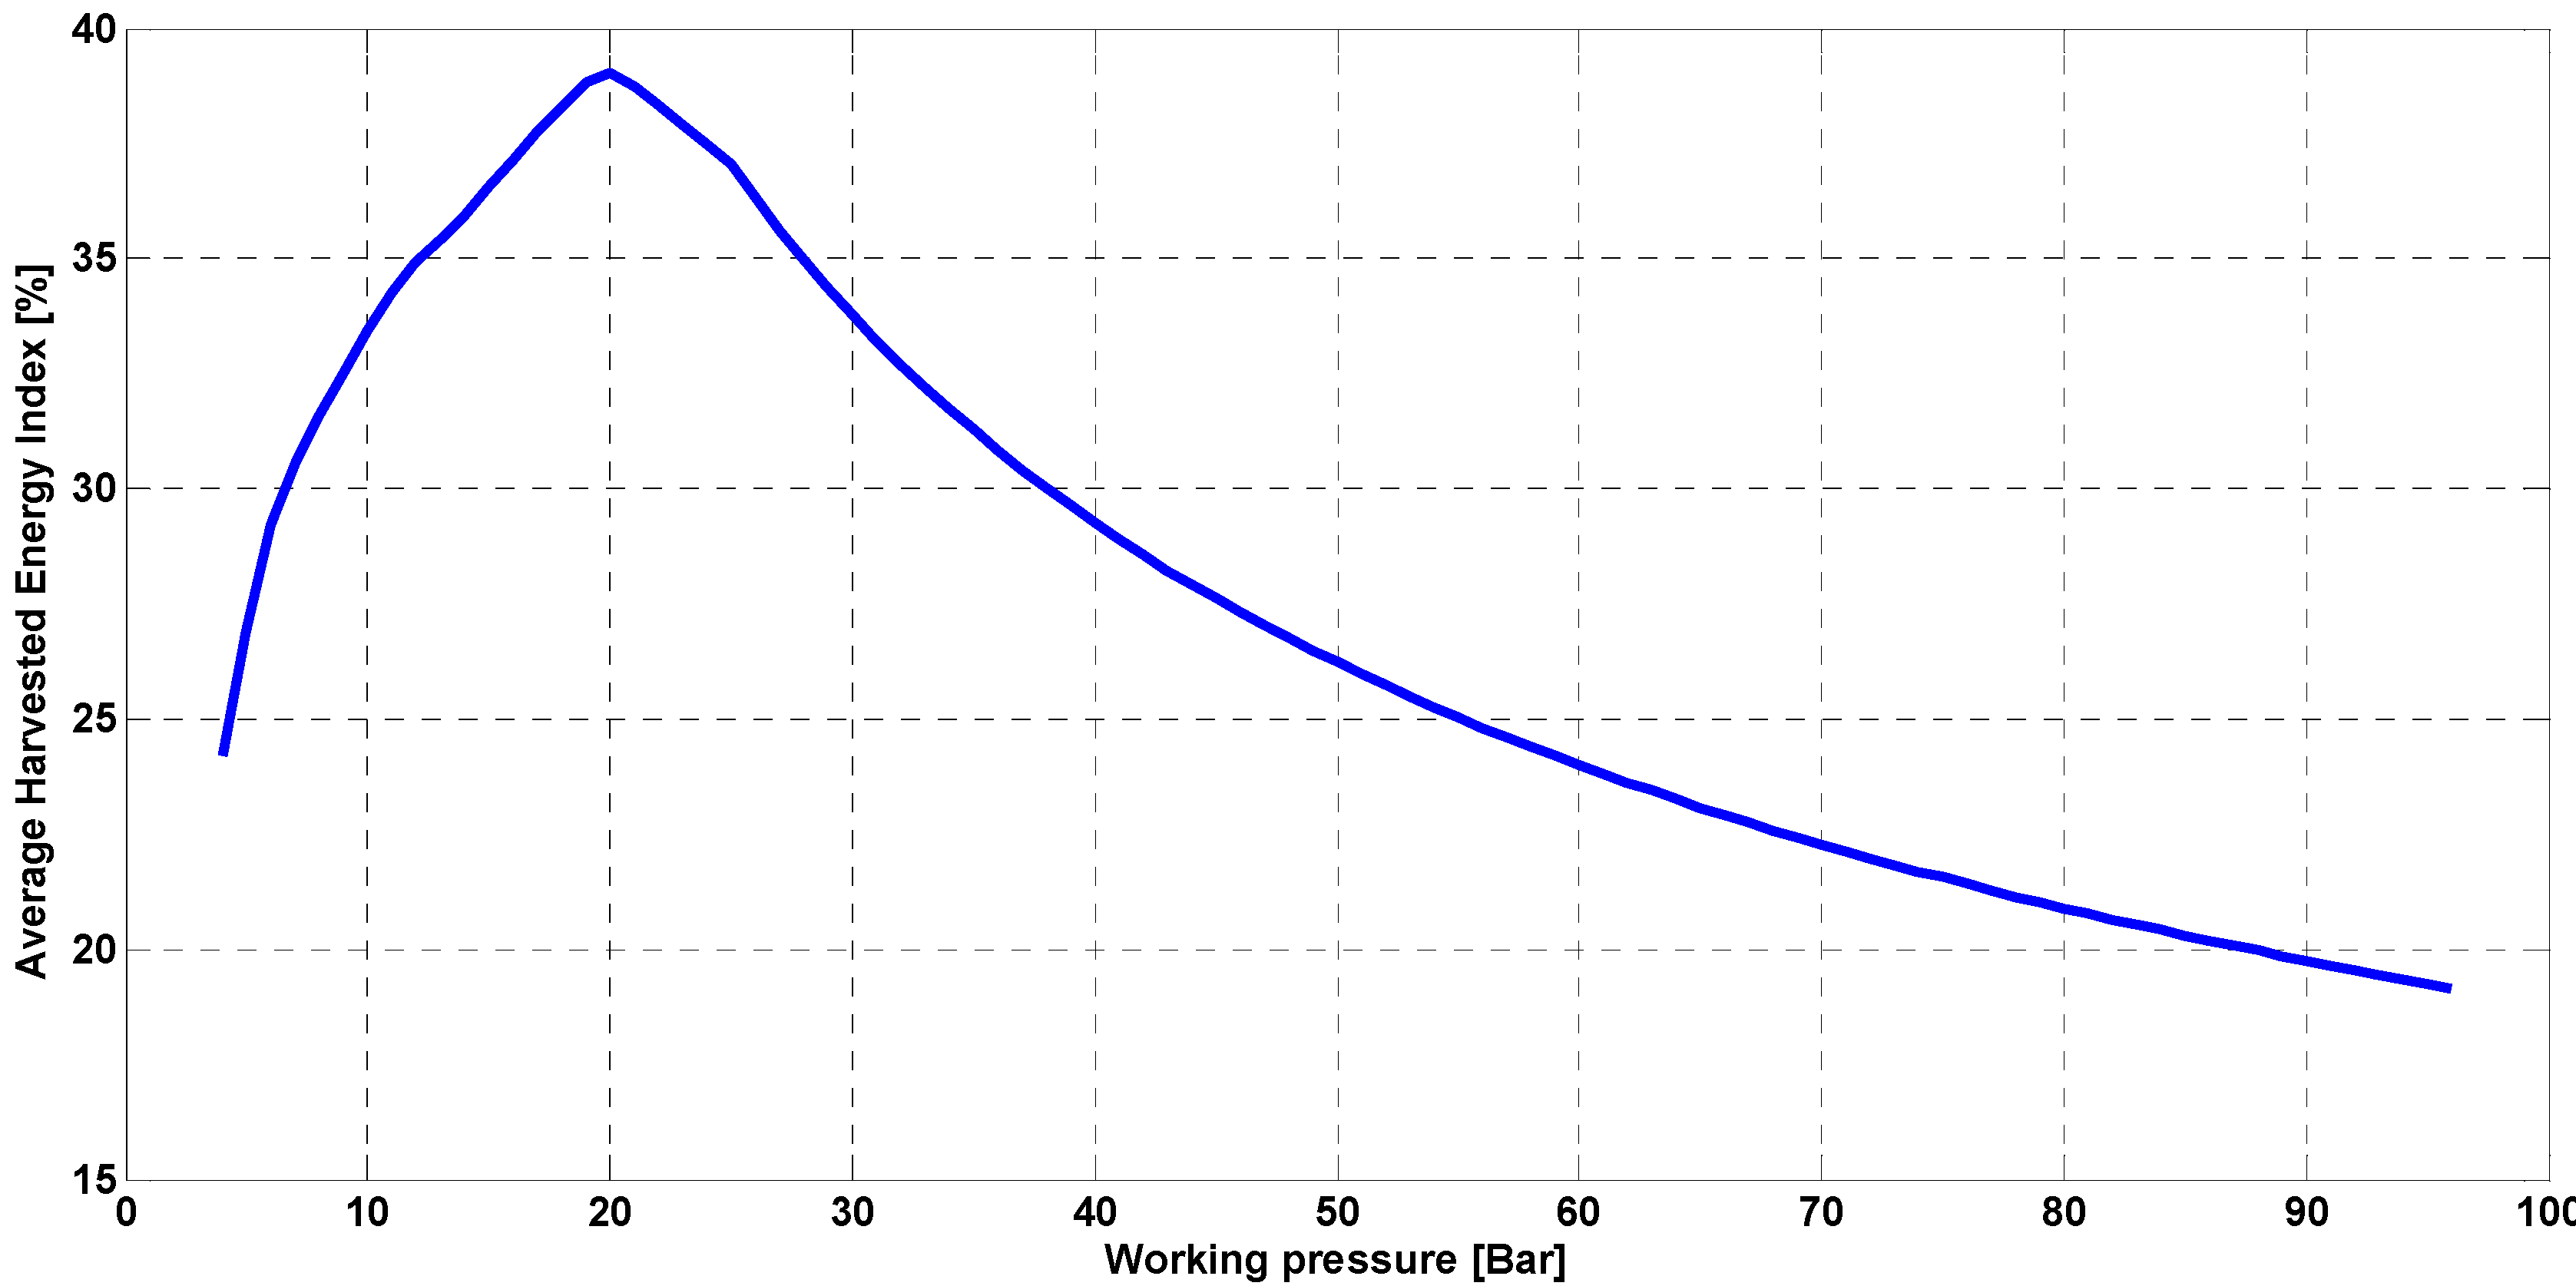
Figure 10 shows the average HEI variation as a function of different working pressures for a single day. In this comparison, the working pressure of a compressor was assumed to be constant as a result of not including the HEI in the control strategy. As shown in
Figure 10, a very high working pressure, such as 70 bar, can only harvest 25% of available excess energy during a day. The maximum value for the average HEI, which is 39%, as is shown in
Figure 10, can be obtained in a state of fixed 20 bar working pressure, while considering the HEI maximum tracking point control scheme in the compressor operation, its average daily HEI can reach up to 50% using the same calculation procedure. This result is more conspicuous considering the low average HEI for very low or high working pressure, which results in less than 30% harvested energy from available excess wind energy.
Figure 10.
Change in average HEI in a day time scale considering only constant working pressure for compressor.
Figure 10.
Change in average HEI in a day time scale considering only constant working pressure for compressor.
An optimum control strategy based on tracking the maximum HEI can be developed to increase the amount of stored wind energy. This maximum point track is shown in
Figure 9 as dot point. The HEI decrease shown in
Figure 9 corresponds to the time that the stored air pressure in the tanks reaches its preset nominal value. To store more energy (shown by arrows in
Figure 9), the working pressure of the compressors can be increased either by gradually increment in fixed steps or change in series-parallel configuration of the compressor connections to achieve high pressure ratios. The reference pressure set point of the compressor can be obtained by tracking the peak value of HEI curves in
Figure 9.
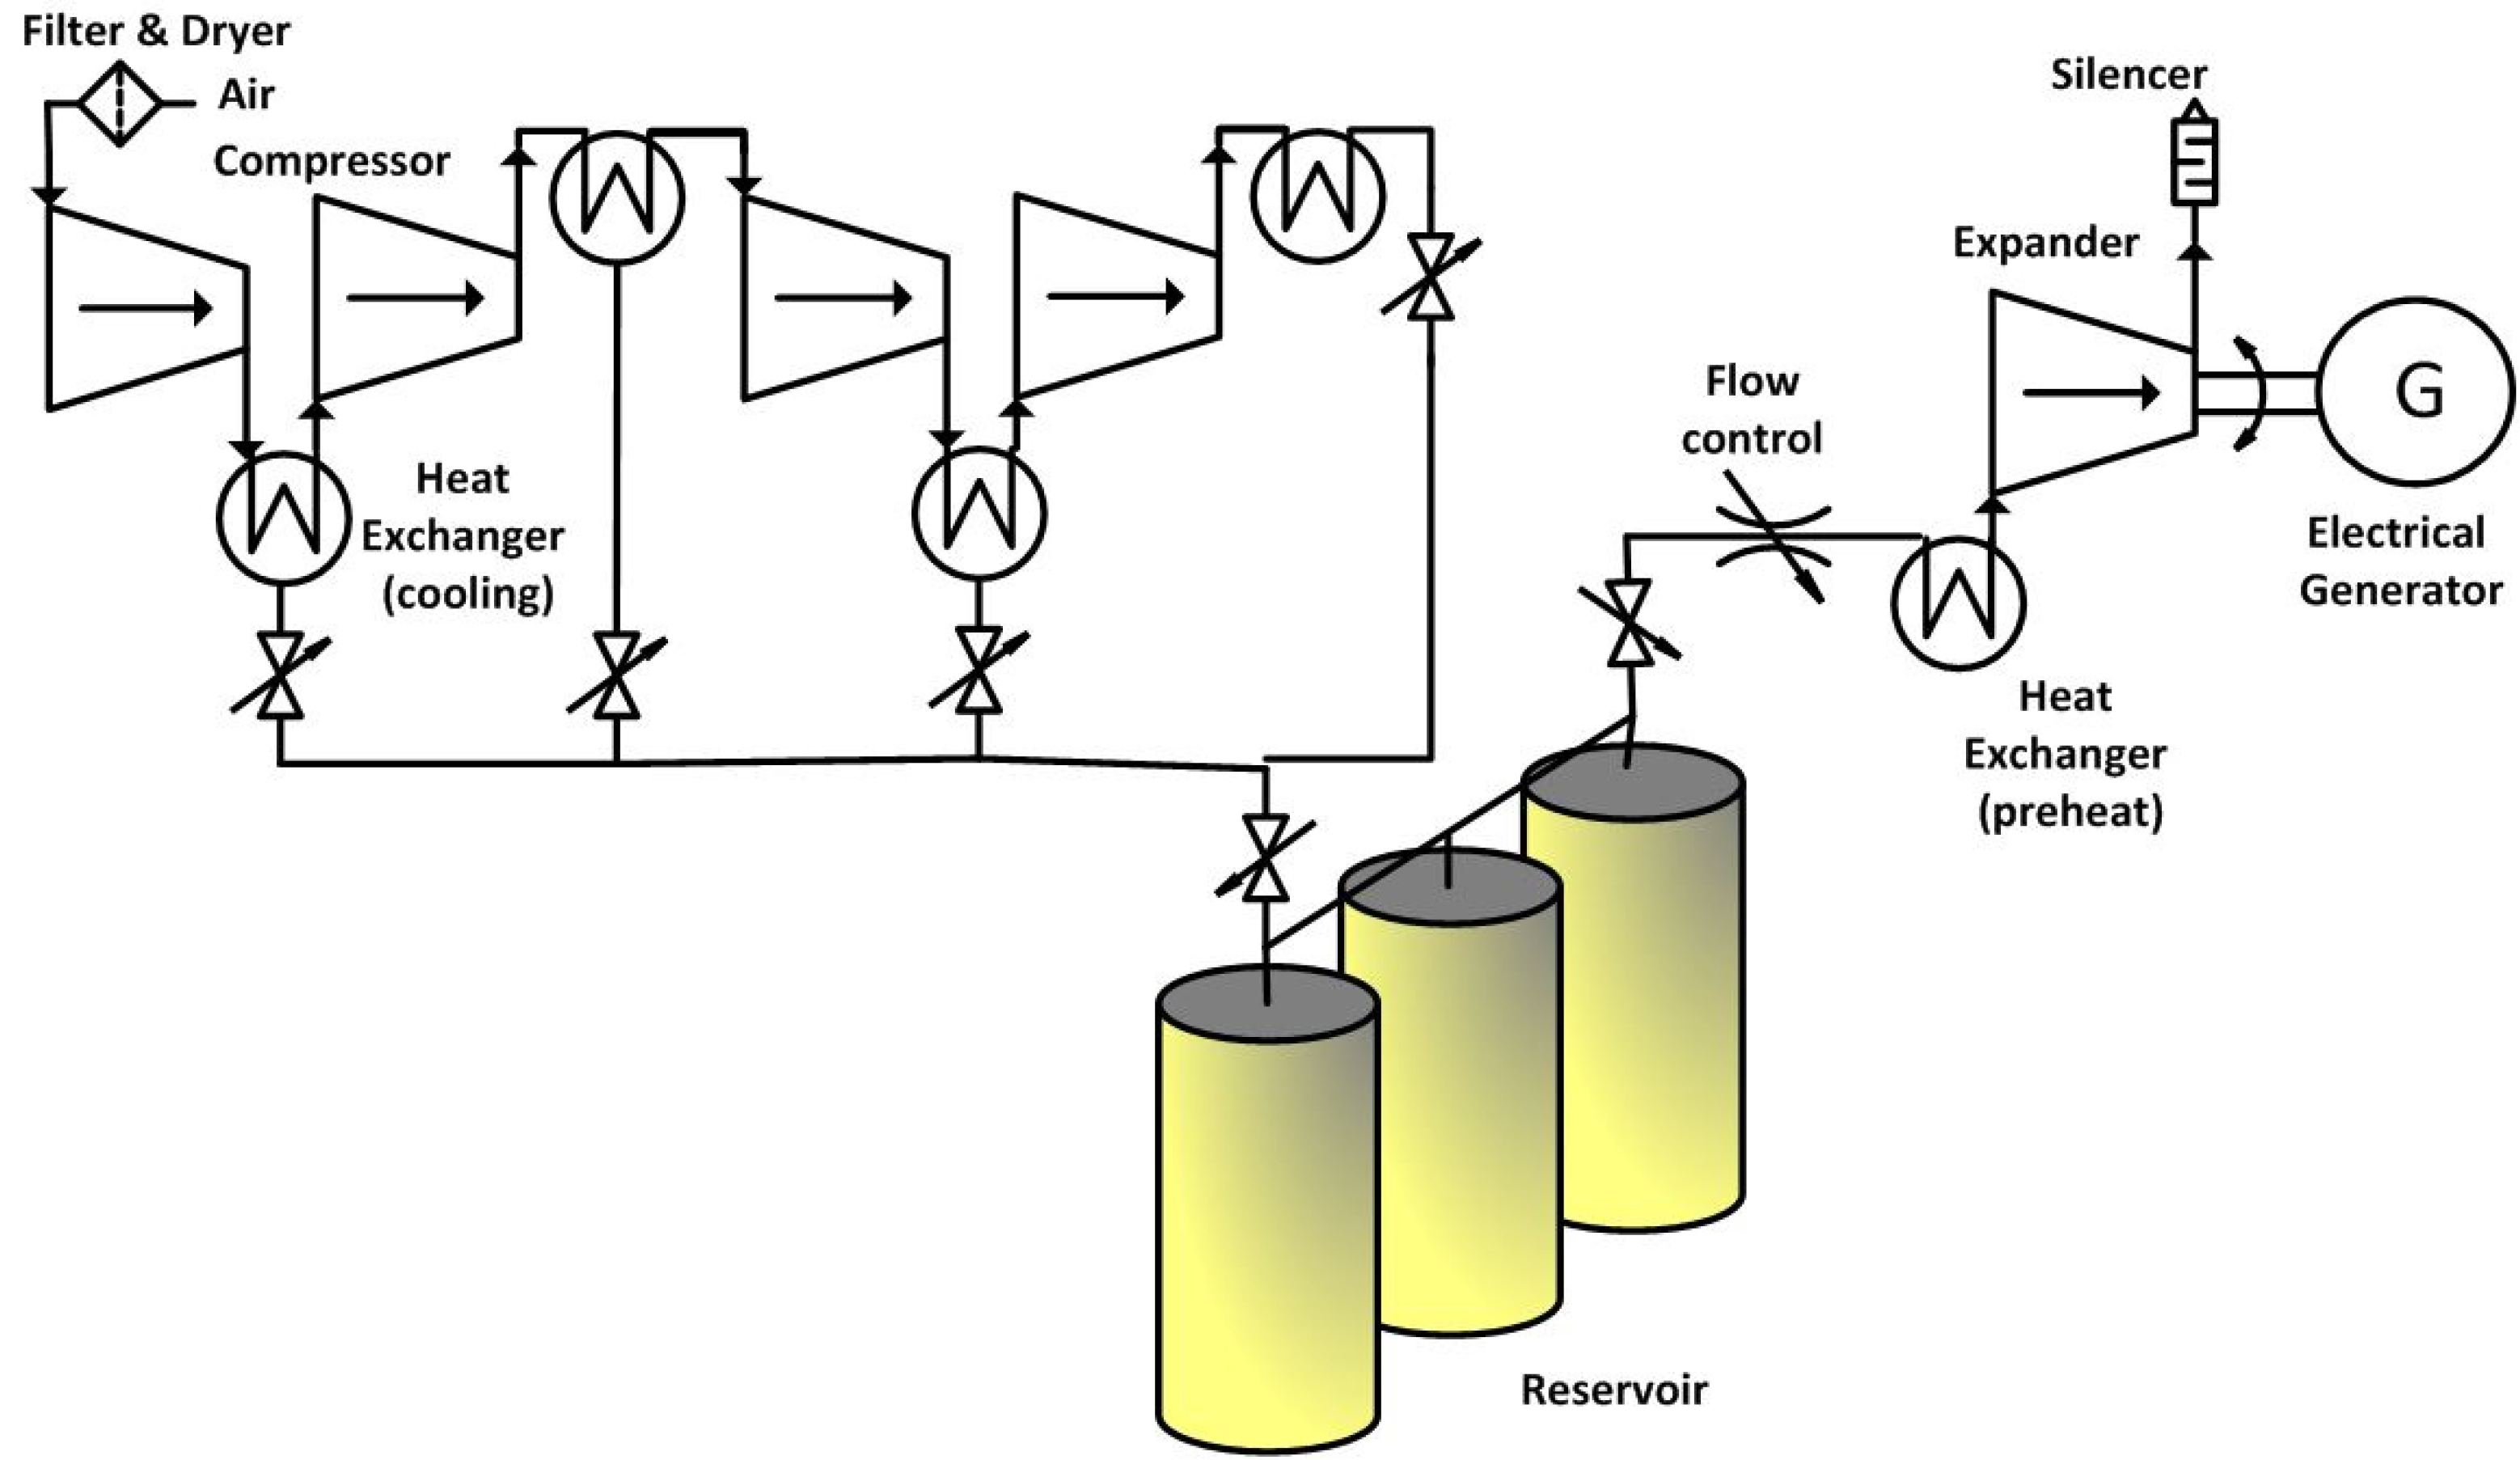
Using this index, a hybrid energy storage system and control approach will ensure an increase in the electrical generation capability of installed equipment, and add to financial benefits from specific amount of investment for a hybrid system. Considering the results obtained from HEI calculation, a possible configuration of the CAES system is proposed as shown in
Figure 11. A four-stage compression has been chosen in this configuration by considering results obtained from
Figure 6 and
Figure 7 respectively. According to
Figure 6, increasing the number of stages does not significantly impact on the energy density, and efficiency of 61.5% can be obtained from a four-stage configuration with less complexity and equipment in comparison to a 10-stage unit.
At the beginning of the storage cycle, the compressors can work in parallel mode with small pressure ratios to increase the storage speed and flow rate into the reservoir. Based on the pressure increment in the tank, the compressors can be switched to a series-parallel combination to increase the compression ratios. The working pressure of the compressor will change when the reservoir is fully charged to the optimum pressure based on the maximum HEI. This adjustable configuration of the multistage compressors enables the storage cycle to operate in variable capacity condition to increase the HEI. Compressing a certain amount of air to a high pressure can be done using gradually increasing working pressure to achieve an efficient energy conversion process. It takes less energy and time to compress air at low pressures compared to high pressures. Based on this, it is suggested to store energy in reservoirs at low pressure and gradually increase the working pressure of the compressors.
Figure 11.
A four-stage design of the CAES system based on harvested energy index.
Figure 11.
A four-stage design of the CAES system based on harvested energy index.
In order to show the effectiveness of the proposed control method, the utilization impact of such a control strategy on the fuel consumption of the diesel generator is investigated. In this assessment, systems with different set of constant working pressures are compared to two systems with controllable working pressures based on the HEI concept. At the first control strategy and based on the proposed maximum HEI tracking control strategy, the working pressure of the compressor is increased in 25 steps of 2 bar to the final working pressure of 50 bar. Although this control strategy increases the accuracy of the maximum HEI tracking, its complexity and cost might result in an impractical option for the control strategy. Therefore, a four stages compression unit with controllable valve is considered a practical option for the HEI implementation. The second system has a four-stage configuration with compression ratio of 3 for each stage. Each compression stage will become online after connecting to the previous compressor, when each stage reaches the maximum working pressure (in this case 3, 9, 27, and 81).
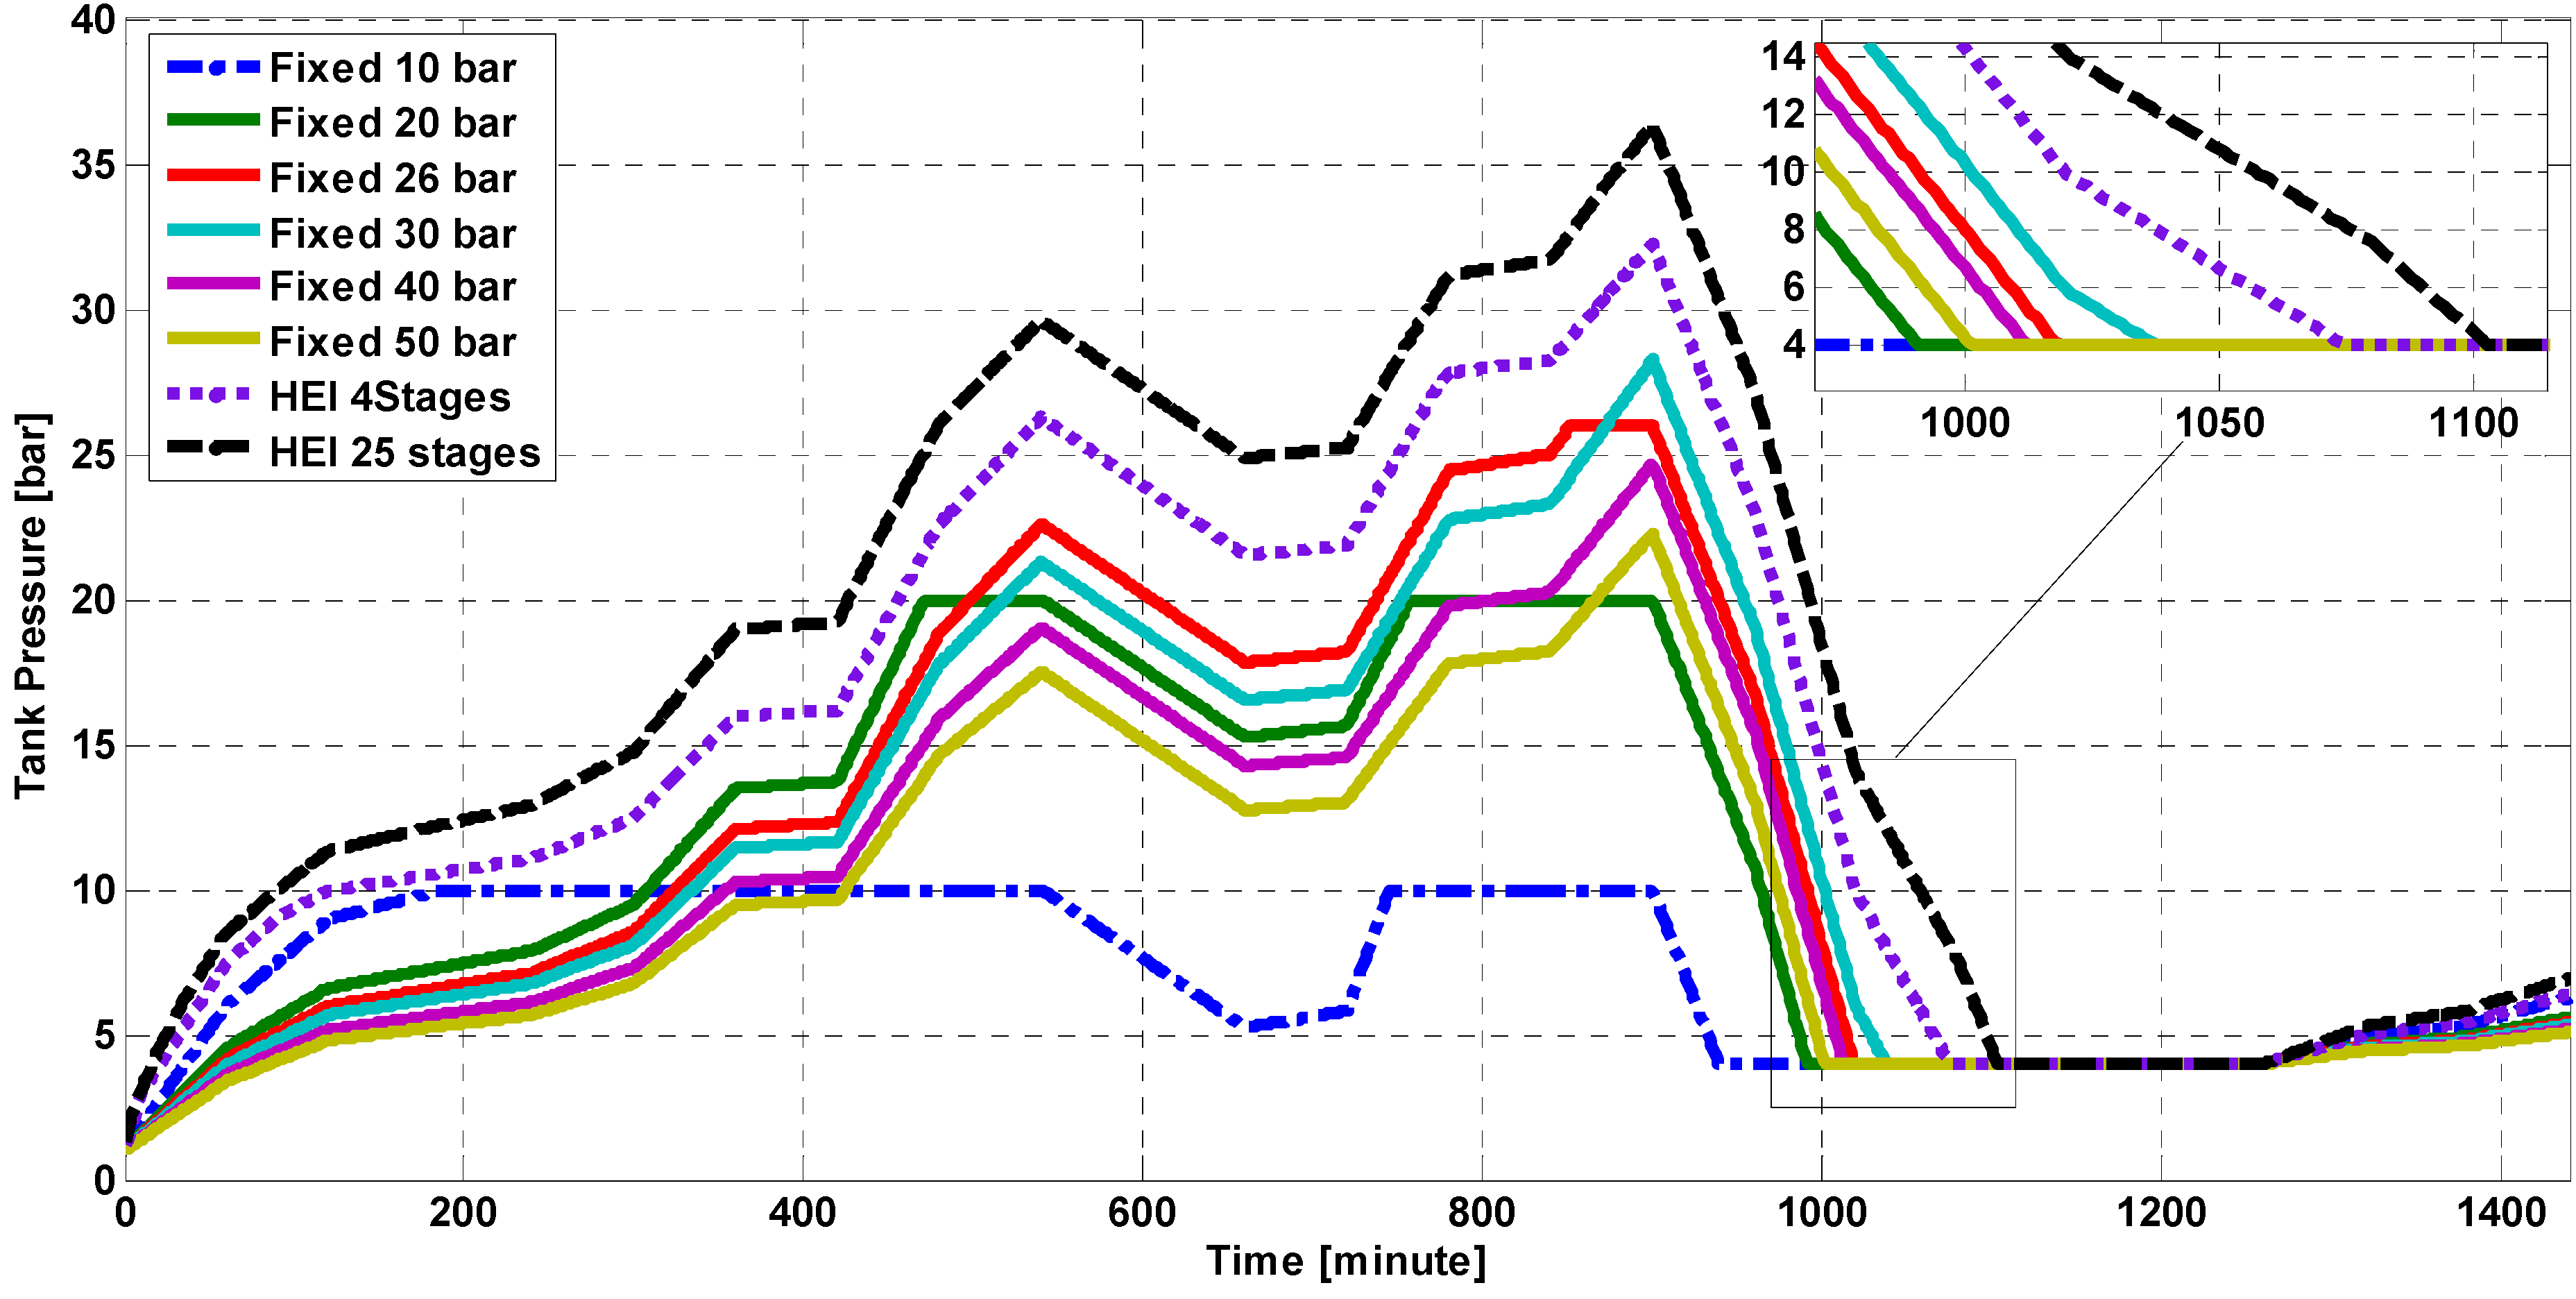
Figure 12 shows the change in the tank pressure of the HPS with different working pressures for the compression system.
As seen in
Figure 12, the HPS system with low compression ratios reaches its nominal working pressure faster than the higher working pressures, but it is unable to capture more wind energy. In the presented case study, this condition occurs when the tank pressure profile retain a constant value as shown in
Figure 12, for a 10 bar and a 20 bar constant working pressure. Considering
Figure 12, the HPS controlled with proposed control strategy has higher tank pressure, and consequently higher stored energy in comparison to the systems working with fixed working pressures.
Figure 12.
The tank pressure variation in different compression control strategies.
Figure 12.
The tank pressure variation in different compression control strategies.
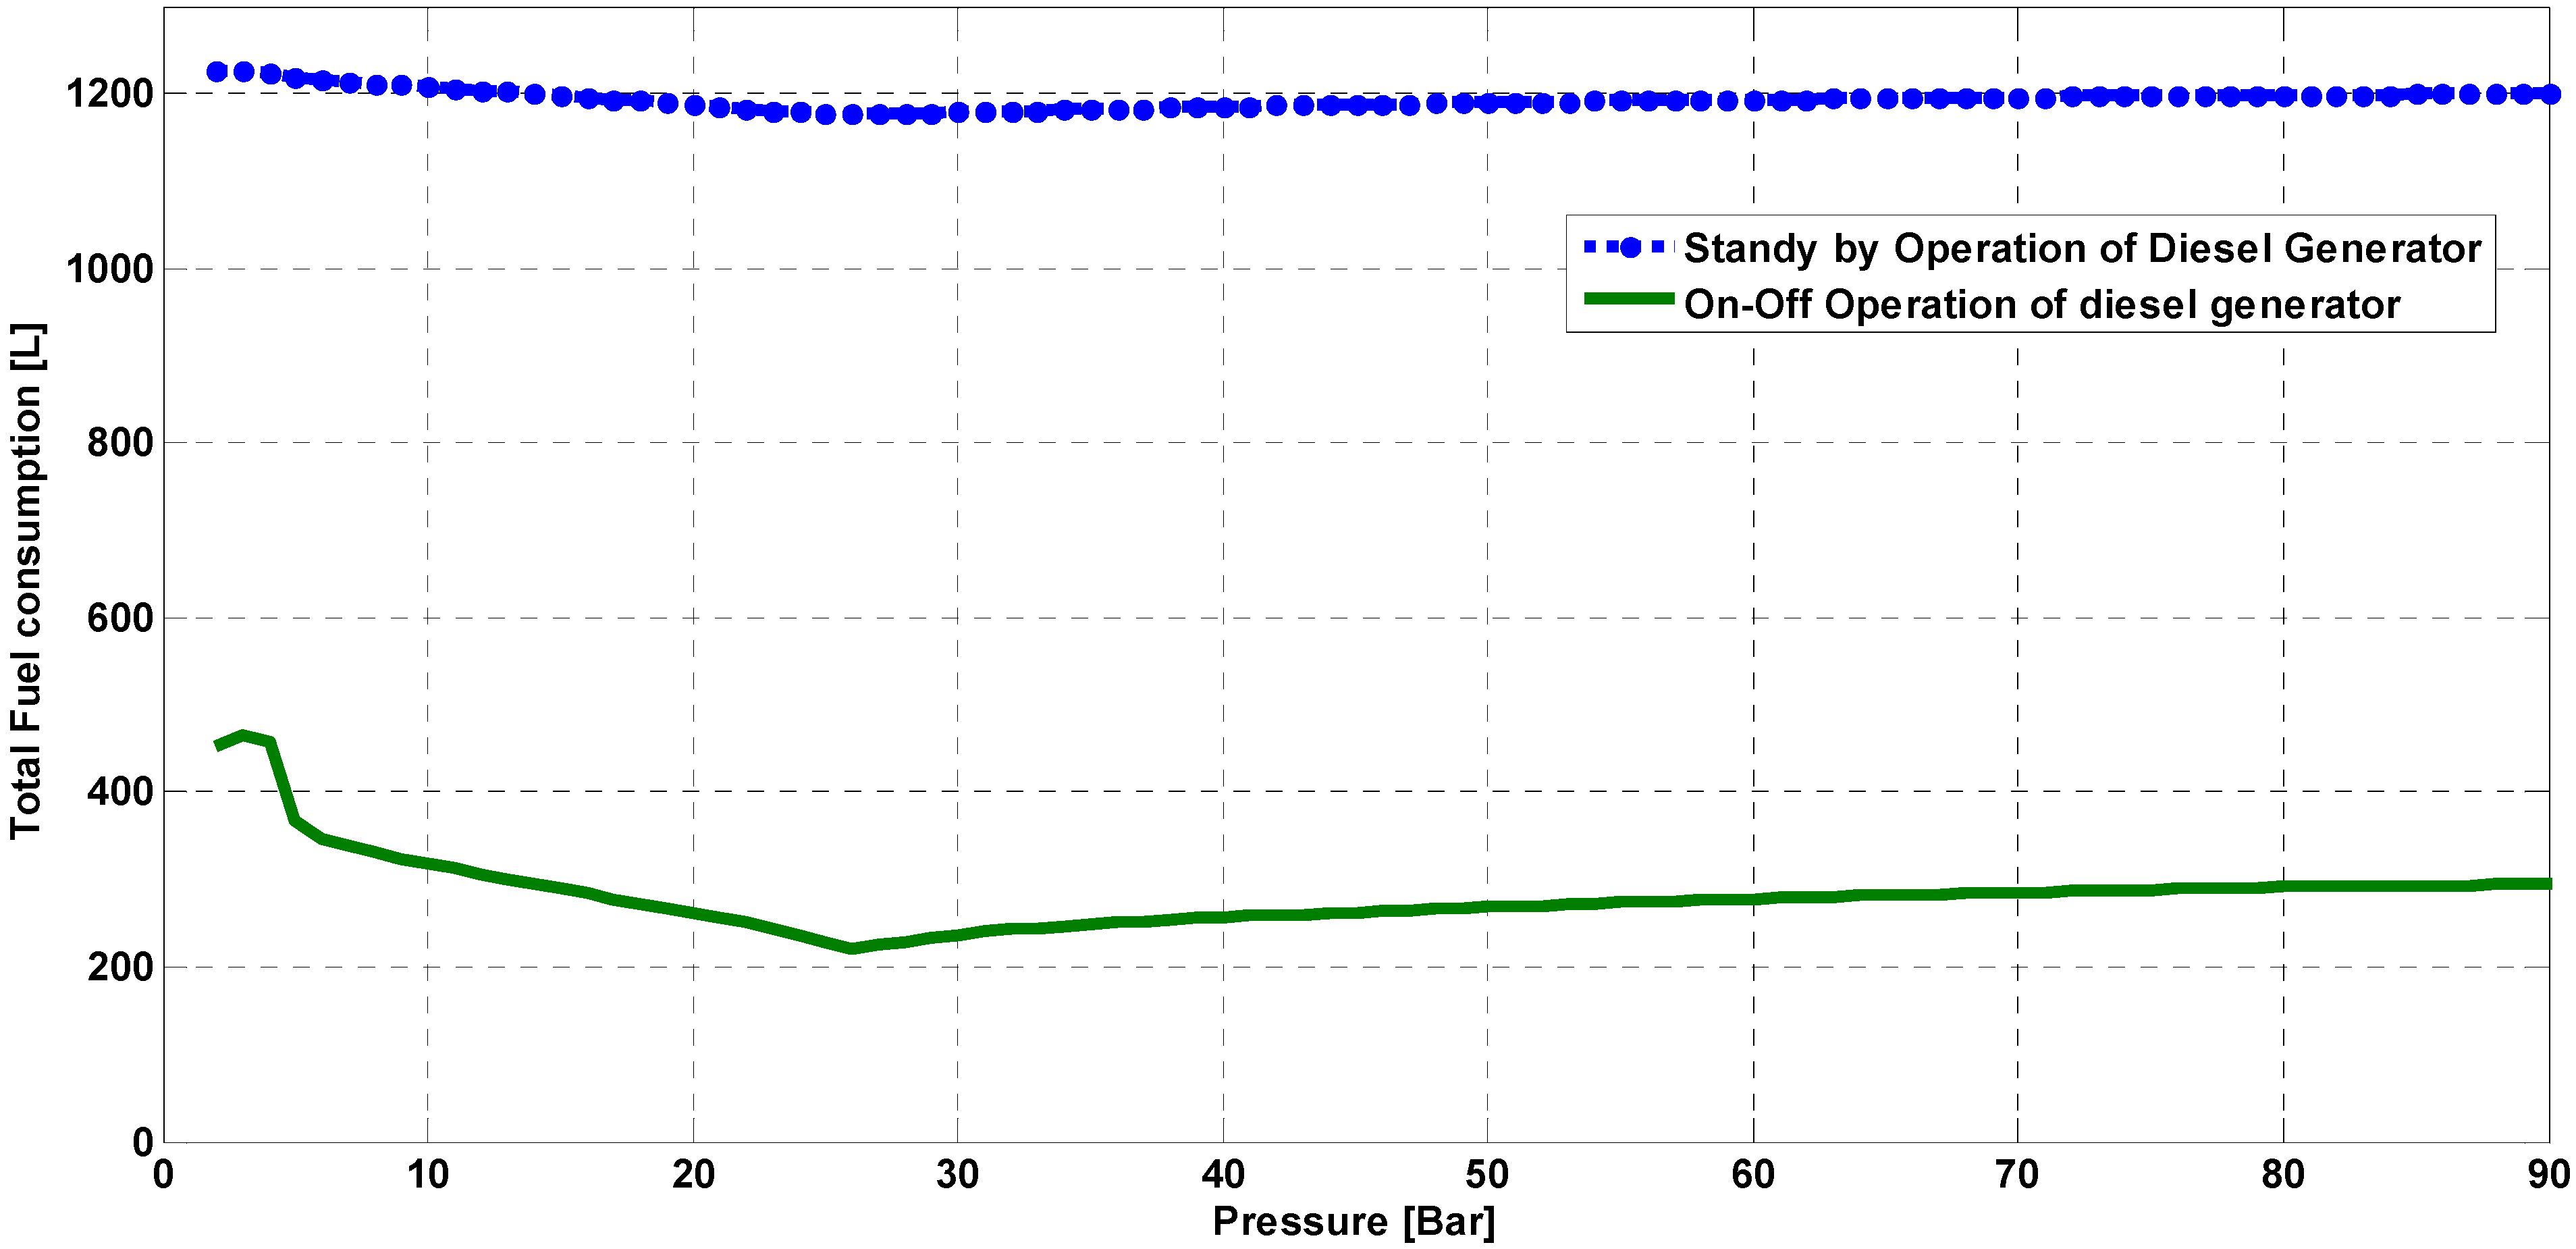
The diesel generator (DG) fuel consumption in its backup mode can be calculated by applying the provided power by DG to Equation (13). Two scenarios were assumed for the diesel generator operation modes. At the first scenario, the DG operates in On-Off mode and it will starts only in shortage mode. On the other hand, second scenario assumes a standby mode of operation, and the diesel will be online during the shortage cycles and will work in no-load mode in the rest. The total fuel consumption of diesel generator in the standby and On-Off mode is compared in
Figure 13.
Figure 13.
The DG fuel consumption in Standby and On-Off mode of operations.
Figure 13.
The DG fuel consumption in Standby and On-Off mode of operations.
As shown in
Figure 13, the On-Off mode of operation exhibit less fuel consumption for all the working pressures in comparison with the fuel consumption in standby mode of operation. This big difference is related to the no load fuel consumption presented in Equation (13). Although, the standby operation of the diesel generator provides a more reliable backup for the HPS, its fuel consumption is much higher than the diesel generator with an On-Off mode of operation. The On-Off mode of operation is suitable for the HPS in an isolated application where benefits from high wind profile. On the other hand, the standby operation is preferred in locations with low wind speed profile and considerable fluctuations. In both modes a system with a fixed working pressure of 26 bar has the minimum fuel consumption.
Using proposed control strategy in the presented case study, the DG operates in less time duration as it is shown in
Figure 12, when the tank pressure reaches 4 bar. The total shortage duration in different compression control strategies is obtained from
Figure 12 and listed in
Table 2.
Table 2.
The total shortage duration in different compression control strategies.
Table 2.
The total shortage duration in different compression control strategies.
| Control method | Fixed 10 bar | Fixed 26 bar | HEI in 25 stages | HEI in 4 stages |
|---|
| Shortage Duration | 326 [min] | 225 [min] | 163 [min] | 192 [min] |
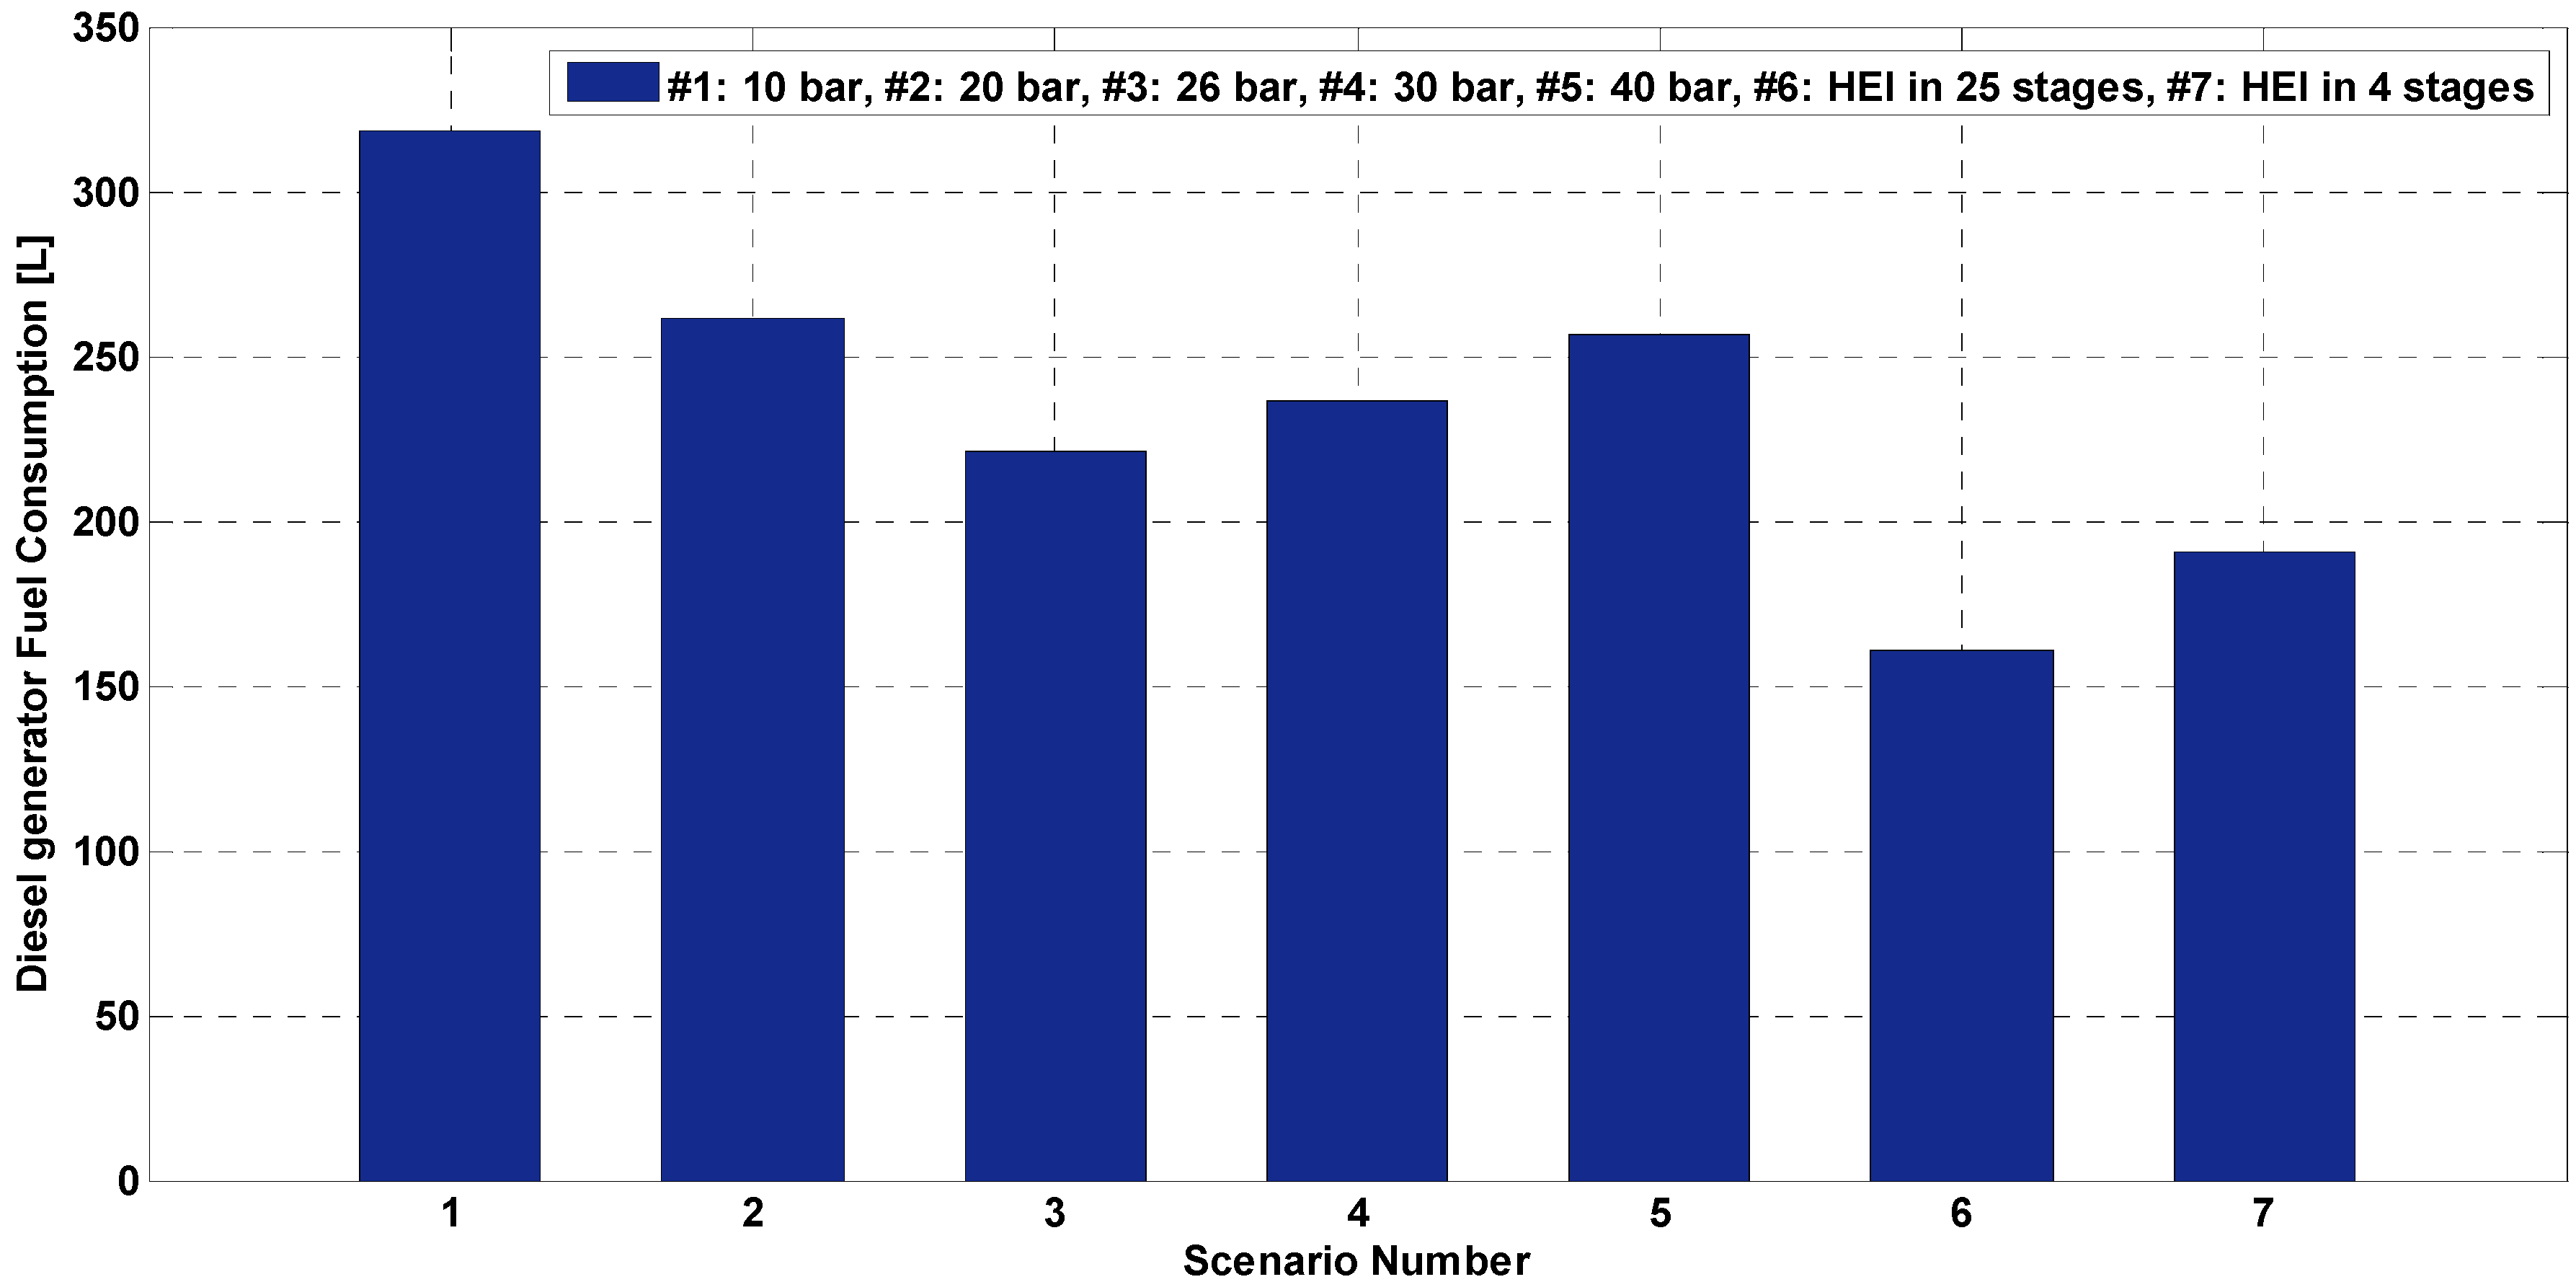
The total fuel consumption of the HPS based on the proposed control strategies are compared in
Figure 14.
Figure 14.
The DG fuel consumption comparison in different compression control strategies.
Figure 14.
The DG fuel consumption comparison in different compression control strategies.
As shown in
Figure 14, the total fuel consumption of the system is reduced to 161 L using the proposed HEI index in compression working pressure control. The minimum value for the fuel consumption with fixed working pressure is 221 L and belongs to a fixed 26 bar working condition. As a result of applying the HEI control strategy to a four stages compression unit, and performing a variable working pressure control instead of a fixed one, the total fuel consumption of 191 L is achievable in a practical configuration of the HEI implementation.


