Article

The Fluid-Structure Interaction Characteristics of the Pantograph-Rigid Catenary in the Context of Extra-Long Tunnels

1
School of Automation and Electrical Engineering, Lanzhou Jiaotong University, Lanzhou 730070, China
2
Key Laboratory of Opto-Technology and Intelligent Control Ministry of Education, Lanzhou Jiaotong University, Lanzhou 730070, China
3
Power Supply Department, China Railway Lanzhou Bureau Group Co., Ltd., Lanzhou 730070, China
*
Author to whom correspondence should be addressed.
Electronics 2025, 14(8), 1628; https://doi.org/10.3390/electronics14081628
Submission received: 21 March 2025 / Revised: 14 April 2025 / Accepted: 15 April 2025 / Published: 17 April 2025

Abstract

:
The geological structure in western China is complex, and rigid catenary systems are commonly used for pantograph power supply in railway tunnel construction. Due to the space constraints within tunnels, the aerodynamic characteristics and fluid–structure interaction effects between pantographs and catenary systems directly affect train operational safety. Numerical simulation analysis of the pantograph–rigid catenary interaction in tunnels is revealed. In the pantograph, the connecting rod areas endure high pressure and are prone to fatigue damage, necessitating structural strength optimization. The rigid catenary exhibits laterally symmetric vibration with high torsional stiffness, meeting operational requirements. This study provides theoretical support for design improvements of pantograph–catenary systems in tunnel environments.

1. Introduction

With the continuous expansion of China’s railway construction, the railway network is gradually extending into the mountainous regions of the west. This progress is accompanied by multiple challenges posed by complex terrain and variable climatic conditions [1]. Particularly in the western mountainous areas, the operational performance of railways needs further enhancement to meet the high demands imposed by these complex environments [2]. Significantly influenced by topographic factors, railway construction in the western mountainous regions is characterized by a large number of tunnels and considerable tunnel lengths. Figure 1 illustrates the distribution of tunnel lengths in a specific section of the western region of China. As shown in the figure, tunnels shorter than 10 km account for approximately 13%, while those exceeding 10 km, defined as extra-long tunnels [3,4], make up a substantial 87%. This distribution highlights that extra-long tunnels in the western mountainous regions of China are not only densely distributed but also dominate the total tunnel length.
The pantograph is a critical electrical device installed on the roof of locomotives or electric multiple units (EMUs). Its primary function is to transfer high-voltage electrical energy from the overhead contact line to the vehicle’s traction system through sliding contact, thereby providing the necessary power for train operation [
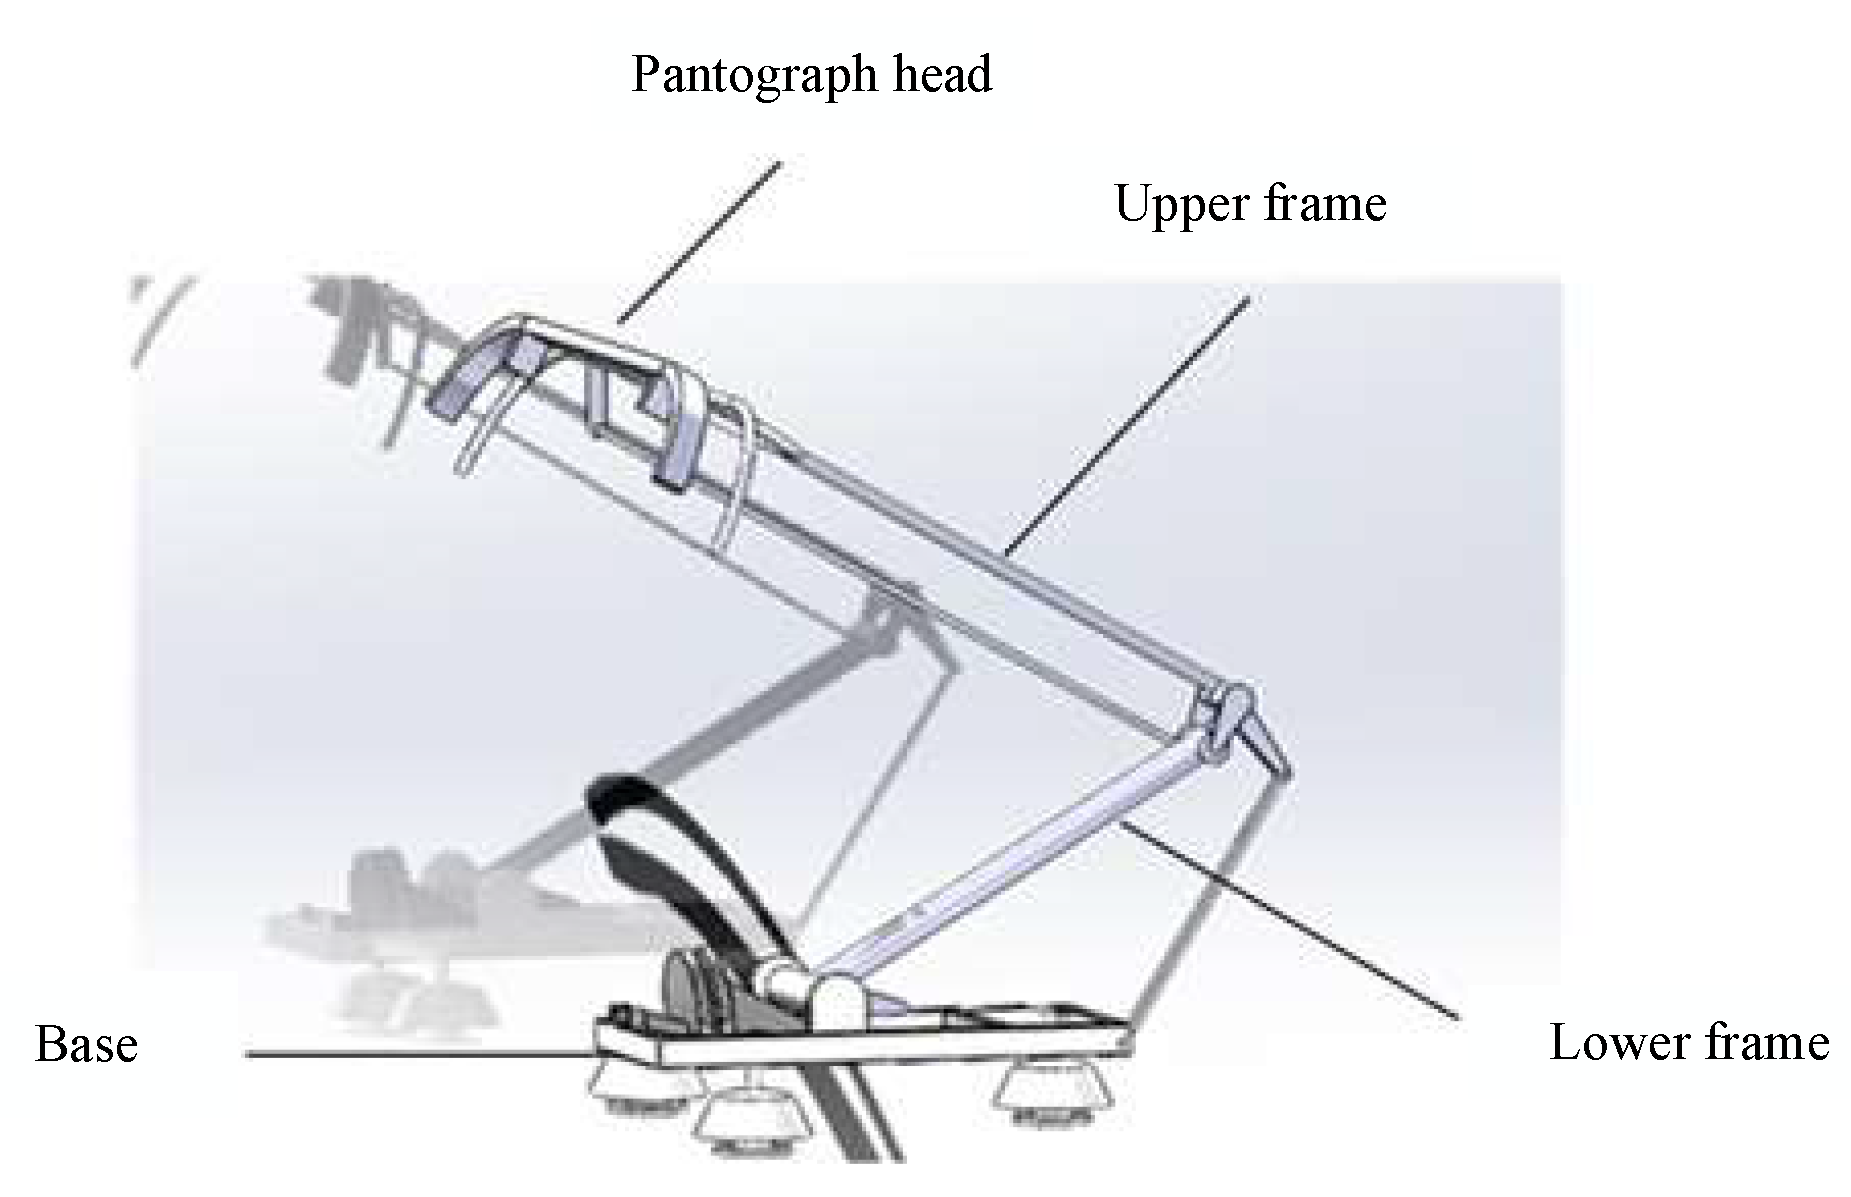
5]. The pantograph typically consists of several core components, including the collector head, upper frame, lower arm, base frame, lifting spring, drive cylinder, and supporting insulators, among others [6]. The overhead contact line, serving as the channel for power transmission, can be categorized into two types based on its structure: flexible and rigid [7]. The flexible contact line primarily consists of components such as the contact suspension, support devices, positioning devices, masts, and foundations [8]. Due to the influence of topographic factors, railway construction in western China faces the challenge of densely distributed extra-long tunnels. Rigid catenary systems have become a focal point in railway tunnel construction in this region. Owing to its structural stability and ease of maintenance, the rigid catenary system is widely used in railway tunnels in the mountainous regions of western China [9]. Research on the fluid–structure interaction (FSI) characteristics of pantograph–rigid catenary systems can be categorized into three types: field tests, wind tunnel experiments, and numerical simulations [10]. Field tests require significant human and material resources, and the number of measurement points that can be deployed during testing is limited. Wind tunnel experiments demand stringent experimental conditions. With the rapid development of computer technology, continuous improvements in computing power, and innovations in numerical methods, computational fluid dynamics (CFD) simulation software has become increasingly sophisticated. As a result, numerical simulation has emerged as a prevailing trend for studying the FSI characteristics of pantograph–rigid catenary systems.
M. Tur [11] addressed potential instability issues caused by communication delays and the inherent stiffness of interactions with the pantograph through hardware-in-the-loop testing, examining the dynamic interaction between the pantograph and the overhead contact line in a controlled laboratory environment. Yuki Amano [12] conducted experimental and numerical studies on instability phenomena induced by sliding friction. A method for estimating the actual friction coefficient of the pantograph was proposed and applied in experimental research on instability phenomena. C. Antonio [13] developed a test bench that allows for testing virtual overhead contact lines on real pantographs, offering high precision and flexibility in available tests. Zdziebko P [14] proposed a multi-domain model for the pantograph–catenary system, analyzing the influence of various physical domains through the system’s FSI characteristics. S. Bivani [15] developed and studied a mathematical model for pantograph equations, discussing the convergence analysis using the Green’s function method and obtaining error bounds dependent on the regularity of the exact solution. Benet Jesús [16] introduced a mathematical and engineering model for rigid catenary systems, optimizing the calculation of pantograph–catenary interaction dynamics, particularly for rigid catenaries with overlapping spans. Like Pan [17] developed a simplified model for pantograph–stitch–catenary interaction, demonstrating that the proposed model is up to seven times faster than traditional modal superposition methods. Kim Seung Joong [18] investigated the aerodynamic distribution on the pantograph structure, revealing that the pantograph head exhibits a significant negative pressure vortex field, which affects the lower part of the pantograph and causes the aerodynamic force to shift from lift to drag. Professor Liu Zhigang from Southwest Jiaotong University [19] refined the numerical simulation methods and processes for pantograph–catenary interaction based on three-dimensional contact analysis. The proposed fast simulation method reduces computation time by 97.67%, with a maximum error in pantograph–catenary contact force of only 0.48%. Zhao Yajun from Dalian Jiaotong University [20] conducted aerodynamic and fluid–structure interaction (FSI) analyses on a newly developed high-speed train pantograph. The results indicated that the pantograph head is the primary source of aerodynamic drag, and stress concentration occurs at the connection between the balance rod and the pantograph head, which is highly detrimental to the structure. Gao Jinlong from Southwest Jiaotong University [21] studied the rigid catenary system for 200 km/h high-speed railways through experimental research. The findings showed that raising the first suspension point of the rigid catenary by 4 mm offers significant advantages, and the pantograph–catenary dynamic matching effect is optimal under a load of 100 kN/m. Li Xiaowei from Central South University [22] investigated the FSI problem of the pantograph–catenary system under aerodynamic disturbances, focusing on the impact of differential pressure resistance on the flow field.
In summary, research by domestic and international scholars on pantograph–catenary characteristics has primarily focused on independent analyses of pantographs and rigid catenaries, while studies on the FSI characteristics of pantograph–catenary systems in extra-long tunnel environments remain relatively scarce. Given the importance of extra-long tunnels in railway construction in western mountainous regions, in-depth research on the FSI characteristics of pantograph–catenary systems in such environments holds significant theoretical and practical value, providing a scientific basis for the safe operation of high-speed railways. The main research contents of this paper are as follows: Section 2 focuses on finite element modeling of extra-long tunnels, pantographs, and rigid catenaries; constructs a flow field model; and verifies the grid independence and flow field residual iteration to ensure the accuracy and reliability of the model. Section 3 systematically analyzes the flow field and FSI characteristics of the pantograph–rigid catenary system in extra-long tunnels. Section 4 analyzes the aerodynamic characteristics of the pantograph and the vibration characteristics of the rigid catenary in extra-long tunnels and validates the FSI results of the model based on measured pantograph–catenary contact forces to ensure the scientific rigor and correctness of the research. Section 5 contains the discussion and conclusions of the full article.

2. Modeling of Extra-Long Tunnel, Pantograph, and Rigid Catenary

2.1. Preliminary Investigation

Investigation Period: 9 July 2023, 22:00–10 July 2023, 05:00.
Investigation Location: Wushaoling Tunnel, Lanzhou-Xinjiang Railway Section.
Introduction to Wushaoling Tunnel: The Wushaoling Tunnel is located between Dachaidan Station and Longgou Station on the Wuwei to Lanzhou section of the Lanzhou-Xinjiang Railway in Gansu Province, China. Designed as a double-track, single-bore tunnel, it officially opened for dual-track operation on 23 August 2006. With a total length of 20.05 km, the Wushaoling Tunnel is a significant project in China’s railway construction. For its electrification design, the tunnel incorporates advanced technology from Switzerland’s Furrer + Frey AG, utilizing a rigid catenary system throughout its length to provide power transmission for train pantographs. This design marks the first application of rigid catenary technology in China’s 25 kV AC electrified railways, making the Wushaoling Tunnel the longest railway tunnel in China to adopt this technology. Figure 2 illustrates the actual layout of the rigid catenary system during the on-site investigation, providing valuable practical insights for studying the application of rigid catenaries in extra-long tunnels.

2.2. Finite Element Modeling

Based on the investigation results, a sketch of the tunnel cross-section is drawn as shown in Figure 3.
The design follows the code for the design of high-speed railways (TB1003-2016 [4]) for a single-track tunnel with a speed of 160 km/h. The actual tunnel has a total length of approximately 20 km, a cross-sectional diameter of D = 11.1 m, a track spacing of 20 m, and a blockage ratio of 0.119. The simulated tunnel model has a total length of 20 m (scale 1:1000) and is single-track, and its simplified cross-section does not include buffer structures. The computational model considers the integrated track bed but does not include the rails. Based on the simplified cross-sectional sketch of the extra-long tunnel, the tunnel model is created by extrusion, as shown in Figure 4.
Figure 4a shows a schematic diagram of the full length of the tunnel, scaled down at a 1:1000 ratio compared to the actual extra-long tunnel. The cross-sectional radius of the tunnel above is proportionally reduced to match the original tunnel’s cross-sectional radius. While the lower wall of the full tunnel is curved, this study focuses on the pantograph–rigid catenary module above the train. Therefore, the lower tunnel wall in the model is simplified to a vertical wall, streamlining the subsequent flow field meshing process. Figure 4b illustrates the finite element model of the extra-long tunnel.
Figure 5 presents the pantograph model established in this study. Due to the complex structural characteristics of the pantograph, reasonable simplifications to its geometric model are necessary, considering hardware limitations and computational time constraints. The simplified pantograph model should closely resemble its physical structure, retaining geometric features that significantly impact its aerodynamic performance while omitting minor structural details that have negligible effects on the computational results.
The rigid catenary system primarily consists of components such as the contact wire, support devices, and cantilevers. The contact wire occupies minimal space within the tunnel, a feature that flexible catenary systems struggle to achieve. Therefore, rigid catenary systems are predominantly used in tunnels to provide electrical power for train operation. Most railway lines in China employ Π-shaped contact wires. The suspension types for the contact wire mainly include cantilever suspension and portal suspension. Figure 6 shows the established rigid catenary model.
After constructing the three models mentioned above, they are assembled to form a complete model of the extra-long tunnel, pantograph, and rigid catenary system. The result is shown in Figure 7.
This study employs the Reynolds-averaged k-ω SST (shear stress transport) two-equation turbulence model. The k-ω SST nonlinear shear stress transport turbulence model is similar to the standard k-ω turbulence model but combines the advantages of the standard k-ω model in near-wall region calculations with those of the k-ε model in far-field calculations [23]. The k-ω SST turbulence model is known for its high accuracy and reliability and has been widely adopted [24]. The turbulent kinetic energy (k) equation is given by Equation (1):
D ρ k D t = τ i j 𝜕 u i 𝜕 x j β * ρ w k + 𝜕 𝜕 x j μ + σ k μ t 𝜕 k 𝜕 x j
where τ i j is the Reynolds stress tensor, μ is the laminar viscosity, and μ t is the turbulent viscosity. The specific dissipation rate w equation is given by Equation (2):
D ρ w D t = γ μ t τ i j 𝜕 u i 𝜕 x j β ρ w 2 + 𝜕 𝜕 x j μ + σ w μ t 𝜕 k 𝜕 x j + 2 1 F 1 𝜕 σ w 2 w 𝜕 k 𝜕 x j 𝜕 w 𝜕 x j
where γ and F 1 are defined as
γ = β i β * σ w k 2 β *
F 1 = tan Φ 1 4
Φ 1 = min max k 0.09 w y , 500 μ ρ y 2 w , 4 ρ k σ w 2 D w + y 2
D w + = max 2 ρ 1 ρ w 2 1 w 𝜕 k 𝜕 x j 𝜕 w 𝜕 x j , 1 0 20
Here, y is the distance to the next surface, and the diffusion term Φ 1 is included. The turbulent viscosity μ t can be expressed by Equations (7)–(9):
μ t = ρ a 1 k max a 1 w , Ω F 2
F 2 = tan arg 2 2
arg 2 = max 2 k 0.09 w y , 500 μ ρ y 2 w
where Ω is the vorticity tensor, and the model constants in Equations (1)–(9) are a 1 = 0.31, β * = 0.09, k = 0.41, σ k 1 = 0.85, σ w 1 = 0.5, σ k 2 = 1, and σ w 2 = 0.856.
To improve the credibility of the flow field simulation results, the computational domain should theoretically extend to infinity. A larger computational domain increases the number of fluid grids, prolongs computation time, and demands higher hardware capabilities. Based on the characteristics of fluid simulation software, the computational domain must be expanded beyond the specific space of the flow field to reduce the influence of simulation result factors [25]. Therefore, in practical flow field calculations, it is sufficient to identify the computational domain that significantly impacts the overall system’s flow field characteristics. Within this space, the flow field characteristics of the pantograph–rigid catenary system are simulated, demonstrating the advantages of simulation calculations. Considering hardware limitations and aiming to improve computational accuracy, the computational domain for this study is determined as shown in Figure 8.
The mesh generation for the pantograph fluid computational model is divided into two parts. First, surface meshes for the complete model structure and the computational domain are generated. Then, fluid meshes are created from the surface meshes to the computational domain surface meshes.
To ensure the main structural features of the model, the Fluent meshing (Ansys 2024Ra) software is used to generate surface meshes on the simplified model. The quality of the surface meshes significantly impacts the quality of the fluid meshes. To minimize the generation of negative-volume fluid meshes and ensure the successful completion of the simulation, local mesh refinement is applied to areas with small structural gaps. Due to the complexity of the complete model’s structural features, the surface mesh size in this study is set to 1–10 mm. The generated mesh consists of 10,246,185 elements, 36,048,217 nodes, and a total of 53,295,998 faces. The surface mesh of the complete model is shown in Figure 9.

2.3. Model Validation

For research objects with complex geometric characteristics, the quality of the flow mesh significantly impacts the convergence, accuracy, and stability of numerical simulations. The quality of the fluid mesh directly affects the speed of numerical solutions and the precision of simulations. Typically, flow meshes can be categorized into structured and unstructured types [26]. Structured meshes are hexahedral meshes where each node has an equal number of adjacent elements, enabling rapid mesh generation, easy boundary layer division, and fast computation. For complex structures like pantographs, hexahedral meshes are difficult to directly partition, so unstructured polyhedral meshes can be used to divide the flow field of the entire model. Unstructured meshes do not require constraints on nodes as in structured meshes and offer excellent controllability over nodes and elements, making them well suited for handling complex object surface boundaries [27].
Table 1 presents the root mean square of the lift coefficient CL and the average drag coefficient CD for the pantograph–catenary system under different mesh types. As shown in the table, the aerodynamic coefficients of the system become nearly identical as the mesh is refined. To achieve more accurate results, and within the computational hardware constraints, this study employs polyhedral mesh generation for simulation analysis.
The flow field computational model is validated using an iteration convergence plot. As shown in Figure 10, the model stabilizes after approximately 100 iterations and completes over 500 iterations. Within the range of 100 to 500 iterations, only relatively small oscillations are observed, demonstrating that the fluid model has been established with high accuracy and meets the requirements for analysis.

2.4. Limitations of the Model

The simplified tunnel profile (e.g., ignoring tapered sections and support structures) may lead to distortion of local flow characteristics, particularly at the entrance/exit zones and intersections, where vortices and pressure gradients could be underestimated. The smooth-wall assumption neglects the effect of actual roughness on boundary layer development, thereby affecting drag prediction. The tunnel cross-sectional dimensions are much larger than the vibration amplitude of the overhead contact line, causing the dynamic influence of reflected waves from the walls to be disregarded. The support structures of rigid overhead contact lines in tunnels (e.g., droppers, steady arms) are simplified as rigid constraints, ignoring external loads such as wind-induced vibrations.

3. Flow Field Characteristics of the Pantograph–Rigid Catenary in Tunnels

The external flow field characteristics of the pantograph–rigid catenary system in extra-long tunnel scenarios is analyzed from three aspects: surface wind pressure, mid-cross-section flow field distribution, and flow field velocity. Based on the finite element method, Ansys 2024Ra software is used to perform one-way fluid–structure interaction (FSI) simulation and analysis of the entire pantograph–catenary system. 
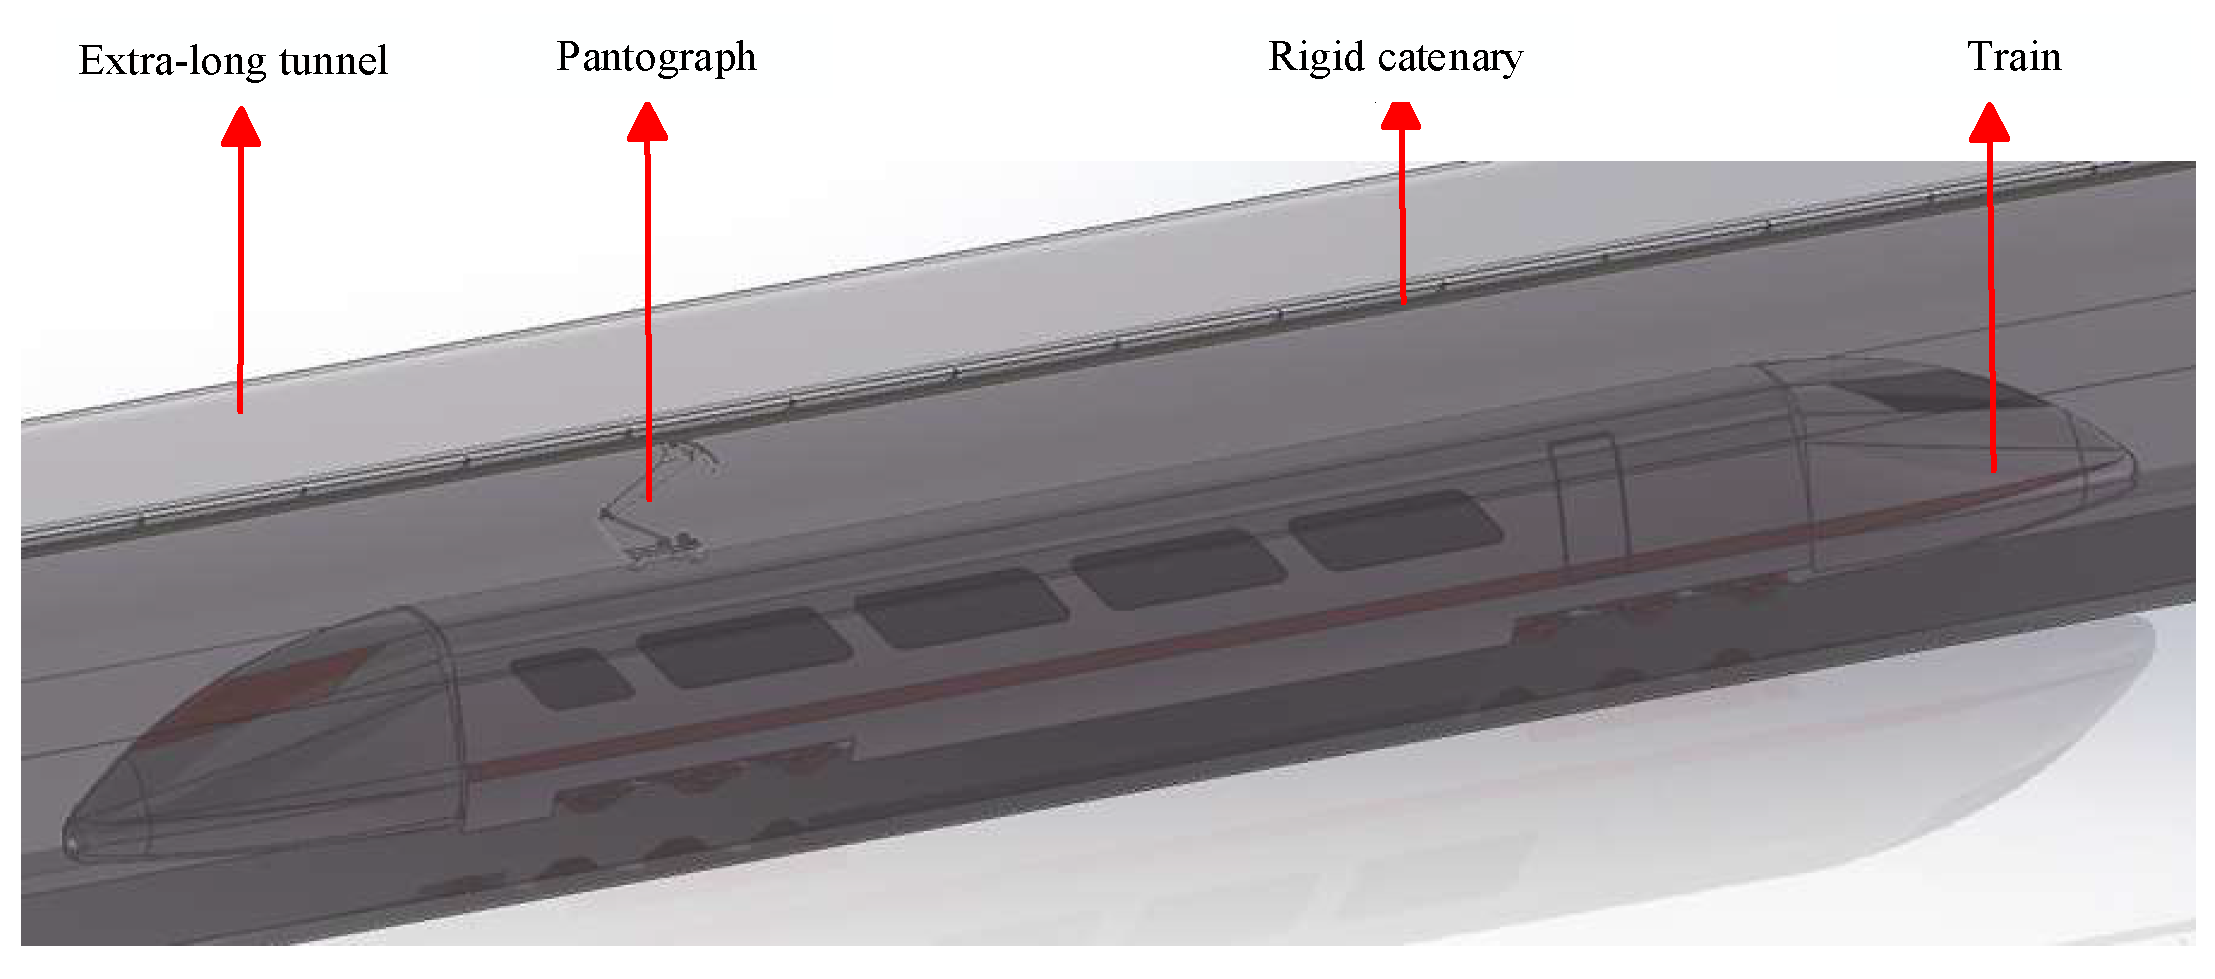
Figure 11 illustrates the operational trajectory of the pantograph–rigid catenary system in an extra-long tunnel scenario.
Considering the actual operating conditions, as shown in Figure 11, the train–pantograph system operates at a speed of 160 km/h within the tunnel. The train’s direction is set from right to left, so the pantograph operates under closed conditions. Subsequently, the flow field characteristics of the pantograph and rigid catenary are analyzed.

3.1. Flow Field Characteristics of the Pantograph in the Tunnel

3.1.1. Surface Wind Pressure of the Pantograph

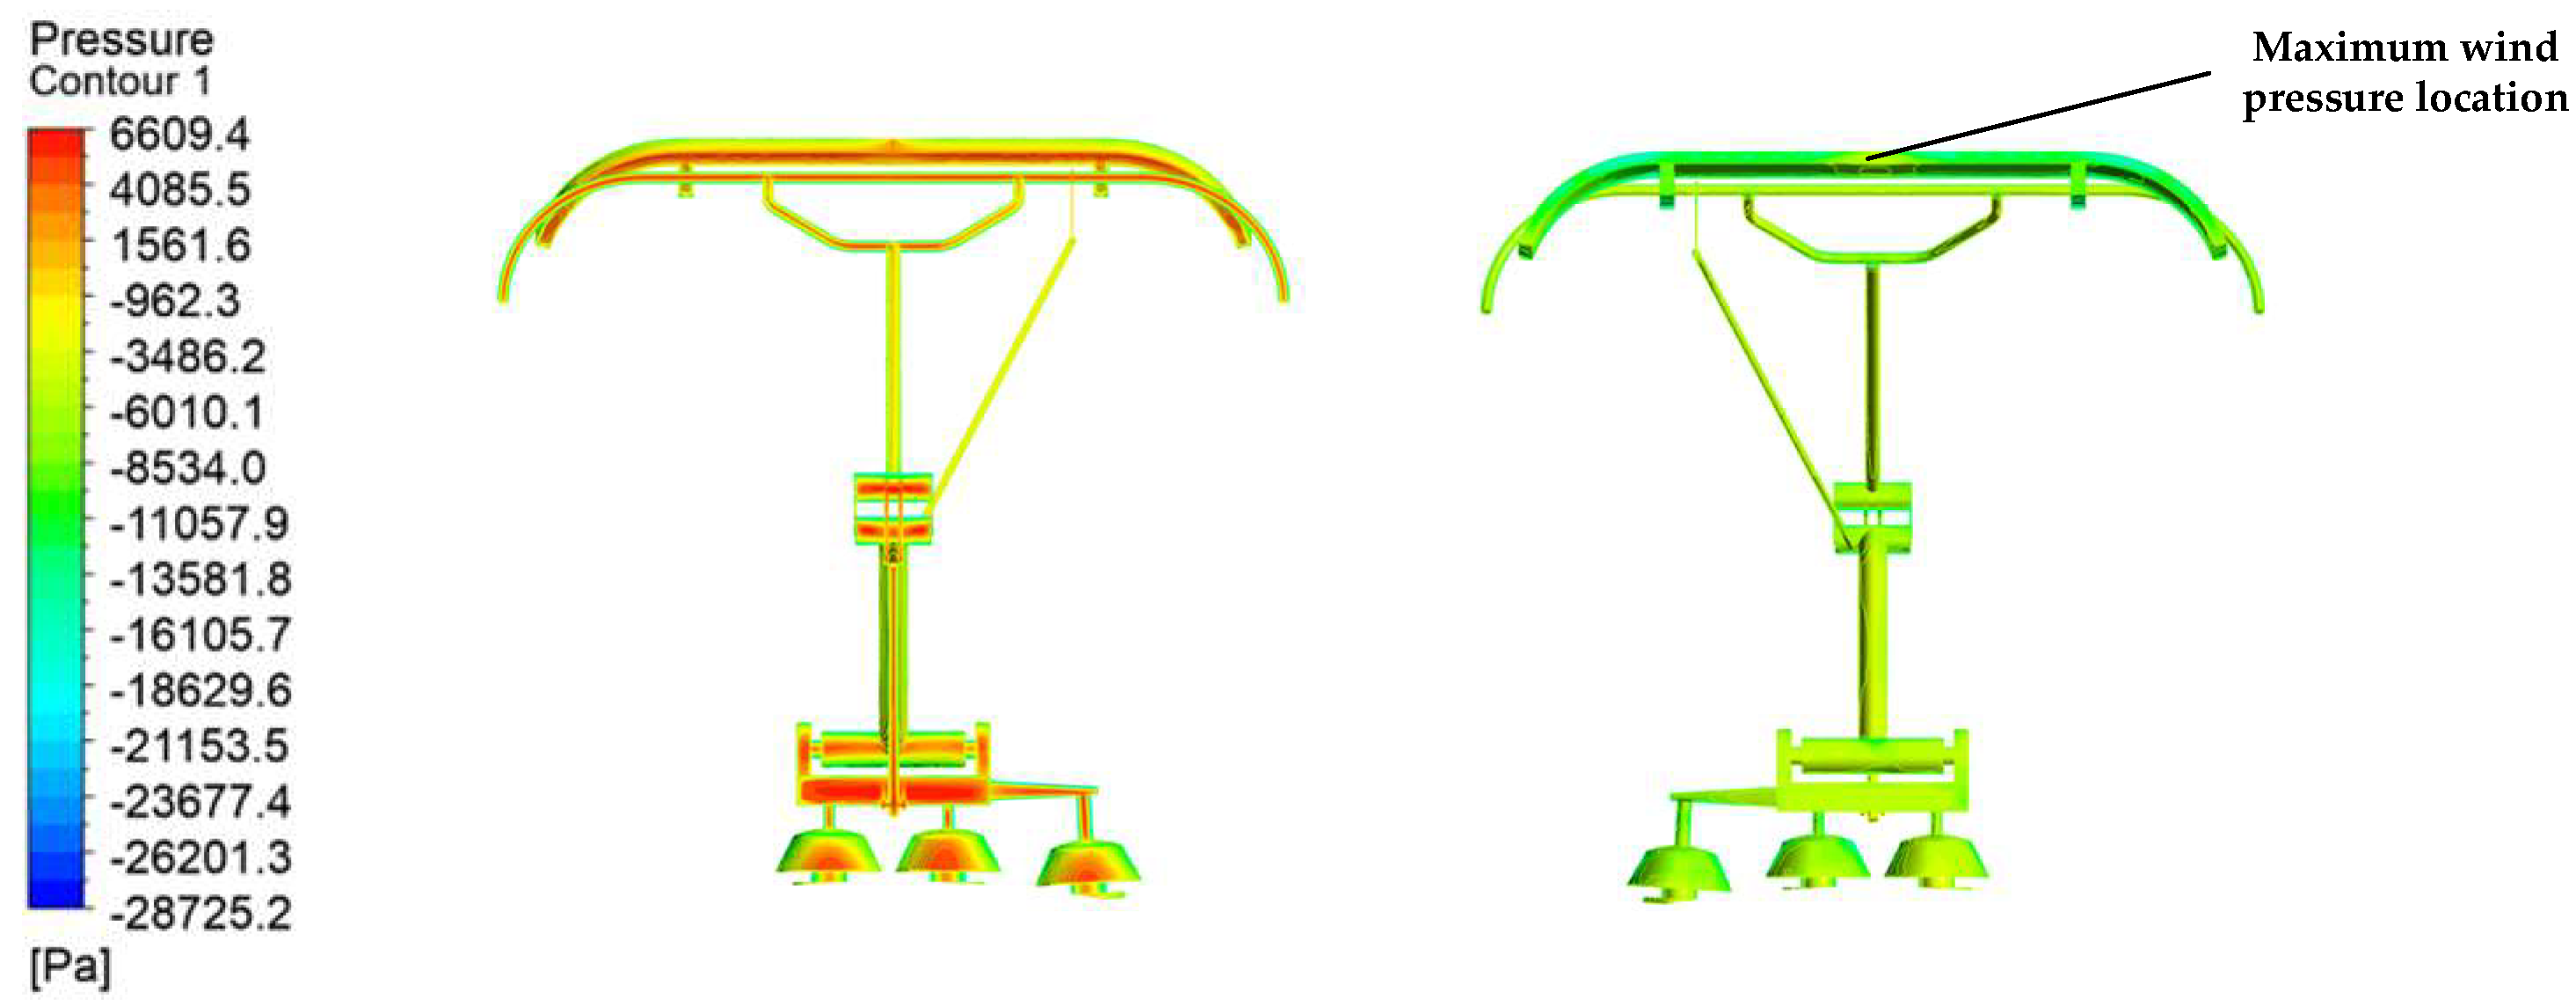
Figure 12 shows the pressure distribution cloud map on the pantograph surface at a train speed of 160 km/h. From the figure, it can be observed that, under the 160 km/h condition, the windward side of the pantograph experiences significant positive pressure, while the leeward side is under notable negative pressure. Specifically, the wind pressure on the upper and lower arms of the windward side is relatively small, with an average value of −3346.2 Pa. In contrast, the pressure on the collector head and upper arm is larger, with an average value of 5572.1 Pa. On the leeward side, the entire pantograph is subjected to negative pressure, with the maximum pressure concentrated on the collector head, averaging −9233.8 Pa. The pressure distribution on the upper arm, lower arm, and base is similar, with an average value of −5536.7 Pa.

3.1.2. External Flow Field Wind Pressure of Pantograph

Figure 13a shows the average pressure distribution cloud map of the external flow field of the pantograph when the train is running at a speed of 160 km/h in the first 10 km of an extra-long tunnel. It can be observed from the figure that, due to the short running distance of the pantograph in the tunnel, the influence of the pressure wave in the tunnel leads to a relatively complex characteristic in the pressure distribution in the external environment around the pantograph. Specifically, the wind pressure in the external environment around the pantograph is mainly negative, with an average value of −8636.7 Pa; the wind pressure distribution in front of the pantograph is mainly positive, and the turbulent flow field is significant, with an average wind pressure value of 3688.5 Pa; the wind pressure distribution behind the pantograph is entirely negative, and compared to the surrounding external environment, the wind pressure value at the rear is relatively smaller, with an average value of −3726.1 Pa.
Figure 13b shows the average pressure distribution cloud map of the external flow field of the pantograph when the train is running at a speed of 160 km/h in the last 10 km of an extra-long tunnel. It can be observed from the figure that, as the running distance of the pantograph in the tunnel increases, the fluctuation influence of the pressure wave in the tunnel gradually weakens, and the wind pressure distribution in the external environment around the pantograph tends to stabilize. Specifically, the wind pressure distribution in the external environment around the pantograph is mainly negative, with larger wind pressure values in the head and base areas, averaging −6334.7 Pa, while the wind pressure values in the external environment around the upper and lower arms are relatively smaller, averaging −2783.5 Pa. Additionally, the wind pressure distribution in front of and behind the pantograph is mainly positive, with larger wind pressure values in front, averaging 6329.3 Pa, and smaller wind pressure values at the rear, averaging 889.3 Pa.

3.1.3. Flow Velocity of the External Flow Field Around the Pantograph

Figure 14a presents the average airflow velocity distribution in the pantograph’s external flow field during the initial 10 km of train operation at 160 km/h in the extra-long tunnel. The results demonstrate significant non-uniformity in airflow velocity distribution during short-distance operation. Regions near the pantograph head, upper/lower arm junction, and base exhibit lower airflow velocities (average: 153.3 km/h). Surrounding areas show markedly higher velocities (average: 462.7 km/h) due to pressure wave abruptness. Front and rear zones display similar and relatively lower velocity distributions (average: 288.1 km/h).
Figure 14b displays the average airflow velocity distribution around the pantograph when the train operates at 160 km/h over a 10 km section following an extra-long tunnel. As the running distance increases, the influence of the pressure waves inside the tunnel gradually diminishes, and the airflow velocity around the pantograph stabilizes. The airflow velocity remains relatively low near the pantograph head, the joint between the upper and lower arms, and the base (average: 133.6 km/h). The flow velocity in the surrounding area of the pantograph decreases significantly compared to the initial 10 km running condition (average: 316.7 km/h). Additionally, the airflow velocity in front of and behind the pantograph further decreases and becomes more uniformly distributed (average: 214.5 km/h).
This study reveals that the pantograph operating in extra-long tunnels is primarily subjected to negative pressure, with the pantograph head exhibiting the most concentrated distribution of wind pressure. The pressure and velocity distributions in the external flow field of the pantograph demonstrate significant spatial heterogeneity, a phenomenon mainly attributed to the dynamic influence of the pressure waves inside the tunnel. As the running distance increases, the fluctuating effects of the pressure waves gradually attenuate, and the parameters of the external flow field (including pressure and velocity distributions) stabilize. These findings clarify key research directions for subsequent fluid–structure interaction (FSI) simulations while providing critical data support for pantograph structural optimization and fatigue life assessment.

3.2. Surface Wind Pressure on Rigid Catenary in Extra-Long Tunnel Scenarios

Figure 15 illustrates the distribution of surface wind pressure on the entire rigid catenary within the extra-long tunnel. From the figure, it is evident that the wind pressure distribution varies significantly across different components of the rigid catenary. Specifically, the upper part of Figure 15 highlights the localized characteristics of the wind pressure distribution on the rigid catenary surface. The cantilever components primarily experience positive wind pressure, with an average value of 3554.1 Pa, while the contact wire (or messenger wire) mainly experiences negative wind pressure, with an average value of −3722.4 Pa.
Further analysis of the wind pressure distribution across the entire rigid catenary reveals that the contact wire (or messenger wire) exhibits positive wind pressure at both the tunnel entrance and exit, with relatively high pressure values averaging 5729.7 Pa. In contrast, in the middle section of the tunnel, the rigid catenary experiences lower wind pressure, predominantly negative, with an average value of −5265.8 Pa.
These results indicate that the wind pressure distribution on the rigid catenary within the extra-long tunnel is significantly influenced by the tunnel’s structure and aerodynamic effects, exhibiting notable spatial heterogeneity. This phenomenon provides an important basis for further research into the mechanical characteristics and optimized design of rigid catenaries in extra-long tunnel environments. Additionally, it offers valuable insights for enhancing the durability and operational stability of rigid catenaries.

3.3. Pantograph–Rigid Catenary Fluid–Structure Interaction Characteristics

The FSI method is used to simulate bidirectional coupled interactions between fluids and solid structures (e.g., bridge vibrations under wind loads, heart valve motion, etc.), typically combining computational fluid dynamics (CFD) and structural mechanics solvers (such as finite element analysis). It enables the analysis of dynamic responses in multiphysics coupling, delivering high-fidelity results. The limitations of the FSI method lie in its high computational cost, with time steps constrained by mesh quality, and it is primarily applied in scenarios such as aeroelastic flutter, biomedical applications, and dynamic responses of structures in motion.
The hybrid LES/RANS method balances computational cost and accuracy by combining RANS and LES, directly capturing bidirectional energy exchange between fluids and structures, making it suitable for strongly coupled problems (e.g., aeroelasticity, biomechanics). By integrating RANS and LES, it achieves high computational efficiency, enables automatic switching between RANS/LES zones, and exhibits strong adaptability. The limitations of the hybrid LES/RANS method include potential non-physical eddy viscosity in transition regions and the requirement for sufficiently fine meshes in separation zones; otherwise, turbulence spectra may be underestimated. It is commonly used in scenarios such as aircraft flow fields and separated flows in complex geometries. This study adopts the FSI method.
The finite element mesh types, such as SHELL181 and SOLID185, were employed in the analysis. The thicknesses of the pantograph’s upper arm, lower arm, and base are related to the dimensions of the pantograph body, so the SHELL181 thin-shell element was used for these components. Solid components, such as the sliding plate, head plate, and wire guide plate, were modeled using the SOLID185 solid element, and finite element analysis was conducted on them. The material settings for the main components in the model are shown in Appendix A, Table A1.
A one-way fluid–structure interaction analysis can be performed using Fluent > Static Structural. This study proposes a numerical simulation method based on input flow fields, which is applied to numerical calculations. The algorithm adopts an implicit approach, transferring flow field information during each iteration and solving the fluid–structure interaction problem [28]. In a one-way fluid–structure coupling solution, the inlet flow velocity is set to 160 km/h, and the outlet pressure is set to 0. Based on this, the mesh around the system is refined, with mesh sizes ranging from 2 to 16 mm. In the static structural platform model, the mesh for small-area components, such as the head, upper arm, and lower arm, is refined to 0.5 mm. Currently, the model consists of 987,641 elements and 9,236,794 nodes, and the deformation and equivalent stress after fluid–structure coupling are obtained.
This method provides a robust framework for analyzing the stress characteristics and structural behavior of the pantograph under aerodynamic loads, offering valuable insights for optimizing its design and improving its durability.

3.3.1. Stress Characteristics of the Pantograph

Figure 16 shows the equivalent stress distribution of the pantograph. From the figure, it can be observed that there are significant differences in the equivalent stress distribution between the windward side and the leeward side of the pantograph.
Windward Side: The equivalent stress on the balance rod and the head of the pantograph ranges from 5 to 7 kPa. The equivalent stress at both ends of the head connector is relatively small, approximately 5 kPa. The equivalent stress at the carbon sliding plate of the head is about 6.5 kPa. The thin plate section at the connection between the upper and lower arms has a smaller cross-sectional area, resulting in higher stress in this region, with an equivalent stress exceeding 6 kPa. The equivalent stress on the upper arm rod and balance rod is greater than that on the other rods, approximately 5 kPa. The equivalent stress on the base and frame is roughly the same, with the connection between the balance rod and the head experiencing an equivalent stress of about 6.1 kPa and the maximum equivalent stress reaching 6.62 kPa.
Leeward Side: The equivalent stress at the connection between the balance rod and the head is approximately 8.42 kPa. The equivalent stress at other positions of the pantograph is about 9.36 kPa. The equivalent stress at both ends of the head component is relatively high, approximately 10.82 kPa. The equivalent stress at the thin plate of the head is about 7.88 kPa. The equivalent stress at the carbon sliding plate of the head is approximately 9.91 kPa. The equivalent stress at the connection between the upper and lower arms exceeds 7.65 kPa. The equivalent stress on the upper arm rod and balance rod is about 8.65 kPa. The equivalent stress on the base and frame is approximately 9.73 kPa. The equivalent stress at the connection between the balance rod and the head is about 8.74 kPa, with the maximum equivalent stress reaching 10.99 kPa.
These results indicate that, during operation, the equivalent stress distribution of the pantograph varies significantly across different parts, with the leeward side generally experiencing higher equivalent stress compared to the windward side. This phenomenon provides important insights for the structural optimization and durability analysis of the pantograph. It also serves as a valuable reference for improving the reliability of the pantograph in complex operating environments.

3.3.2. Stress Characteristics of the Rigid Catenary

Figure 17 shows the equivalent stress distribution of the rigid catenary. From the figure, it can be observed that, under the operating condition of a high-speed train running in a closed tunnel, the equivalent stress distribution of the rigid catenary is relatively uniform. Specifically, the equivalent stress on the contact wire, messenger wire, and I-beam is approximately the same, around 8.94 kPa. The equivalent stress on the supporting devices, such as the cantilever, shows an increasing trend from top to bottom, with the maximum equivalent stress value being 8.74 kPa and the minimum equivalent stress value being 5.64 kPa.
These results indicate that, under the operating conditions of a closed tunnel, the equivalent stress distribution of the rigid catenary is relatively balanced, and the stress distribution of the supporting devices exhibits a certain gradient characteristic. This phenomenon provides important insights for the structural design and optimization of the rigid catenary. It also serves as a valuable reference for enhancing its reliability and durability in high-speed operating environments.

3.3.3. Stress Characteristics of the Pantograph–Rigid Catenary System

Based on the above analysis, it can be concluded that, during operation in an extra-long tunnel, the pantograph head is subjected to significant wind pressure, making it prone to deformation or even damage. Therefore, this study focuses on analyzing the connection area between the pantograph head and the rigid catenary. Figure 18 shows the maximum equivalent stress deformation diagram of the connection area between the pantograph head and the rigid catenary. The following conclusions can be drawn from the figure.
Windward Side: The pantograph head and the cantilever of the rigid catenary along with their connecting components are subjected to relatively high positive pressure. The equivalent stress on the pantograph head is approximately 4.7 kPa. The equivalent stress on the cantilever and its connecting components is approximately 6.2 kPa.
Leeward Side: The pantograph head is subjected to relatively high negative pressure, while the cantilever and its connecting components experience relatively low positive pressure. The equivalent stress on the pantograph head is approximately 11.6 kPa. The equivalent stress on the cantilever and its connecting components is approximately 0.6 kPa.
These results further reveal the complex mechanical environment experienced by the pantograph head during operation in an extra-long tunnel. They provide important insights for optimizing the structure of the pantograph head and designing the connection area with the rigid catenary. Furthermore, the research findings offer theoretical support for improving the durability and reliability of the pantograph in high-speed operating environments.
The fluid–structure coupling calculation was carried out on the complete system of the pantograph rigid contact network in the scenario of an extra-long tunnel. The fluid–structure coupling calculation results were coupled, and the calculation results of the fluid–structure coupling strength of the main components of stress response are shown in Appendix A, Table A2.
According to Table A2, the stress distribution of the pantograph exhibits significant spatial heterogeneity: the locations with higher stress are mainly concentrated at the carbon sliding plate of the pantograph, with an average stress value of 7.32 kPa; the location with lower stress is at the upper arm of the pantograph, with a minimum stress of 5.34 kPa; the stress response of the pantograph shows a trend of “larger on both sides and smaller in the middle” from top to bottom; the stress response of the rigid contact network is relatively stable, with an average value of 7.11 kPa.
In summary, the structure of the pantograph head component and the connection between the upper and lower arms is relatively weak, mainly due to the inevitable existence of weak links in the design process. In addition, stress concentration is prone to occur at nodes, leading to excessive equivalent stress. For example, at the connection between the balance bar and the bow body, stress concentration is significant, which is extremely detrimental to the structural strength and may result in cracks or even fractures during long-term use. Therefore, it is particularly important to optimize the structure for these weak links.

4. Analysis and Validation

4.1. Aerodynamic Lifting Force of Pantograph in the Scene of Extra-Long Tunnel

Using a model to simulate the operation of a pantograph at different speed levels in a tunnel, the average aerodynamic lifting force of the pantograph was measured in Fluent and compared with wind tunnel test data in reference [29] to verify the rationality of the model. Table 2 shows the average aerodynamic lifting force of the pantograph at different speed levels, with a relative error kept within 5%.
Under the conditions of closed operation at a constant speed of 160 km/h, without considering crosswinds or wind speed variations, the aerodynamic forces acting on the pantograph were analyzed at specific positions within the tunnel: 3.5 m, 7 m, 10.5 m, 14 m, and 17.5 m (corresponding to tunnel lengths of 3.5 km, 7 km, 10.5 km, 14 km, and 17.5 km, respectively). The variation in aerodynamic forces at these positions is illustrated in Figure 19.
From the figure, it can be observed that, in the first half of the tunnel, as the train enters, the aerodynamic lift force on the pantograph exhibits significant and large fluctuations due to the sudden changes in the compression waves inside the tunnel. This phenomenon indicates that the aerodynamic effects in the tunnel entrance region have a substantial impact on the mechanical performance of the pantograph. As the train travels further into the tunnel, the fluctuating effects of the pressure waves gradually weaken, and the aerodynamic lift force on the pantograph stabilizes.
The research results demonstrate that the aerodynamic effects within extra-long tunnels significantly influence the aerodynamic lift force on the pantograph, particularly in the tunnel entrance region. This finding provides important insights for optimizing the design of the pantograph to address the complex flow field environment inside tunnels. Additionally, it offers theoretical support for enhancing the operational safety and stability of high-speed railways in extra-long tunnel scenarios.
The model was employed to simulate the pantograph operating at different speed levels within the tunnel. The aerodynamic forces on various components of the pantograph were measured in Fluent and compared with wind tunnel test data from reference [30] to validate the model’s rationality. The results are presented in Appendix A, Table A3. The calculated aerodynamic lift force of the pantograph is presented in Appendix A, Table A4.
It can be concluded that the aerodynamic lift force and velocity increase continuously with the increase in velocity. The wind tunnel test data and simulation calculation results of aerodynamic lift force show a similar variation pattern, with an error kept within 5%, indicating the credibility of the model establishment and the reliability of the numerical calculation results.

4.2. Pantograph–Catenary Contact Force Verification

The pantograph–catenary contact forces obtained from the fluid–structure interaction (FSI) model was compared with the field test data collected in the Wushaoling Tunnel at a speed of 160 km/h. The comparison of the contact force curves is shown in Figure 20. The maximum contact force (Fmax), average contact force (Fm), minimum contact force (Fmin), and contact force standard deviation (σ) within the frequency range of 0–20 Hz are summarized in Table 3 for both the simulation and field test results. From Table 3, it can be observed that the contact force statistics from the numerical simulation show good agreement with the field test results. The relative errors for Fmax, Fm, and Fmin are generally within 5%, while the relative error for σ is only −7.8%.

5. Conclusions

This study is based on field survey data from the Wushaoling Tunnel and utilizes SolidWorks 2024 software to construct finite element models of the extra-long tunnel, pantograph, and rigid catenary. Based on the geometric characteristics of the finite element models, the flow field boundary conditions were defined, and the flow field model was established. To ensure the accuracy of the model, this study conducted grid independence verification and flow field residual iteration verification. The verification results demonstrate that the mesh division is reasonable, and the numerical simulation results exhibit convergence and stability, thereby proving the reliability of the model.
This study conducted an in-depth analysis of the fluid–structure interaction (FSI) characteristics of the pantograph–rigid catenary system in an extra-long tunnel scenario. The results reveal the following key findings:
(1)
Aerodynamic Lift Force of the Pantograph:
The aerodynamic lift force acting on the pantograph was simulated during its operation in an extra-long tunnel. The results show significant fluctuations in the lift force, particularly in the tunnel entrance region, due to the influence of pressure waves and airflow dynamics. As the train travels further into the tunnel, the lift force stabilizes, reflecting the diminishing effects of pressure waves.
(2)
Modal Analysis of the Rigid Catenary:
Modal analysis of the rigid catenary revealed that its first six mode shapes are dominated by lateral symmetric vibrations, with no significant vertical or torsional vibrations observed. This indicates that the structural design of the rigid catenary meets engineering requirements and is capable of withstanding dynamic loads under high-speed operating conditions.
(3)
Pantograph–Catenary Contact Force Validation:
Based on the aerodynamic lift force of the pantograph and the vibration characteristics of the rigid catenary, the pantograph–catenary contact forces were calculated for the extra-long tunnel scenario. These simulated contact forces were compared with field test data collected in the Wushaoling Tunnel. The comparison showed that the relative errors for the maximum contact force Fmax, average contact force Fm, and minimum contact force Fmin were all within 5%, demonstrating excellent agreement between the simulation and field measurements.
This study employs a combined approach of numerical simulation and theoretical analysis to thoroughly investigate the aerodynamic characteristics and fluid–structure interaction mechanisms of pantograph–rigid catenary systems in extra-long tunnel environments. The research outcomes not only provide a scientific basis for the safe operation of high-speed trains in extra-long tunnels but also establish important theoretical foundations and reliable data support for the optimal design of such systems.

Author Contributions

Conceptualization, S.W. and X.Z.; methodology, S.W.; formal analysis, S.W. and X.Z.; investigation, S.W. and X.C.; data curation, S.W., Y.W., X.C. and Z.C.; writing—original draft preparation, S.W.; writing—review and editing, S.W. and Y.W.; supervision, X.Z.; project administration, Y.W.; funding acquisition, Y.W. All authors have read and agreed to the published version of the manuscript.

Funding

This research was funded by the National Natural Science Foundation of China (52067013, 52367009).

Data Availability Statement

Data are contained within the article.

Conflicts of Interest

Author Zhanning Chang was employed by the company China Railway Lanzhou Bureau Group Co., Ltd. The remaining authors declare that the research was conducted in the absence of any commercial or financial relationships that could be construed as a potential conflict of interest.

Appendix A

Table A1. Main component material settings.
ComponentMaterialElastic Modulus
(MPa)
Poisson’s RatioDensity
(g·cm−3)
Element Type
Pantograph HeadStainless steelCarbon1.27 × 1040.302.0SOLID185
Aluminum trayAluminum alloy7.1 × 1040.332.7SOLID185
Pantograph head frameTitanium alloy1.17 × 1050.344.5SOLID185
Upper ArmUpper armCarbon steel2.1 × 1050.277.85SHELL181
Lower ArmLower armCast aluminium7.1 × 1040.332.7SHELL181
BaseChassisStainless steel2.1 × 1050.277.93SHELL181
Traction link baseStainless steel2.1 × 1050.277.93SHELL181
ReinforcementStainless steel2.1 × 1050.277.93SHELL181
Rigid overhead catenaryContact lineCarbon steel2.1 × 1050.277.85SHELL181
BusbarCarbon steel2.1 × 1050.277.93SHELL181
I-beamCarbon steel2.1 × 1050.277.93SHELL181
CantileverCarbon steel2.1 × 1050.277.93SHELL181
Table A2. Bow net fluid–structure coupling strength.
ComponentMaterialMean Stress (kPa)Yield Strength
(MPa)
Safety Factor
Pantograph HeadStainless steelCarbon7.3216.91.51
Aluminum trayAluminum alloy6.3714.81.45
Pantograph head frameTitanium alloy7.1115.73.21
Upper ArmUpper armCarbon steel5.3413.42.47
Lower ArmLower armCast aluminium5.8912.22.19
BaseChassisStainless steel6.9215.23.11
Traction link baseStainless steel7.3516.82.59
ReinforcementStainless steel6.4515.81.73
Rigid Overhead CatenaryContact lineCarbon steel7.1616.52.51
BusbarCarbon steel7.2916.73.42
I-beamCarbon steel6.9314.52.89
CantileverCarbon steel7.0716.93.24
Table A3. Aerodynamic forces on pantograph components at different speed levels.
Speed (km/h)Pantograph HeadUpper ArmLower Arm
Drag (N)Lift (N)Drag (N)Lift (N)Drag (N)Lift (N)
160−146.6011.50−35.0239.67−65.12−18.61
200−229.261.03−54.4261.34−100.25−24.98
250−370.5710.25−89.93103.88−155.29−34.06
300−516.642.62−121.58137.00−223.77−40.05
Table A4. Comparison between pantograph aerodynamic simulation results and wind tunnel test data.
Aerodynamic Uplift Force (N)160 (km/h)200 (km/h)250 (km/h)300 (km/h)
ClosedExperimental data136166.9231.7297.8
Simulation results142.57172.35237.89290.15
Relative error (%)4.83.22.62.5

References

  1. Mo, Z. Exploration of Train Control System Scheme for High speed Railway in Western Plateau Mountainous Areas. China Railw. 2021, 77–83. [Google Scholar]
  2. Liu, Z.; Meng, X.; Zhang, Q.; Deng, Y.; Sun, W.; Zhang, G. Railway traction power supply system in high-altitude mountainous areas—Problems, challenges and countermeasures. Power Grid Technol. 2023, 47, 2039–2054. [Google Scholar]
  3. Yang, G. Preface to Key Mechanics Issues in the Design and Service of High Speed Trains. J. Mech. 2021, 53, 17–18. [Google Scholar]
  4. TB 10003-2016; Code for Design of Railway Tunnels. National Railway Administration. China Railway Press: Beijing, China, 2016.
  5. Chen, X.; Zhang, X.; Wang, Y.; Wang, X. Research on dynamic current characteristics of high-speed railway double bow net system under environmental wind. Vib. Test. Diagn. 2024, 44, 320–329+411–412. [Google Scholar]
  6. Wang, Y. Research on the Heat Flow and Current Conduction of Bow Wire Electrical Contact and Their Effects. Ph.D. Thesis, Southwest Jiaotong University, Chengdu, China, 2016. [Google Scholar]
  7. Yang, J.; Lu, X.B.; Guan, J.; Ding, R.; Zhang, J.; Liu, Z. Research on the Selection of Working Tension for 400 km/h Contact Wire System. J. Railw. Eng. 2023, 40, 67–73. [Google Scholar]
  8. Zhan, D.; Gao, S.; Yu, L. Research on Visual Calibration Method for Dynamic Detection System of Rigid Contact Wire Wear. J. Instrum. 2024, 45, 99–109. [Google Scholar]
  9. Gao, J.; Zhou, Y.; Li, F.; Zhu, Z. Research on dynamic simulation platform for pantograph overhead rigid contact system. Electrified Railw. 2024, 35, 67–72. [Google Scholar]
  10. Zhu, Z.; Gao, J.; Zhou, Y.; Li, F. Research on Key Technologies and Solutions of Rigid Contact Network with a Speed of 200 kilometers per hour. Electrified Railw. 2025, 36, 50–56. [Google Scholar]
  11. Tur, M.; Gregori, S.; Correcher, A.; Gil, J.; Pedrosa, A.; Fuenmayor, F. Hardware-in-the-Loop pantograph tests with general overhead contact line geometry. Mechatronics 2024, 102, 103231. [Google Scholar] [CrossRef]
  12. Amano, Y.; Kobayashi, S.; Yabuno, H.; Yamashita, Y.; Mori, H. Mechanism and suppression of friction-induced vibration in catenary-pantograph system. Nonlinear Dyn. 2024, 112, 14959–14980. [Google Scholar] [CrossRef]
  13. Antonio, C.; Carlos, R.; Manuel, T.; Santiago, G.; Mario, S.-M.; Javier, F.; Jaime, G.; Ana, M.P. Hardware-in-the-Loop Test Bench for Simulation of Catenary-Pantograph Interaction (CPI) with Linear Camera Measurement. Sensors 2023, 23, 1773. [Google Scholar] [CrossRef]
  14. Zdziebko, P. Multi-domain approach to modeling pantograph-catenary interaction. Eksploat. I Niezawodn.-Maint. Reliab. 2022, 24, 130–139. [Google Scholar] [CrossRef]
  15. Bivani, S.; Ghasemi, M.; Goligerdian, A. Fractional B-spline collocation method for the numerical solution of the fractional pantograph differential equations. Bound. Value Probl. 2025, 2025, 17. [Google Scholar] [CrossRef]
  16. Jesús, B.; Fernando, C.; Tomás, R.; Pedro, T.; Enrique, A. A Dynamic Model for the Study and Simulation of the Pantograph–Rigid Catenary Interaction with an Overlapping Span. Appl. Sci. 2021, 11, 7445. [Google Scholar] [CrossRef]
  17. Pan, L.; Xu, Y.; Liu, Z.; Xiao, C.; Lei, J. A Fast Simulation Model of Pantograph–Stitched-Catenary Interaction in Long-Distance Travel. Appl. Sci. 2024, 14, 10160. [Google Scholar] [CrossRef]
  18. Joong, S.K.; Hyeokbin, K.; Junsun, A. Aerodynamic performance of a pantograph cover for high-speed train. J. Mech. Sci. Technol. 2023, 37, 4681–4693. [Google Scholar]
  19. Gao, J.; Zhou, Y.; Guan, J.; Li, F.; Zhu, Z.; Chen, J. Research on Design Criteria for Rigid Contact Network Based on Static Mechanics and Modal Analysis. Electrified Railw. 2024, 35, 37–45. [Google Scholar]
  20. Zhao, Y. Aerodynamic Characteristics and Fluid Structure Coupling Analysis of High-Speed Train Pantographs. Master’s Thesis, Dalian Jiaotong University, Dalian, China, 2021. [Google Scholar]
  21. Gao, J. Research on Key Technologies and Solutions of High Speed Rigid Contact Network in Gaolonglong. 200 km/h. Master’s Thesis, Southwest Jiaotong University, Chengdu, China, 2021. [Google Scholar]
  22. Li, X.; Han, Y.; Chen, D.; Yao, S.; Tao, Z.; Chen, Y. Simulation analysis of high speed train pantograph fluid structure coupling based on STAR-CCM+ and ABAQUS. Railw. Tech. Stand. 2024, 6, 1–8. [Google Scholar]
  23. Li, T.; Qin, D.; Zou, D.; Zhang, J.; Zhang, W. Pneumatic characteristics and comparative study of high-speed pantograph opening and closing operation. J. Mech. Eng. 2019, 4, 177–184. [Google Scholar]
  24. Jia, R.; Wang, J.; Gu, C. Identification of Equivalent Parameters of Pantograph and Study on Structural Strength. Railw. Locomot. Roll. Stock. 2020, 40, 78–83. [Google Scholar]
  25. He, S. Simulation Study on Aerodynamic Characteristics of High-Speed Pantograph. Master’s Thesis, Southwest Jiaotong University, Chengdu, China, 2018. [Google Scholar]
  26. Chi, J. Simulation Study on Fluid Structure Coupling Characteristics of 400 km/h Pantograph. Master’s Thesis, Southwest Jiaotong University, Chengdu, China, 2021. [Google Scholar]
  27. Yuan, S.; Yang, Z.; Li, X.; Xiao, Q. Simulation study on aerodynamic noise of high-speed train bow cavity coupling system under open/closed working conditions. J. Railw. Sci. Eng. 2025, 1–11. [Google Scholar]
  28. Yu, S. Analysis of Aerodynamic and Fluid Structure Coupling Characteristics of Biomimetic Pantograph Head for High-Speed Trains. Master’s Thesis, Dalian Jiaotong University, Dalian, China, 2023. [Google Scholar]
  29. Tan, M.; Li, H.; Nie, L. Defect Diagnosis of Rigid Catenary System Based on Pantograph Vibration Performance. Actuators 2024, 13, 162. [Google Scholar] [CrossRef]
  30. Jiang, L. Research on the Aerodynamic Characteristics of Train Pantographs and the Application of Domestically Developed Software INTESIM. Master’s Thesis, Dalian Jiaotong University, Dalian, China, 2022. [Google Scholar]
Figure 1. Tunnel distribution in a specific section of western China.
Electronics 14 01628 g001
Figure 2. On-site field investigation. (a) Tunnel entrance. (b) Rigid catenary.
Electronics 14 01628 g002
Figure 3. Sketch of tunnel cross-section modeling.
Electronics 14 01628 g003
Figure 4. Extra-long tunnel model. (a) Tunnel length. (b) Tunnel model.
Electronics 14 01628 g004
Figure 5. Simplified pantograph model.
Electronics 14 01628 g005
Figure 6. Rigid contact network model.
Electronics 14 01628 g006
Figure 7. Complete system model.
Electronics 14 01628 g007
Figure 8. Fluid calculation area.
Electronics 14 01628 g008
Figure 9. Complete model grid division. (a) Vehicle body, pantograph grid. (b) Rigid contact wire mesh. (c) Complete system grid. (d) Grid data.
Electronics 14 01628 g009
Figure 10. Iterative diagram of fluid model.
Electronics 14 01628 g010
Figure 11. System operation trajectory.
Electronics 14 01628 g011
Figure 12. Surface wind pressure of pantograph.
Electronics 14 01628 g012
Figure 13. Wind pressure in the external flow field of the pantograph. (a) Average wind pressure of the external flow field around the pantograph in the first 10 km of the tunnel. (b) Average wind pressure of the external flow field around the pantograph in the last 10 km of the tunnel.
Electronics 14 01628 g013
Figure 14. Average flow velocity of the external flow field around the pantograph. (a) Average flow velocity of the external flow field around the pantograph in the first 10 km of the tunnel. (b) Average flow velocity of the external flow field around the pantograph in the last 10 km of the tunnel.
Electronics 14 01628 g014
Figure 15. Surface wind pressure distribution on the rigid catenary.
Electronics 14 01628 g015
Figure 16. Equivalent stress distribution of the pantograph.
Electronics 14 01628 g016
Figure 17. Equivalent stress distribution of the rigid catenary.
Electronics 14 01628 g017
Figure 18. Equivalent stress distribution of the rigid catenary connection area.
Electronics 14 01628 g018
Figure 19. Variation in aerodynamic lift force on the pantograph at 160 km/h.
Electronics 14 01628 g019
Figure 20. Contact force verification of simulation and field test.
Electronics 14 01628 g020
Table 1. Aerodynamic coefficients of the pantograph–catenary system for different meshes.
MeshNumberLift
Coefficient (CL)
Drag
Coefficient (CD)
Tetrahedron703,68711.16337.8641
Pyramid815,29613.58928.7842
Hexahedron952,87114.25249.1523
Polyhedron985,37914.36719.2687
Table 2. Comparison of aerodynamic simulation results of pantograph and wind tunnel test data.
Pneumatic Lift Force (N)160 (km/h)
Closed structureExperimental136
Simulation142.57
Relative Error (%)4.8
Table 3. Verification of contact force through simulation and field testing.
Simulation (N)Field Test (N)Error (%)
F max 162.10157.552.9
F m 110.18105.294.6
F min 55.4653.124.4
σ 17.6019.10−7.8
Disclaimer/Publisher’s Note: The statements, opinions and data contained in all publications are solely those of the individual author(s) and contributor(s) and not of MDPI and/or the editor(s). MDPI and/or the editor(s) disclaim responsibility for any injury to people or property resulting from any ideas, methods, instructions or products referred to in the content.

