1. Introduction
With the continuous advancement of technology and theoretical knowledge in human society, optimization algorithms have evolved from initial derivative-based methods to become derivative-free meta-heuristic intelligent algorithms. This evolution has significantly enhanced the ability of algorithms to handle nonlinear and convex optimization problems. In the current era, where artificial intelligence and big data are prevalent, the demand for optimization algorithms across various industries is increasingly growing. However, the optimization capabilities of different algorithms vary when applied to specific problems. Consequently, a considerable number of scholars are engaged in developing new algorithms or refining existing ones to enhance their accuracy and convergence speed, tailoring them to address distinct challenges. For example, Wu et al. proposed an enhanced AO algorithm improved by PSO to address the UAV path planning problem [
1]. Experimental results also demonstrated the practicality of PSAO in UAV path planning. Anirban et al. employed the Aquila optimizer (AO) algorithm to optimize the selection and placement of distributed generators (DG) [
2]. This approach demonstrates the effectiveness of AO in addressing complex optimization problems in power system planning. Chiheb et al. enhanced the Aquila optimizer (AO) algorithm by incorporating Cauchy mutation and successfully applied it to the classification of brain tumor data [
3]. Furthermore, numerous studies have demonstrated that combining optimization algorithms with neural network models can significantly enhance the overall performance of the algorithms [
4,
5,
6,
7,
8]. For example, Qiao et al. combined an improved Aquila optimizer with temporal convolutional networks and random forests to form a meta-heuristic deep learning model, demonstrating the effectiveness of the algorithm in rainfall-runoff prediction [
9]. Duan et al. proposed a hybrid model integrating a fully convolutional neural network (FCN) and the Aquila optimizer (AO) to predict solar radiation intensity, offering valuable insights for clean energy utilization [
10]. These studies represent specific applications of optimization algorithms in various fields. Compared with other deep learning architectures (e.g., CNN), Long Short-Term Memory (LSTM) networks demonstrate superior capability in modeling temporal dependencies within sequential data. Therefore, this study proposes a novel MIAO-LSTM hybrid model that integrates an enhanced Aquila optimizer (improved through phasor and flow direction operators) with an LSTM network for railway freight volume prediction in China.
With the rapid development of the logistics industry, optimization algorithms and deep learning models have demonstrated their significant importance in research related to freight volume prediction. There are also further studies on rail freight volume forecasting. Xu et al. [
11] combined the product seasonal model with the LSTM that introduces the attention mechanism, and used the error correction method to improve the poor prediction accuracy of the product seasonal model, which improved the model’s data processing capability compared with the traditional LSTM network. Seock et al. [
12] used PCA to complete the screening of input data for the situation of low freight volume data and large data fluctuations. Feng et al. [
13] used a capsule neural network algorithm to predict the export demand of the China–Europe liner; the difference with the completely connected neural network is that the capsule neural network adds two coupling coefficients in the stage of input linear weighted summation, which further strengthens the model’s nonlinear fitting ability. Also, to reduce the possible impact of the gradient problem, the capsule neural network optimizes the activation function, which also improves the prediction accuracy. However, these two initiatives reduce the speed of training the model, as well as the adaptability of the model with more input data.
Railway freight is a complex nonlinear system, which is jointly influenced by numerous factors, but the above studies do not consider the influencing factors, and only use the past freight volume data to predict the future freight volume, which is the prediction from the freight volume to the freight volume, with a large uncertainty and a large fluctuation in the prediction results [
13,
14]. Railway freight, as a large-capacity, long-distance, low-cost mode of transport, has a natural advantage in terms of the transportation of bulk commodities, which leads to the railway being used to transport bulk commodities. National policies have a greater impact, therefore, most scholars will use the production of coal, crude oil, and other types of bulk commodities, and other modes of transport that have a competitive relationship with railway freight, for freight volume forecasting. The influence of these factors has resulted in a large number of studies and has achieved excellent research results. For example, Liu et al. [
15] used grey correlation analysis to select the features with higher correlation from the numerous influencing factors. Zhang et al. [
16] proposed a multidimensional LSTM prediction model to synchronize data with different attributes of spatial and temporal correlation, considering that railway freight traffic is affected by a variety of factors. The advantage of this model is that it can reflect correlations between data in different dimensions. While these studies have scientifically predicted results for freight traffic, it remains unconvincing that most hyperparameters in algorithmic models are set empirically.
To increase the reliability of the prediction model, numerous experts and scholars in the field of transportation at home and abroad have combined the optimization algorithm with the machine learning model and used the optimization algorithm to optimize the hyperparameters of the model and reduce the influence of subjective factors. For example, in marine ship trajectory prediction, Liu et al. [
17] proposed a deep learning-based ship trajectory prediction framework (QSD_LSTM), which incorporated the dynamic QSD algorithm into the LSTM network, and this model improved the prediction accuracy while making it easier to represent the occurrence of trajectory conflicts, which improved the efficiency of intelligent supervision at sea. In terms of passenger flow prediction, Qin et al. [
18], based on the passenger flow, which has a nonlinear and seasonal trend, used STL to decompose the data into seasonal, trend component, and residual component, and used the improved grasshopper optimization algorithm to predict the trend and residual, respectively, and, finally, the results of the three parts were added to obtain the monthly passenger flow prediction results. This combination of a decomposition and optimization algorithm reduced the influence of noise information and has great scalability. Similarly, in air cargo prediction, Li et al. [
19] used the VMD technique to decompose dynamic and nonlinear air cargo data, extracted the main features of the original data, and eliminated the noise, after which the generated high-frequency components were decomposed twice with an EMD optimized Elman’s network structure using a cuckoo optimization algorithm, and each component was predicted with this model, which technically found the effective data. The critical point of the lag region improves the performance of the prediction method. In terms of traffic flow prediction, Manuel et al. [
20] combined a convolutional neural network and a bidirectional LSTM network to form a CNN_BILSTM prediction model, which combined the ability of CNN to extract hidden valuable features from the input and the ability of Bi-LSTM to address the continuity of information in time-series data, which is of some reference value for coping with traffic congestion. In the area of waterborne freight activity prediction, Bhurtyal et al. [
21] leveraged near real-time vessel tracking data from the Automatic Identification System (AIS) data set. Long Short-Term Memory (LSTM), Temporal Convolutional Network (TCN), and Temporal Fusion Transformer (TFT) machine learning models are developed using the features extracted from the AIS and the historical WCS data. The output of the model is the prediction of the quarterly volume of commodities (in tons) at the port terminals for four quarters in the future. In terms of railway freight volume prediction, Yang et al. [
22] constructed four prediction models based on multivariate statistical methods, which are of some reference value in terms of freight vehicles and labor allocation.
In summary, research on freight volume forecasting has ranged from single-algorithm models, for the use of optimization algorithms to optimize model parameters and reduce human intervention to improve prediction accuracy, to the use of targeted processing and optimization methods based on different data characteristics. All these means are overcoming the limitations of the NFL theorem [
23] and expanding the applicability of the models. However, different algorithms differ from each other in the same scenario. Therefore, we employ novel optimization algorithms to solve the freight volume prediction problem.
Based on the above studies, the literature on freight volume prediction is relatively thin and there is a large research space. In this paper, we use the multi-strategy modified Aquila optimizer to optimize LSTM for freight volume prediction research, and the main research contributions are as follows.
(1) The Aquila optimizer (AO) has been improved by incorporating the phasor operator and flow direction operator. The introduction of the phasor operator significantly reduces the impact of parameters on the algorithm’s performance and enhances its optimization capability, as demonstrated by benchmark test functions. The reduction in parameters increases the ability of the Aquila optimizer to handle complex nonlinear systems, such as railway freight volume prediction.
(2) The MIAO_LSTM model was applied to freight volume prediction, and the impact of influencing factors on the prediction results was investigated. Railway freight volume forecasting is jointly affected by numerous factors, and most of its input features are selected by relying on experience, which may have a certain impact on the prediction results, therefore, this paper uses Grey Relational Analysis to calculate the size of the correlation between each input feature and the freight volume, and selects the input features whose correlation is greater than 0.8 to conduct the test again. This result demonstrates that a reasonable choice of input features will also improve the prediction accuracy of freight volume.
The remainder of this paper is structured as follows:
Section 2 introduces the LSTM network model;
Section 3 presents the multi-strategy improved Aquila optimizer (MIAO) algorithm; and
Section 4 applies the constructed MIAO_LSTM model to railway freight volume prediction, further validating the effectiveness of the MIAO model. This section provides a detailed explanation of the model’s inputs and outputs, its construction, and the analysis of prediction results.
Section 5 summarizes the contributions of the paper, discusses its limitations, and outlines future research directions.
2. LSTM Neural Network
The LSTM (Long Short-Term Memory) neural network is derived from the recurrent neural network, which has achieved great results in the fields of structural modeling [
24,
25], engineering design [
26,
27], global optimization [
28,
29], and energy efficiency [
30,
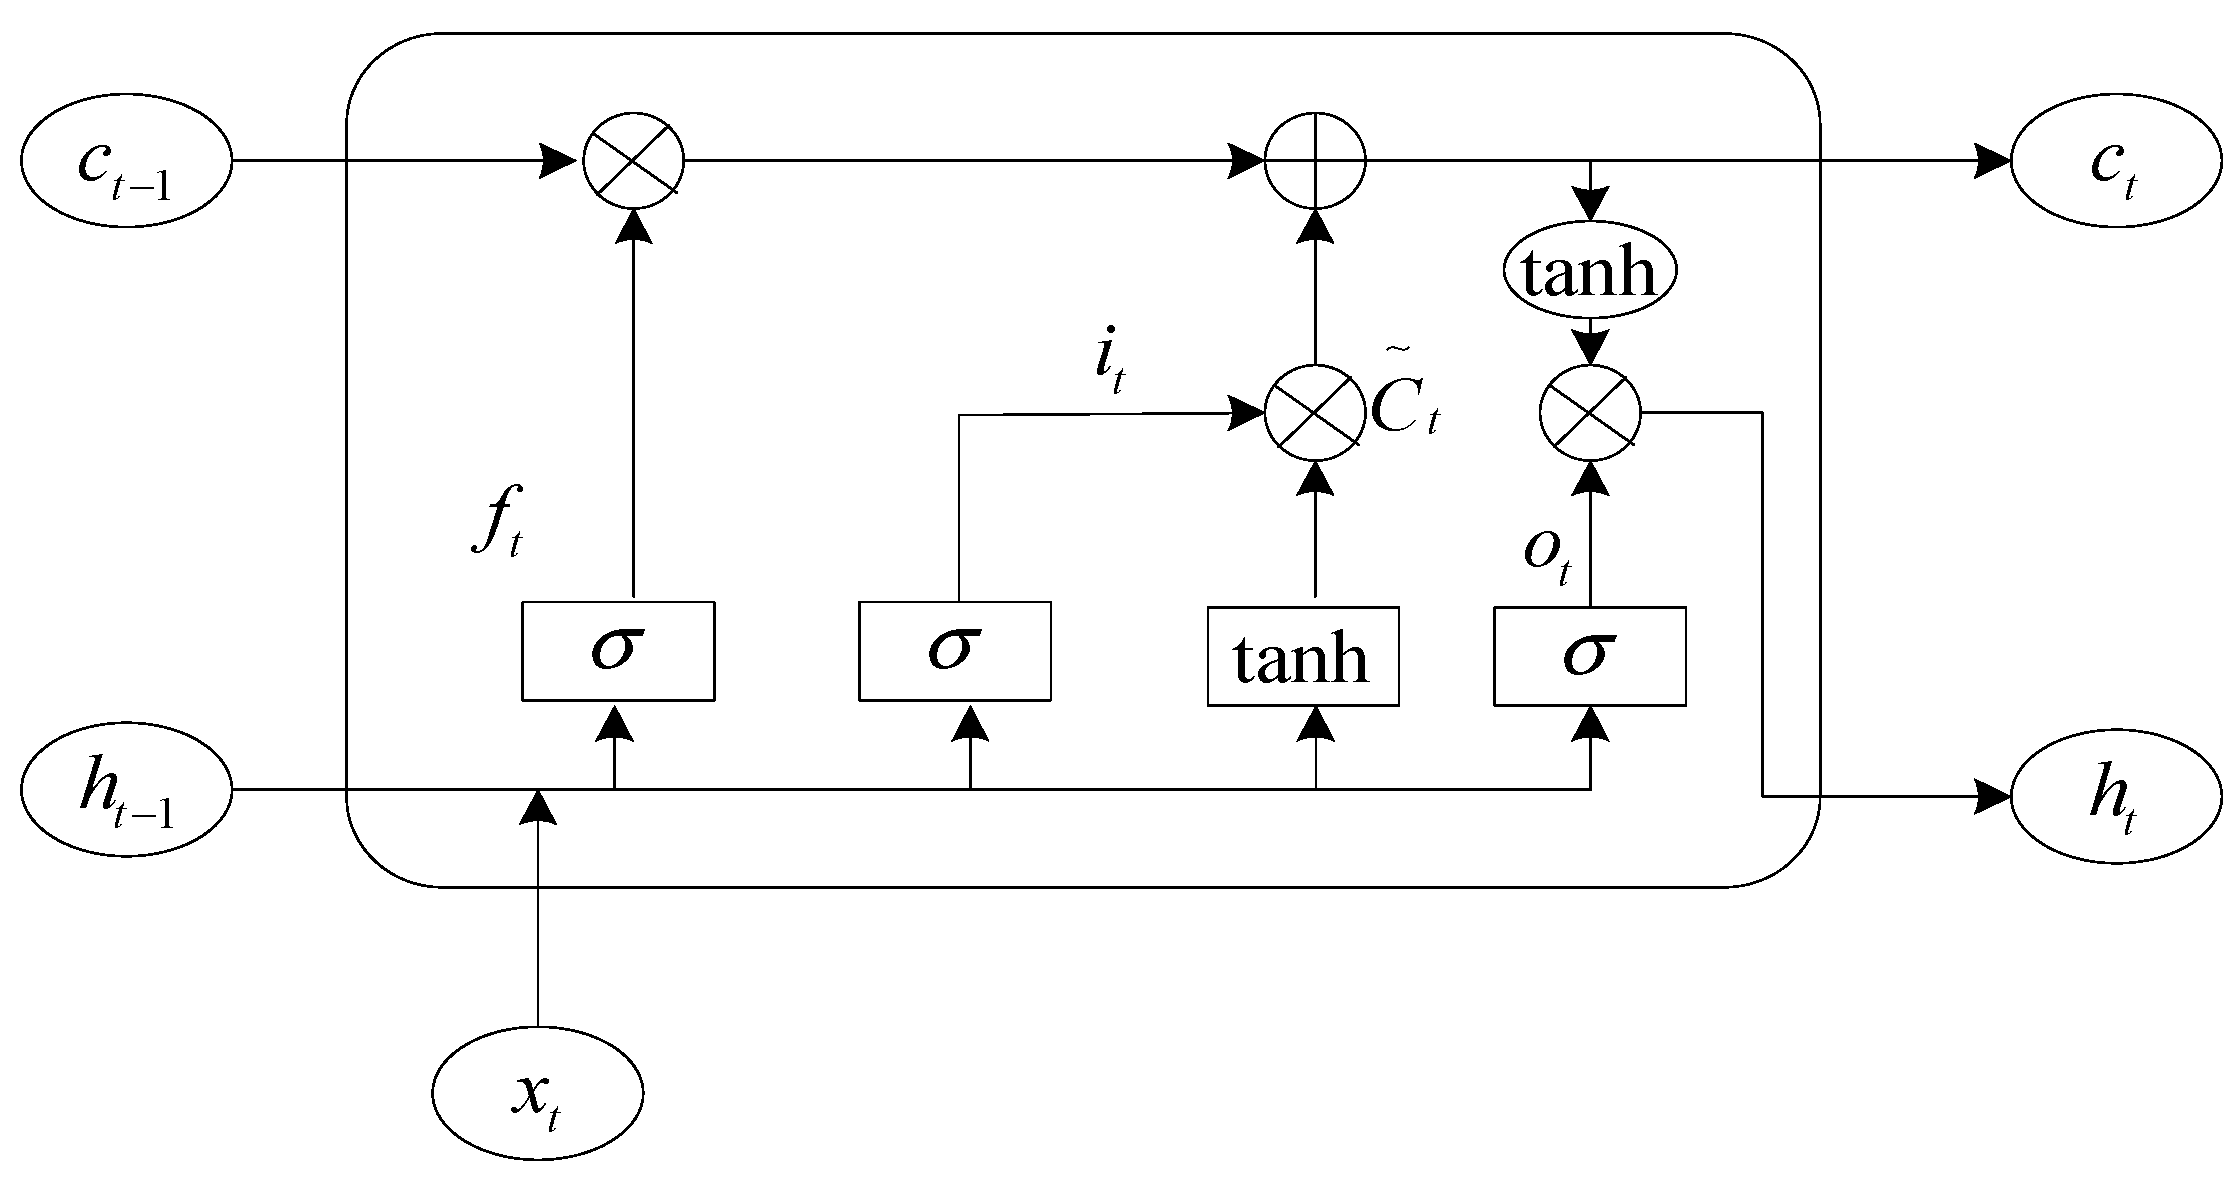
31], including three gating units, namely, oblivion gate, input gate, and output gate, and the structure of the LSTM network unit is shown in
Figure 1.
In the Figure, σ denotes the sigmoid activation function, c denotes the information that needs to be stored for a prolonged time, ht−1 denotes the output information at the previous moment, ht is the output information at the current state, and xt denotes the current input.
In the LSTM neural network, the forgetting gate plays the role of screening information. First of all, the last moment of output information
ht−1 and the current input information
xt are combined into a new input matrix, input to the sigmoid function, and this function will be normalized to the input data between 0 and 1. At this point, the sigmoid function plays the role of a switch, and the data close to 0 “forget” to retain the data close to 1, which is the role of the LSTM forget gate.
In Equation (1), is the weight matrix of the forgetting gate and is the bias of the forgetting gate.
After the tanh function becomes the new candidate vector
, the previous part determines the values to be saved and discarded for the original candidate vector, and the saved values are added to the values saved in the previous state. The corresponding formula is as follows.
In the above equation, is the output of the input matrix after the 2nd sigmoid activation function, and are the weight matrix and bias of the sigmoid function in the input gate, and and are the weight and bias of the tanh function.
Finally, the value obtained by summing the input gates is changed to [−1, 1] by the tanh function, and the value retained by the last sigmoid function is the output value at this moment. The following Equations (4) and (5) are shown.
In the above equation, is the output value of the 3rd sigmoid function, is the final output of the network, and and are the weight matrix and bias of the 3rd sigmoid function.
3. Multi-Strategy Improved Aquila Optimizer
The Aquila optimizer is a current meta-heuristic optimization algorithm proposed by Laith Abualigah et al. in 2021 [
32]. The algorithm builds a mathematical model by simulating four different predation strategies of Aquila, which has the advantages of quick convergence and strong global search ability, but the traditional Aquila optimizer has extra control parameters, ignores the excellent predation ability of individual Aquila, and lacks the mutual transfer of information between individuals, so the phase quantum operator and the flow direction operator are used to improve the
and
stages of the Aquila optimizer. The four phases of the Aquila optimizer and their improvements are described below.
where
is the solution of the next iteration of the first stage
t;
is the optimal solution of the
t-th iteration;
denotes the average of the position of the solution at t iterations; rand denotes the random number between [0 and 1]; t is the number of current iterations;
T is the maximum number of iterations; and
N denotes the total number of samples. Moreover, Dim is the dimension of the problem.
3.1. Vector Operators to Improve the Aquila Optimizer
The formulas associated with the reduced exploration (
) phase of the Aquila optimizer are described below.
where
is the solution of the next iteration of the second stage t; Levy (
D) is the Levy flight distribution function; and
is a random number in the range [1, N] at t iterations. Let
x and
y denote the shape of the helix during the search. The letter s is a constant of 0.01;
μ and
υ are random numbers between 0 and 1;
β has the value of 1.5;
δ is computed by Equation (5);
is a fixed search for the [1, 20] number of cycles;
U is 0.00565;
D1 is an integer between [1 and Dim]; and
ω is 0.005.
In phase , the Aquila optimizer involves many control parameters. Numerous metaheuristics are highly sensitive to subtle tuning of the control parameters, which may cause the algorithm to converge prematurely or get stuck in a local optimal solution. To overcome this problem, the phase operator is introduced in the stage to remove the influence of the control parameters and transform this stage into a non-parametric adaptive control stage, which improves the performance of the Aquila optimizer.
The phase quantity operator [
33] is derived from the theory of phase quantities in mathematics, which reduces or eliminates the control parameters of the optimization algorithm by selecting suitable operator functions through the periodic trigonometric functions sin and cos for the purpose of adaptive, non-parametric optimization. Using the intermittent characteristic of the trigonometric function, all the control parameters of the
phase of the Aquila optimizer are represented by the phase angle
θ, and the role played by the control parameters is represented by the function containing
θ. For this purpose, a one-dimensional phase angle
θi is used to represent each individual in the population, so that the
i-th individual can be represented by a vector of size
and θ
i, i.e.,
.
The resulting phase operators are shown in Equations (15) and (16).
Equation (8) is improved by combining Equations (15) and (16), and the improved equation is shown in Equation (17).
3.2. Flow Direction Operator to Improve the Aquila Optimizer
The formula for the development phase of the expansion is described below:
where
is the solution generated by
at t + 1 iterations; UB and LB are the upper and lower bounds on the solution space, respectively; and the values of α and δ are both 0.1.
Phase
of the Aquila optimizer is improved by using the flow direction operator, which enables information transfer between individuals. By improving the utilization of information between individuals, the optimization discovery capability of the proposed algorithm is greatly improved. The flow direction operator [
34] is derived from the flow direction algorithm proposed by Hojat, which is a physically based algorithm, and the flow direction algorithm (FDA) simulates the movement state and formation process of runoff. The flow moves towards and around the lowest point, which is the optimal value of the objective function. The flow direction algorithm assumes that φ neighbors exist around each water flow and the mathematical expression of its positional relationship is shown in Equation (19).
where
denotes the
j-th location adjacent to
, randn is a random number following a standard normal distribution, and
is the search radius. Equation (19) establishes a search region for each individual in the Aquila optimizer, and the size of the value
determines the size of the search range, within which information can be passed to each other, and the formula for
is shown below.
In the above equation, rand is a uniformly distributed random number,
is a random position generated in the search space,
is the optimal solution of the
t-th iteration in the Aquila optimizer, and
is the current position of the
i-th individual at the
t-th iteration. The formula for W is as follows.
In the FDA algorithm, the flow rate of runoff to an adjacent region is directly related to its slope, and, therefore, the following relation is used to determine the flow rate vector.
where
denotes the slope vector between the current individual and its neighbors, and the slope vector between the
i-th individual and the
j-th neighbor is determined by the following equation.
where
denotes the target value of
and
denotes the target value of
.
The flow operator used in this paper is defined as follows.
The Aquila optimizer suffers from reduced population diversity and tends to get stuck in local optima at later iterations, so the flow direction operator is introduced to improve the
phase of the Aquila optimizer. The flow algorithm allows information transfer between individuals and to each other, which improves information utilization. At the same time, the introduction of nonlinear weights
W also increases the randomness of the algorithm in the late iteration, which further enhances the algorithm’s ability to search and jump out of the local optimum and improves the
stage of the Aquila optimizer, which is also known as Equation (18), as shown in Equation (25).
The formulae for the reduction development stage of the Aquila optimizer are described below.
where
is the solution generated by the fourth search method
in t + 1 iterations; QF is used to balance the quality function of the search strategy;
denotes the various motions of the AO during the hunting period; while
is a linear function indicating the flight slope of the AO used to track the prey.
In summary, this paper adopts the phase operator to improve the stage of the Aquila optimizer and the flow operator to improve the stage, forming a multi-strategy improved Aquila optimizer, which has a faster convergence speed and a stronger anti-interference ability, compared with the traditional Aquila optimizer.
3.3. Time Complexity Analysis
According to reference [
32], the time complexity of the AO algorithm depends on three aspects: population initialization, fitness calculation, and solution update. Assuming the population size is
N, the spatial dimension is
D, and the maximum number of iterations is T, the complexity of the population initialization process can be calculated as
, where
represents the complexity of the solution update process. Therefore, the overall time complexity of the Aquila optimizer (AO) algorithm is
.
In the MIAO algorithm, the phasor operator treats each individual in the population as a one-dimensional phasor that varies randomly within the range as the iterations progress. Therefore, the time complexity of the phasor operator is . Compared to the Aquila optimizer (AO) algorithm, the flow direction operator does not involve the population initialization process. The time complexity of the flow direction operator is . Therefore, the inclusion of the phasor operator and the flow direction operator does not increase the overall time complexity. Thus, the time complexity of MIAO remains .
3.4. Algorithm Performance Testing
To verify the effectiveness of the algorithm proposed in this paper, it is tested with the seagull optimization algorithm (SOA), particle swarm optimization (PSO), sparrow search algorithm (SSA), genetic algorithm (GA), whale optimization algorithm (WOA), and the traditional Aquila optimizer (AO) for performance testing with a uniform setting of the number of populations N = 30, the number of iterations T = 500, and the test dimensionality of 10 dimensions, and the selected test functions are shown in
Table 1,
Table 2 and
Table 3.
To ensure that the experimental results are scientifically sound, nine test functions were chosen to test the performance of these algorithms. The algorithms are written in MatlabR2020a and the experimental environment was equipped with an AMD R7 3.2 GHz CPU sourced from the United States, 8.00 GB RAM, and the Windows11 operating system. Each experiment is run independently for 30 epochs, where F1–F3 are 3 unimodal test functions to test the global exploration capability of the algorithm. F4–F6 are 3 multi-peak test functions to test the exploitation capability of the algorithm. F7–F9 are 3 fixed-dimensional multi-peak test functions to check the exploration capability of the algorithm in a low-dimensional search space.
3.5. Optimized Accuracy Analysis
The MIAO algorithm and SOA, PSO, SSA, AO, GA, and WOA are run independently on the above nine test functions for 30 times, the experimental results are recorded, and the optimal value, average value, and standard deviation of each algorithm are taken as the evaluation indexes, and the test results are shown in
Table 4 below. The values in bold in the table are the optimal results.
As can be seen from
Table 4, the proposed multi-strategy modified Aquila optimizer shows significant improvement in finding the optimal action for the three unimodal test functions F1–F3, and MIAO is robust. Moreover, MIAO is able to find the theoretical optimal value on the two multi-peak test functions F4 and F6, which indicates that MIAO has excellent evasion performance, does not easily get trapped in the local optimal solution, and has strong anti-stagnation performance. In the last three fixed-dimensional multi-peak test functions, MIAO also has the best optimization search performance and can essentially find its theoretical optimum, indicating the superior global search capability of the multi-strategy modified Aquila optimizer. F10–F15 represent six CEC benchmark test functions, which were used to further validate the optimization capability of MIAO. Experimental results also demonstrate that, compared to AO, MIAO exhibits superior optimization performance.
3.6. Convergence Curve Analysis
Figure 2 shows the convergence performance analysis of SOA, PSO, SSA, AO, GA, WOA, and MIAO for 10 dimensions and 500 iterations of the pairwise function optimization procedure. It can be visualized from
Figure 2 that MIAO has the fastest convergence rate and the highest convergence accuracy among the 15 tested functions. This indicates that MIAO has superior low-dimensional spatial exploration ability to the other six algorithms.
3.7. Wilcoxon Rank-Sum Test
The Wilcoxon rank-sum test [
35] is a non-parametric statistical method used to determine whether there are significant differences between two samples. In this study, the Wilcoxon rank-sum test was employed on nine classical benchmark functions to assess whether the MIAO algorithm exhibits significant differences compared to the other six algorithms. Here,
p represents the test result and h indicates the significance judgment result. When
p < 0.05,
h = 1 signifies that the MIAO algorithm is significantly stronger than the other algorithms. When
p > 0.05,
h = 0 indicates that the MIAO algorithm is significantly weaker than the other algorithms. When
p is displayed as N/A, it means that the significance test cannot be performed, suggesting that the significance of the MIAO algorithm may be equivalent to that of the other algorithms. The results are shown in
Table 5.
3.8. Ablation Experiment
To further validate the effectiveness of the proposed improvements and investigate the impact of each enhancement strategy on the algorithm’s optimization performance, this study conducts comparative experiments on nine classical benchmark functions. The algorithms compared include the original Aquila optimizer (AO), the AO enhanced with the phasor operator (PAO), the AO enhanced with the flow direction operator (FAO), and the AO improved with multiple strategies (MIAO). The experimental results are shown in
Table 6.
As shown in
Table 6, the phasor operator brings a substantial improvement to the optimization capability of the AO. The flow operator enhances the solution diversity of the algorithm in late iterations, also playing a positive role in improving the AO. The convergence curves of these four algorithms AO, PAO, FAO, and MIAO are presented in
Figure 3.


