Abstract
Applying the acoustic orbital angular momentum (AOAM) wave for underwater imaging can yield richer differential target echo information, a consequence of its spiral wavefront phase and multiple mutually orthogonal modes. In broadband AOAM wave imaging, the resolution of conventional beamforming is very low. Although sub-band processing can improve resolution, it cannot handle coherent signal sources. To further enhance the resolution of broadband AOAM wave underwater imaging and address the imaging issue of coherent signals in practice, this paper proposed a modal-domain focusing beamforming method. This paper initially established the echo signal model of broadband AOAM waves based on a uniform circular array. This was followed by the derivation of the beam output signal model. Finally, a new modal-domain focusing transformation matrix was constructed. Numerical results show that the proposed method reduces the background level of the beam pattern to −86dB in simple coherent target source imaging, compared with −40dB for sub-band methods and −70dB for plane wave focusing processing. Furthermore, under different noise conditions, the proposed method achieves high-resolution imaging of complex structures and good imaging of details.
1. Introduction
A vortex is a common natural phenomenon in life, including those observed in wind and water. There is a kind of sound wave that also has a vortex state. In this state, the phase of the sound wave is spiral and there is an energy singularity on its propagation axis [1]. One article [2] found that this specific type of sound wave contains orbital angular momentum (OAM); naturally, this paper calls it an acoustic orbital angular momentum (AOAM) wave or acoustic vortex (AV) wave. The spatial phase of the AOAM wave is modulated by its characteristic topological charge (also called mode) and azimuth angle , mathematically expressed as , where represents the topological charge.
Electromagnetic and light waves that contain orbital angular momentum can carry more target echo information due to their modal dimension. In recent years, they have become a research hotspot in the field of radar application, from basic imaging [3] to sparse Bayesian imaging [4] and to 3D imaging [5,6], as well as optical communication [7] and optical imaging [8], etc. In the field of acoustics, the AOAM wave has been applied in biomedical ultrasound therapy [9]. In the field of underwater acoustics, excitingly, underwater navigation [10] and underwater communication [11] based on the AOAM wave have become new research directions, and judging from the achievements of these studies, the AOAM wave can indeed achieve better application effects than the traditional plane wave. In actuality, research on the AOAM wave in underwater acoustics focuses more on how to generate ideal AOAM waves, as detailed in articles [11,12]. Inspired by the characteristics of the AOAM wave and the above research, this paper aims to apply the AOAM wave for underwater imaging.
Prior to this, the AOAM wave has been employed for underwater imaging [13,14], and a conventional beamforming method, named mode matching beamforming (MMBF), and a high-resolution imaging method based on orthogonal matching pursuit (OMP) have been proposed. It has been proved in multiple aspects, including numerical simulation and real underwater target signal processing, that the AOAM wave can achieve higher-resolution imaging effects than the plane wave. At the time, however, imaging research was based on the narrowband AOAM wave, with only a little bit of analysis of the broadband AOAM wave. Despite this, the MMBF method achieved broadband AOAM wave imaging with good stability but limited resolution. Therefore, this paper aims to further improve the underwater imaging resolution of the broadband AOAM wave.
In 1998, the Signal Processing Society of the IEEE’s Underwater Acoustic Society Processing Technology Branch organized for experts to write a report entitled “The Past, Present and Future of Underwater Acoustic Signal Processing”. The report stated that active and passive sonar tend to develop in the direction of broadband and low frequency. In underwater imaging, a broadband signal effectively solves the speckle interference and grating lobe problems of a narrowband signal [15] and can also enhance imaging stability in noisy environments. In 2016, Chi et al. proposed the nonuniform fast Fourier transform (NUFFT) imaging method, which achieved high-resolution imaging of a broadband signal [16]. Broadband signal beamforming methods are generally classified into the incoherent signal subspace method (ISSM) [17,18] and the coherent signal subspace method (CSSM) [19,20]. The ISSM decomposes the broadband signal into multiple sub-band components in the frequency domain, applies the narrowband signal beamforming method to each sub-band, and finally combines all sub-band results to achieve broadband signal beamforming.
Beamforming is a key technology for achieving underwater imaging [21]. In the 1980s, scholars proposed numerous classic high-resolution imaging methods based on signal structure and mathematical application with the aim of improving the spatial resolution of target recognition, which once solved the dilemma of the limited resolution of conventional beamforming. These methods include the multiple signal classification (MUSIC) [22] algorithm, the minimum variance distortionless response (MVDR) [23] algorithm, the estimation of signal parameters via rotational invariance techniques (ESPRIT) [24] algorithm, and their derivative algorithms [25]. While these subspace techniques achieve ideal resolution, they are unable to resolve coherent signal sources.
The most direct way to improve the resolution of the broadband signal is to combine the aforementioned subspace techniques in each sub-band processing process, which is why this method is called the ISSM. However, as the ISSM is only a simple average of narrowband processing outcomes, it remains a narrowband processing method and therefore cannot overcome the shortcomings of the subspace method, that is, the inability to resolve coherent signal sources.
In underwater imaging, the echo signals received by the sonar array have coherent characteristics as a result of the reflection of the seabed and the short-distance multipath propagation of acoustic signals. This makes broadband ISSMs that mainly apply classical signal subspace methods unfeasible. Instead, CSSMs with the focusing transform as the core technology have emerged [26]. The signal subspaces of each frequency component are focused on the reference frequency through the focusing matrix. Subsequently, frequency smoothing is performed to reduce the correlation of the covariance matrix, thereby ensuring that the dimension of the signal subspace is equal to the number of signal sources, which allows for the identification of coherent signals. This is why the method is called the coherent signal processing method (CSSM).
Furthermore, according to the principle of narrowband beamforming, the signal subspace is composed of direction vectors, which are a function of spatial angle and frequency. In a narrowband signal, the direction vector remains constant with frequency, and there is only one signal subspace containing a single target’s direction information. However, the broadband signal contains rich frequency components, which results in a non-unique signal subspace. Therefore, the target direction information contained in it is not singular, and frequency expansion occurs. In this case, the signal subspace of each frequency component must be adjusted to the reference frequency using a focusing matrix, and then beamforming is implemented using the subspace method of the narrowband signal.
In summary, in order to improve the resolution of underwater imaging based on the broadband AOAM wave, we can combine classic signal subspace methods, such as MUSIC. In this process, it is necessary to solve the frequency subspace expansion problem of the broadband signal through focusing processing, and solve the problem of coherent sources through multi-sub-band smoothing processing. This is the core process of the broadband AOAM wave CSSM algorithm. The focusing matrix is the key component in CSSM processing, as it directly influences the efficacy of target imaging. In the plane wave, firstly, the focusing matrix is the dimension of the array, and secondly, its diversity comes from the difference between the signals received by the array. In the plane wave, the difference between the signals received by the array is only the delay difference caused by the spatial position of the array element and the target. However, in the case of the AOAM wave, the focusing matrix is the modal dimension, and its diversity comes from signals of different modes. From the physical properties of the AOAM wave, it can be observed that there are not only phase differences but also amplitude differences between signals of different modes. It can be concluded that the focusing matrix obtained by the broadband AOAM wave will exhibit a greater degree of complexity.
The main contributions of this paper are as follows: Firstly, this paper proposes the use of broadband AOAM waves for underwater imaging. Compared with traditional broadband plane wave imaging, this paper provides a new idea for achieving underwater high-resolution imaging. Secondly, a modal-domain focusing beamforming method is proposed, which makes full use of the physical properties of AOAM waves to enhance imaging resolution. Thirdly, the challenge posed by the sub-band method’s inability to image underwater coherent sound sources is addressed. Finally, this paper provides value as a reference for future applications of broadband AOAM waves in underwater imaging engineering.
The remainder of this paper is organized as follows: Section 2 establishes the relevant signal models of the broadband AOAM wave, including the transmitting signal model, the receiving signal model, and the conventional beam output signal model of the broadband AOAM wave. These are the basis for the core technology proposed in this paper. Section 3 derives a new modal-domain focusing transformation matrix and proposes a modal-domain focusing beamforming method. Section 4 presents simulation experiments. The conclusion of this paper is given in Section 5.
2. Signal and System Models
2.1. AOAM Wave Emission Signal Model
In the study of the AOAM wave, using a phased uniform circular array (UCA) to generate AOAM waves is a simple and efficient method [2,12]. Figure 1 displays a UCA in the coordinate system. As shown in Figure 1, a UCA composed of sound transducers is placed on the plane, the center of the circle is the coordinate origin, is radius, and denotes the azimuthal position. According to the generation principle of the AOAM wave, through the modulation of the phase-shifted sound signal corresponding to each sound transducer, an AOAM wave of a specified mode can be generated.
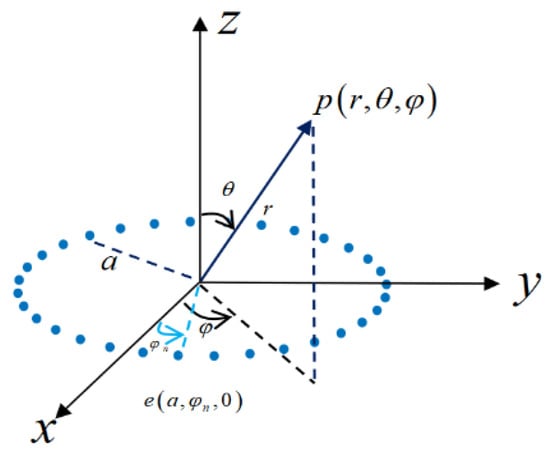
Figure 1.
Uniform circular array coordinates.
The signal emitted by the sound transducer is
where is the modulation phase of each sound transducer. is the sound wave amplitude, and represents the sound signal without mode modulation.
For an underwater sound pressure detection point in the far field, the output sound pressure is the sum of the sound signals emitted by all sound transducers; that is,
where is the wavelength, is the detection point vector, and is the position vector of the sound transducer.
Under far-field conditions, and represent the amplitude and phase approximation, respectively. Equation (2) can be rewritten as follows:
Here, is the wavenumber, and represents the unit direction vector of the detection point.
In the spherical coordinate system, it is
Put (4) into (3) to obtain
When there are sufficient sound transducers, the summation in (5) can be replaced by integration [3]. Let replace , and employ variable substitution; using , we obtain
Put (6) into (5) and simplify and normalize it to obtain
Equation (7) represents the signal model of the AOAM wave generated by the UCA, where denotes the imaginary unit, is the -order Bessel function of the first kind. Equation (7) shows that modulates the spiral phase of AOAM waves, which represents the dual relationship between mode and spatial azimuth angle . modulates the amplitude of the AOAM waves, which represents the dual relationship between mode and spatial elevation angle . It is evident that AOAM waves of different modes display varying wavefront phase distributions, distinct mainlobe directions, and varying amplitudes of the sound wave. This indicates that the echo signal carries more information, especially in active sonar, which facilitates the acquisition of a higher matching gain.
2.2. Broadband AOAM Wave Signal Model
Based on the generation principle introduced above, when a linear frequency modulation (LFM) signal is emitted by the sound transducer, a broadband AOAM wave is obtained [27].
Now, the signal emitted by the sound transducer is
where is the LFM slope, and signifies the low frequency of the signal.
Similarly, the sound pressure output at the underwater spatial sound pressure detection point is
where is the time delay caused by the distance from the sound transducer to the detection point.
In the rectangular coordinate system, we know
where denotes the underwater sound velocity.
Put (10) into (9) to obtain
where .
As the polynomial can be omitted, (12) is obtained:
where . Each row in the summation is a product term.
Similarly, the summation term in (12) is simplified in the same way as (6), and we obtain
Upon substituting (13) into (12), the output sound pressure signal of the sound pressure detection point is obtained, which is
Equation (14) represents the signal model of the broadband AOAM wave. Equation (14) demonstrates that the amplitude of the broadband AOAM wave continues to be modulated by the Bessel function . However, in contrast to the narrowband AOAM wave, the frequency variable is also associated with the elevation angle via the Bessel function, indicating the presence of additional information in the frequency dimension. Similarly, the phase of the broadband AOAM wave is modulated by , and the azimuth angle is related to the mode and frequency, suggesting the existence of further information in the frequency dimension. The broadband AOAM wave will further increase the diversity of signal matching compared with narrowband, thereby achieving more processing gain in imaging.
2.3. Broadband AOAM Wave Echo Signal Model
When the transmitted sound wave encounters an object during propagation, it will be reflected, and then the echo signal will be received by the sonar array. Let be the target point underwater, and assume that all the array elements in the UCA structure are utilized to receive the target echo signal, as illustrated in Figure 1. Subsequently, the echo signal received by the array element is
where , , refers to the target scattering coefficient, and is the noise.
When there are targets in the underwater imaging scene, the echo signal received by the array element is
Equation (16) is the echo signal model of the broadband AOAM wave. As illustrated in (16), the target orientation parameters are not solely represented by the direction vector of the sonar array; they are also reflected in the mode vector of the AOAM wave. It can be observed that two information matches can be performed when searching for target information: one is conventional matching based on the array structure, and the other is modal-domain matching based on the AOAM wave signal. This is the mechanism of our implementation of the MMBF method [14]. The paper also provided imaging results based on the MMBF method for effective comparison with the technology proposed in this paper.
In broadband signal processing, whether it be conventional beamforming or signal subspace processing, we hope to utilize the processing gain brought by the frequency itself. Therefore, it is critical to obtain data measured in frequency. It is known that the broadband AOAM wave contains a modal dimension. If signal processing is implemented on the initial array-received data, which are structured as mode–array–frequency, the data structure will be very complex and there will be no suitable matching vector. Therefore, this paper established the focusing processing process of the broadband AOAM wave on the basis of the conventional beamforming of received data. In other words, focusing processing is conducted in the modal domain. Not only does this address the problem of complex received-data structure, but also, if the received data are transformed into the modal domain for processing, they can theoretically better reflect the advantages brought by the AOAM wave.
The conventional beam output signal model of the broadband AOAM wave is established below.
2.4. Broadband AOAM Wave Beam Output Signal Model
In conventional beamforming, compensation is first applied to the time delay or phase shift caused by the array element and target position in the echo signal, before it is superimposed and output. The steering vector of the UCA structure can be expressed as ; thus, the beamforming output signal model at any spatial orientation in mode one is
where represents the broadband AOAM wave reflected signal with mode one.
By way of simplification, the complete broadband AOAM wave conventional beam output signal model is finally obtained. It is
where the term is a zero-order Bessel function, which is also, in theory, the beamforming signal model of the uniform circular array.
In traditional broadband signal processing, the time-domain received signal is generally subjected to a -point DFT to obtain -sub-band frequency-domain data. The time-domain beam output signal represented by (18) is also subjected to DFT at this time. Subsequently, (18) is rewritten as a frequency-domain vector matrix multiplication, resulting in the following:
where is the -dimensional modal-domain measurement vector of the sub-band. , and is the number of modes. is the -dimensional modal-domain signal vector, and is the -dimensional steering vector matrix, that is, the modal flow pattern. denotes the -dimensional steering vector. is the wavenumber at the corresponding frequency. is the received noise vector.
The analysis of (19) demonstrates that in the broadband AOAM wave modal-domain received signal, different sub-band components correspond to distinct modal flow patterns, indicating the presence of frequency extension. In order to apply classical high-resolution methods in narrowband signals to broadband signals to improve imaging resolution, it is first necessary to address the problem of frequency expansion. On the other hand, some high-resolution methods are unable to image coherent sources. The focusing method is used to solve the frequency expansion problem, while the smoothing method is used to solve the coherence problem. In fact, the advantage of multiple sub-bands of the broadband signal provides favorable support for the signal subspace method to solve the problem of coherent sources in imaging. That is, we can perform frequency smoothing to reduce the correlation in the covariance matrix. Therefore, this paper applies the focusing processing idea to the imaging of the broadband AOAM wave, which has important research significance.
3. Proposed Method
This section is dedicated to the establishment of the new method. For detailed explanation, it starts by giving the form of the modal-domain focusing matrix, and then extends to proposing the modal-domain focusing beamforming method based on the broadband AOAM wave.
The CSSM uses a focusing matrix to map the signal subspaces of different frequencies within a broadband signal to the same reference frequency. Subsequently, the classical signal subspace method in narrowband processing is used to achieve high-resolution imaging of the broadband signal.
In the focusing process, represents the modal-domain focusing matrix. Consequently, the focusing process will satisfy the following transformation relation:
where and are the AOAM wave steering vector matrix of the reference frequency and the sub-band, respectively.
The focusing matrix is known to be the core of the CSSM processing of broadband signals, so it is crucial to compute the ideal focusing matrix. In (20), in order to maintain the output SNR of the sonar array before and after the focusing matrix is transformed, the optimal focusing matrix is determined based on the minimum error criterion:
where are the pre-estimated angles. It is known that the AOAM wave is multimodal in nature, so the predicted angles can be roughly obtained by one regular beamforming process. This is one of the advantages of the AOAM wave over the plane wave. is the -dimensional identity matrix. is the Frobenius norm of the matrix.
The focusing matrix adopts the rotation signal subspace method based on the unitary matrix; solving the above (21) can yield the focusing matrix:
where and are the left and right singular values of , respectively. The method of calculating the modal-domain focusing transition matrix is known as the rotational signal subplace (RSS) [28,29]. The RSS is simple in structure and stable in performance.
The modal-domain focused measurement vector is
The covariance matrix of the modal-domain focused data is further found to be
where is the noise power.
The frequency-averaged covariance matrix is
At last, beamforming is completed for the broadband AOAM wave signal after focusing in accordance with the classical signal subspace method. The eigenvalue decomposition of the covariance matrix is executed, leading to the acquisition of the noise subspace . The beamforming output is
Here, is the modal-domain spatial steering vector.
A flowchart of the modal-domain focusing beamforming method proposed in this paper is shown in Table 1.

Table 1.
Flowchart of the proposed method.
4. Simulation Results
This section presents the simulation experiment of this paper. Firstly, based on the signal models established in Section 2.1, the results of the spatial sound field distribution of the AOAM wave are given, including the circular surface sound pressure, phase, and the spatial phases extracted from different circular paths during the propagation of the sound wave. The experiment calculates the effective imaging angle of the AOAM wave by observing the range of the spatial purer phase distribution to provide a physical basis for the selection of imaging parameters for complex targets. Then, in order to verify the effectiveness of the method proposed in this paper, imaging experiments of simple coherent target sources and complex object structures under different noise conditions based on modal-domain focusing beamforming processing are presented in this part, respectively.
4.1. Sound Field Distribution of the AOAM Wave
Given that this paper is an imaging study of the broadband AOAM wave, the frequency was set as the variable to observe the sound field distribution. For instance, we fixed the array radius at 0.25 m, the array element number at 100, and the imaging distance at 50 m, and observed the sound field distribution of different frequencies under such conditions to determine the maximum imaging range. The frequencies were 100 kHz, 150 kHz, and 200 kHz, respectively. The sound field detection process established in the Cartesian coordinate system during the experiment is shown in Figure 2.
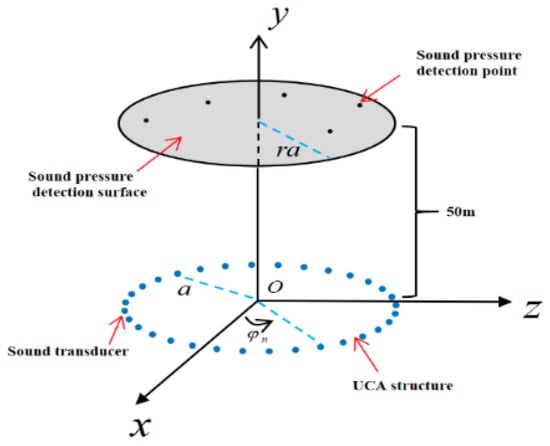
Figure 2.
Schematic diagram of the AOAM wave sound field detection process.
As illustrated in Figure 2, a UCA structure for generating AOAM waves is placed in the plane of the Cartesian coordinate system, with sound transducers distributed uniformly across it. A horizontal sound field detection surface, defined by the radius and spatial azimuth angle at 50 m on the y-axis, was observed to have a range of from 0 to 30 m and a range of from 0 to 360°. In the experiment, the detection surface was initially discretized into 361 × 361 sound pressure detection points. Subsequently, the received AOAM sound wave data for each sound pressure detection point were calculated based on the spatial location relationship. Ultimately, the sound field distribution of the AOAM wave was obtained through signal processing.
The AOAM wave phase on different circular paths was derived from the sound signal data extracted at a fixed radius on the sound pressure detection surface across the full range of the omni-directional angle , where i = 1, 2, 3, 4. The effective imaging range of the AOAM wave was determined by observing the spiral phase distribution on different circular paths. The mode was set to two. Figure 3 shows the results.
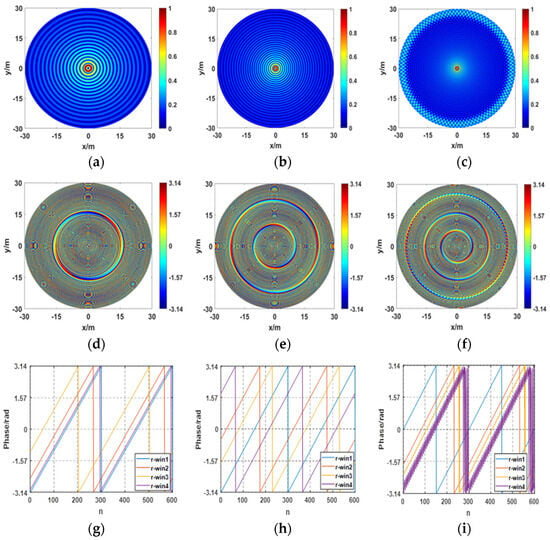
Figure 3.
Results of sound pressure distribution (a–c), phase distribution (d–f) and phase distribution on circular paths (g–i) of the AOAM wave.
Figure 3 shows the sound field distribution of the AOAM wave at varying frequencies. The first row depicts the spatial sound pressure distribution, the second row represents the spatial phase distribution, and the third row is the phase distribution extracted from the circular paths. The sound pressure distributions demonstrate that as the frequency increases, the maximum energy distribution circle of the AOAM wave gets closer to the propagation axis, as shown in Figure 3a–c. At the maximum frequency, a sound pressure difference appears on the edge of the sound pressure distribution, as displayed in Figure 3c.
From the perspective of spatial phase distribution, as illustrated in Figure 3d–f, an increase in frequency results in a decrease in the vortex phase radius of the AOAM wave, and obvious phase mutation rings gradually appear. A comparison shows that the three phase mutation rings in Figure 3f are clearly different. The two inner rings seem to maintain a normal spatial phase modal relationship, while the outermost ring seems to have undergone a fundamental change. To further observe this phenomenon, we decided to extract the phase on the targeted circular path. The first radius (blue line in Figure 3g–i) is a randomly selected position close to the center of the detection surface, the second radius (red line) is a position half the size of the detection radius, and the third and fourth radii (yellow and purple, respectively) are two positions spanning the outermost ring.
As illustrated in Figure 3g, the phase distributions of the AOAM wave extracted on the three circular paths correspond to the theoretical relationship between the mode and the spatial azimuth under the current frequency condition. In this experiment, the mode was set to two, so the spiral phase distribution would change twice from 0 to . The results in Figure 3h show that the phases extracted on the three circular paths also satisfy the theoretical relationship. Figure 3g,h illustrate that the AOAM wave in the entire sound field is ideal, which means that in imaging, the entire sound field can be used as the imaging range. Figure 3i shows that under the current frequency condition, the phases on the two circular paths near the center of the detection surface still maintain the theoretical relationship. However, the phase distribution on the outermost circular path no longer satisfies the theoretical relationship, and the phase curve on the circular path jitters. The authors believe that serious phase interference may have occurred.
Based on the size of the third circular path in Figure 3i, we can conclude that at a signal frequency of 200 kHz, the effective imaging radius of the AOAM wave is approximately 23.50 m, with a corresponding spatial effective imaging range of −25.17° to 25.17°. In the subsequent imaging experiment, reasonable imaging parameters were set based on this conclusion to ensure the rationality and physical significance of the experimental process.
4.2. Using AOAM Wave Modal-Domain Focusing Beamforming for Single Target Source Imaging
This section focuses on simple target imaging. Two close coherent target sources were designed in the experiment. The conventional MMBF processing method based on the AOAM wave, the conventional sub-band processing method based on the AOAM wave, the focusing beamforming method based on the plane wave, and the modal-domain focusing beamforming method based on the AOAM wave, that is, the method proposed in this paper, were employed, respectively. The coherent target sources were imaged at the same time by the above methods, and the high-resolution imaging advantage of the proposed method was compared to these methods based on multiple aspects. The positions of the two targets located by the coordinate system in article [30] were and , respectively.
For the sake of simplicity in this paper’s structure, the imaging scenes of various simulation experiments are organized in Figure 4. The “Experiment targets” in Figure 4 refer to the target sources in this section. The key parameters used in the experiment are shown in Table 2. According to the content of Section 4.1, an imaging range of −15–15° for horizontal and vertical angles was utilized in this paper, which falls within the effective imaging range. In particular, the spherical coordinate system on which the output image of the target object is based is not intuitive enough; thus, we changed to the coordinate system in article [30] in the imaging experiments, which can more intuitively display the structure of the target objects. It is important to note that the coordinate system will not affect the imaging effects.
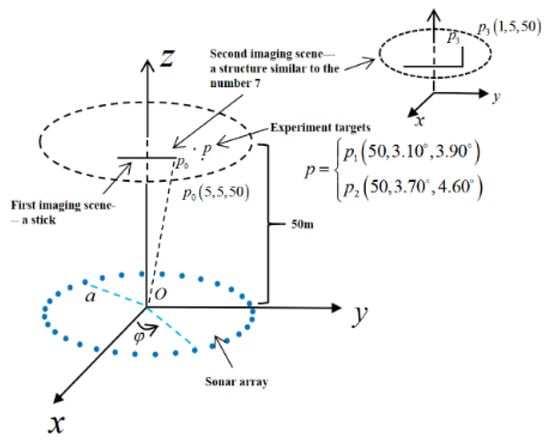
Figure 4.
Schematic diagram of the imaging scene coordinates of simple targets and complex target structures.

Table 2.
Key parameters in the simulations.
In the simple target point imaging experiment, in order to fully demonstrate the high-resolution capability of the AOAM wave modal-domain focusing beamforming method, this section classifies the results of coherent signal source imaging based on conventional and signal subspace methods. That is, after the focusing processing of the received signal, the conventional processing and the signal subspace method were used to image the targets, respectively.
First, a group of imaging results classified as focusing plus conventional processing methods is presented.
4.2.1. Imaging Results Under the Classification of Focusing Plus Conventional Processing Methods
Figure 5a is a beam pattern based on the MMBF processing of the broadband AOAM wave. As illustrated in the figure, there are two obvious bright spots—these are the mainlobes in the beam pattern, and the spatial positions corresponding to these two bright spots in the beam pattern are the spatial positions of the target sources assumed in the experiment. At the same time, the results also show that the first largest bright spots near the mainlobes—these are the sidelobes in the beam pattern—and the energy of these bright spots are small and low, which means that interference with the mainlobes is low. Finally, it can be observed that the energy in other directions away from the mainlobes—these are the backgrounds in the beam pattern—has become very low; that is, the background level can reach below −20 dB. Therefore, this processing method achieves high-resolution imaging of the target sources. Figure 5b depicts the beam pattern of classical sub-band processing based on the broadband AOAM wave. The results show that clear imaging of the target sources is also achieved at this time. Figure 5c is the imaging beam pattern based on the focusing plus conventional processing of the broadband plane wave. The results show that although there are obvious mainlobes in the figure, the two target sources cannot be distinguished at this time, and the sidelobe level of the current beam pattern is relatively high, reaching −3.60 dB, and the background level is also high, about −14 dB. It can be seen that the resolution is very low. Figure 5d is an imaging beam pattern based on the modal-domain focusing plus conventional processing of the broadband AOAM wave. The results show that accurate imaging of the two target sources is achieved at this time. Obviously, through a comparison of Figure 5c with Figure 5d, it is known that the sidelobe and background levels of (d) are reduced by 6.7 dB and 12 dB, respectively. It can be concluded that under the same method, the imaging results based on the AOAM wave have higher resolution than those based on the plane wave. This conclusion can be verified in a comparison of Figure 5a,c, and Figure 5b,c in this experiment. Needless to say, the unique modal advantages of the AOAM wave provide more processing gain in imaging.
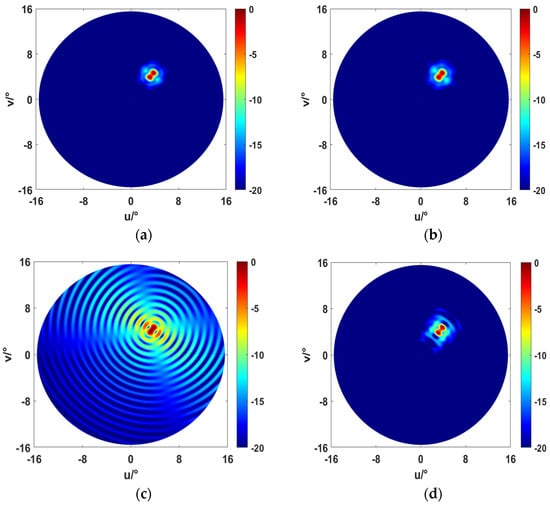
Figure 5.
Imaging results. (a) Beam pattern for AOAM wave MMBF imaging. (b) Beam pattern for AOAM wave sub-band conventional imaging. (c) Beam pattern for plane wave signal focusing processing plus conventional imaging. (d) Beam pattern for AOAM wave signal modal-domain focusing processing plus conventional imaging (method in this paper).
In this experiment, Figure 5d is the implementation result of the method proposed in this paper. Figure 5a–c are the outcomes obtained under different methods and signals, which are all compared with (d) based on different aspects. However, the current method is focusing plus conventional processing; it cannot show the characteristics of the method in this paper. Consequently, the imaging effects in Figure 5a,b are almost the same as those in Figure 5d. In fact, when the AOAM wave target echo signal is focused and then the conventional processing method is utilized, it essentially degenerates to the results of Figure 5a,b. For this reason, this paper further designed imaging simulations of the focusing processing plus signal subspace processing method, as shown in Figure 6. When taking the experimental results of Figure 5 and Figure 6 into consideration equally, the advantages of the method proposed in this paper will be more clearly reflected.
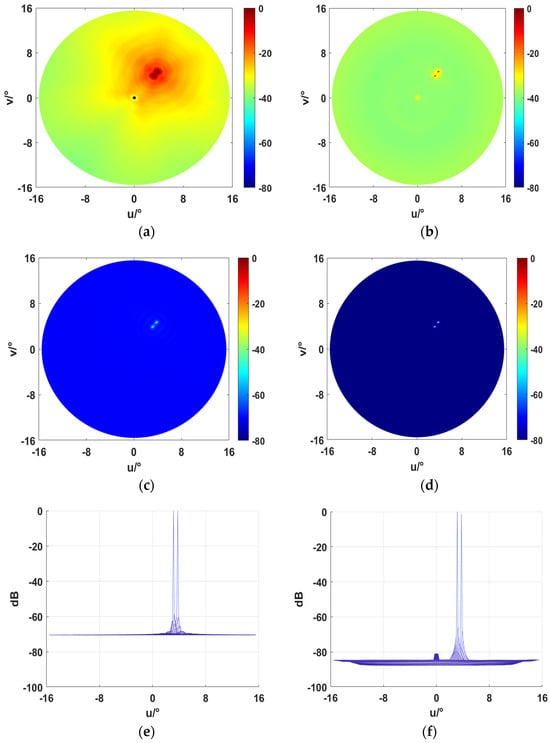
Figure 6.
Imaging results. (a) Beam pattern for AOAM wave MMBF imaging. (b) Beam pattern for AOAM wave sub-band signal subspace method imaging. (c) Beam pattern for plane wave signal focusing processing plus signal subspace method imaging. (d) Beam pattern for AOAM wave signal modal-domain focusing processing plus signal subspace method high-resolution imaging (method in this paper). Cross-sectional views of (c,d): (e) Horizontal angle section for plane wave. (f) Horizontal angle section for AOAM wave with lower background level.
Next, a group of imaging results classified as signal subspace methods is presented.
4.2.2. Imaging Results Under the Classification of Focusing Plus Signal Subspace Processing Methods
The beam pattern in Figure 6a is the same as that in Figure 5a, which shows the imaging results based on the MMBF processing of the broadband AOAM wave, that is, the conventional matching method. Figure 6a shows that the image resolution is very low at this time, and only the two target sources can be vaguely observed. In addition, the sidelobes in the beam pattern are very high, indicating that interference from non-target directions is very high. The current experiment only involves two simple targets, which cannot be distinguished by this method. It is not difficult to imagine that when imaging scenes containing complex target structures, the imaging effect of this method will be greatly reduced due to the wider mainlobes and increased sidelobes, and imaging failure may even occur.
As illustrated in Figure 6d,f, however, the modal-domain focusing beamforming method proposed in this paper achieves ultra-clear imaging of these two target points, with a very narrow mainlobe, almost no sidelobe interference, and a background level of −86 dB. It can be concluded that the method proposed in this paper greatly improves imaging resolution compared with MMBF.
Figure 6b shows that two independent mainlobes are present in the beam pattern. However, compared with Figure 6d, the authors found that the mainlobes in (b) are wider and there are sidelobe interferences near the mainlobes. On the other hand, the background level in (b) is around −40 dB at this time, while the background level of (d) reaches −86 dB. Obviously, the difference between the two is also very large.
Figure 6c shows the imaging results of focusing beamforming based on the broadband plane wave, and the results show that high-resolution imaging of two target sources is achieved at this time. Figure 6e,f correspond to the cross-sectional views of Figure 6c,d in the horizontal azimuth of space, respectively, in order to more intuitively compare the imaging effects of the two. As shown in Figure 6e, the beam pattern background level of the plane wave is approximately −70 dB, while the background level of the AOAM wave reaches around −86 dB. The results of Figure 6c–f demonstrate that the imaging resolution based on the broadband AOAM wave is higher than that based on the traditional broadband plane wave. The authors calculated that the background level is reduced by about 16 dB. This shows that the spatial diversity of AOAM waves in the modal domain contributes to a resolution gain in imaging.
In this Section 4.2, as our purpose was to fully demonstrate the effectiveness of the method proposed in this paper, we used different methods and signals to image the same set of target sources. The distinction between (a) and (d), and (b) and (d), in Figure 5 and Figure 6, respectively, pertains to the imaging techniques. The results illustrate that the modal-domain focusing beamforming method enhances the imaging resolution beyond that of the conventional processing method. The difference between (c) and (d) in Figure 5 and Figure 6 lies in the sound wave signal utilized, which shows that the AOAM wave can achieve higher imaging resolution than plane waves in underwater imaging.
4.3. Using AOAM Wave Modal-Domain Focusing Beamforming for Complex Structure Imaging
In order to better resemble a real imaging scene, complex target structures are specially designed in this section to examine the imaging performance of the method proposed in this paper. Two sets of complex targets were simulated in the experiment, namely, a single stick structure and a number “7” structure. The length of the stick structure was 10 m, and the long side of the number “7” target structure was also 10 m, while the short side was 5 m. In the experiment, the stick structure was discretized into 501 target points, and random amplitude variables were applied to the received AOAM wave signals to represent the roughness of the structure. The imaging distance was 50 m. The above structural dimensions were also given based on the conclusions in Section 4.1. Figure 4 presents a schematic diagram of the coordinate system of the complex target imaging scene. As shown in Figure 4, “First imaging scene—a stick” indicates the single stick structure in this section, and “Second imaging scene—a structure similar to the number 7” indicates the number “7” structure in this section. Due to the spatial position of this number structure slightly overlapping with the spatial position of the stick, a thumbnail diagram is given in the upper right corner of Figure 4.
Considering the impact of noise on imaging in real environments, this section specifically examined imaging results under SNR conditions of 20 dB and 10 dB. The experiments in Section 4.3.1 and Section 4.3.2 are based on the stick structure and fully demonstrate the imaging results of various methods in Section 4.2. The experiment in Section 4.3.3 presents the imaging results of the digital “7” structure under varying noise levels.
4.3.1. Imaging Results When SNR = 20 dB
Figure 7a shows the imaging results based on the broadband AOAM wave MMBF method. As illustrated in Figure 7a, a stick image can be vaguely seen, indicating that the MMBF method has achieved the imaging of the stick. However, compared with Figure 7d, (a) still has the disadvantages of wide mainlobes, high sidelobes, and high background levels. The details of the stick structure are not clear, and the overall imaging resolution is not as good as in (d). At this time, it is just an independent single stick. In the event of a more complex structure within the imaging scene, this method will fail to image and identify the target object, as previously described. In contrast, Figure 7d demonstrates that high-resolution imaging of the stick is achieved based on the method proposed in this paper. As evidenced by the results, the stick structure is very clear, the mainlobes are narrow, there is no sidelobe interference, and the background levels are also very low.
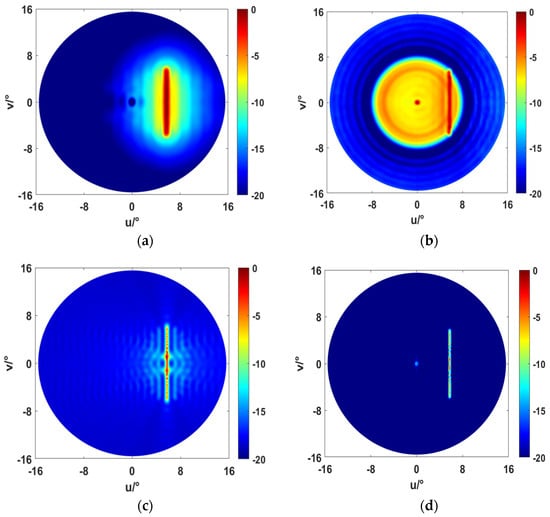
Figure 7.
Imaging results of different methods at SNR = 20 dB. (a) Beam pattern for AOAM wave MMBF imaging. (b) Beam pattern for AOAM wave sub-band signal subspace method imaging. (c) Beam pattern for plane wave focusing beamforming method imaging. (d) Beam pattern for AOAM wave modal focusing beamforming method (proposed method) high-resolution imaging.
Figure 7b shows the imaging results based on the broadband AOAM wave classical sub-band processing method. The results in Figure 7b show that a faint image of the stick exists within the imaging scene. However, in reference to the color bar on one side, it is found that the output interference energy of the beam pattern is too high near the mainlobes, which seriously affects the identification of the target structure. The outcome is not ideal and is worse than that in Figure 7a.
Figure 7c shows the imaging results based on the broadband plane wave focusing beamforming method. The results in (c) show that a stick-shaped image appears in the imaging scene, accompanied by narrower mainlobes in comparison to those observed in Figure 7a,b. At this time, the image is of a higher resolution. However, a comparison with Figure 7d reveals that the imaging results still exhibit sidelobe interference and a high background level, resulting in an overall effect that is less clear than that observed in (d). The comparison between (c) and (d) is an imaging effect comparison between the plane wave and the AOAM wave, which fully demonstrates that underwater imaging based on broadband AOAM waves can achieve higher image resolution than plane waves. This is also consistent with the conclusion of the simple target source simulation experiments presented earlier. Figure 7d shows the imaging results obtained by the technology proposed in this paper. A comparative analysis of the results achieved from several methods reveals that the imaging effects of the proposed method are the most optimal.
4.3.2. Imaging Results When SNR = 10 dB
As illustrated in Figure 8, an increase in noise intensity resulted in a change in all the results. Among them, the results in Figure 8a,b,d show relatively small changes, while the outcomes in Figure 8c have a relatively large change. Nevertheless, among all the imaging results, the imaging effects of the method proposed in this paper are still the best, and the resolution is the highest.
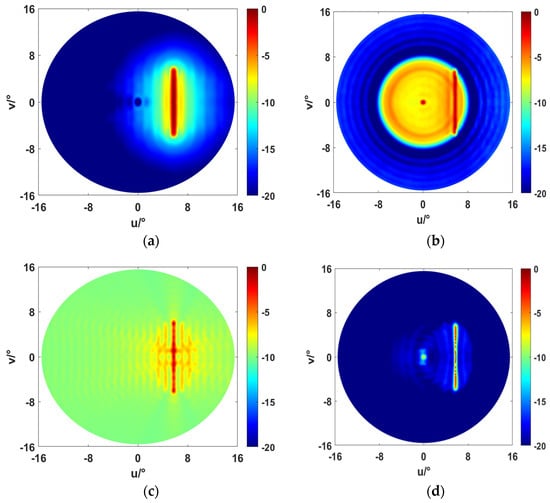
Figure 8.
Imaging results of different methods at SNR = 10 dB. (a) Beam pattern for AOAM wave MMBF imaging. (b) Beam pattern for AOAM wave sub-band signal subspace method imaging. (c) Beam pattern for plane wave focusing beamforming method imaging. (d) Beam pattern for AOAM wave modal focusing beamforming method (proposed method) high-resolution imaging.
Figure 8a,b demonstrate comparatively minor alterations in comparison to Figure 7a,b, which indicates that the conventional method has robust stability. There is a big difference between Figure 7c and Figure 8c. The background level of the beam pattern in (c) is about 10 dB higher than that in (c). It is evident that the imaging results of the plane wave are susceptible to noise. However, by comparing the results of Figure 7d and Figure 8d, we find that the sidelobe level only increases by 2–3 dB, while the background level hardly changes. This indicates that following an increase in noise intensity, the imaging results remain stable, demonstrating the effectiveness of the proposed method in resisting the effects of noise. This is important in underwater imaging research.
4.3.3. Other Complex Target Structure Imaging Results
This section presents the imaging of the number “7” structure, which was imaged based on the method proposed in this paper. This paper takes into account the complexity of the target structure in the actual imaging scene, such as the existence of corners or the asymmetric shapes of objects. Naturally, this simulation was designed. Figure 9 shows the results under different noise levels.
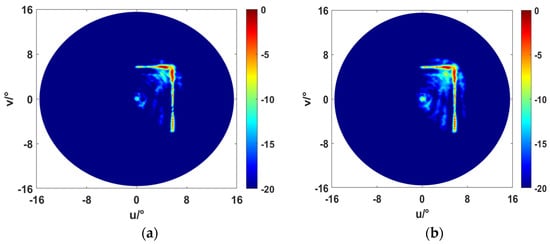
Figure 9.
High-resolution imaging results of the complex structure number “7” under different noise intensities: (a) SNR = 30 dB. (b) SNR = 20 dB.
As illustrated in Figure 9, the proposed method in this paper also achieves clear imaging for complex structures. In fact, this is very critical for underwater imaging. If a rectangular structure that should be a right angle is identified as an elliptical structure with four vertices that are arcs, it will cause a significant recognition error. The results of SNR = 30 dB in Figure 9 are slightly better than those of SNR = 20 dB. This set of results demonstrates that the modal-domain focusing beamforming method based on the broadband AOAM wave proposed in this paper can also process the details of complex targets very well. The focusing conversion matrix obtained in the AOAM wave modal domain has greater diversity, thereby reducing matching energy in non-target directions during signal matching and enhancing imaging resolution.
5. Conclusions
In order to further improve the imaging resolution of the broadband AOAM wave and address the imaging issue of coherent signals in practice, this paper proposes the modal-domain focusing beamforming method. To verify the performance of this algorithm, multiple groups of simulation experiments on simple target sources and complex object structures under different SNRs were designed, and they were compared based on multiple aspects such as imaging methods and signals. The experimental results demonstrate that the method proposed in this paper achieves high-resolution imaging. In focusing beamforming, the focusing frequency emerges as a pivotal factor related to the algorithm’s accuracy. The current paper uses the center frequency as the focusing frequency. Next, we will consider the optimization of the focusing frequency. In addition, in order to better apply this method to practical engineering, we will also consider strategies to improve the computational efficiency of the algorithm.
Author Contributions
Research method design, Y.J.; experimental content design, Y.J.; material collection, Y.J.; analysis of experimental results, Y.J.; writing of the first draft of the paper, Y.J.; supervision, writing—review and editing, Q.H. All authors have read and agreed to the published version of the manuscript.
Funding
This research was funded in part by the Open Fund Project of Hanjiang National Laboratory under grant KF2024002, in part by Southern Marine Science and Engineering Guangdong Laboratory (Zhuhai), under grant SML2023SP232, and also in part by the National Natural Science Foundation of China under grant U22A2012.
Data Availability Statement
The data supporting this study’s findings are available from the corresponding author upon reasonable request.
Acknowledgments
Thank you to all authors for their support and contributions.
Conflicts of Interest
The authors declare no conflicts of interest.
Abbreviations
- The following abbreviations are used in this manuscript:
| AOAM | Acoustic orbital angular momentum |
| UCA | Uniform circular array |
| MMBF | Mode matching beamforming |
References
- Nye, J.F.; Berry, M.V.; Frank, F.C. Dislocations in Wave Trains. Proc. R. Soc. Lond. A Math. Phys. Sci. 1974, 336, 165–190. [Google Scholar]
- Hefner, B.T.; Marston, P.L. An Acoustical Helicoidal Wave Transducer with Applications for the Alignment of Ultrasonic and Underwater Systems. J. Acoust. Soc. Am. 1999, 106, 3313–3316. [Google Scholar] [CrossRef]
- Yuan, T.; Cheng, Y.; Wang, H.; Qin, Y.; Fan, B. Radar Imaging Using Electromagnetic Wave Carrying Orbital Angular Momentum. J. Electron. Imaging 2017, 26, 023016. [Google Scholar] [CrossRef]
- Liu, K.; Li, X.; Gao, Y.; Cheng, Y.; Wang, H.; Qin, Y. High-Resolution Electromagnetic Vortex Imaging Based on Sparse Bayesian Learning. IEEE Sens. J. 2017, 17, 6918–6927. [Google Scholar] [CrossRef]
- Wang, J.; Liu, K.; Liu, H.; Cao, K.; Cheng, Y.; Wang, H. 3-D Object Imaging Method with Electromagnetic Vortex. IEEE Trans. Geosci. Remote Sens. 2022, 60, 2000512. [Google Scholar] [CrossRef]
- Guo, S.; He, Z.; Chen, R. High Resolution 2-D Electromagnetic Vortex Imaging Using Uniform Circular Arrays. IEEE Access 2019, 7, 132430–132437. [Google Scholar] [CrossRef]
- Wang, J.; Liu, J.; Li, S.; Zhao, Y.; Du, J.; Zhu, L. Orbital Angular Momentum and beyond in Free-Space Optical Communications. Nanophotonics 2022, 11, 645–680. [Google Scholar] [CrossRef]
- Chen, R.; Zhou, H.; Moretti, M.; Wang, X.; Li, J. Orbital Angular Momentum Waves: Generation, Detection, and Emerging Applications. IEEE Commun. Surv. Tutor. 2020, 22, 840–868. [Google Scholar] [CrossRef]
- Maxwell, A.D.; Bailey, M.; Cunitz, B.W.; Terzi, M.; Nikolaeva, A.; Tsysar, S.; Sapozhnikov, O.A. Vortex Beams and Radiation Torque for Kidney Stone Management. J. Acoust. Soc. Am. 2016, 139, 2040. [Google Scholar] [CrossRef]
- Hefner, B.T.; Dzikowicz, B.R. A Spiral Wave Front Beacon for Underwater Navigation: Basic Concept and Modeling. J. Acoust. Soc. Am. 2011, 129, 3630–3639. [Google Scholar] [CrossRef]
- Kelly, M.E.; Shi, C. Design and Simulation of Acoustic Vortex Wave Arrays for Long-Range Underwater Communication. JASA Express Lett. 2023, 3, 076001. [Google Scholar] [CrossRef] [PubMed]
- Zhang, Y.; Sun, X.; Luo, M.; Li, S. Semi-Blind Calibration for Orbital Angular Momentum Generating System Using Maximal Likelihood Estimation. J. Acoust. Soc. Am. 2022, 152, 2309–2318. [Google Scholar] [CrossRef] [PubMed]
- Jia, Y.; Hu, Q.; Li, Z.; Wang, H. High Resolution Imaging of Acoustic Orbital Angular Momentum Wave Based on Orthogonal Matching Tracking. J. Acoust. Soc. Am. 2024, 155, 1240–1252. [Google Scholar] [CrossRef]
- Jia, Y.; Hu, Q.; Li, S. Enhanced Underwater Three-Dimensional Imaging Using Acoustic Orbital Angular Momentum Waves and Mode Matching Beamforming. J. Acoust. Soc. Am. 2025, 157, 880–896. [Google Scholar] [CrossRef]
- Gan, W.S. Acoustical Imaging: Techniques and Applications for Engineers; Wiley, A John Wiley & Sons, Ltd., Publication: Chichester, UK, 2012; ISBN 978-1-119-94171-2. [Google Scholar]
- Chi, C.; Li, Z. High-Resolution Real-Time Underwater 3-D Acoustical Imaging Through Designing Ultralarge Ultrasparse Ultra-Wideband 2-D Arrays. IEEE Trans. Instrum. Meas. 2017, 66, 2647–2657. [Google Scholar] [CrossRef]
- Zhang, J. An Extended TOPS Algorithm Based on Incoherent Signal Subspace Method. Signal Process. 2010, 90, 3317–3324. [Google Scholar] [CrossRef]
- Ahmad, Z.; Song, Y.; Du, Q. Wideband DOA Estimation Based on Incoherent Signal Subspace Method. COMPEL 2018, 37, 1271–1289. [Google Scholar] [CrossRef]
- Yang, D. Coherent Broadband MVDR Focused Beamforming Based on Vector Sensor Array Processing. Comput. Simul. 2010, 22, 473–477. [Google Scholar]
- Li, J.; Lin, Q.; Kang, C.; Wang, K.; Yang, X.-T. DOA Estimation for Underwater Wideband Weak Targets Based on Coherent Signal Subspace and Compressed Sensing. Sensors 2018, 18, 902. [Google Scholar] [CrossRef]
- Murino, V.; Trucco, A. Three-Dimensional Image Generation and Processing in Underwater Acoustic Vision. Proc. IEEE 2000, 88, 1903–1948. [Google Scholar] [CrossRef]
- Schmidt, R. Multiple Emitter Location and Signal Parameter Estimation. IEEE Trans. Antennas Propag. 1986, 34, 276–280. [Google Scholar] [CrossRef]
- Capon, J. High-Resolution Frequency-Wavenumber Spectrum Analysis. Proc. IEEE 1969, 57, 1408–1418. [Google Scholar] [CrossRef]
- Roy, R.; Kailath, T. ESPRIT-Estimation of Signal Parameters via Rotational Invariance Techniques. IEEE Trans. Acoust. Speech Signal Process. 1989, 37, 984–995. [Google Scholar] [CrossRef]
- Barabell, A. Improving the Resolution Performance of Eigenstructure-Based Direction-Finding Algorithms. In Proceedings of the ICASSP ’83. IEEE International Conference on Acoustics, Speech, and Signal Processing, Boston, MA, USA, 14–16 April 1983; Volume 8, pp. 336–339. [Google Scholar]
- Sheng, X.; Lu, D.; Yu, Y.; Cai, C. A Robust Focused-and-Deconvolved Conventional Beamforming for a Uniform Linear Array. J. Mar. Sci. Appl. 2024, 23, 425–433. [Google Scholar] [CrossRef]
- Liu, K.; Cheng, Y.; Li, X.; Wang, H.; Qin, Y.; Jiang, Y. Study on the Theory and Method of Vortex-electromagnetic-wave-based Radar Imaging. IET Microw. Antennas Propag. 2016, 10, 961–968. [Google Scholar] [CrossRef]
- Hung, H.; Kaveh, M. Focussing Matrices for Coherent Signal-Subspace Processing. IEEE Trans. Acoust. Speech Signal Process. 1988, 36, 1272–1281. [Google Scholar] [CrossRef]
- Tian, G.; Xu, G.; Li, D.; Luo, J.; Huang, P. A Broadband Focusing Beamforming with Adaptive Side-Lobe Suppression. In Proceedings of the 2023 4th China International SAR Symposium (CISS), Xi’an, China, 4–6 December 2023; pp. 1–5. [Google Scholar]
- Palmese, M.; Trucco, A. An Efficient Digital CZT Beamforming Design for Near-Field 3-D Sonar Imaging. IEEE J. Ocean. Eng. 2010, 35, 584–594. [Google Scholar] [CrossRef]
Disclaimer/Publisher’s Note: The statements, opinions and data contained in all publications are solely those of the individual author(s) and contributor(s) and not of MDPI and/or the editor(s). MDPI and/or the editor(s) disclaim responsibility for any injury to people or property resulting from any ideas, methods, instructions or products referred to in the content. |
© 2025 by the authors. Licensee MDPI, Basel, Switzerland. This article is an open access article distributed under the terms and conditions of the Creative Commons Attribution (CC BY) license (https://creativecommons.org/licenses/by/4.0/).