Article

Design and Implementation of Real-Time Optimal Power Allocation System with Neural Network in OFDM-Based Channel of Optical Wireless Communications

by
Mahdi Akbari
1,
Saeed Olyaee
1,2,* and
Gholamreza Baghersalimi
3
1
Faculty of Electrical Engineering, Shahid Rajaee Teacher Training University, Tehran 16788-15811, Iran
2
Nano-Photonics and Optoelectronics Research Laboratory (NORLab), Shahid Rajaee Teacher Training University, Tehran 16788-15811, Iran
3
Department of Electrical Engineering, University of Guilan, Rasht 41996-13776, Iran
*
Author to whom correspondence should be addressed.
Electronics 2025, 14(8), 1580; https://doi.org/10.3390/electronics14081580
Submission received: 2 March 2025 / Revised: 3 April 2025 / Accepted: 10 April 2025 / Published: 13 April 2025

Abstract

:
In recent years, many studies have been conducted on OFDM-based optical wireless communications to develop a 6G communication infrastructure to improve data transmission and reduce the BER. Real-time optimal power management can enhance the data transmission speed and received power in an optical wireless channel under various conditions. This paper discusses implementing a real-time optimal power allocation system using a neural network for OFDM-based optical wireless communications. The system is designed to manage transmitter power, enhancing data transmission rates in optical wireless channels. In system design, data concerning power allocation for various types of OFDM-based optical wireless channels are calculated analytically, including the BER, SNR, fog effects, and fading types in the channel model. Next, a DNN neural model is trained using data generated from the analytical method. The trained model is finally integrated into wireless optical communication transmitter hardware. The experimental results indicate that the embedded power allocation system processes power allocation quickly. The proposed system achieves an average accuracy of 98% in power allocation, surpassing the analytical method. When used in wireless optical communication transmitters, this embedded system enhances speed and accuracy in power management, optimizing the data transmission rate up to 16 Gbps for a 500 m channel.

1. Introduction

Optical wireless communication (OWC) is an innovative technology that provides high data rates and accommodates multiple users. As a result, numerous researchers have thoroughly studied the optical wireless physical layer [1,2,3,4,5,6,7]. Extensive research has been conducted to enhance this technology’s data transmission rate. Resource management in these systems, particularly regarding power, is crucial for achieving a communication system with a high data transmission speed [8,9,10,11,12,13,14,15,16,17,18]. Aletri et al. studied optimal resource management in an OWC system that supports multiple users using a wavelength division multiple access scheme. The results indicate that the proposed method aids in configuring the OWC system for optimal network location processing [19]. Researchers have presented an analysis of noise and PAPR in polarized Orthogonal Frequency-Division Multiplexing (OFDM). They demonstrated that optimal power allocation can enhance the receiver SNR. Moreover, effectively allocating phase and amplitude power can significantly minimize the impact of intensity clipping on the bit error rate (BER) [20]. Farooqui et al. investigated the physical layer aspect of power allocation in indoor wireless optical communication systems based on OFDM with intensity modulation and direct detection (IMIDD). The primary objective of this research was to minimize the average transmitted optical power while adhering to the bit error rate constraint. The simulation results indicated that significant reductions in transmission power occur when the transmission bit rate reaches approximately 100 Mbit/s [21]. Another study combined the cognitive radio system power distribution method with orthogonal frequency-division technology. Analyses of wireless communications indicate that OFDM-CR-based power allocation algorithms will enhance the future of wireless optical communications [22].
Optical wireless communication can achieve high data rates in the terabits per second (Tb/s) range. OWC’s use of infrared lasers as transmitters is a leading candidate for the next generation of wireless communications. Researchers have developed a DNN model to address the power allocation optimization problem in a two-layer rate-division OWC network. The results indicate that the proposed model accurately provides solutions that are significantly close to optimal [23]. Previous research examined the optimization of DC bias, information carrier power, and sub-power allocation in OFDM systems with bias. The objective was to maximize the achievable rate within the limitations of optical power. Simulation results validated the theoretical analysis and effectiveness of the developed algorithms [24]. In another study, the authors evaluated the performance of a MIMO-NOMA-based VLC system for a multi-user indoor network through MATLAB R2013b v8.2 simulations. This research considered and compared a new NOMA power allocation strategy in VLC systems with existing schemes. Numerical simulation results show that the proposed NOMA system increases the total system sum rate [25]. Researchers have studied a MIMO-FSO system in multiplex mode. This study proposed a power allocation algorithm based on reinforcement learning (RL). Analytical results show that the proposed algorithm performs better than the traditional power allocation algorithm [26]. In a separate study, Li et al. created a power distribution optimization model for underwater optical communications (UWOCs) while adhering to specific light-emitting diode (LED) power emission constraints in two scenarios. The optimization model used the Karush–Kuhn–Tucker (KKT) conditions and the bipartite method to determine the optimal power allocation for two user types. Simulations showed that the power allocation method was optimized accurately [27].
Combining a multiple-input, multiple-output system and the OFDM technique can significantly enhance the achievable rate of visible light communication (VLC) systems. Consequently, researchers have introduced a two-dimensional water-filling (2D-WF) power allocation algorithm that functions in both the frequency and spatial domains, effectively enhancing the rate achieved by MIMO-OFDM VLC systems in low-pass VLC channels. Simulation results show that the proposed 2D-WF power allocation outperforms all other schemes regarding the achievable bit rate [28]. In a different study, researchers proposed various power allocation schemes for multi-input and multi-output OFDM transmission to reduce the bit error rate and evaluated the other solutions. Simulation results indicate a substantial improvement in the BER performance for QPSK and QAM modulation compared to the equal power allocation scheme [29].
Communication channel conditions can change in real time due to various factors, including smoke, fog, temperature fluctuations, and pressure differences. Additionally, resource limitations require that transmitter power be allocated to communication channels in a manner that maximizes data transmission rates. However, analytical power allocation methods can be unsuitable for real-time applications due to the extensive calculations and processing delays they involve. Therefore, it is more effective to employ faster methods, such as power allocation, using neural networks.
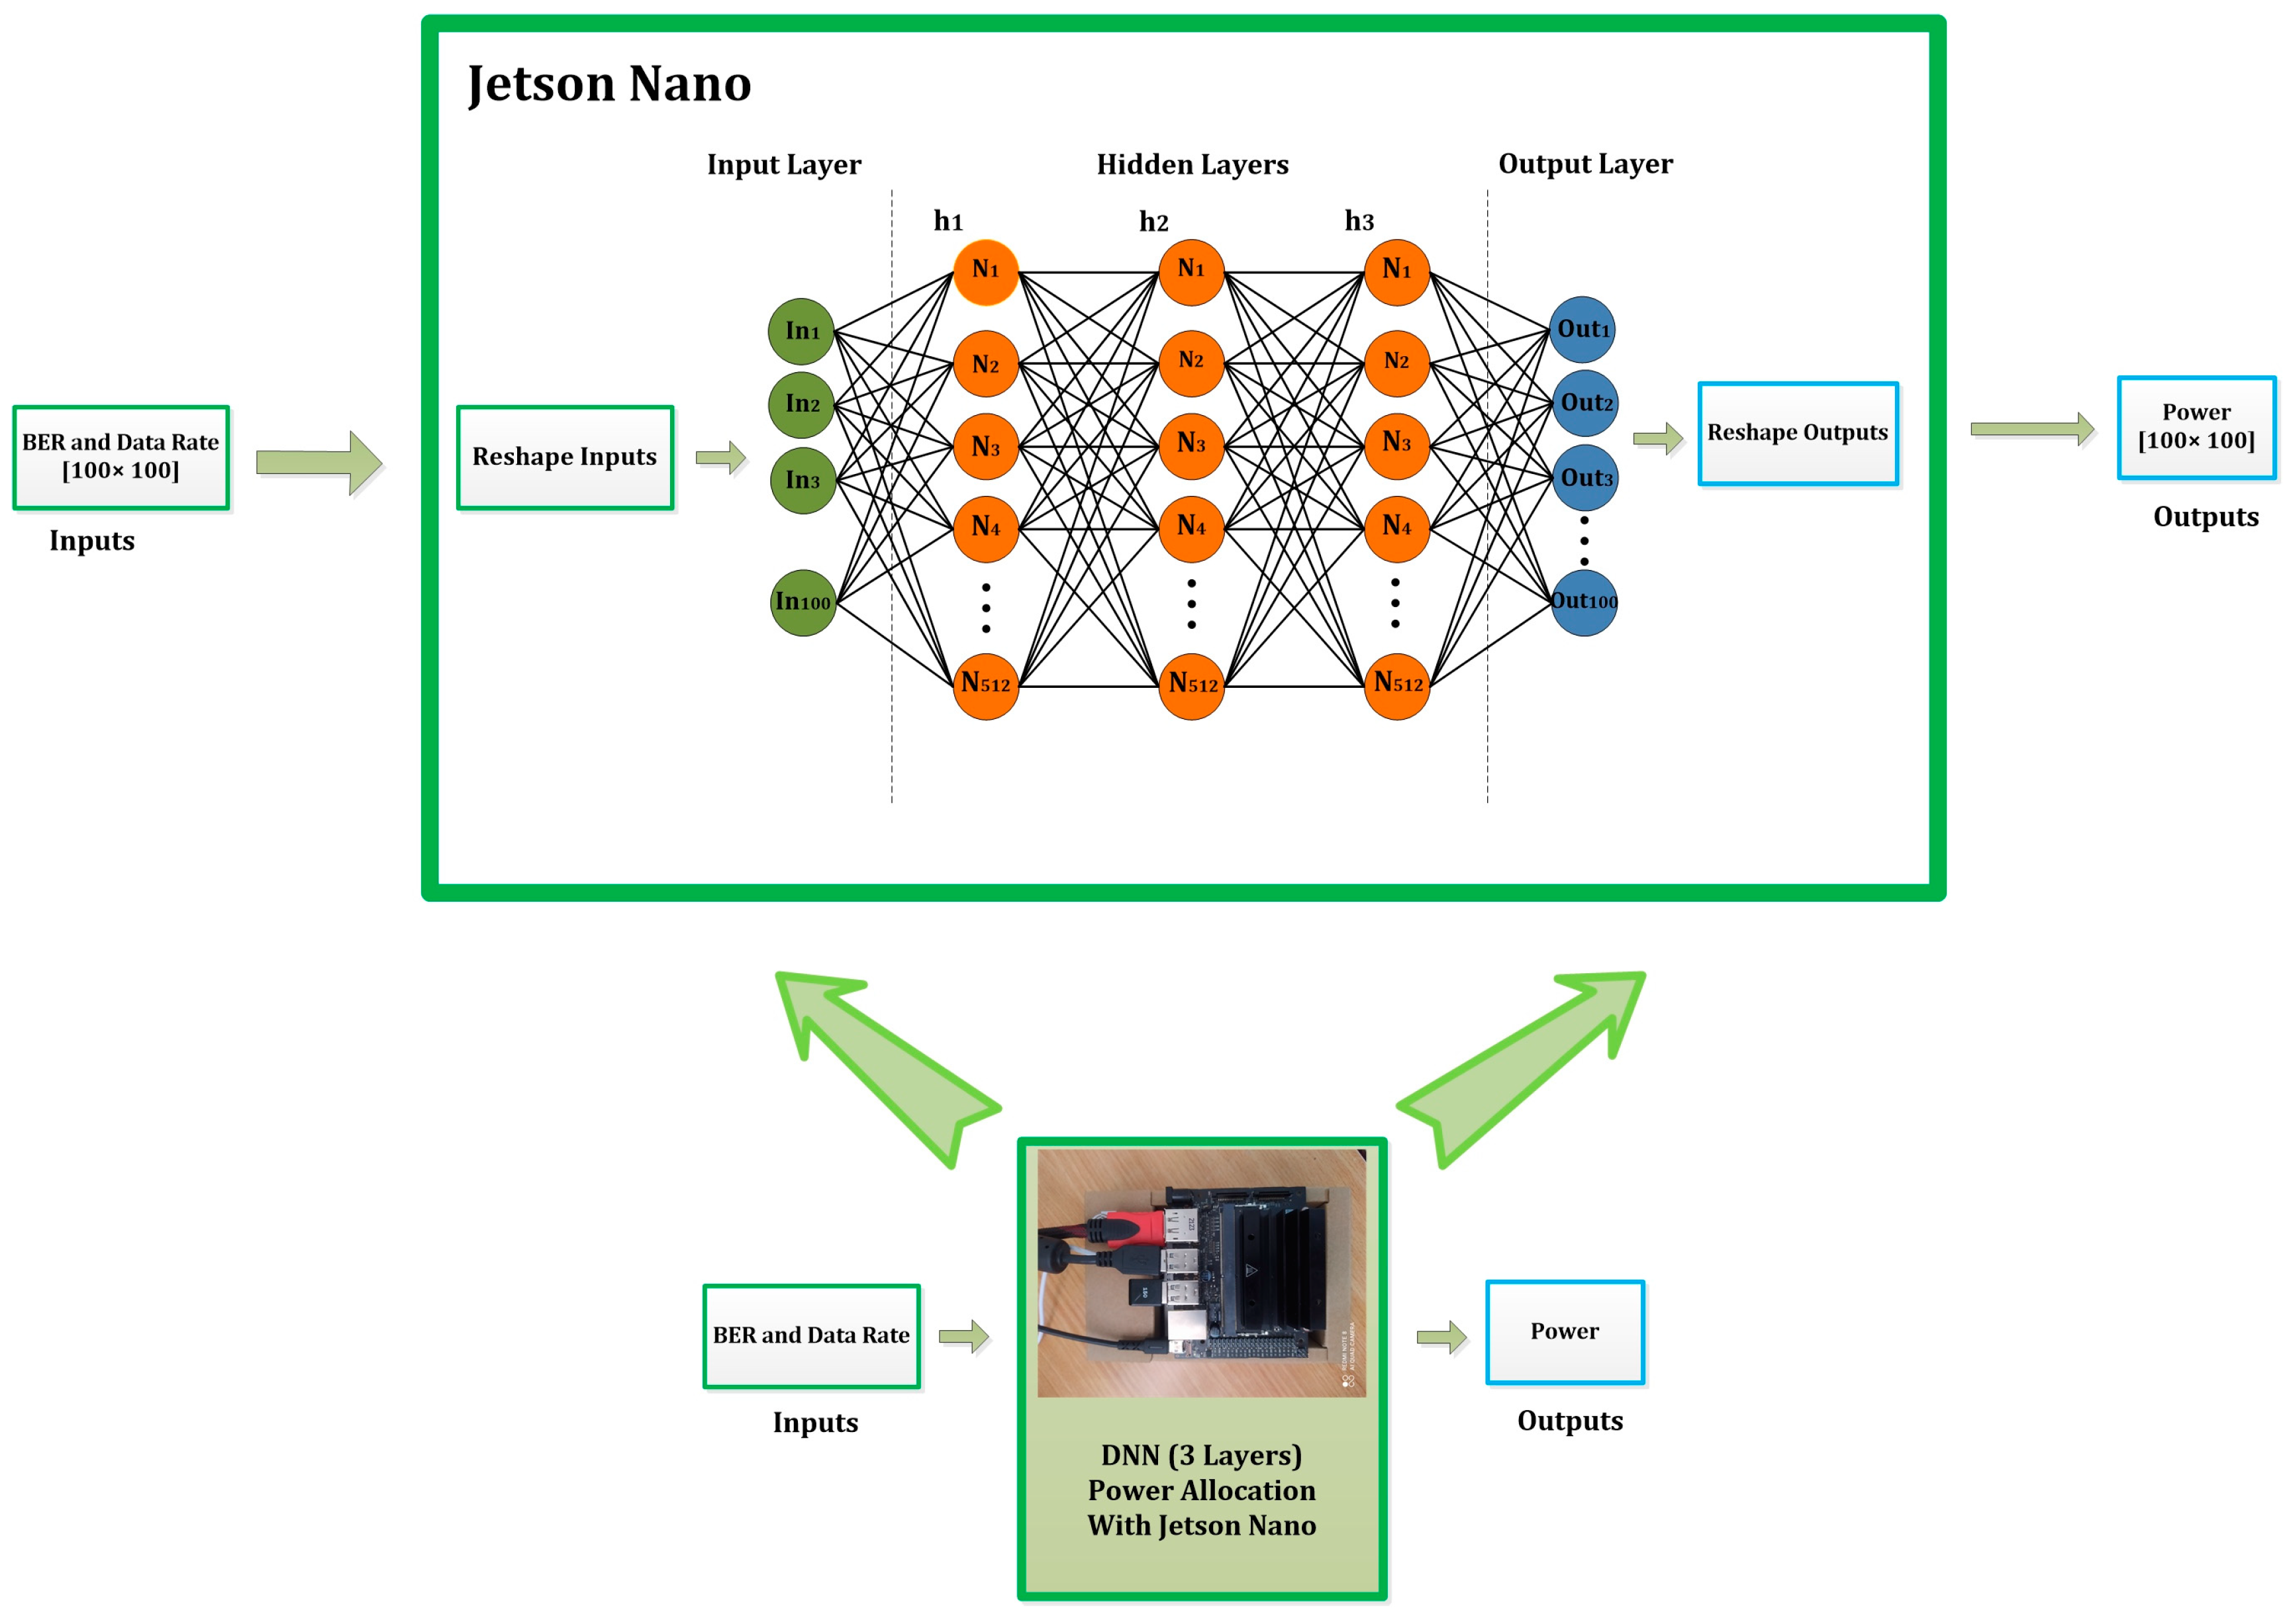
In this research, power allocation is performed using analytical methods and neural networks implemented in an embedded system for various types of wireless optical communication channels, including those affected by fog, Rician fading, Rayleigh fading, and models based on the Gamma–Gamma distribution. Next, the graph showing the changes in the bit error rate and data transmission rate regarding the signal-to-noise ratio and transmitter power is presented for all cases. A neural model is trained using data from the analytical power allocation method. The trained model is implemented on the Jetson Nano to control power in the transmitter of the wireless optical communication system. Power allocation in OFDM optical wireless communication using embedded systems and analytical methods is shown in Figure 1.
In this system, the inputs are the bit error rate and the data transmission rate, while the output is the optimal transmitter power for the wireless optical communication channel. This model allocates higher transmitter power to channels experiencing elevated bit error rates and lower data transmission rates. Low transmitter power values are allocated to channels with a low BER and high data rates to optimize power consumption and reduce interference. The results indicate that the proposed embedded power allocation optimizes transmitter power consumption, enhances the transmission rate, and reduces interference in optical wireless communication systems.

2. Materials and Methods

2.1. Analytical Power Allocation System Design

In this paper, power allocation is typically performed on a subcarrier basis in OFDM systems. This approach allows for more efficient use of the frequency spectrum, as the power assigned to each subcarrier can be adjusted according to varying channel conditions, such as different levels of interference or fading. Specifically, subcarriers that experience significant fading and exhibit lower bit error rates receive less power, while those less affected by fading or interference can be allocated more power. This paper also includes additional explanations regarding the analytical equations involved in this method.
The BER using OFDM modulation is directly related to the optical channel’s subcarrier SNR, modulation order scheme, and fading conditions in free-space optical systems. In M-QAM modulation, the BER can be calculated using standard equations. The effects of fading due to atmospheric turbulence are modeled using a Gamma–Gamma distribution for the SNR. The bit error rate regarding the signal-to-noise ratio can be extracted using OFDM and M-order QAM in a free-space optical communication system. The process for calculating the bit error rate is outlined in the following equations. In the initial stage, the path loss is defined by Equation (1). In this equation, d represents the distance between the transmitter and receiver, λ denotes the wavelength of the optical signal, and G T and G R are the optical gains of the transmitter and receiver, respectively.
L = 4 π d λ 2 × 1 G T × G R
Next, the receiver’s power is calculated considering path losses and transmitter power. Equation (2) describes how the receiver power is calculated by dividing the transmitter power by the path loss.
P r = P t L
After determining the receiver’s power, the next step is calculating the subcarrier SNR. The signal-to-noise ratio is calculated using Equation (3), where P r denotes the receiver power and N 0 denotes the noise power.
S N R = P r N 0
The BER is determined based on the subcarrier SNR. Equation (4) [30,31] illustrates the bit error rate as a function of the subcarrier signal-to-noise ratio for QAM modulation, where M represents the modulation order. In Equation (5), Q(x) is the Q-function, which represents the tail probability of the standard normal distribution.
B E R M Q A M = 4 log 2 M × 1 1 M × Q 3 log 2 M × S N R M 1
Q x = 1 2 π x e t 2 2 d t
The channel gain must be determined to calculate the bit error rate in an optical channel affected by fog. Equation (6) [30,31] defines the channel gain under the influence of fog. In this equation, c is the speed of light, α is the fog attenuation coefficient, and d is the channel length. Additionally, Equation (7) illustrates the bit error rate associated with the subcarrier signal-to-noise ratio for a channel affected by fog. In this equation, M represents the modulation order.
G = c 4 π d 2 × e α d
B E R F o g g y   c h a n n e l = 4 log 2 M × 1 1 M × Q 3 log 2 M × S N R G × ( M 1 )
First, the probability distribution function of a channel with the Gamma–Gamma distribution model must be defined to calculate the BER. Equation (8) obtains the probability distribution function in the Gamma–Gamma model. In this function, h is a random variable with a probability distribution defined by parameters α and β. The bit error rate and signal-to-noise ratio are calculated using Equation (9) [30,31] in a wireless optical communication channel modeled with a Gamma–Gamma distribution.
P D F G a m m a G a m m a h = β β Г α Г h 1 e h × h β 1 e β h
B E R G a m m a G a m m a = 4 log 2 M × 1 1 M 0 Q 3 log 2 M M 1 × S N R × H P D F G a m m a G a m m a ( h ) d h
The Rayleigh probability distribution function is utilized to define the BER. Equation (10) describes the signal-to-noise ratio probability distribution function for a wireless optical communication channel with Rayleigh fading. In a channel affected by Rayleigh fading, the bit error rate is calculated using Equation (11) [30,31], which incorporates the subcarrier signal-to-noise ratio and the probability distribution function.
P D F R a y l i e g h S N R = 1 S N R a v g × e S N R S N R a v g
B E R R a y l i e g h   f a d i n g = 4 log 2 M × 1 1 M 0 Q 3 log 2 M M 1 × S N R P D F R a y l i e g h ( S N R ) d S N R
The Rayleigh probability distribution function is utilized to define the BER. Equation (12) describes the channel coefficient in wireless optical communication with Rician fading. In this equation, K is the Rician factor, and h ~ is the random variable of the Rician distribution corresponding to the scattered paths. Meanwhile, Equation (13) [30,31] shows the bit error rate for the communication channel with Rician fading.
h = K + K + 1 × h ~
B E R R i c i a n   f a d i n g = 4 log 2 M × 1 1 M × 1 K K + 1 × Q 3 log 2 M × S N R M 1
Finally, the data transmission rate is determined using the bit error rate across all cases. Equation (14) [30,31] defines the data transmission rate by utilizing the number of subcarriers, bandwidth, and modulation order.
D R = N × log 2 M × B × log 2 ( 1 + S N R )

2.2. Design and Implementation of Embedded System

The primary goal of this research is to design and implement a high-accuracy, fast power allocation system for wireless optical communication systems using OFDM modulation. This study examines different OFDM modulation orders to achieve optimal power allocation across various channels. This approach aims to allocate power efficiently to channels with high data rates, ensuring strong communication performance.
A three-layer DNN architecture enhances the allocation of the embedded system to improve overall system accuracy. The data used to train the network are generated as 100 × 100 matrices from analytical equations. All input and output matrices are converted into 1D arrays of size 10,000 to be applied to the neural network since DNNs are usually trained with 1D input vectors. Figure 2 shows the structure of the proposed embedded system with Jetson Nano.
The neural network used has three layers and 512 neurons. ReLU activation is used for the hidden layers, and the loss function is used for the mean square error (MSE), which is typical for regression tasks. The optimizer used is the Adam Optimizer, and the model is trained for several epochs. After training, the model output is transformed into a 100 × 100 matrix and saved as a mat file. The production of the loss function in different epochs is shown in Figure 3.

3. Results and Discussion

Power allocation for various optical communication channels utilizes OFDM modulation. Since numerous mathematical calculations are required with each change in the atmospheric conditions of the wireless communication channel for effective power allocation, significant processing power is necessary. This high processing demand can lead to longer processing times within the hardware system.
In contrast, power allocation using deep neural networks allows for the design of a real-time power allocation system that operates several times faster than traditional methods after a single training session of the network. Additionally, by comparing the output of the neural network with that of the analytical system, it is possible to calculate the accuracy percentage of the neural network system.
This paper utilized OFDM modulation of varying orders to create the database necessary for a real-time optimal power allocation system in optical communication channels. This research uses lower-order modulations for highly reliable optical wireless channels and limited power budgets. At the same time, high-order modulations are also used for optical channels that require high data rates. To design the power allocation system, the bit error rate was first calculated for different values of the signal-to-noise ratio and transmitter power. Table 1 shows the initial design parameters.
Figure 4 shows the bit error rate regarding the signal-to-noise ratio and transmitter power for BPSK modulation. It demonstrates that the BER is at its lowest when the SNR exceeds 20 dB and the transmitter power exceeds 4 mW. Additionally, Table 2 indicates that this minimum BER value is 7.34 × 10 15 for the optical wireless channel.
According to Table 2 and Figure 5, the data rate for an SNR above 20 dB and a power of 5 mW in an optical communication channel with BPSK modulation reaches 2.8 Gbps. This modulation has a lower data rate than higher-order modulations and is more tolerant of transmitter power limitations than other forms of OFDM modulation.
QPSK modulation offers improved data rates in optical communication compared to BPSK modulation. In this modulation, the data rate for transmitter power values of 3 mW and more than 9 dB for the SNR gradually increases and reaches 5.6 dB. Figure 6 and Table 3 illustrates the changes in the data rate based on the transmitter power and SNR for QPSK modulation.
In the QPSK modulation model for optical communication, the lowest bit error rate is 7.37 × 10 7 , and the highest value is 0.4996. Figure 7 illustrates the variation in the bit error rate with the transmitter power and signal-to-noise ratio. The bit error rate is increased for this modulation compared to BPSK modulation.
Further, 16 QAM modulation is used in optical communication channels with a medium SNR, which must balance the data rate and optical channel reliability. This modulation offers a higher data rate compared to BPSK and QPSK modulations. Figure 8 and Table 4 show that as the transmitter power and SNR increase, the data rate values rise to 11.21 Gbps under comparable channel conditions.
The bit error rate variation in the transmitter power and SNR for 16 QAM modulation is shown in Figure 9. This model’s minimum and maximum values for the BER are 2.56 × 10 5 and 0.3748, respectively. It has been observed that the BER in this model has increased compared to lower-order modulations.
High-order modulations, such as 64 QAM, are used to modulate optical communication channels where high data rates are essential. Figure 10 shows that this model’s data rate is higher than that of previous models. According to Table 5, the maximum data rate in this case is 16.81 Gbps. Figure 10 shows the data rate changes regarding the transmitter power and BER for 64 QAM modulation.
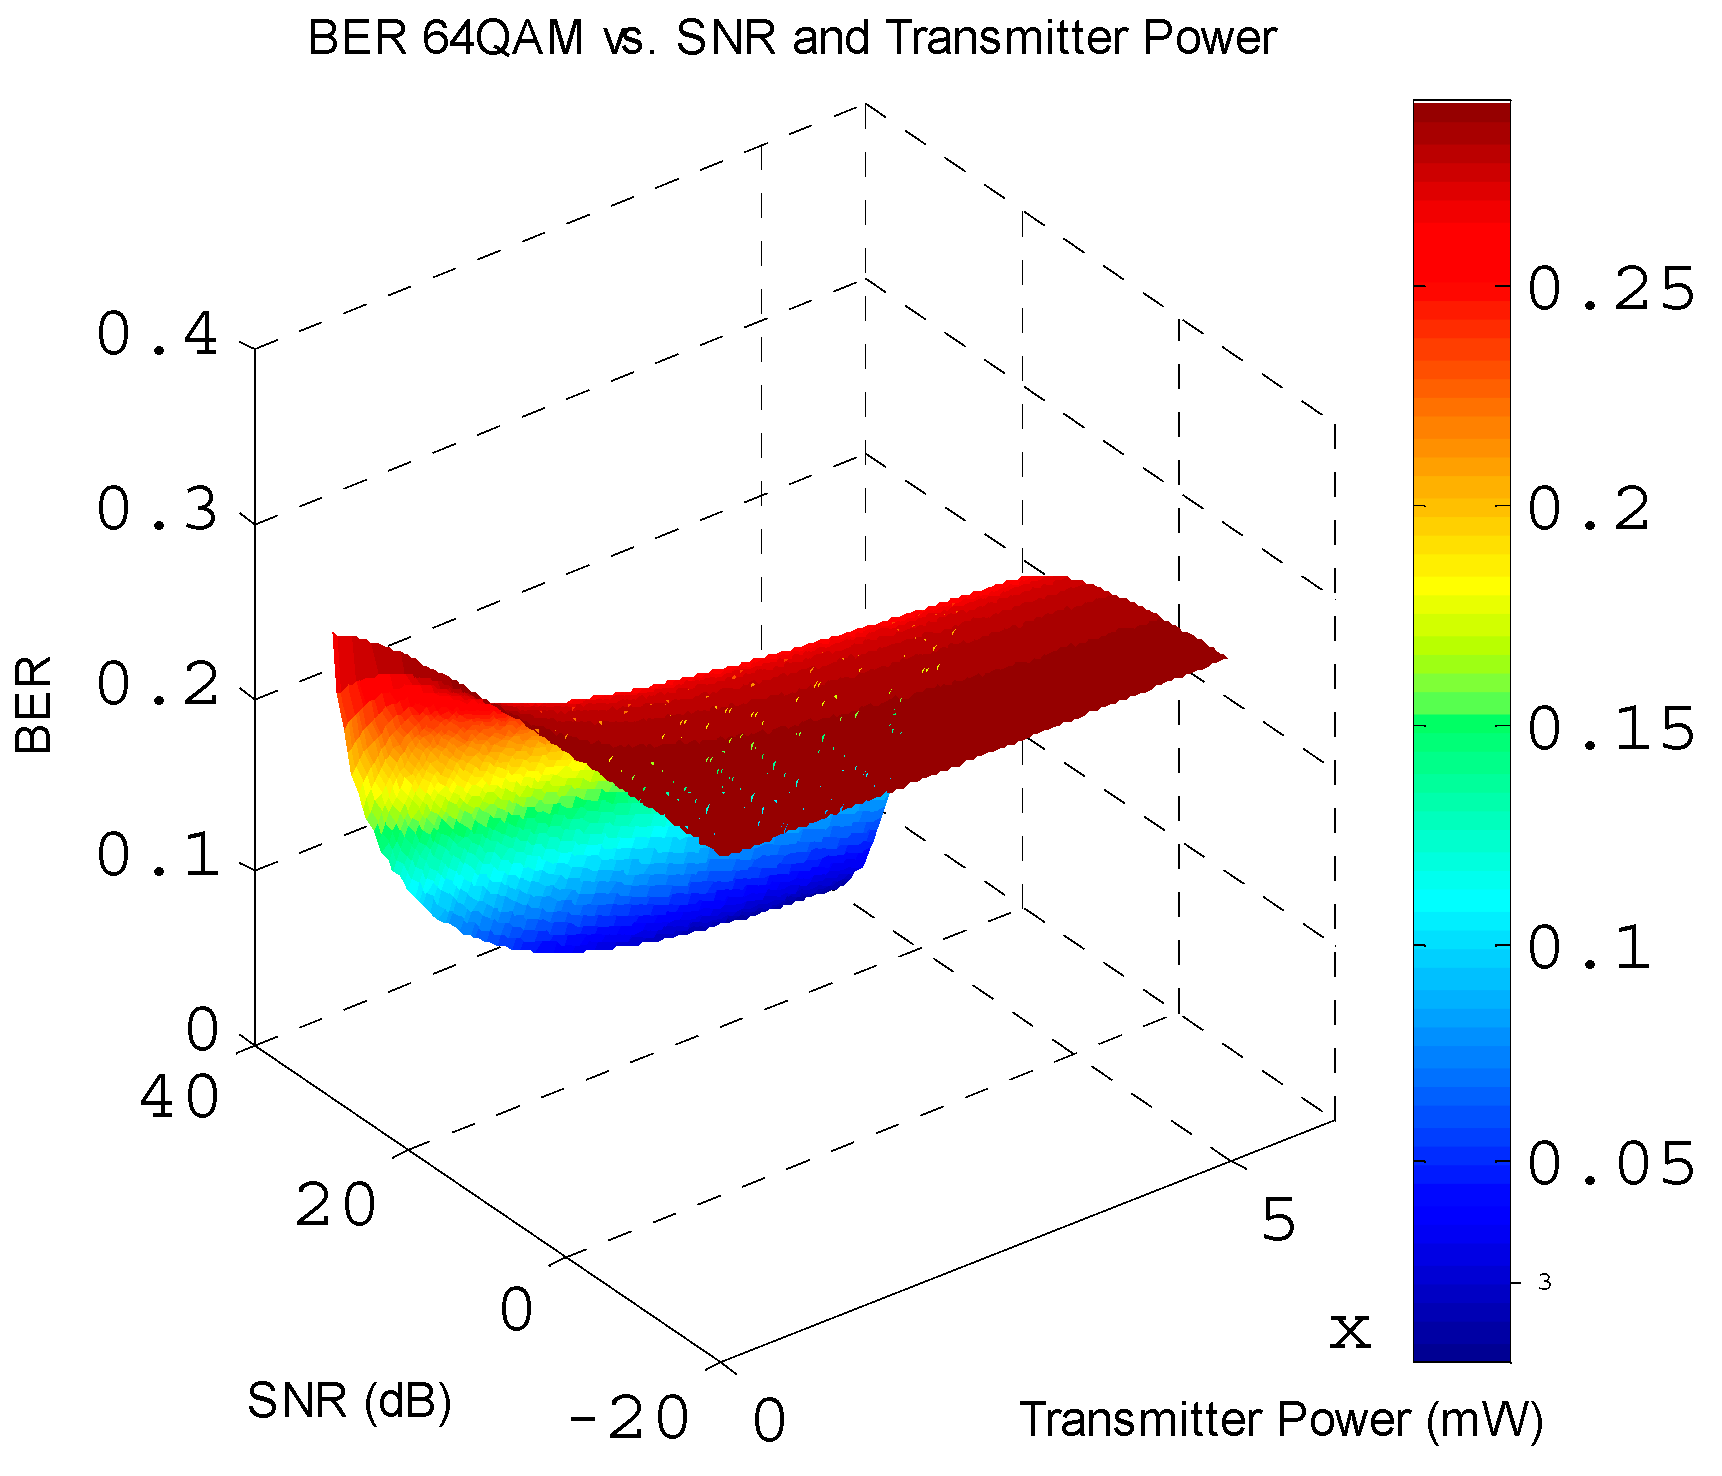
The bit error rate in an optical communication channel with 64 QAM modulation decreases less for higher transmitter power values than with previous modulations. Figure 11 illustrates the bit error rate for 64 QAM modulation as a function of the transmitter power and SNR. In this case, the minimum and maximum bit error rates are 5.1 × 10 3 and 0.2916, respectively.
In a wireless optical communication channel that is affected by fog, the power at the receiver decreases due to path loss, resulting in a reduced data transmission rate. Figure 12 illustrates the variations in the data rate based on the signal-to-noise ratio and transmitter power for BPSK, QPSK, 16 QAM, and 64 QAM modulations. It is evident from this figure that the data rate is lower for modulation schemes with lower-order OFDM.
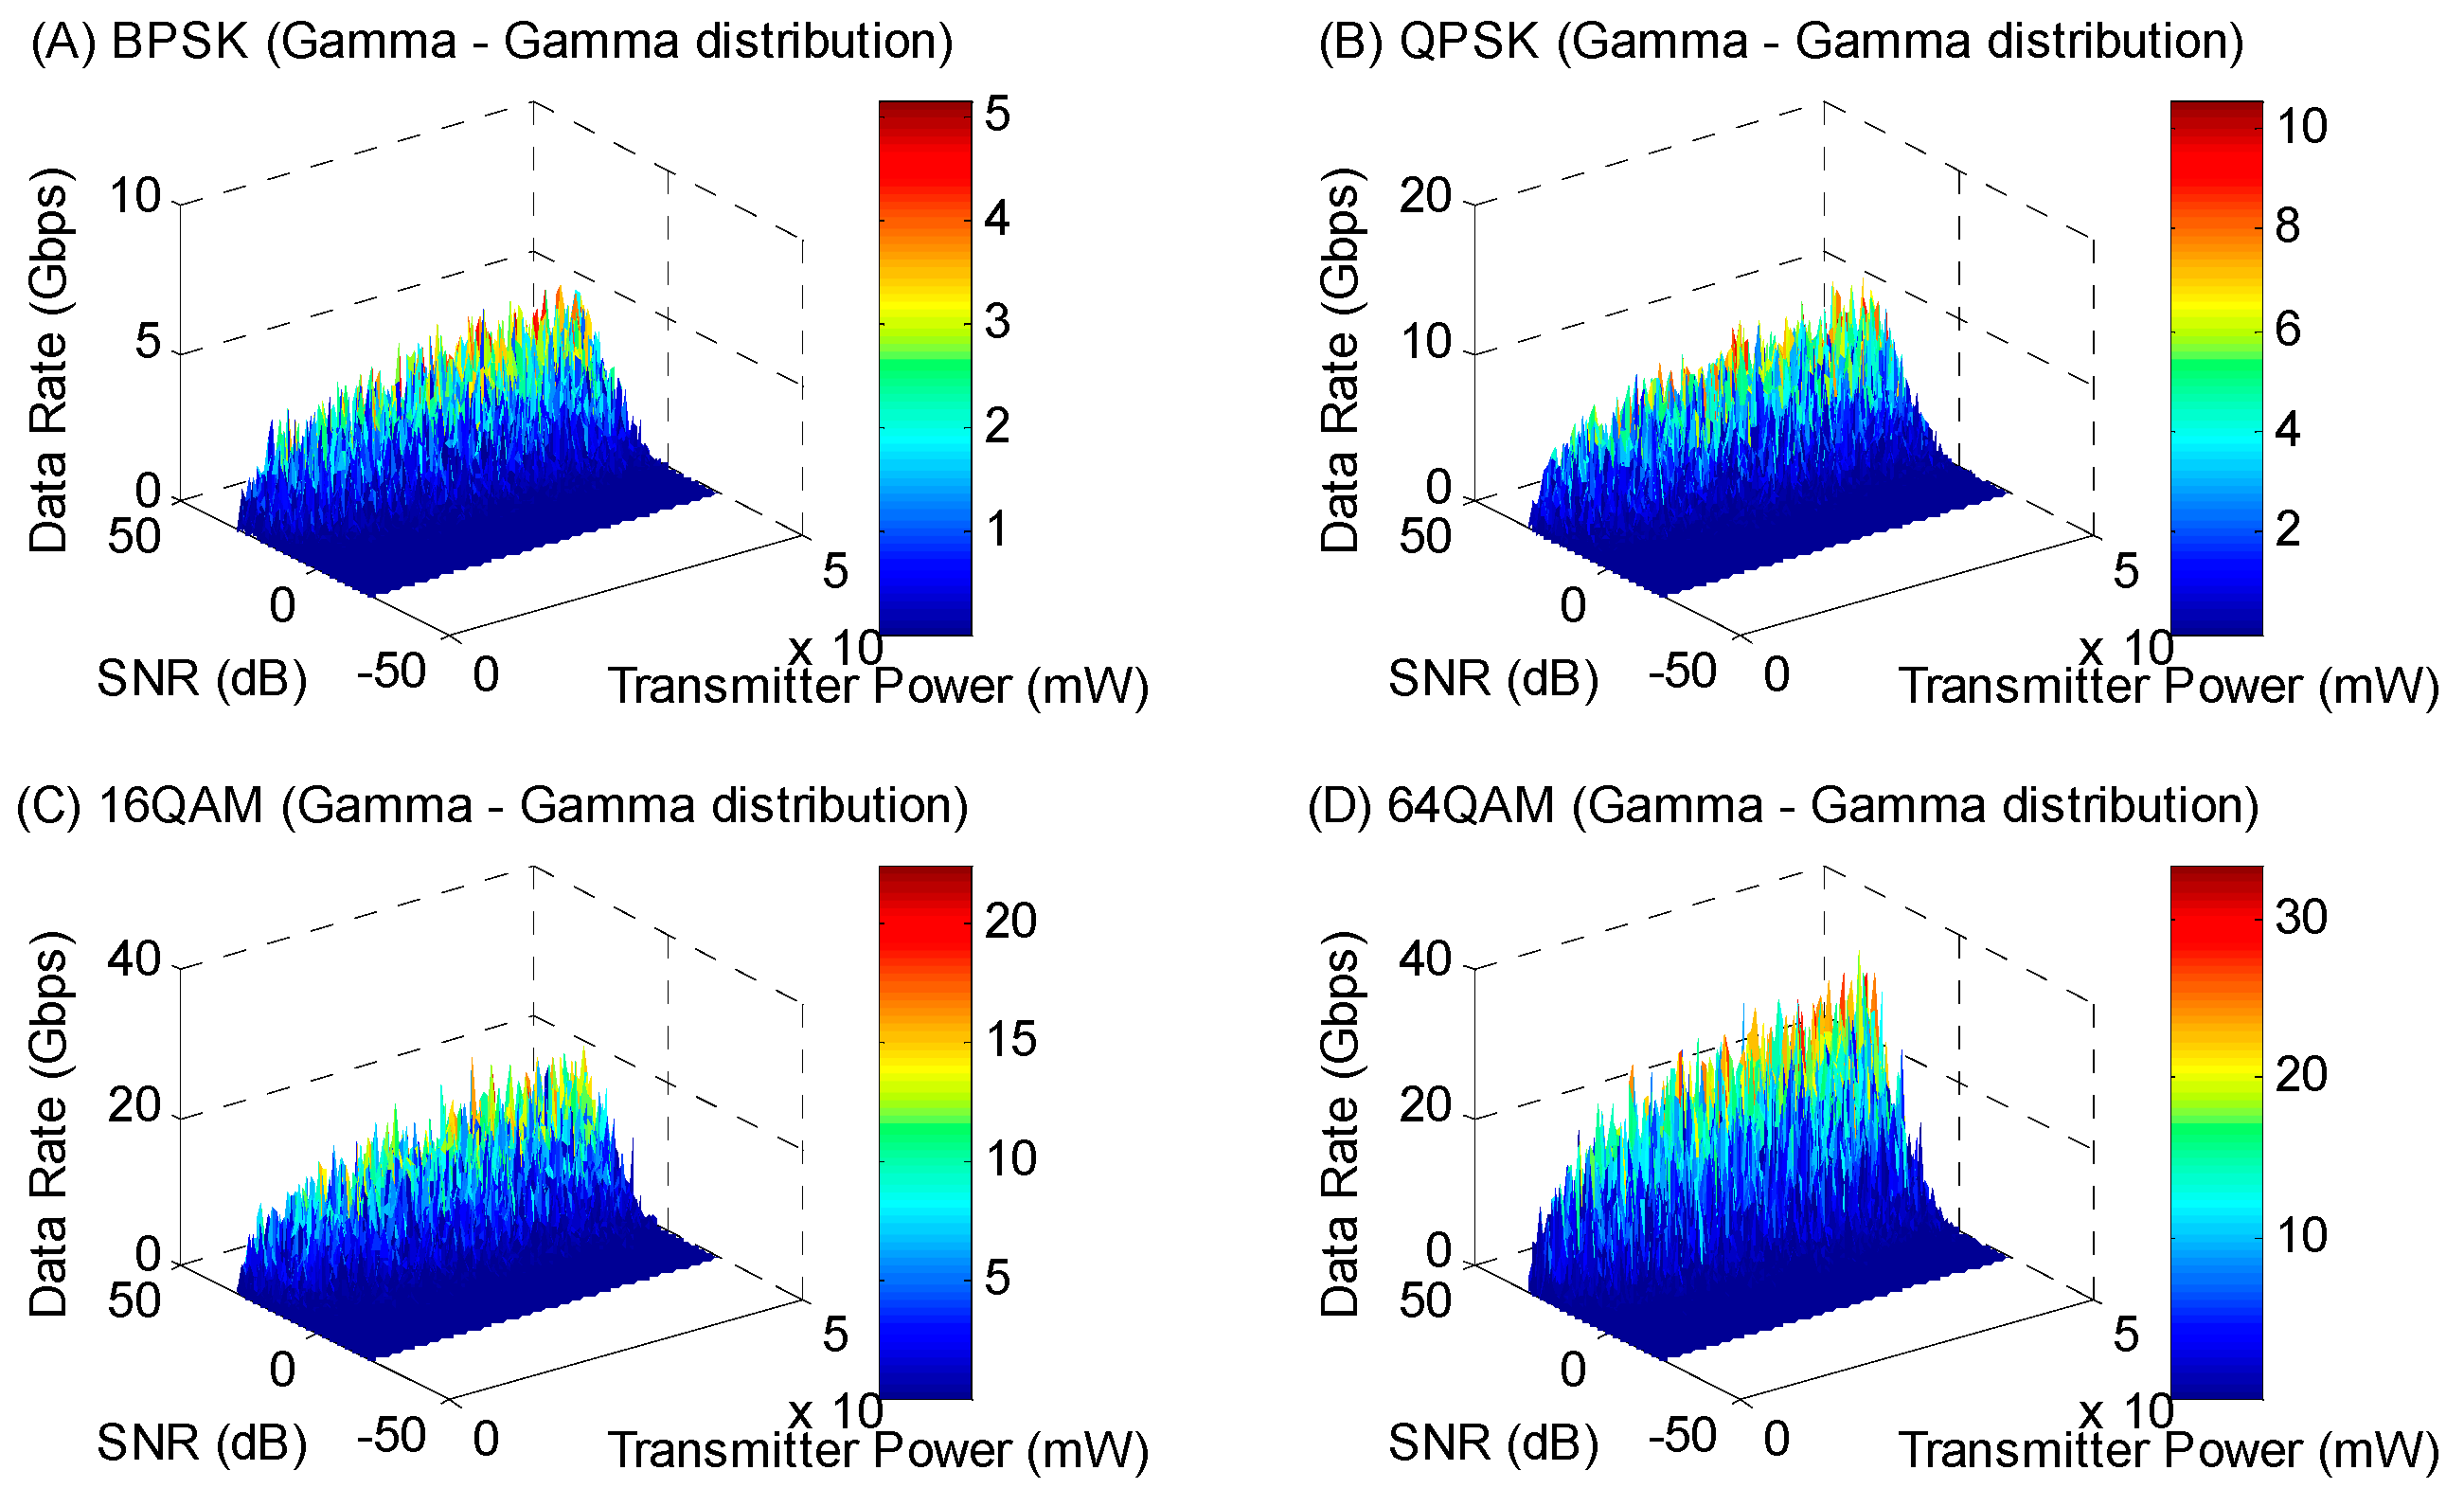
The Gamma–Gamma distribution model accounts for fading effects in wireless communication channels on both large and small scales. Implementing this model involves more complex analytical relationships compared to other models. For this model, the values of α and β are set to 2. Figure 13 illustrates how the data transmission rate changes concerning the signal-to-noise ratio and transmitter power for BPSK, QPSK, 16 QAM, and 64 QAM modulations under the Gamma–Gamma distribution model.
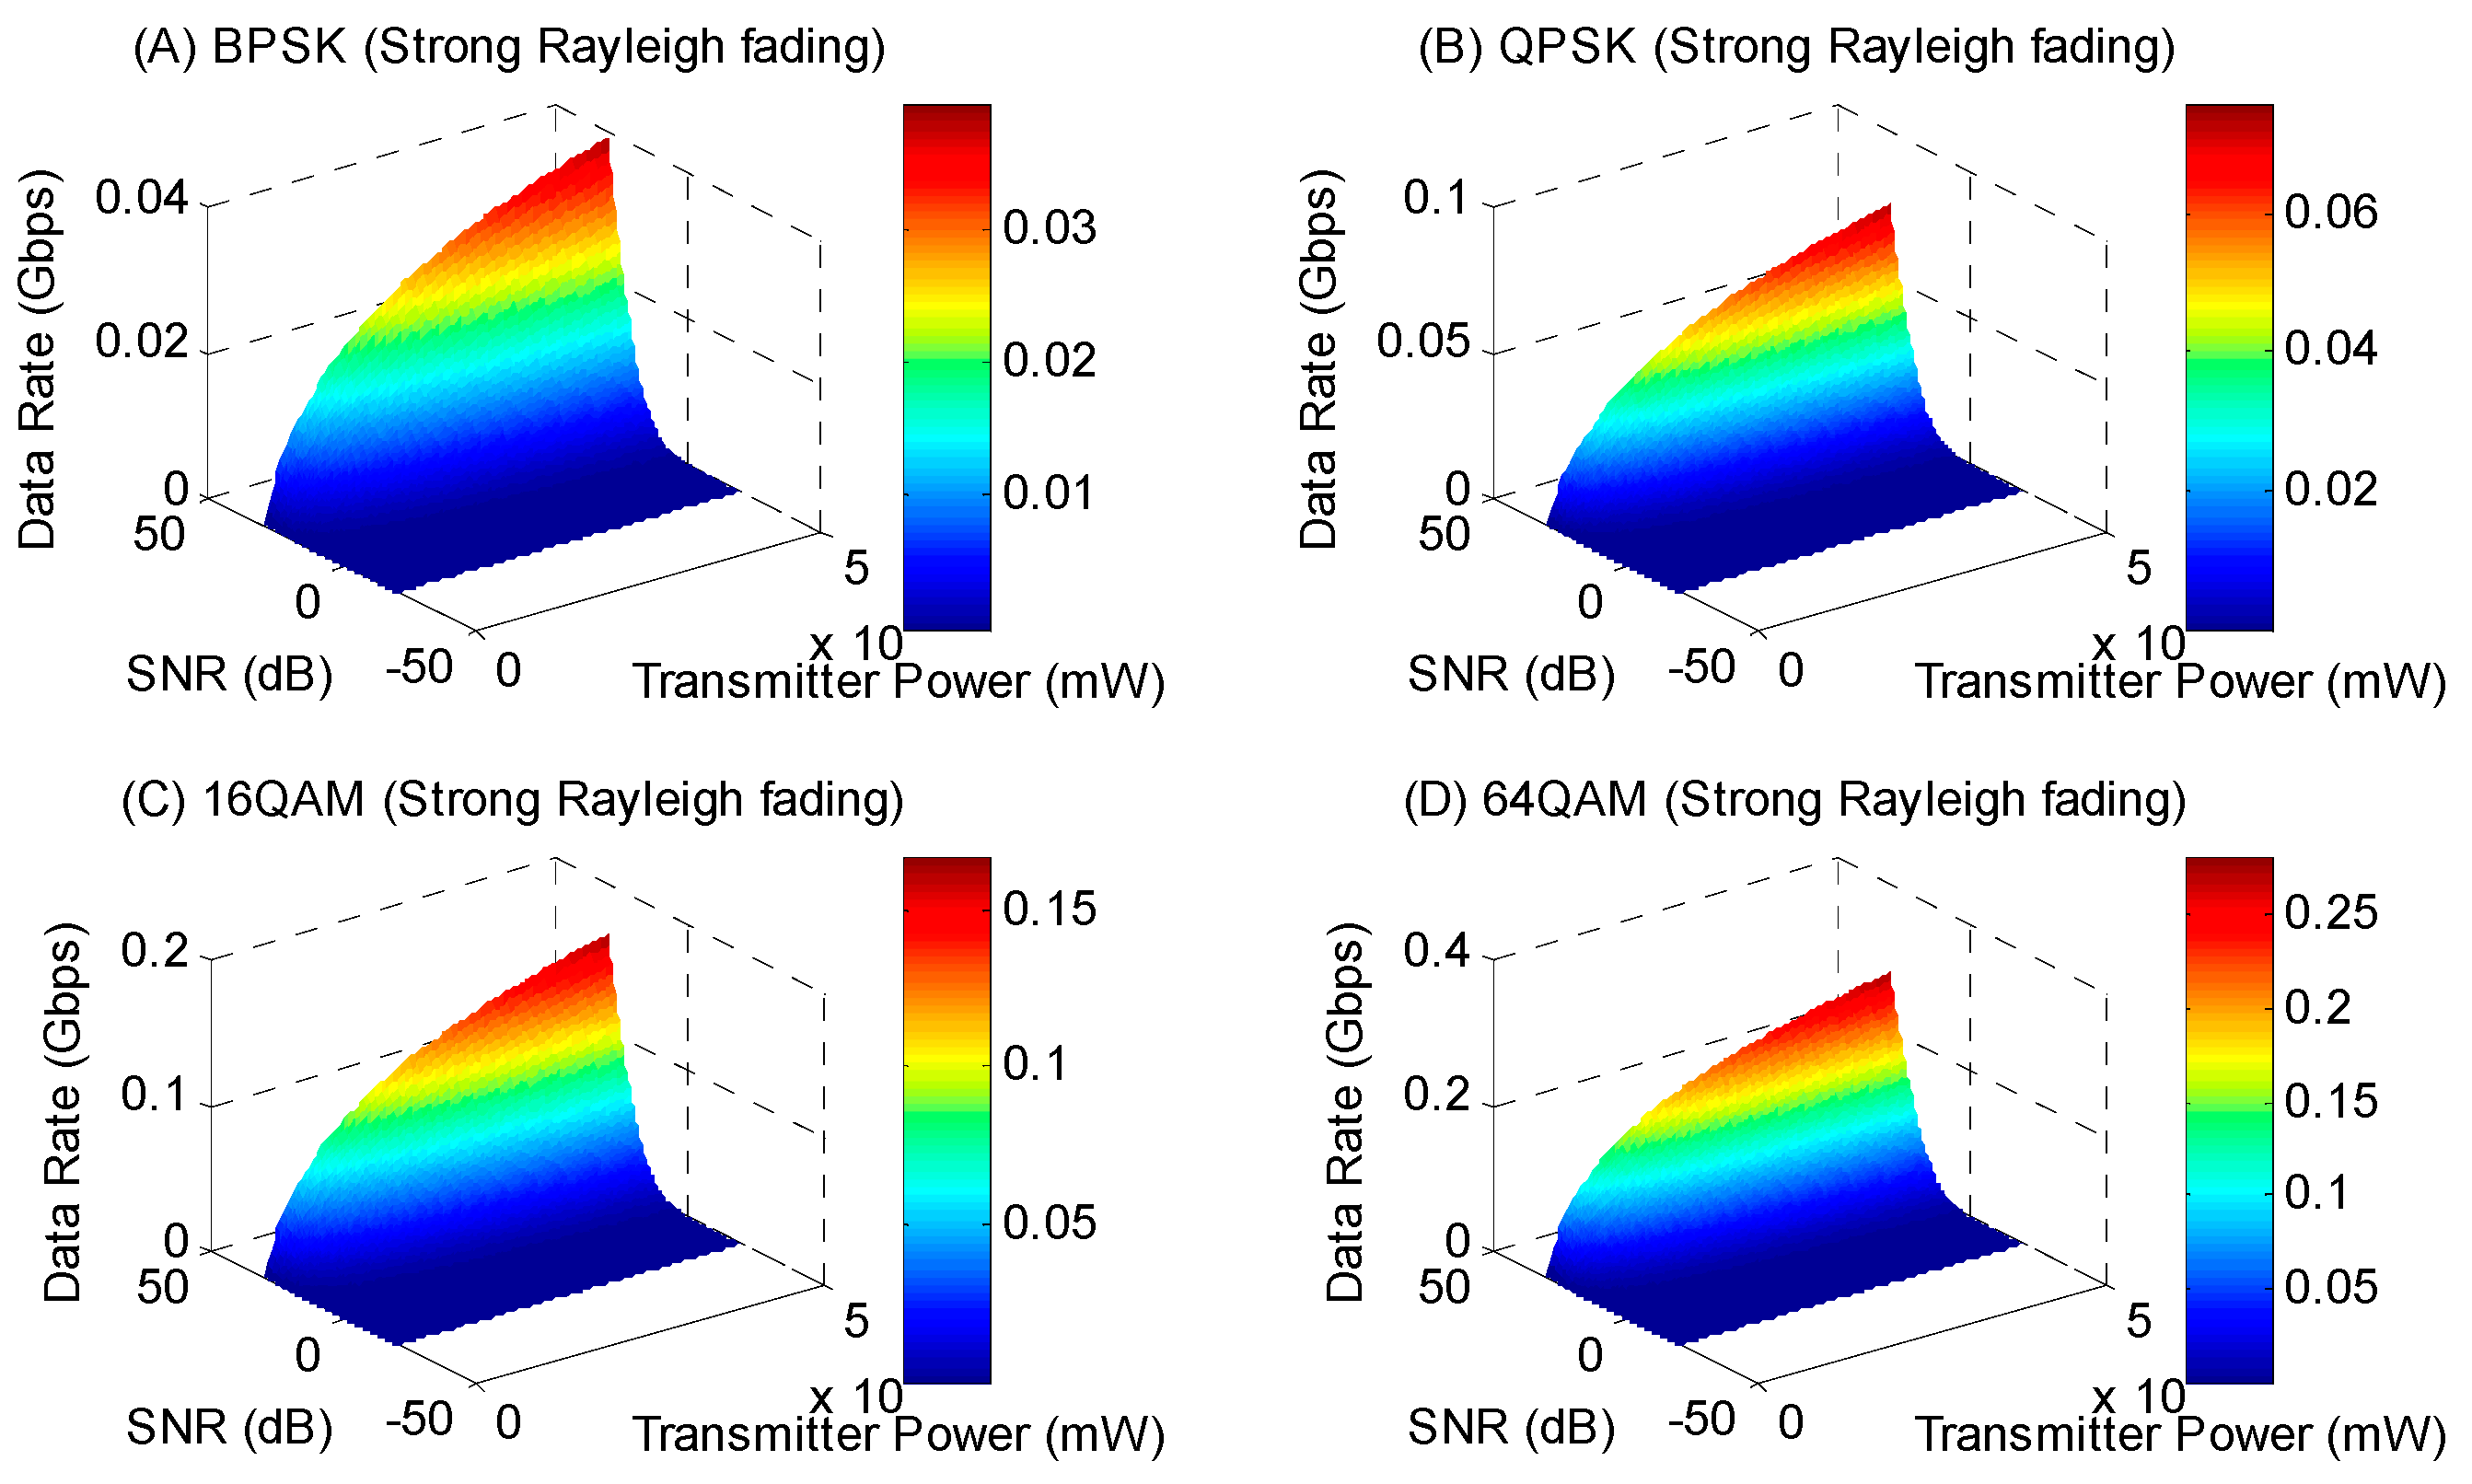
This section uses the Rayleigh distribution for fading to model a wireless optical communication channel with high path loss. Due to the high path loss, the data transmission rate is severely reduced. Figure 14 shows the data transmission rate changes regarding the signal-to-noise ratio and transmitter power for Rayleigh fading for BPSK, QPSK, 16 QAM, and 64 QAM modulations.
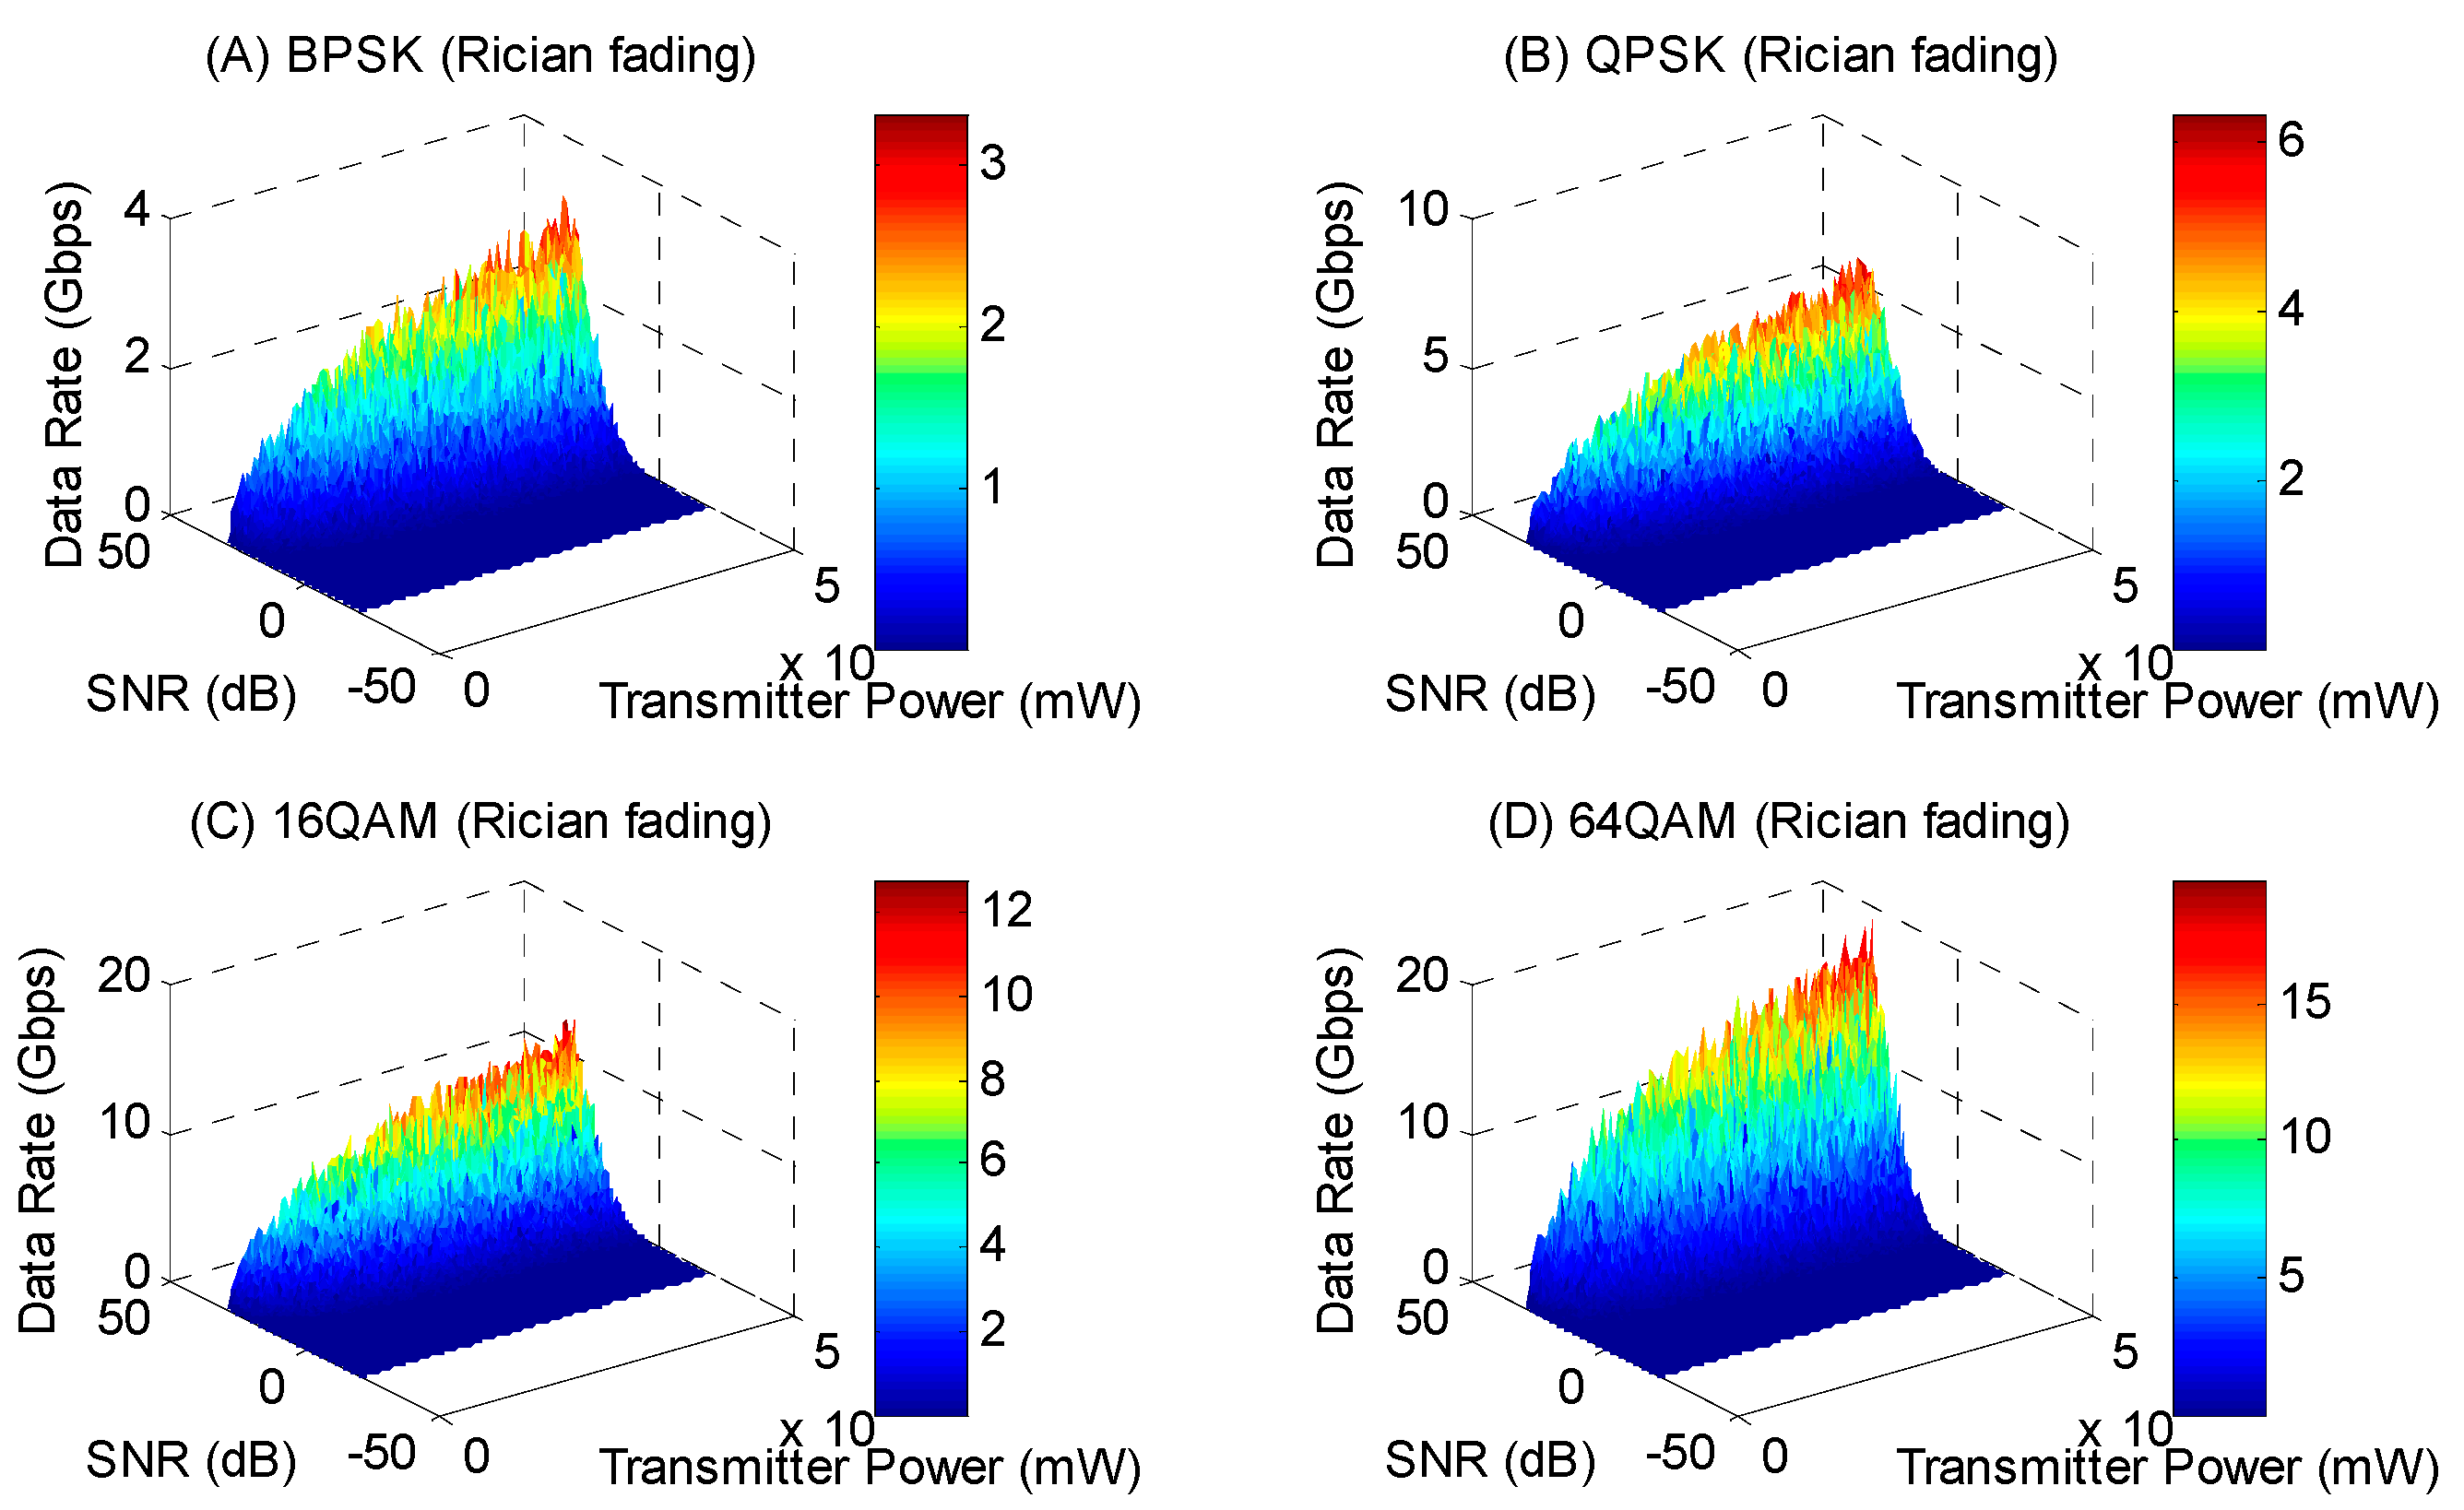
In an optical wireless communication channel affected by Rician fading, the K factor represents the ratio of the power of the direct-line-of-sight path to the power of the scattered paths. In this scenario, the K factor is set to 1. Figure 15 illustrates the data rate concerning the signal-to-noise ratio and transmitter power for Rician fading across BPSK, QPSK, 16 QAM, and 64 QAM modulation schemes.
In power allocation using embedded systems, the trained neural network assigns high power values to the transmitter for wireless optical communication channels characterized by low data rates and high bit error rates. It also considers low transmitter power values for channels with high data rates and a low BER. 
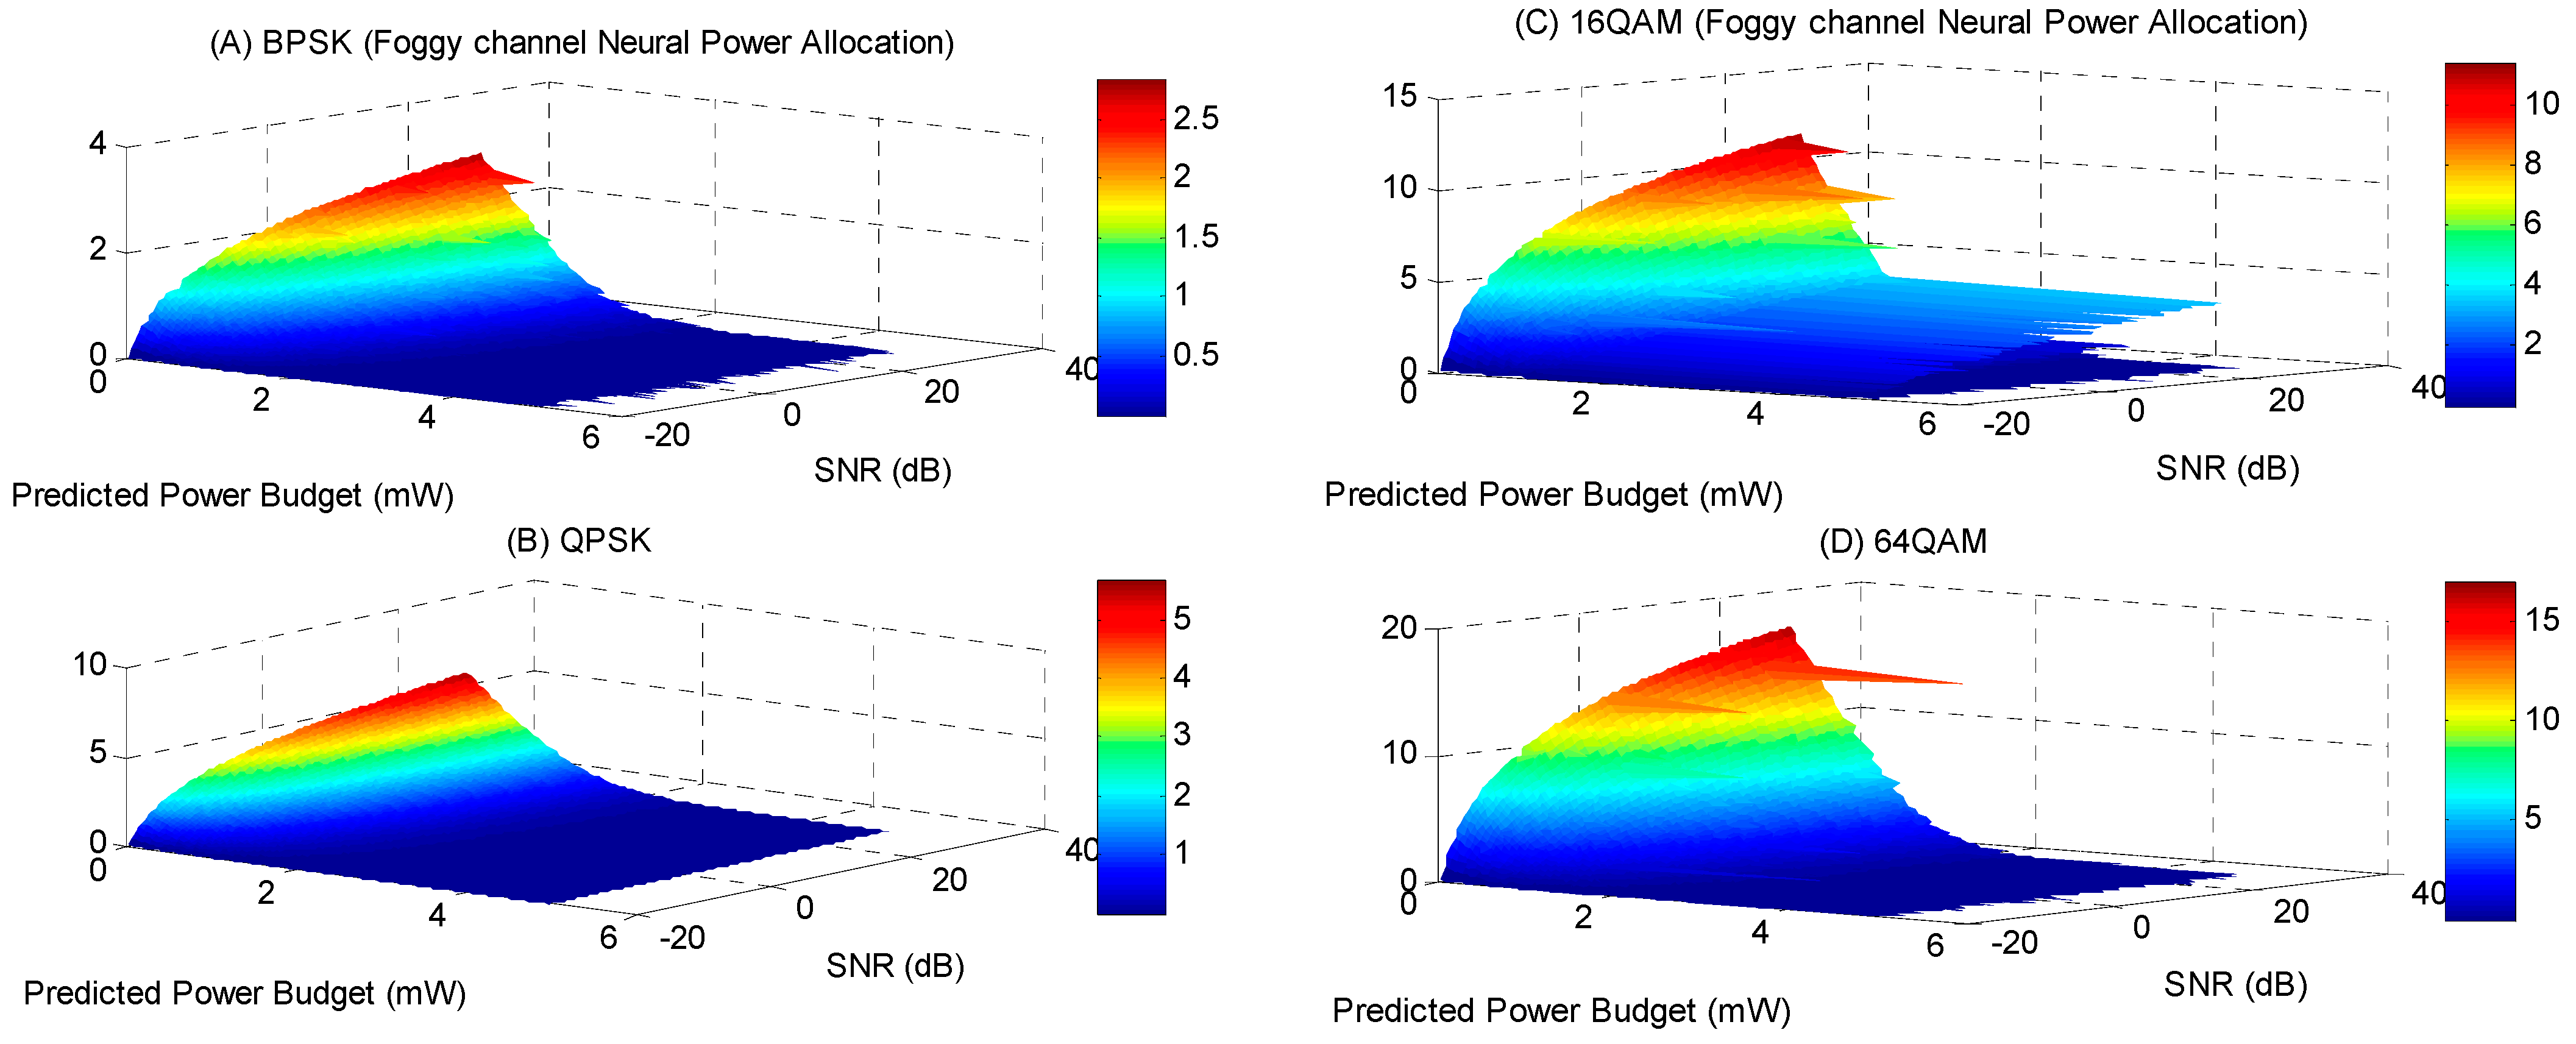
Figure 16 illustrates the variations in the data rate concerning the optimal power allocation predicted by the embedded system and the signal-to-noise ratio for the wireless optical communication channel under normal conditions across different OFDM modulation schemes. In the normal communication channel mode, the embedded power allocation system allocates a maximum power of 5.18 mW and a minimum power of 0.009 mW. Table 6 presents the maximum and minimum output power values from the embedded power allocation system for a normal wireless optical communication channel. Compared to the analytical power allocation system, this system has an average accuracy of 97%. The embedded system’s average power allocation accuracy in an optical wireless communication channel impacted by fog is approximately 96%. In this scenario, the maximum power used in the optical wireless communication channel is 5.04 mW, with a data rate of 0.77 kbps. Its minimum value is 0.007 mW, occurring at a near-optimal data rate. Figure 17 illustrates the power budget allocated by the embedded system for various data rates and SNR values across different OFDM modulation schemes. The embedded power allocation system in optical wireless communication channels is less accurate than in other channels, particularly in conditions of smoke and fog. Table 7 presents the experimental system’s output accuracy for various OFDM modulation schemes. It also displays the minimum and maximum power allocation values.
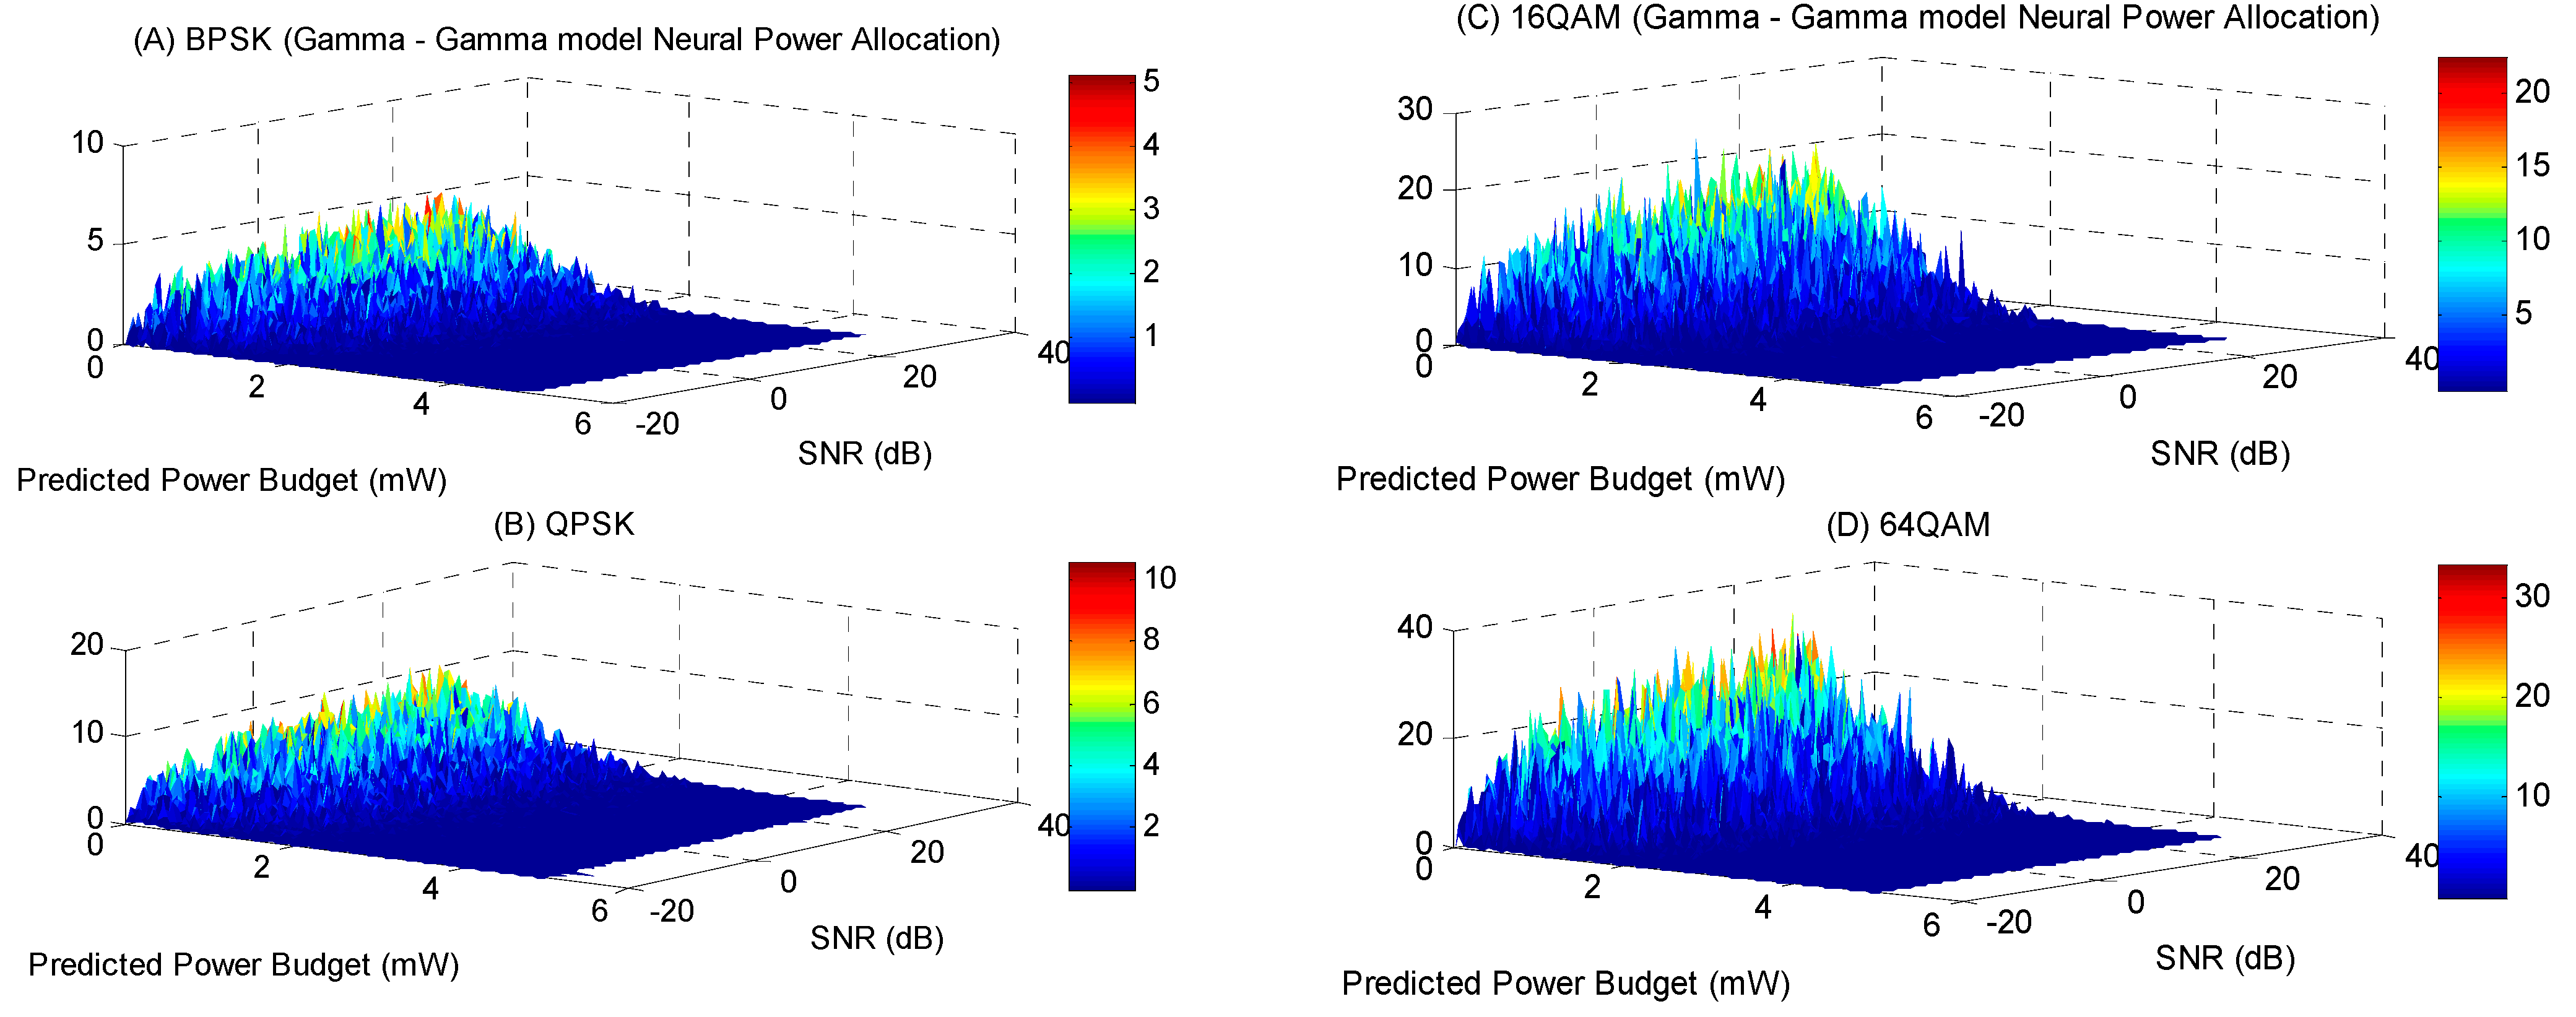
In this case, the embedded power allocation system distributes power for two-channel fading modes on both small and large scales. The proposed experimental system achieves 99% accuracy compared to the analytical power allocation for the channel modeled with a Gamma–Gamma distribution. For the channel using the Gamma–Gamma distribution model, the maximum power allocated by the embedded power allocation system is 4.98 mW, while the minimum value is 0.008 mW. Figure 18 illustrates the power allocation diagram of the embedded system for various data rates and SNR values across different OFDM modulation schemes. The experimental system’s accuracy in the wireless optical communication channel, using the Gamma–Gamma model, is above 99%. Table 8 presents the accuracy of the embedded power allocation system, as well as the minimum and maximum allocated power.
The bit error rate significantly increases in wireless optical communication channels experiencing strong Rayleigh fading. Conversely, the data rate declines significantly. In the embedded power allocation system, the maximum power is 5.02 mW, while the minimum power is 0.008 mW, calculated based on the channel data rate and SNR values. The embedded power allocation system for a channel with strong Rayleigh fading has an accuracy of 97%. Figure 19 illustrates the optimal power allocation for a wireless optical communication channel affected by strong Rayleigh fading, considering the data rate and SNR across different OFDM modulation schemes. The experimental system’s accuracy is above 99% for higher modulation orders in the wireless optical communication channel with strong Rayleigh fading. Table 9 presents the accuracy of the embedded system, as well as the maximum and minimum power allocation values, for the channel with strong Rayleigh fading.
The embedded power allocation system for wireless optical communication channels affected by Rician fading is approximately 98% accurate. Figure 20 illustrates the optimal power allocation for these channels, showcasing the data rate and SNR across different OFDM modulation schemes. The allocated power for various data rates and SNR values is a maximum of 4.98 mW and a minimum of 0.009 mW.
Table 10 presents the accuracy values of the embedded power allocation system for a wireless communication channel experiencing strong Rician fading. In this scenario, the experimental system achieves an accuracy of over 98%. According to the data in Table 10, both the maximum and minimum power allocation values are very close to the analytical values.

4. Conclusions

This paper designed and presented an embedded power allocation system for optical wireless communication channels, including fog, Rayleigh, and Rician fading channels, as well as the Gamma–Gamma channel model. This system can enable real-time optimal power management in noisy, channel fading, and fog communication channels, increase the data transmission rate, and reduce interference in optical wireless communication. The embedded power allocation system for the Rician fading wireless communication channel has the highest accuracy, about 99%. The accuracy of the proposed system for standard and Rayleigh fading channels is 97%, and for fog-affected channels, it is 96%. Also, the maximum data transmission rate for BPSK, QPSK, 16 QAM, and 64 QAM modulations is 2.8 Gbps, 5.6 Gbps, 11.2 Gbps, and 16.81 Gbps, respectively. The data transmission rate is increased by installing the designed embedded power allocation system in the transmitter of optical wireless communication systems, and power consumption is optimized. Due to the optimal management of the power of the communication channels, this system also improves interference. This system can be developed and expanded for other modulations with other optical wireless communication channel conditions.

Author Contributions

M.A. designed and performed simulations, analyzed data, and drafted this manuscript. S.O. supervised, verified, reviewed, and edited this manuscript. G.B. verified and edited this manuscript. All authors have read and agreed to the published version of the manuscript.

Funding

This work was supported by the Shahid Rajaee Teacher Training University under grant number 5973.84.

Data Availability Statement

The original contributions presented in this study are included in the article. Further inquiries can be directed to the corresponding author.

Acknowledgments

This work was supported by the Nano-photonics and Optoelectronics Research Laboratory (NORLab), Shahid Rajaee Teacher Training University, and ICT Research Institute (IRAN Telecommunication Research Center (ITRC)) under Project No 14403.

Conflicts of Interest

The authors declare that they have no known competing financial interests or personal relationships that could have appeared to influence the work reported in this paper.

References

  1. Kapsis, T.T.; Panagopoulos, A.D. Optimum power allocation based on channel conditions in optical satellite downlinks. Wirel. Pers. Commun. 2021, 116, 2997–3013. [Google Scholar] [CrossRef]
  2. Ijaz, M.; Ghassemlooy, Z.; Pesek, J.; Fiser, O.; Le Minh, H.; Bentley, E. Modeling fog and smoke attenuation in free space optical communications link under controlled laboratory conditions. J. Light. Technol. 2013, 31, 1720–1726. [Google Scholar] [CrossRef]
  3. Israr, A.; Israr, A.; Khan, F.; Khan, F. Optimal Modulation Technique for MIMO FSO Link. Wirel. Pers. Commun. 2019, 109, 695–714. [Google Scholar] [CrossRef]
  4. Akbari, M.; Olyaee, S. Performance Analysis of Total Attenuation Effects and Different Values of Transmitter Power on Bit Error Rate and Signal-to-noise Ratio for Free Space Optical Communication. Recent Adv. Electr. Electron. Eng. (Former. Recent Pat. Electr. Electron. Eng.) 2022, 15, 234–242. [Google Scholar]
  5. Ebrahimi, F.; Ghassemlooy, Z.; Olyaee, S. Investigation of a hybrid OFDM-PWM/PPM visible light communication system. Opt. Commun. 2018, 429, 65–71. [Google Scholar] [CrossRef]
  6. Heidari, M.; Akbari, M.; Olyaee, S. Investigating and Improving the Efficiency of Space-time Codes in Visible light Communication Systems based on a Multi-input-multi-output Channel Model. Recent Adv. Electr. Electron. Eng. (Former. Recent Pat. Electr. Electron. Eng.) 2024, 17, 687–697. [Google Scholar] [CrossRef]
  7. Hassan, M.Z.; Hossain, M.J.; Cheng, J.; Leung, V.C.M. Statistical delay-qos aware joint power allocation and relaying link selection for free space optics based fronthaul networks. IEEE Trans. Commun. 2018, 66, 1124–1138. [Google Scholar] [CrossRef]
  8. Shemi, P.M.; Jibukumar, M.G.; Ali, M.A. Nelder-Mead–based power optimization for secrecy enhancement in amplify-and-forward cooperative relay networks. Int. J. Commun. Syst. 2019, 32, e3965. [Google Scholar] [CrossRef]
  9. Yousaf, R.; Ahmad, R.; Ahmed, W.; Haseeb, A. Fuzzy power allocation for opportunistic relay in energy harvesting wireless sensor networks. IEEE Access 2017, 5, 17165–17176. [Google Scholar] [CrossRef]
  10. Li, Q.; Shang, T.; Tang, T.; Dong, Z. Optimal power allocation scheme based on multi-factor control in indoor NOMA-VLC systems. IEEE Access 2019, 7, 82878–82887. [Google Scholar] [CrossRef]
  11. Tao, S.; Yu, H.; Li, Q.; Tang, Y. Performance analysis of gain ratio power allocation strategies for non-orthogonal multiple access in indoor visible light communication networks. EURASIP J. Wirel. Commun. Netw. 2018, 2018, 154. [Google Scholar] [CrossRef]
  12. Cheraghi, M.; Darmani, Y. User power allocation and relay beamforming design for secrecy sum rate maximization in two-way relay networks. AEU-Int. J. Electron. Commun. 2022, 146, 154110. [Google Scholar] [CrossRef]
  13. Wang, C.; Wang, H.-M.; Ng, D.W.K.; Xia, X.-G.; Liu, C. Joint beamforming and power allocation for secrecy in peer-to-peer relay networks. IEEE Trans. Wirel. Commun. 2015, 14, 3280–3293. [Google Scholar] [CrossRef]
  14. Rabbani, H.; Nezamalhosseini, S.A.; Chen, L.R.; Beheshti-Shirazi, A. Optimal power allocation in serial relay-assisted underwater wireless optical communication systems. IET Optoelectron. 2023, 17, 12–23. [Google Scholar] [CrossRef]
  15. Gao, Z.; Eisen, M.; Ribeiro, A. Resource allocation via graph neural networks in free space optical fronthaul networks. In Proceedings of the GLOBECOM 2020—2020 IEEE Global Communications Conference, Taipei, Taiwan, 7–11 December 2020; pp. 1–6. [Google Scholar]
  16. Zhou, H.; Hu, D.; Mao, S.; Agrawal, P. Joint relay selection and power allocation in cooperative FSO networks. In Proceedings of the IEEE Global Communications Conference (GLOBECOM), Atlanta, GA, USA, 9–13 December 2013. [Google Scholar]
  17. Eisen, M.; Zhang, C.; Chamon, L.F.; Lee, D.D.; Ribeiro, A. Learning to optimize: Training deep neural networks for wireless resource management. IEEE Trans. Signal Process. 2019, 67, 2775–2790. [Google Scholar] [CrossRef]
  18. Lionis, A.; Peppas, K.; Nistazakis, H.E.; Tsigopoulos, A.; Cohn, K.; Zagouras, A. Using machine learning algorithms for accurate received optical power prediction of an FSO link over a maritime environment. Photonics 2021, 8, 212. [Google Scholar] [CrossRef]
  19. Aletri, O.Z.; Alahmadi, A.A.; Saeed, S.O.M.; Mohamed, S.H.; El-Gorashi, T.E.H.; Alresheedi, M.T.; Elmirghani, J.M.H. Optimum resource allocation in optical wireless systems with energy-efficient fog and cloud architectures. Philos. Trans. R. Soc. A Math. Phys. Eng. Sci. 2020, 378, 20190188. [Google Scholar] [CrossRef]
  20. Elgala, H.; Wilson, S.K.; Little, T.D.C. Optical polar OFDM: On the effect of time-domain power allocation under power and dynamic-range constraints. In Proceedings of the 2015 IEEE Wireless Communications and Networking Conference (WCNC), New Orleans, LA, USA, 9–12 March 2015; pp. 31–35. [Google Scholar]
  21. Farooqui, M.Z.; Saengudomlert, P. Average transmit power reduction through power allocation for OFDM-based indoor wireless optical communications. In Proceedings of the 8th Electrical Engineering/Electronics, Computer, Telecommunications and Information Technology (ECTI) Association of Thailand-Conference 2011, Khon Kaen, Thailand, 17–19 May 2011; pp. 316–319. [Google Scholar]
  22. Gu, Y. OFDM-CR based Power Allocation Algorithm for Radio Systems. Highlights Sci. Eng. Technol. 2023, 70, 596–603. [Google Scholar] [CrossRef]
  23. Alazwary, K.D.; Qidan, A.A.; El-Gorashi, T.E.H.; Elmirghani, J.M. Deep Learning-based Power Allocation in Rate Splitting Optical Wireless Networks. arXiv 2023, arXiv:2307.08399. [Google Scholar]
  24. Cai, J.; Chen, M.; Huang, N.; Qian, J. DC bias and power optimization for AV-DCO-OFDM in optical wireless communication. Opt. Commun. 2020, 473, 125951. [Google Scholar] [CrossRef]
  25. Tola, G.T.; Fante, K.A.; Catolos, S.N. Efficient power allocation for downlink MIMO-NOMA-based visible light communication systems. Cogent Eng. 2024, 11, 2340234. [Google Scholar] [CrossRef]
  26. Li, Y.; Geng, T.; Tian, R.; Gao, S. Power allocation in a spatial multiplexing free-space optical system with reinforcement learning. Opt. Commun. 2021, 488, 126856. [Google Scholar] [CrossRef]
  27. Li, Y.; Mohsan, S.A.H.; Chen, X.; Tehseen, R.; Li, S.; Wang, J. Research on power allocation in multiple-beam space division access based on NOMA for underwater optical communication. Sensors 2023, 23, 1746. [Google Scholar] [CrossRef] [PubMed]
  28. Deng, X.; Fan, W.; Cunha, T.E.B.; Ma, S.; Chen, C.; Dong, Y.; Zou, X.; Yan, L.; Linnartz, J.-P.M.G. Two-dimensional power allocation for optical MIMO-OFDM systems over low-pass channels. IEEE Trans. Veh. Technol. 2022, 71, 7244–7257. [Google Scholar] [CrossRef]
  29. Bocquet, W.; Hayashi, K.; Sakai, H. Power distribution methods for MIMO-OFDM systems and field experimentations. Wirel. Commun. Mob. Comput. 2009, 9, 1618–1628. [Google Scholar] [CrossRef]
  30. Proakis, J.G.; Salehi, M. Digital Communications, 4th ed.; McGraw-Hill: New York, NY, USA, 2001. [Google Scholar]
  31. Tse, D.; Viswanath, P. Fundamentals of Wireless Communication; Cambridge University Press: Cambridge, UK, 2005. [Google Scholar]
Figure 1. Power allocation in OFDM optical wireless communication using embedded systems and analytical methods.
Electronics 14 01580 g001
Figure 2. Proposed embedded system’s structure.
Electronics 14 01580 g002
Figure 3. Production of the loss function in different epochs.
Electronics 14 01580 g003
Figure 4. Bit error rate in terms of signal-to-noise ratio and transmitter power for BPSK modulation.
Electronics 14 01580 g004
Figure 5. Data rate as a function of signal-to-noise ratio and transmitter power for BPSK modulation.
Electronics 14 01580 g005
Figure 6. The data rate varies based on the transmitter power and the signal-to-noise ratio for QPSK modulation.
Electronics 14 01580 g006
Figure 7. Variations in bit error rate as a function of transmitter power and SNR for QPSK modulation.
Electronics 14 01580 g007
Figure 8. Data rate variations depending on transmitter power and SNR for 16 QAM modulation.
Electronics 14 01580 g008
Figure 9. Changes in bit error rate as a function of transmitter power and SNR for 16 QAM modulation.
Electronics 14 01580 g009
Figure 10. Variations in data rate based on transmitter power and bit error rate for 64 QAM modulation.
Electronics 14 01580 g010
Figure 11. Variation in bit error rate as a function of transmitter power and SNR for 64 QAM modulation.
Electronics 14 01580 g011
Figure 12. The variations in data rate based on signal-to-noise ratio and transmitter power for BPSK, QPSK, 16 QAM, and 64 QAM modulations in foggy channel.
Electronics 14 01580 g012
Figure 13. The data transmission rate changes concerning the signal-to-noise ratio and transmitter power for BPSK, QPSK, 16 QAM, and 64 QAM modulations under the Gamma–Gamma distribution model.
Electronics 14 01580 g013
Figure 14. The data transmission rate changes regarding signal-to-noise ratio and transmitter power for Rayleigh fading for BPSK, QPSK, 16 QAM, and 64 QAM modulations.
Electronics 14 01580 g014
Figure 15. The data rate concerning the signal-to-noise ratio and transmitter power for Rician fading across BPSK, QPSK, 16 QAM, and 64 QAM modulation schemes.
Electronics 14 01580 g015
Figure 16. The variations in the data rate (Gbps) concerning the optimal power allocation predicted by the embedded system and the signal-to-noise ratio for the wireless optical communication normal channel across different OFDM modulation schemes.
Electronics 14 01580 g016
Figure 17. The power budget allocated by the embedded system for various data rates (Gbps) and SNR values across different OFDM modulation schemes in the foggy channel.
Electronics 14 01580 g017
Figure 18. The power allocation diagram of the embedded system for various data rates (Gbps) and SNR values across different OFDM modulation schemes in the Gamma–Gamma channel model.
Electronics 14 01580 g018
Figure 19. The optimal power allocation for a wireless optical communication channel affected by strong Rayleigh fading, considering the data rate (Gbps) and SNR across different OFDM modulation schemes.
Electronics 14 01580 g019
Figure 20. The optimal power allocation for a wireless optical communication channel affected by strong Rician fading, considering the data rate (Gbps) and SNR across different OFDM modulation schemes.
Electronics 14 01580 g020
Table 1. Simulation parameters.
ParameterValueUnit
Modulation orders2–4–16–64--
Number of subcarriers in OFDM64--
Bandwidth 10 MHz
Transmission power range 0.01 to 5mW
Channel range 500m
Fog attenuation coefficient 0.1dB/km
Speed of light 3 × 10 8 m/s
Boltzmann constant 1.38 × 10 23 J/K
Temperature 300K
Sampling rate (example) 10 6 --
Number of symbols to simulate 10 5 --
α for the Gamma–Gamma channel model2--
ꞵ for the Gamma–Gamma channel model2--
Rician K factor1--
Maximum Doppler shift3--
Table 2. Minimum and maximum values for BER and data rate for BPSK modulation.
ParameterData Rate (Gbps)BER
SNR = −20 dB, P = 10 μW 3.69 × 10 7 0.5853
SNR = 10 dB, P = 5 mW2.8 7.34 × 10 15
Table 3. Minimum and maximum BER and data rate values for QPSK modulation.
ParameterData Rate (Gbps)BER
SNR = −20 dB, P = 10 μW 7.38 × 10 7 0.4996
SNR = 10 dB, P = 5 mW5.6 7.37 × 10 7
Table 4. Minimum and maximum BER and data rate values for 16 QAM modulation.
ParameterData Rate (Gbps)BER
SNR = −20 dB, P = 10 μW 1.47 × 10 6 0.3748
SNR = 10 dB, P = 5 mW11.21 2.56 × 10 5
Table 5. Minimum and maximum BER and data rate values for 64 QAM modulation.
ParameterData Rate (Gbps)BER
SNR = −20 dB, P = 10 μW 2.21 × 10 6 0.2916
SNR = 10 dB, P = 5 mW16.81 5.1 × 10 3
Table 6. Minimum and maximum values and accuracy of embedded power allocation system for OWC normal channel.
Modulation SchemeMin Power (mW)Max Power (mW)Accuracy %
BPSK0.0095.1895.88
QPSK0.00914.8196.99
16 QAM0.00984.9698.56
64 QAM0.01235.0198.50
Table 7. Minimum and maximum values and accuracy of embedded power allocation system for OWC foggy channel.
Modulation SchemeMin Power (mW)Max Power (mW)Accuracy %
BPSK0.01064.9394.31
QPSK0.01014.9699.79
16 QAM0.00735.0193.17
64 QAM0.01355.0492.80
Table 8. Minimum and maximum values and accuracy of embedded power allocation system for OWC channel modeled with Gamma–Gamma distribution.
Modulation SchemeMin Power (mW)Max Power (mW)Accuracy %
BPSK0.00994.9699.85
QPSK0.00854.9699.52
16 QAM0.01024.9899.69
64 QAM0.01034.7299.83
Table 9. Minimum and maximum values and accuracy of embedded power allocation system for OWC channel affected by strong Rayleigh fading.
Modulation SchemeMin Power (mW)Max Power (mW)Accuracy %
BPSK0.00995.0294.85
QPSK0.00824.9694.49
16 QAM0.00844.9799.81
64 QAM0.00994.9699.22
Table 10. Minimum and maximum values and accuracy of embedded power allocation system for OWC channel affected by strong Rician fading.
Modulation SchemeMin Power (mW)Max Power (mW)Accuracy %
BPSK0.00934.9698.50
QPSK0.00994.9699.98
16 QAM0.00824.9898.68
64 QAM0.01004.9699.82
Disclaimer/Publisher’s Note: The statements, opinions and data contained in all publications are solely those of the individual author(s) and contributor(s) and not of MDPI and/or the editor(s). MDPI and/or the editor(s) disclaim responsibility for any injury to people or property resulting from any ideas, methods, instructions or products referred to in the content.

