1. Introduction
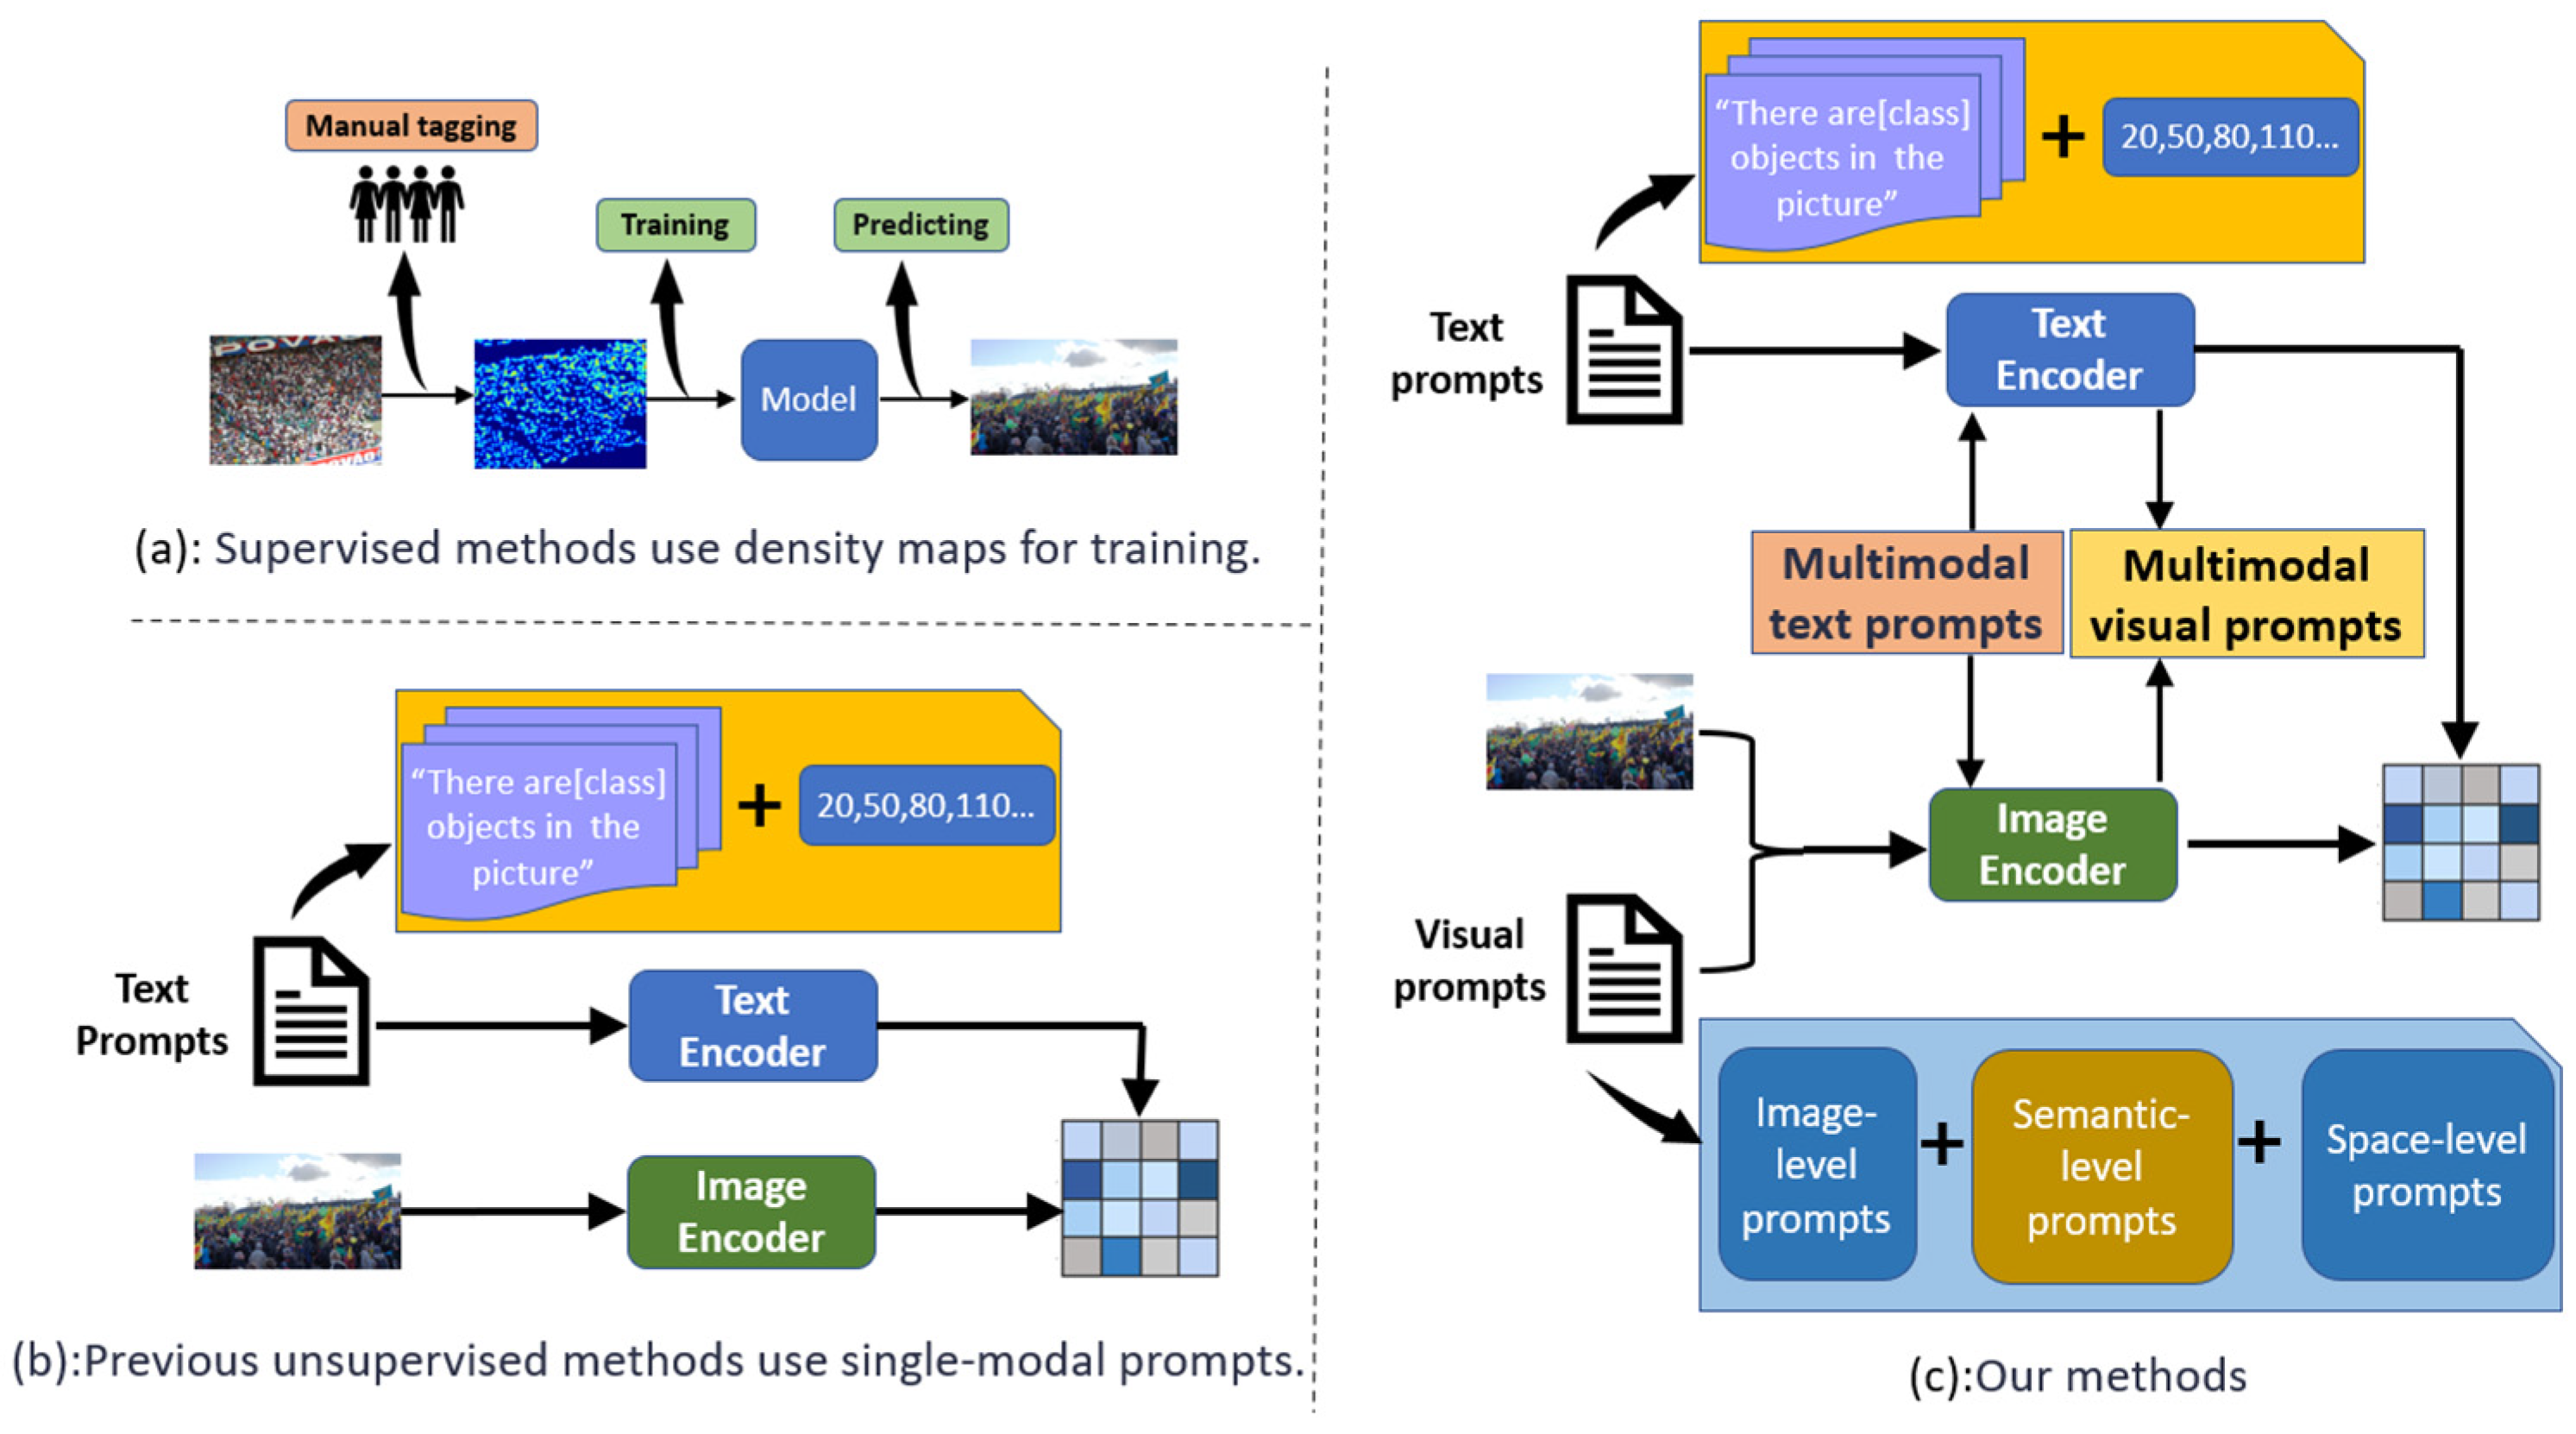
The core objective of dense counting tasks is to accurately estimate the number of objects in images or videos, with critical applications in crowd management, traffic flow monitoring, and environmental surveillance. However, precise counting in dense scenarios faces significant challenges, including mutual occlusion between objects, interference from complex backgrounds, and limitations in image quality, all of which substantially degrade model accuracy.
Traditional dense counting methods predominantly rely on density map regression models [
1,
2,
3], which require precise point-level annotations for each object (e.g., individual heads in crowd scenes) to generate density maps. However, this point-level annotation process is extremely laborious and time-consuming. As illustrated in
Figure 1a, the annotation of datasets, such as NWPU-Crowd [
4], demands substantial human and temporal resources. To mitigate annotation costs, researchers have proposed weakly supervised [
5,
6] and semi-supervised methods [
7,
8], utilizing coarse count-level annotations or combining limited fully labeled data with large-scale unlabeled images for training. Nevertheless, these approaches still heavily depend on labeled data when handling dense or complex scenes, leaving annotation costs prohibitively high. Consequently, reducing the reliance on annotated data while enhancing model performance in unsupervised settings remains a pivotal challenge in dense counting research.
In recent years, language–image contrast pre-trained models, such as CLIP [
9], have achieved remarkable success in various visual tasks, including object detection [
10], semantic segmentation [
11], and image generation [
12], thanks to their excellent transfer learning capabilities. CLIP learns visual representations from large-scale noisy image–text pair data, but when applied to downstream tasks, it often relies on manually designed prompts (e.g., “a photo of [CLASS]”), which are typically based on intuition and experience, making it challenging to achieve optimal results. To address this issue, researchers have developed automated prompt tuning techniques, such as CoOp [
13], CoCoOp [
14], and VPT [
15]. These methods primarily focus on optimizing prompts for a single modality (either visual or textual), as shown in
Figure 1b. However, research on simultaneous prompt tuning for both visual and textual modalities—leveraging the complementary advantages of multimodal data to enhance the accuracy and robustness of dense counting tasks—has not been fully explored.
In dense counting tasks, a natural approach is to discretize the number of objects into multiple intervals, transforming the counting problem into a classification task. Specifically, by calculating the similarity between the image encoder and text encoder embeddings, the most similar image–text pair is selected as the prediction. However, the performance of the zero-shot CLIP model in such tasks is suboptimal because the original CLIP model is primarily trained on single-target images, making it difficult to effectively capture semantic information in complex scenes. Additionally, the non-uniform distribution of objects in the image can cause areas without targets to interfere with the CLIP model, negatively impacting prediction accuracy. To address these issues, the simple single-modal prompt tuning approach—designing independent prompts for each modality and optimizing them through end-to-end supervised training—while improving performance to some extent, often fails to fully leverage the complementary advantages of multimodal data due to the inherent differences between the visual and textual modalities. As a result, the performance improvements are limited. To overcome this limitation, we propose an innovative multimodal deep sharing prompt tuning method, as shown in
Figure 1c. By enabling the deeper fusion of modalities, this method enhances the model’s ability to understand and process complex scenes, thereby significantly improving the accuracy and robustness of dense counting tasks.
Although existing unimodal prompt tuning methods such as CoOp, CoCoOp, and VPT have improved the performance of visual or textual modalities to some extent, they often overlook the complementary nature between modalities, which limits performance improvement in handling complex and dynamic dense counting tasks. To address this issue, DE-CLIP (dense counting CLIP) introduces a multimodal deep shared prompt tuning method that fully integrates the strengths of both visual and textual modalities. Specifically, DE-CLIP constructs ordered textual prompts and cross-modal alignment ranking loss during the training phase, which encourages deep interaction and alignment between the image encoder and the text encoder in the embedding space, enabling the model to better understand and process semantic information in complex scenes. During the testing phase, DE-CLIP employs a multimodal collaborative fusion module that enables bidirectional prompt fusion and deeper modality interaction, effectively overcoming the limitations of traditional unimodal methods. Through this innovative approach, DE-CLIP not only improves the accuracy of dense counting tasks, but also enhances robustness across different datasets and complex scenarios.
We conducted extensive experiments on three challenging datasets to evaluate the effectiveness of DE-CLIP. Notably, on the QNRF dataset, DE-CLIP achieved improvements of 5.6% and 38.8% in MAE (mean absolute error) compared to the existing unsupervised state-of-the-art methods, CrowdCLIP [
16] and CSS-CCNN [
17], respectivley. In cross-dataset validation, our approach even outperforms several popular fully supervised methods [
3,
18], demonstrating superior performance and broad application potential under unsupervised conditions.
The main contributions of this paper are as follows:
- (1)
We propose novel architecture based on CLIP that incorporates a deep-level prompt injection and prompt sharing mechanism, enabling the unsupervised application of dense counting tasks.
- (2)
We introduce cross-modal alignment ranking loss to guide image encoders in learning ordered embedded representations, enhancing the model’s numerical awareness.
- (3)
We present a multimodal collaborative fusion module that addresses the issue of underutilized prompts in multimodal environments by effectively fusing and facilitating deep interaction between prompt information across different modalities.
2. Related Work
Supervised methods for dense counting can be broadly categorized into full supervision and semi-supervision. In mainstream supervised dense counting studies [
2,
19,
20,
21,
22], the primary approach is to estimate the number of objects by regressing density maps. These density maps are typically generated from carefully labeled point annotations. However, such point labels often fail to accurately reflect the size of objects, making density-based methods prone to errors when faced with scale variations. To address this issue, researchers have proposed several solutions. Specifically, some studies [
3,
21] use multi-layer network architecture to learn multi-scale features, enhancing the model’s ability to handle objects of varying scales. Additionally, attention mechanisms play a crucial role in improving feature representation, with common approaches including self-attention mechanisms [
23], spatial attention mechanisms [
24], and other customized attention modules [
25].
In addition to density map regression, other approaches [
26,
27] employ supervised classifiers to categorize the number of objects into different intervals, achieving satisfactory performance in certain scenarios. Furthermore, location-based methods [
28,
29,
30] have gained attention in recent years and can be grouped into the following three main categories: predictive pseudo-bounding boxes [
30,
31], custom location-based maps [
28,
30], and direct regression of point coordinates [
32,
33]. These methods typically do not require complex pre-processing or post-processing steps.
Weakly supervised methods propose using count-level labeling instead of point-level labeling as a supervisory signal, while semi-supervised methods further enhance model performance by combining a small amount of labeled data with a large volume of unlabeled data.
Currently, only CSS-CCNN [
17] and CrowdCLIP [
16] focus on purely unsupervised settings, where the model is trained without any labeled data. The core idea behind CSS-CCNN [
17] is that the distribution of the natural population follows a power-law distribution, which can be leveraged to generate backpropagation errors. CrowdCLIP [
16] trains the encoder to classify images and incorporate prompts for counting. Our experiments show that there remains a significant performance gap between CSS-CCNN [
17] and some popular fully supervised methods [
3,
34].
In recent years, visual-language models (VLMs) for pre-training on large-scale image–text pairs from the Internet have gained increasing attention. These VLMs, pre-trained on vast datasets, exhibit advanced zero-shot image–text matching capabilities. CLIP, in particular, learns an aligned multimodal embedding space and has inspired various applications, including image-level classification. Recently, two CLIP-based target counting models have been proposed, both of which rely on image-level classification. However, these models are limited in their counting granularity and precision. Achieving accurate density estimation using VLMs remains a challenge. In this paper, we explore how to transfer visual language knowledge to unsupervised density estimation tasks. To address this, we propose DE-CLIP, a novel method that transforms the dense counting task into an image–text matching problem, significantly enhancing the performance of unsupervised dense scene counting and offering a new approach to unsupervised dense counting tasks.
3. Methods
3.1. General Architecture
This study proposes a method for optimizing the visual-language model, with the overall framework consisting of two phases: training and testing. Our approach enhances the model’s numerical perception by constructing ordered text prompts and guiding the image encoder to learn ordered embedded representations through cross-modal alignment losses. Through the hierarchical recursive injection of visual information, the text encoder achieves layer-by-layer fusion of textual and visual prompts, improving the representation capability of multimodal information. The image encoder interacts deeply with the text prompts at each layer of the transformer, enhancing the synergy between visual features and text information. The multimodal collaborative fusion module enables bidirectional interaction between textual and visual information through self-attention and cross-modal attention mechanisms, thereby improving the model’s ability to understand and process complex scenes. Finally, the density estimation result is generated by matching the image and text. The overall architecture of the model is shown in
Figure 2.
3.2. Cross-Modal Alignment Ranking Mechanism
To enhance CLIP’s ability to recognize density-related objects, we propose an ordered contrastive fine-tuning strategy. By aligning progressively expanding image regions with corresponding text prompts through novel ranking loss, we enable the image encoder to learn ordered feature representations, improving numerical sensitivity and generalization (pseudocode in
Appendix A).
3.2.1. Image Block Segmentation and Text Prompt Design
While CLIP excels at zero-shot image–text matching, its original design lacks the numerical perception capabilities crucial for dense counting tasks. To effectively count densely packed objects, the model must precisely estimate quantities within images.
To enhance CLIP’s numerical awareness, we propose ordered image–text pairs with progressive scaling. Our method enables the model to learn correlations between visual patterns and quantity levels through structured input–output pairs. Order-preserving ranking loss enforces alignment between expanding visual regions and their textual descriptions, enhancing dense counting accuracy.
First, the input image is divided into a series of square image blocks
of increasing size, with the center point
of the image as the reference. Let
represent the
-th square image block, where
. The side lengths
of each image block satisfy the condition
. As
increases, the side length
of each square block grows, causing the area covered by the image block to expand and the number of objects contained within the block to increase. The image block generation formula is as follows:
represents the -th square image block, denotes the center point coordinates of the image, and represents the side length of the -th image block.
The image blocks follow an incremental pattern, where each block expands progressively from the center. Larger image blocks encompass more objects than smaller ones, ensuring an increasing relationship with the number of objects within each block. To effectively capture the order among these image blocks, we design the corresponding ordered text prompt, defined as follows:
is the initial text prompt, represents the incremental step size, and is the total number of prompts. This set of ordered text prompts is fed into the frozen text encoder to generate text embeddings.
Through structured alignment between visual quantities and text prompts, the model learns progressive object distributions across image regions. This multimodal correlation learning enhances complex scene interpretation by explicitly encoding numerical patterns.
3.2.2. Cross-Modal Alignment Ranking Loss
For the generated image embeddings , where , is the number of image patches; is the dimension of the image patch embedding vector, which is determined by the output layer size of the network; the text embeddings , where ; is the total number of prompts; and is the dimension of the text prompt embedding vector, which is determined by the output layer size of the network. The similarity matrix is calculated using the inner product, i.e., , which represents the similarity between the image embeddings and the text embeddings .
Since the image and text have a pre-set ordering relationship, we aim for the similarity matrix
to have a specific order, thus preserving the ordered alignment of the image and text embeddings. To achieve this, we set
, ensuring that the similarity matrix
is a square matrix. Based on this, we propose cross-modal alignment ranking loss
to fine-tune the image encoder and maintain the order of the image and text embeddings in the corresponding space. This loss function is defined as follows:
represents the similarity between the image embedding and the text embedding , while denotes the similarity between the image embedding and the text embedding . The parameter is a predefined threshold that ensures that the similarity value on the main diagonal is higher than all off-diagonal values.
This loss function establishes ordered alignment between image–text embeddings in the multimodal space, enhancing numerical sensitivity and boosting generalization capabilities through structured feature matching.
3.3. Text Encoder
During model deployment, the text encoder enables joint multimodal optimization through bidirectional visual–textual interaction. This enhanced architecture processes text prompts while dynamically incorporating visual features, establishing cross-modal information exchange across all transformer layers. This deep fusion mechanism significantly improves complex scene comprehension through coordinated feature learning.
3.3.1. Input Layer
The initial text prompt consists of natural language information provided externally, typically used to describe aspects relevant to the image, such as the number of objects present. In the model, the text prompt is first processed through a word embedding layer, resulting in a fixed-dimensional vector representation. This vector comprises three types of information, as follows: . Here, represents the text prompt (similar to a template such as “A Photo of”), corresponds to the word embeddings of the class name, representing the image class, and denotes the vector for the token.
3.3.2. Hierarchical Information Fusion on the Text Side
Next, we progressively inject the text embeddings into each layer of the transformer network up to the -th layer. This hierarchical injection allows the text encoder to progressively refine its understanding of the image by incorporating visual information in each layer, ensuring that both textual and visual cues are deeply integrated at multiple levels of the transformer. This fusion strengthens the model’s ability to understand and interpret complex scenes, enhancing its performance on tasks such as dense counting.
The text prompts used in the recursive injection process across different transformer layers are represented as follows:
At layer , the initial text prompt , the class name embedding , and the token embedding are fed into the network.
In subsequent layers, , the text prompt is replaced by a multimodal prompt , which incorporates visual information. This updated prompt, along with the class name embedding and the token embedding , is then passed into the next layer of the transformer, .
In the first transformer encoding layer, the input prompt is the raw text prompt, which is essentially the text representation without significant modal processing. In each subsequent layer, the text prompt is combined with the visual prompt. This combined prompt undergoes processing through the cross-modal attention mechanism in the multimodal collaborative fusion module, allowing the text prompt to progressively integrate visual information into the multimodal prompt representation.
This hierarchical integration process enables the progressive fusion of multimodal features through layered inputs, significantly strengthening cross-modal learning capabilities. The deep prompt injection mechanism drives multimodal transition by adaptively enriching text prompts with visual context across transformer layers, achieving comprehensive visual–textual fusion in deep network stages.
3.3.3. Output Layer
After each layer is processed, the text prompts are linearly transformed to ensure that the output dimensions align with the input requirements of the next transformer layer. Following this transformation, the resulting text prompt (i.e., the merged text prompt) is passed to the next layer. Through the recursive fusion across multiple transformer layers, the model generates a deeply integrated multimodal feature representation, with the final text code encapsulating rich visual and linguistic information.
In the design of the text encoder, a hierarchical recursive injection mechanism is employed to gradually fuse textual prompt and visual prompt information. This process enhances the text prompt in each layer, allowing the final generated text encoding to fully capture the shared semantics between the image and the text. This design not only improves the expressiveness of the text information, but also strengthens the synergy between cross-modal data, enabling the model to better understand and handle complex multimodal tasks.
3.4. Image Encoder
To further enhance the cooperative optimization of multimodal information, this study designs an image encoder that processes the input image to generate the final image representation. Simultaneously, the text prompt is integrated, enabling bidirectional information interaction between the visual data and the textual prompt.
3.4.1. Input Layer
The input image is first processed through patch embeddings to obtain a fixed-dimensional vector representation. This generated vector contains three types of information, as follows: , where represents the token encoding, represents the initial visual feature information, and represents the image patch information.
3.4.2. Hierarchical Information Fusion on the Image Side
Next, we inject into each layer of the transformer network up to the -th layer, similar to the text prompt injection process.
The image prompts for the recursive injection process at different transformer layers are represented as follows:
At layer , the initial image prompt , patch information , and token embeddings are input.
In subsequent layers , the image prompt is replaced by a multimodal prompt after incorporating the text information. This updated prompt is then input into the next transformer layer , along with the patch information and token embedding .
Through this deep visual prompt mechanism, visual features are progressively updated and multimodally fused at each layer. Ultimately, these prompts enable the model to capture the multimodal features of the image at a deeper level, further enhancing the alignment between the visual and textual branches.
3.4.3. Output Layer
After each layer of processing, the image prompts are linearly transformed to ensure that the output dimensions align with the input requirements of the transformer layer. Once this processing is complete, the image prompts—representing the deeply fused and processed image features—are fed into the next transformer layer. Ultimately, after passing through multiple transformer layers, the resulting image code captures all relevant information from the image in a deep feature representation.
The design of the image encoder incorporates a deep multimodal fusion mechanism, enabling visual features to interact extensively with text prompts at each transformer layer. This ensures that the image features are richly represented within the multimodal context. Through the hierarchical recursive injection mechanism, the image encoder effectively generates image embeddings that integrate cross-modal information, thereby enhancing the model’s performance in multimodal tasks. This design not only improves the semantic representation of images, but also strengthens the synergy between cross-modal features, allowing the model to better capture the interrelationships between images and text.
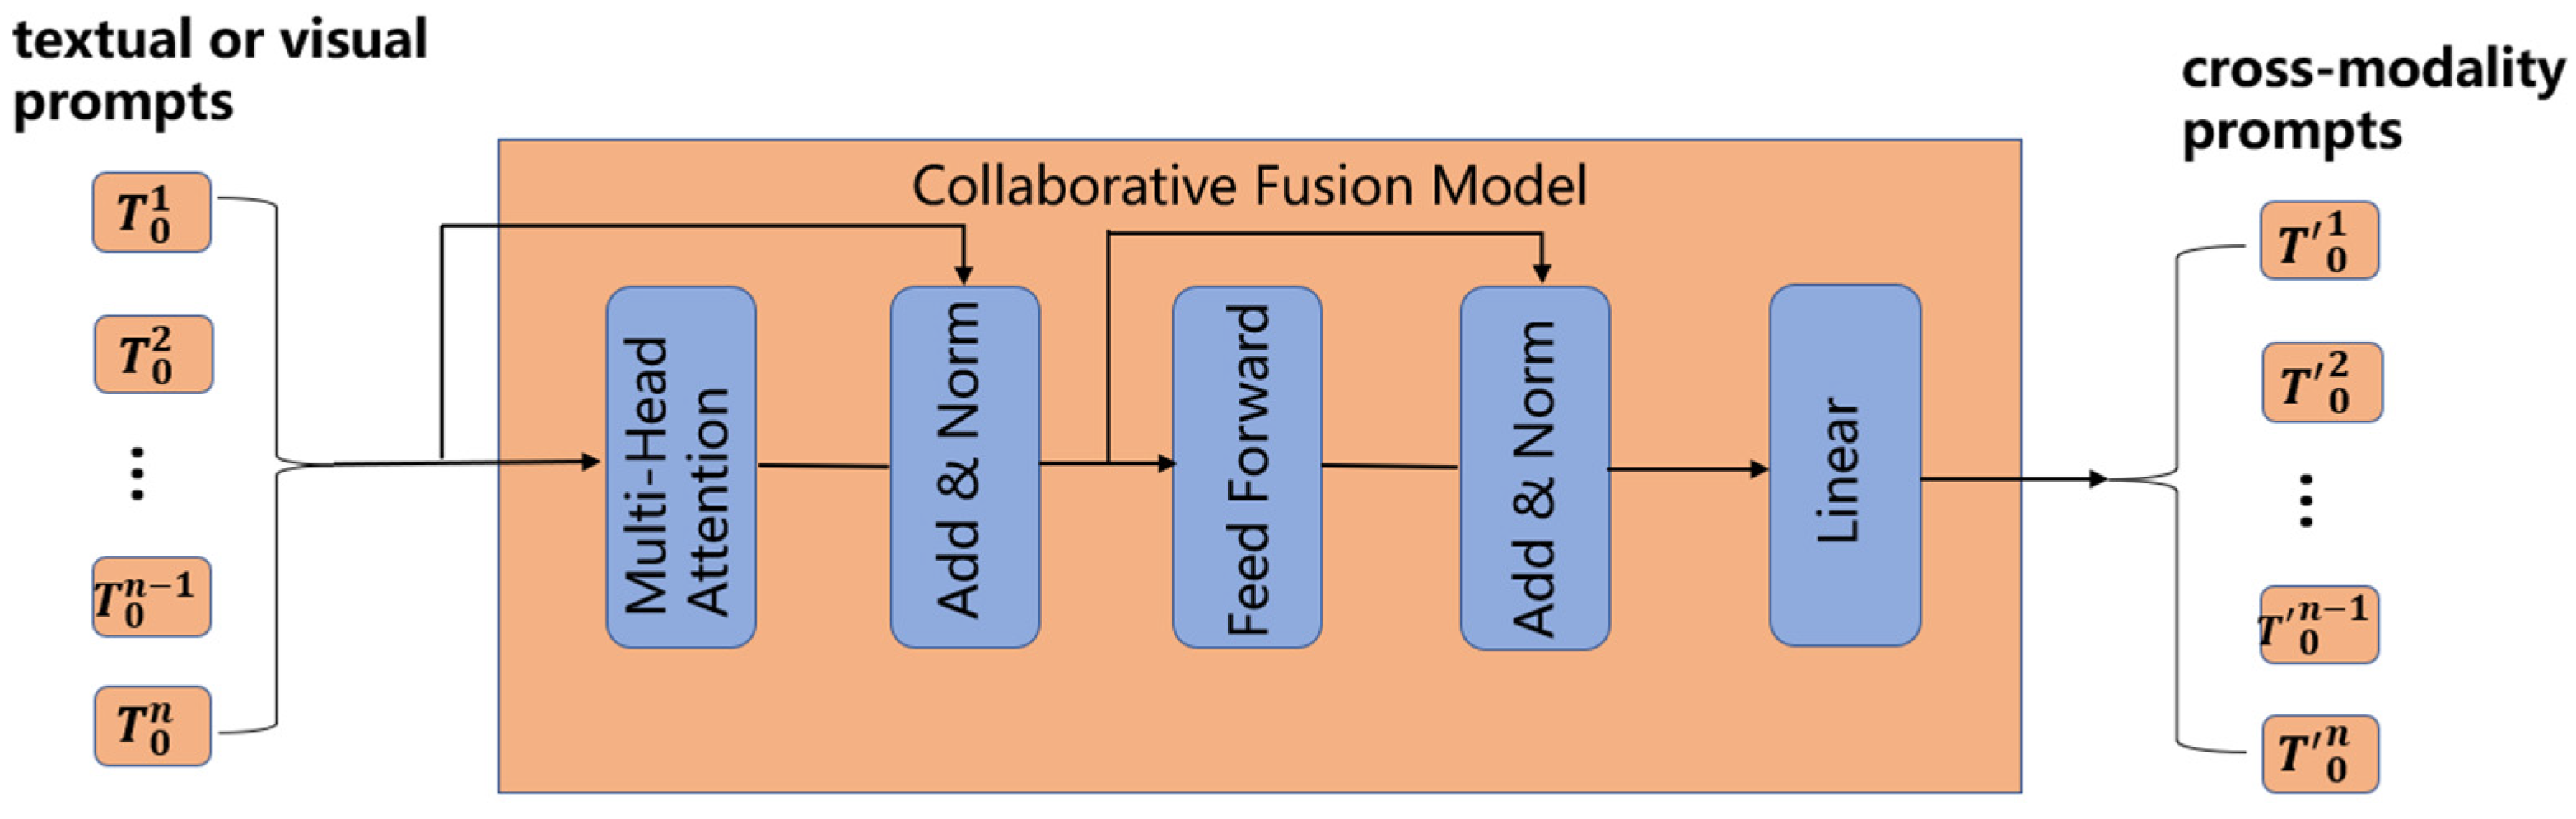
3.5. Multimodal Collaborative Fusion Module
To integrate textual and visual prompts, this study introduces a multimodal collaborative fusion module, as shown in
Figure 3. The module aims to enhance the model’s ability to understand complex scenes, particularly when processing both textual and visual information, by improving the collaborative optimization of multimodal data through bidirectional interaction and deep feature fusion. The lightweight structure of the module ensures that textual and visual prompts are fully integrated at each transformer layer, thereby enhancing the expression and processing capabilities of cross-modal features. The pseudocode can be found in
Appendix B.
The multimodal collaborative fusion module primarily consists of the following key components:
Input Layer: The textual prompt and visual prompt are embedded representations obtained from the text encoder and image encoder, respectively.
Multi-Head Attention Mechanism: This mechanism is divided into two layers: the self-attention layer and the cross-modal attention layer.
Self-Attention Layer: This layer computes the self-attention within each modality separately, i.e., for the textual prompt and the visual prompt . It captures the internal feature relationships within each modality, such as the contextual relationships between words in the textual prompt and the correlations between different regions in the visual prompt.
Cross-Modal Attention Layer: This layer uses cross-attention to calculate the attention weights between the textual prompt and the visual prompt . This enables the interaction of information and feature fusion between the two modalities. By capturing the cross-modal correlations, it provides the model with a richer, more comprehensive multimodal context.
Residual Connection and Normalization: After the multi-head attention mechanism, the residual connection and normalization layer is adopted. Residual connections add input features to attentional output features, alleviating the problem of disappearing gradients. Specifically, textual prompts and visual prompts will be added to input features to generate and , a sum after cross-modal attention output. Normalization is performed on the fused features to accelerate convergence. The normalized textual and visual features are and , respectively.
Residual Connection: The input features from the text prompt and the visual prompt are added to the attention output. This helps to mitigate the issue of vanishing gradients. Specifically, the residual connections generate and by adding the input features to the output of the cross-modal attention layer.
Normalization: The fused features are then normalized to accelerate convergence and improve training stability. The normalized textual and visual features are denoted as and , respectively.
Feedforward Network: The fused features undergo further nonlinear mapping to enhance the model’s ability to express complex patterns. This operation transforms and into higher-dimensional feature representations. After passing through the feedforward network, the resulting textual and visual features are denoted as and , respectively. These features capture more complex semantic and visual patterns, representing the integrated textual and visual information.
Linear Transform Layer: A linear transformation is applied to adjust the merged prompts to dimensions that are consistent with the input requirements of the next transformer layer, ensuring compatibility for subsequent processing. This transformation aligns and with the dimensional requirements of the following layer, maintaining consistency between the input and output dimensions of the model. The resulting features, and , represent the merged textual and visual prompts, which are now ready for further processing in the next layer or the final output stage.
Output Layer: After a series of operations, including self-attention, cross-modal attention, residual connections, normalization, feedforward network processing, and linear transformations, the fused text prompt and fused visual prompt are generated. These prompts now contain integrated features from both the textual and visual modalities, making them ready for use in the next transformer layer or for the final model output. captures the semantics of the text, along with its relationship to the visual information, while incorporates visual features that are enhanced by the text information, strengthening the semantic associations within the visual data.
The multimodal collaborative fusion module enables two-way information interaction between the textual prompt and visual prompt through effective information fusion. It combines the outputs of both self-attention and cross-modal attention to integrate features from the textual and visual modalities.
The two-way information interaction mechanism ensures a bidirectional flow of information between text prompts and visual prompts, enabling full integration of both modalities within each transformer layer. This deep interaction not only enhances the information representation capabilities of each individual modality, but also strengthens the synergy of cross-modal features. Consequently, the model’s ability to understand and process complex scenes is significantly improved.
5. Ablation Experiments
All experiments in this section were conducted on the QNRF dataset [
35], focusing on the following aspects:
5.1. Impact of Text Prompts Design
As shown in
Table 4, firstly, we systematically investigated the impact of different numeric ordering text prompts on model performance. To achieve this, we designed a series of experiments by adjusting the numerical sequence of ranking prompts to evaluate their specific effects on the model’s counting ability. In a key experiment, we set the rank prompt to [‘20’, ‘55’, ‘90’, ‘125’, ‘160’, ‘195’], corresponding to parameters
= 20 and
= 35.
The experimental results demonstrate that, under this particular configuration, the DE-CLIP model achieves optimal performance, significantly outperforming the other rank prompt configurations. This outcome indicates that DE-CLIP is highly effective at learning from numerically ranked text and capturing a meaningful representation of the number of objects in an image.
Further analysis reveals that appropriate numerical ranking prompts not only provide extensive numerical information, but also create a contextual framework that enhances the model’s accuracy in counting. This capability makes DE-CLIP particularly well suited for object counting tasks in complex scenarios.
To comprehensively evaluate the impact of different rank prompts, we tested a variety of rank prompt configurations, varying both the starting values () and the step sizes (). The results demonstrated that DE-CLIP consistently outperformed the original CLIP model in counting performance across all prompt configurations. This consistent superiority underscores the effectiveness and robustness of DE-CLIP in learning and utilizing numerical ordering prompts.
5.2. Prompt Depth Sensitivity Analysis
In
Figure 5, we detail the specific effects of varying prompt depths on the performance of the DE-CLIP model’s text encoder and visual encoder. Prompt depth refers to the number of layers at which the hint vector is inserted into the model architecture, effectively determining the feature space layer to which the hint vector is applied. By systematically adjusting the prompt depth, we gain insights into how hint vectors operate at different levels of the model’s feature hierarchy.
Our experimental results indicate that the overall performance of the DE-CLIP model improves significantly as the prompt depth increases gradually. This trend suggests that deeper feature spaces are more effective at integrating the information conveyed by the prompt vectors, thereby enhancing the model’s ability to comprehend the semantic relationships between images and text. Specifically, when the prompt vector is inserted into the model’s mid-to-upper feature layers (e.g., layers five to nine), the model more effectively captures complex semantic relationships and fine-grained information. This leads to improved accuracy and robustness in counting tasks.
These findings demonstrate that the strategic placement of hint vectors within deeper layers of the model architecture plays a crucial role in optimizing DE-CLIP’s performance, particularly in understanding and processing intricate semantic associations in complex scenes.
In particular, when we inserted randomly initialized prompt vectors into the frozen model’s deep feature space, the model’s performance exhibited greater sensitivity to prompt depth. This indicates that the deep feature space not only integrates prompt information more effectively, but also relies more heavily on the initialization and configuration of the prompt vectors. Therefore, it is crucial to design an appropriate initialization strategy for the hint vectors to fully leverage the potential of deep prompts.
By increasing the hint depth, we significantly enhanced the performance of DE-CLIP compared to earlier shallow prompt methods, such as those using a hint depth of one in COCO. Shallow prompting typically captures only basic feature information, which limits its ability to handle complex semantic relationships and diverse scenes. In contrast, deep prompts operate within higher-level feature spaces, providing richer and more detailed contextual information. This enhancement improves the model’s object counting capabilities in complex scenes, demonstrating the superiority of deep hinting over shallow methods.
Further experimental results demonstrate that DE-CLIP achieves optimal performance when the prompt depth is set to nine. Compared to shallow prompt methods, DE-CLIP exhibits significantly improved counting accuracy and stability. Selecting the optimal prompt depth not only enhances the model’s performance, but also strikes a favorable balance between computational efficiency and resource utilization. A prompt depth that is too shallow may lead to insufficient information fusion, while an excessively deep prompt depth could introduce redundant information or increase computational complexity.
Additionally, we conducted several ablation experiments to analyze the specific effects of different prompt depths on the features at each level of the model. The results indicate that deep prompting not only enhances the model’s ability to capture high-level semantic information, but also increases its sensitivity to low-level visual features to a certain extent. This multi-level information fusion mechanism enables DE-CLIP to perform better in processing diverse and complex image scenes.
5.3. Encoder Collaborative Optimization Validation
We further investigated the specific effects of fine-tuning the image encoder or text encoder separately on the counting performance of the DE-CLIP model. To achieve this, we designed a series of comparative experiments to elucidate how fine-tuning strategies applied to different encoders impact overall model performance. The experimental results, presented in
Figure 5, illustrate the counting accuracy and stability of the model under various fine-tuning configurations.
Firstly, the model’s counting performance significantly decreased when only the text encoder was supplemented with prompts. This suggests that enhancing the text encoder’s ability to interpret image content in isolation is insufficient to improve the overall counting task. Specifically, while the text encoder becomes better at processing and analyzing numerical information from the text prompts, the lack of simultaneous optimization of the visual information causes discrepancies when integrating multimodal data, ultimately reducing counting accuracy.
Similarly, when prompts were added exclusively to the image encoder, the model’s performance also declined. This may be because enhancing visual feature extraction through image side prompts does not concurrently optimize text understanding, leading to reduced efficiency in matching and fusing textual and visual information. Unilateral optimization of the image encoder prevents the model from fully leveraging the numerical information contained in the text prompts, thereby limiting its object counting capabilities in complex scenes.
In contrast, adding a shared prompt to both the text encoder and the image encoder resulted in significant performance improvements, achieving the best results. This outcome underscores the importance of multimodal collaborative optimization for enhancing the model’s counting ability. By incorporating a shared prompt into both encoders, the model can simultaneously receive and integrate numerical information from both textual and visual inputs, leading to more accurate object recognition and counting. Specifically, the shared prompt facilitates synchronous optimization of text and image features, enhances semantic consistency, and promotes information complementarity between the two modalities. This enables DE-CLIP to more effectively capture the number and distribution of objects within an image.
Furthermore, additional analysis revealed that the shared prompt not only improved counting accuracy, but also significantly enhanced the model’s robustness across different scenes and complex backgrounds. The model demonstrated better adaptability to diverse image contents and variations, achieving stable object count estimations through a unified prompt mechanism. This collaborative optimization strategy effectively mitigates the information asymmetry that can arise from single-end optimization, ensuring coordinated and efficient fusion of multimodal information.
In summary, fine-tuning both the image encoder and the text encoder with shared prompts is crucial for maximizing DE-CLIP’s performance in object counting tasks. This approach leverages the strengths of both modalities, resulting in enhanced accuracy, stability, and robustness in handling complex and diverse image scenarios.
5.4. Optimization of Image Slice Quantity
Finally, we conducted an in-depth study on the specific effects of varying the number of image slices (denoted as p) during the training stage of the DE-CLIP model. The number of image slices p refers to the number of regions into which an image is segmented during training. This parameter is crucial for enabling the model to perform fine-grained analysis and feature extraction.
To systematically evaluate the optimization impact of different
p values, we designed a series of experiments and summarized the results in
Table 5. These experiments aimed to determine how varying the number of image slices influences the model’s ability to accurately and efficiently process and count objects within an image.
Our findings indicate that the number of image slices p significantly affects the model’s performance. An optimal p value facilitates effective segmentation, allowing the model to capture detailed features and perform precise object counting. Conversely, too few slices may result in inadequate feature representation, while too many slices could lead to increased computational complexity without substantial performance gains.
Table 3 presents the experimental results, highlighting the relationship between the number of image slices and the model’s counting accuracy and stability. The data demonstrate that there is a balanced range of
p values where DE-CLIP achieves peak performance, effectively managing the trade-off between detailed feature extraction and computational efficiency.
In summary, the number of image slices p is a pivotal parameter in the training of DE-CLIP, directly influencing its ability to perform detailed image analysis and accurate object counting. Properly selecting and optimizing p ensures that the model can efficiently handle fine-grained features while maintaining robust performance across diverse and complex image scenarios.
The experimental results demonstrate that the DE-CLIP model achieves optimal performance in both mean absolute error (MAE) and mean squared error (MSE) metrics when the number of image slices (p) is set to five or six. Specifically, configurations with p = 5 and p = 6 significantly outperform other p value settings on these evaluation metrics, indicating that an appropriate number of image slices effectively enhances the model’s counting accuracy and stability.
When the p value is low, the image is divided into fewer slices, each containing more comprehensive information but less detail. This configuration can reduce the model’s sensitivity to subtle changes in the number of objects within the image, thereby affecting counting accuracy. For instance, at p = 4, although there is an improvement in model performance, both MAE and MSE remain higher compared to p = 5 and p = 6. This suggests that the number of image slices is insufficient to fully capture the distribution and quantity information of objects in complex scenes.
Conversely, when p is set to five or six, the image is segmented into a moderate number of slices, each containing adequate contextual information and fine-grained feature details. This balance enables the model to identify and count objects with greater precision. The experimental results show that DE-CLIP achieves the lowest MAE and MSE values at p = 5 and p = 6, indicating that the model can best integrate and utilize the image data within this range of slice numbers for efficient object counting.
However, as the p value increases further (e.g., p = 7, p = 8, p = 9), the image is divided into more slices, resulting in smaller slice areas with relatively limited contextual information. This can hinder the model’s ability to effectively integrate global information, thereby negatively impacting overall counting performance.
In summary, through a systematic study of the effects of different numbers of image slices (p values) on DE-CLIP model performance, we found that appropriate p value settings (specifically p = 5 and p = 6) significantly improve the model’s counting accuracy and stability. Based on these findings, p = 5 was selected to finalize the experimental results.
5.5. Validation of Multimodal Fusion Effectiveness
We conducted ablation experiments to compare the performance of using image prompts, text prompts, and a combination of both. Specifically, we designed three experimental setups, as follows:
Text-only Prompt: In this experiment, the model relies solely on the text prompt for inference, using only the text input to generate embedding vectors through the text encoder, while ignoring image information.
Image-only Prompt: In this experiment, the model relies solely on the image prompt for inference, using only the image input to extract features through the image encoder, while ignoring text information.
Text–Image Fusion: In this experiment, the model combines both text and image prompts, utilizing both features for inference through a multimodal fusion mechanism.
From the results shown in
Table 6, it can be seen that the text–image fusion setup achieved the best performance across all evaluation metrics. Specifically, the MAE and MSE were 267.5 and 464.4, respectively, significantly lower than the results of using only text or image prompts, indicating that the fusion method performs better in reducing prediction errors.
In the text-only prompt experiment, the MAE was 397.6 and the MSE was 755.2, showing that text prompts perform poorly without image information, especially when handling details and high-density areas, where the spatial structure of the image cannot be accurately captured. In contrast, the image-only prompt setup showed some improvement with a MAE of 342.1 and MSE of 641.3. However, due to the lack of contextual information provided by the text, the model still could not make accurate judgments in complex scenarios.
The text–image multimodal prompt demonstrated its advantages in this experiment. By combining the semantic information from the text prompt and the visual features from the image prompt, the model was able to understand the input data more comprehensively, leading to significant performance improvements in the QNRF dataset. This result validates the effectiveness and advantages of our proposed text–image fusion method in multimodal tasks.


