1. Introduction
Evaluating enterprise performance, especially in predicting directional stock price movements, remains a notoriously difficult and multifaceted challenge. The volatile nature of financial markets, compounded by the complex, time-varying interactions among enterprises, makes accurate predictions particularly elusive [
1]. On one hand, the Structural Embeddedness Theory [
2] suggests that corporations acquire external resources and business information through business networks, where their positionality within these networks significantly impacts their competitive advantage. On the other hand, according to the extended five forces model [
3], an enterprise’s competitiveness and business performance are shaped by interactions with competitors, collaborators, and other hidden influencers. Traditional economic models, primarily relying on correlation analysis [
4,
5], often focus on individual firms, while overlooking the influence of interconnected enterprises, leading to suboptimal performance in stock price prediction. Early efforts employed static network models to represent enterprise relations [
6,
7,
8], but these approaches fail to capture the dynamic nature of inter-corporate relationships [
9,
10]. Recent advances in Convolutional Neural Networks (CNNs) and Long Short-Term Memory (LSTM) have made strides in capturing temporal dependencies [
11,
12,
13]. However, these deep learning methods often overlook the structural characteristics of enterprise networks, such as the heterogeneous influences across different enterprises or their interconnectedness over time. As a result, existing approaches remain limited in their ability to predict directional stock price movements accurately, particularly in real-time scenarios.
In response to these limitations, we present the Dynamic Energy Cascading Model (DECM), an innovative computational framework that simultaneously resolves two fundamental challenges in financial network analysis: (1) the dynamic modeling of time-evolving enterprise associations and (2) the prediction of nonlinear stock price movements through structural influence propagation. The core innovations of DECM are twofold:
Dynamic Enterprise Network Construction: Unlike static network models, DECM captures the time-varying nature of inter-corporate relationships by constructing a dynamic enterprise association network. This mechanism continuously updates inter-corporate connections based on real-time market signals while preserving historical interaction patterns.
Nonlinear Energy Propagation Mechanism: DECM introduces a unique energy propagation mechanism to simulate the flow of influence among enterprises, identifying the net energy received by each node as the primary driver of stock price fluctuations. This approach not only accounts for the heterogeneous influences across different enterprises but also integrates topological knowledge, such as structural balance and assortativity degree, to enhance predictive performance.
By combining dynamic network modeling with energy propagation and topological feature encoding, DECM represents a significant departure from traditional methods and offers a more comprehensive framework for understanding and predicting enterprise performance.
Our extensive evaluations using S&P 500 data validate DECM’s superior performance in forecasting directional stock price movements. Notably, our findings reveal that assortativity degree plays a more significant role than structural balance in improving predictions, a novel insight that challenges conventional assumptions and provides new directions for research in network science. These results not only demonstrate the effectiveness of DECM but also offer valuable insights for policymakers and practitioners, particularly in understanding the complex dynamics of financial systems.
2. Related Work
Existing studies most relevant to this paper can be classified into the following broad categories:
Regression-based approaches: Time series prediction using regression models has been a longstanding research focus. Traditional models, such as Auto-Regressive Integrated Moving Average (ARIMA) [
14,
15], Vector Autoregression (VAR) [
16], and Generalized Autoregressive Conditional Heteroskedasticity (GARCH) models [
17], along with their variants [
18,
19], have been widely applied for forecasting tasks. While effective in capturing linear relationships, these methods primarily model static interactions between time series variables, making them insufficient for real-world scenarios characterized by dynamic, nonlinear, and multi-variable dependencies. Recent extensions, such as nonlinear regression models [
20] and hybrid approaches combining regression with machine learning techniques [
21], have attempted to address these limitations. However, these models still struggle with scalability and adaptability when applied to large, complex systems with evolving interactions, such as enterprise networks.
Deep learning-based approaches: In recent years, deep learning techniques have significantly advanced time series prediction. Neural Networks (NNs), inspired by the biological structure and information processing of the human brain, consist of multiple layers of interconnected neurons that iteratively learn hierarchical representations of data through forward propagation and backpropagation algorithms. Convolutional Neural Networks (CNNs) [
22,
23], a specialized class of deep neural networks, utilize convolutional kernels to extract local spatial features from input data. This architecture, originally designed for image processing, has been adapted to time series analysis by leveraging one-dimensional convolutions to capture temporal patterns and reduce long-term dependency issues. Recent studies further demonstrate the effectiveness of CNNs in modeling multivariate time series through hybrid architectures that integrate attention mechanisms or graph-based operations. Long Short-Term Memory (LSTM) networks [
11,
12,
13], another variant of NNs, address sequential dependencies via gated memory cells. These methods capture direct pairwise relationships effectively at each time step but often overlook complex interdependencies among multiple variables, particularly in systems where interactions are nonlinear and dynamic. Recent extensions, such as Temporal Graph Convolutional Networks (T-GCNs) [
24,
25], Graph Attention Networks (GATs) [
26], and Spatio-Temporal Graph Neural Networks (ST-GNNs) [
27], combine graph theory and deep learning to handle both temporal and structural dynamics. However, these methods still face challenges in incorporating high-level structural features, such as assortativity degree and topological variations, which are critical for understanding enterprise interactions.
Network-based approaches: Network-based methods have been developed to address the limitations of regression models, by modeling the complex correlations between multiple time series. For example, Leung et al. [
28] predict stock returns by clustering stocks based on search patterns. While effective for linear prediction, this approach aggregates cluster impacts without considering finer interconnections among stocks. Advanced models such as the Lotka–Volterra (LV) model [
29], EcoWeb [
30], and the Energy Cascading Model (ECM) [
31] extend network-based analysis to capture interactions among multiple variables. Recent studies have also explored dynamic network models, such as time-varying graph embeddings [
32,
33] and dynamic community detection methods [
34], to better capture evolving interactions in financial networks. However, these models typically assume constant relationships over time or fail to fully integrate structural insights, which limits their applicability to real-world environments, where interactions are inherently dynamic and evolve with market conditions.
In contrast to these approaches, the Dynamic Energy Cascading Model (DECM) proposed in this paper offers a novel solution by capturing time-varying relationships among enterprises in a dynamic network setting. DECM integrates a range of structural features, including topological variations, assortativity, and structural balance, which enable it to model the propagation of influence across the network comprehensively. Unlike static or partially dynamic methods, DECM is designed to adapt to the evolving interactions within the system, thereby improving predictive performance in real-world scenarios.
Table 1 summarizes the key advantages of DECM over alternative methods, highlighting its ability to model nonlinear dynamics, evolving interactions, and structural dependencies (as domain knowledge) effectively.
3. Model and Methodology
3.1. Enterprise Association Network Construction
An enterprise association network is modeled as a weighted undirected graph , where V represents the set of nodes, |V| = N is the total number of nodes, and is the set of undirected edges. Each node vi ∈ V corresponds to an enterprise, and each edge eij ∈ E represents an undirected connection between two nodes, vi and vj. The weight matrix W = (wij)n×n encodes the type (cooperation or competition) and strength of the relationship between any two connected enterprises. Specifically, cooperative relationships are assigned weights in the range (0, 1], while competitive relationships are assigned weights in the range [−1, 0).
A critical step in constructing the enterprise association network is the calculation of the weight matrix
W. For each pair of nodes
vi and
vj, the weight of their relationship
wij is determined using a similarity measure based on their respective stock returns. Previous studies have highlighted that market factors, such as economic crises, can significantly affect stock volatility [
35,
36]. Therefore, directly using linear correlation may introduce spurious or misleading associations between node pairs. To mitigate this issue and account for systematic market risks, we adopt the partial correlation measure [
37].
Let
and
represent the actual stock price returns and the estimated stock price return of stock
i at time
t, respectively, where
i = 1, 2, …,
N and
t = 1, 2, …,
T. The abnormal return of stock
i at time
t is given by
where
is typically estimated using a market model, such as the Capital Asset Pricing Model (CAPM). Similarly, the abnormal return of stock
j is given by
. The partial correlation coefficient between the abnormal returns of stocks
i and
j is defined as
where
represents the covariance between the abnormal returns of stocks
i and
j, and
and
represent the variances of the abnormal returns of stocks
i and
j, respectively.
To ensure the reliability of the relationships quantified, we use the longest possible time series for each enterprise’s stock. In this study, we use daily stock data for 359 companies listed on the S&P 500 index, spanning from January 2015 to January 2020, which includes 1259 trading days. This dataset satisfies the assumptions of the Capital Asset Pricing Model (CAPM), which assumes zero mean and constant variance of returns [
38].
To retain only statistically significant correlations, edges are included in the final enterprise association network if their partial correlation coefficient is significant at the
p < 0.01 level. The constructed enterprise association network consists of 63,938 edges and 359 nodes. The weight matrix is shown in
Figure 1.
In
Figure 1, edges representing higher levels of cooperation are colored dark red, while edges representing higher levels of competition are colored dark blue. The enterprises are grouped according to their sectors within the S&P 500 index, as indicated by the red rectangles. Within-sector correlations are shown along the diagonal of the matrix, while off-diagonal elements represent cross-sector correlations. Statistical analysis reveals that cooperative relationships are 15.629% more prevalent within sectors compared to cross-sector correlations. Specifically, the Utilities sector exhibits the highest rate of cooperation (46.203%), while the Information Technology sector shows the lowest rate (6.101%). Conversely, the Health Care sector is more likely to engage in competitive relationships with other sectors, particularly with the Energy sector.
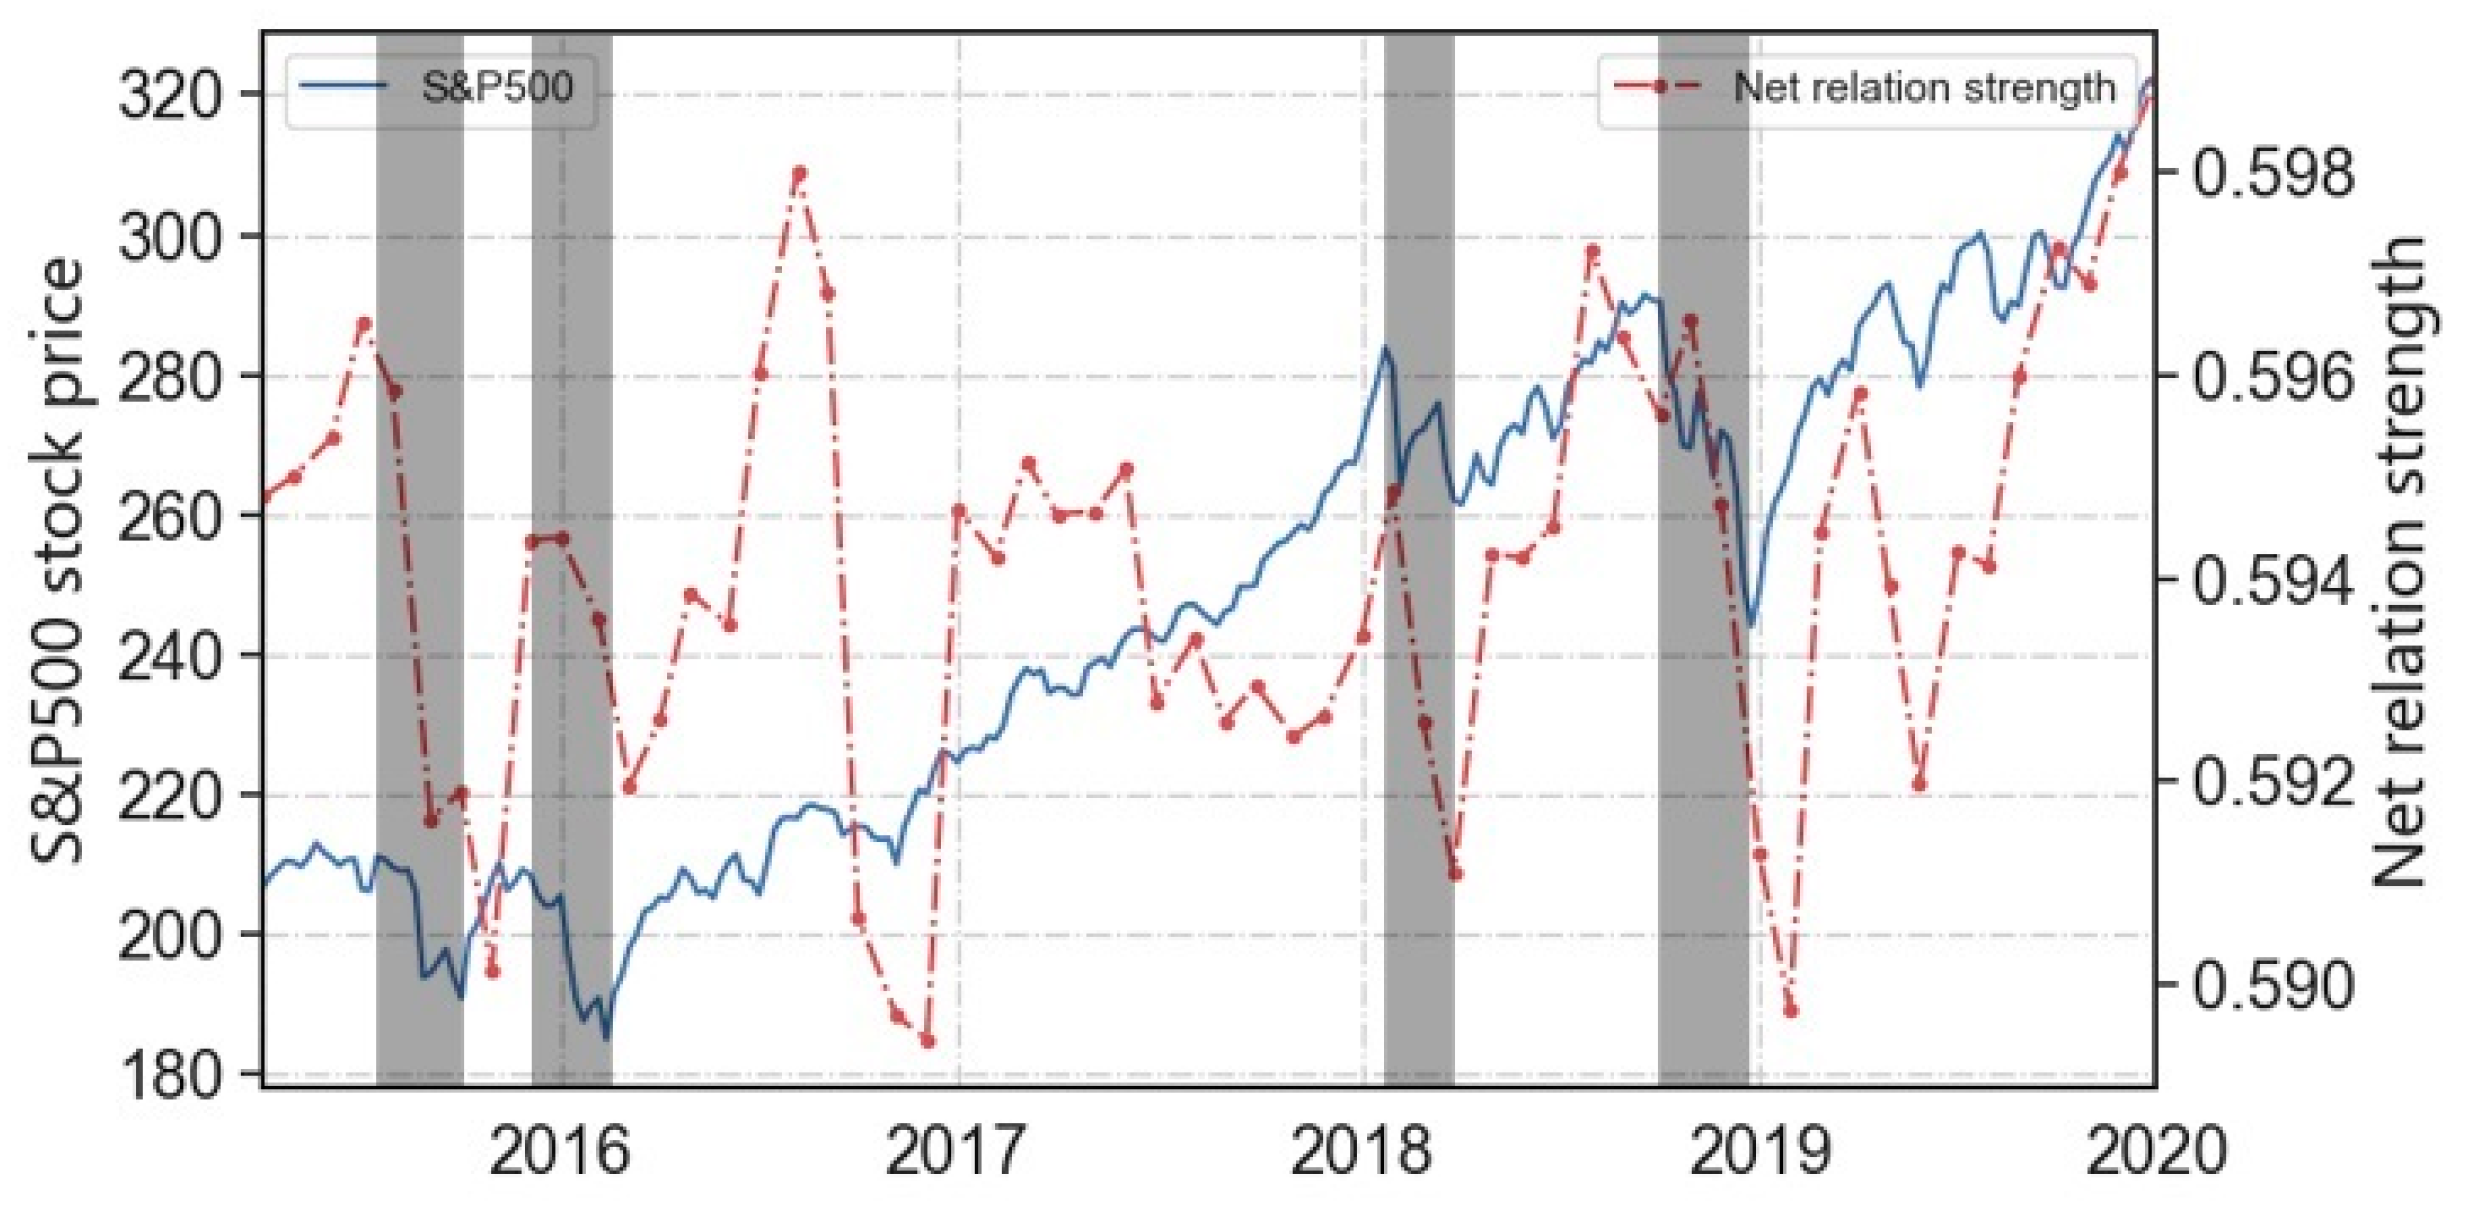
3.2. Enterprise Association Network Evolution Analysis
The observation period, spanning from 2015 to 2020, encompasses four major financial crises: the Stock Market Selloff (2015–2016), the Federal Reserve’s Interest Rate Hikes (January 2018), and the Global Stock Market Downturn (December 2018). These crisis intervals are highlighted with shaded regions in
Figure 2. Notably, during these periods, the market index experiences significant declines. Therefore, it is crucial to investigate whether the correlations between enterprises reflect these market fluctuations.
To explore this, we use a moving window approach to construct a series of evolving networks over the observation period. In each snapshot, we apply the partial correlation criterion to generate three distinct types of enterprise association networks: (1) the general network G, (2) the cooperation network PG, which includes only positively correlated pairs, and (3) the competition network NG, which includes only negatively correlated pairs.
Using this method, we quantify the net relation strength within the network. Specifically, we define the net relation strength
nst at time
t as
where
and
refer to the sets of edges in the cooperation and competition networks, respectively.
The results show that the net relation strength (represented by the red curve in
Figure 2) is positively correlated with the market index (depicted by the blue curve in
Figure 2), with a Pearson correlation coefficient (PCC) of 0.129 (
p << 0.01). This suggests that the strength of enterprise relations can serve as an indicator of market movements. To further investigate how specific patterns of network evolution align with the market index fluctuations, we examine the network’s structure balance and assortativity degree, which are discussed in the following subsections.
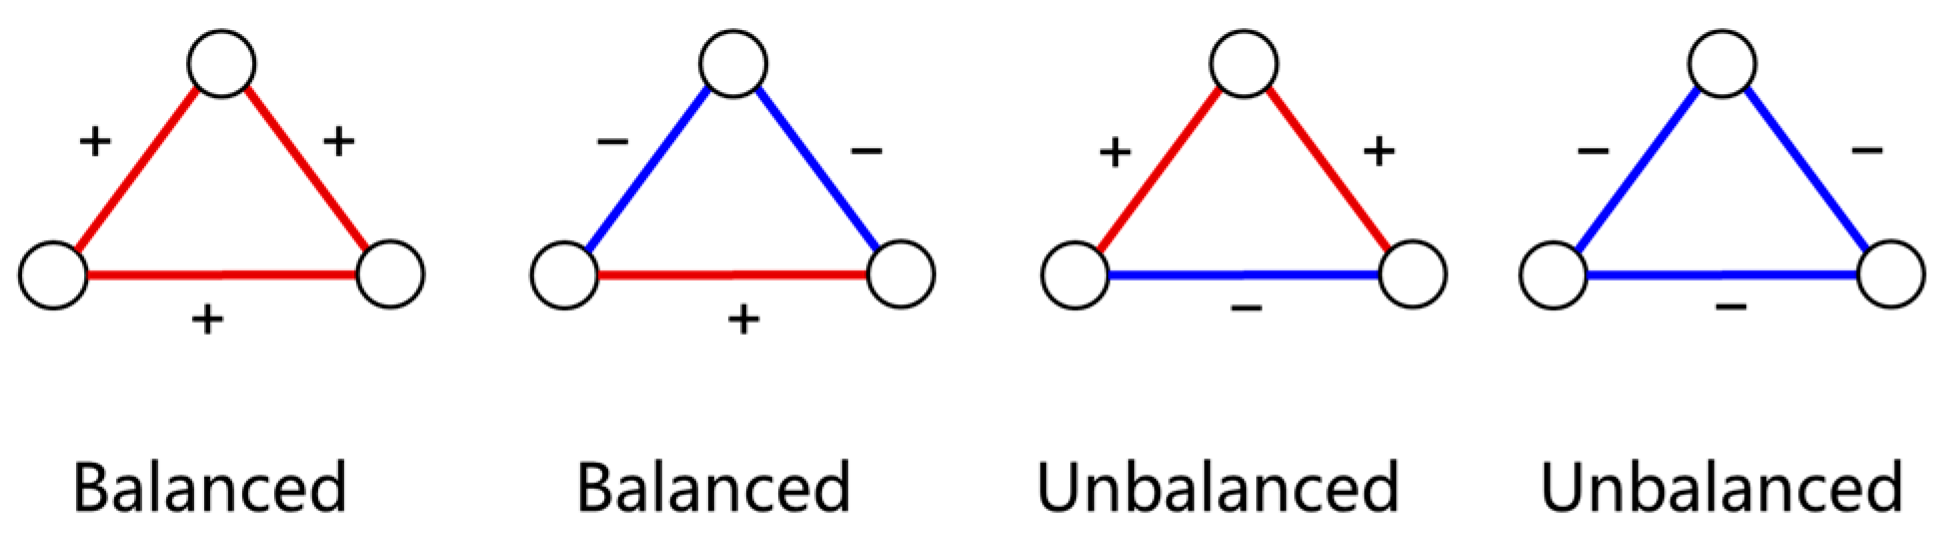
3.2.1. Structure Balance
Structure balance (SB) measures the stability of a network, and it has been widely studied in social network theory. According to Heider’s theory of social balance [
39], individuals or entities tend to gravitate towards a balanced state in their relationships. This principle can be applied to enterprise association networks, where cooperation and competition relationships are assigned positive and negative signs, respectively. A balance is achieved in an enterprise triad (as illustrated in
Figure 3) when the product of all signs in the triad is positive.
To investigate how structure balance influences an enterprise’s stock price, we define the balance degree of an edge
eij at time
t as
where
and
are the sets of balanced and total triads containing the edge
eij at time
t, respectively;
denotes the number of triads enclosed. The balance degree of node
vi at time
t is then computed as
where
denotes the set of edges connected to node
vi. Let
and
represent the time series of balance degree and stock price for node
vi, respectively, with Δ
t = 1 day and
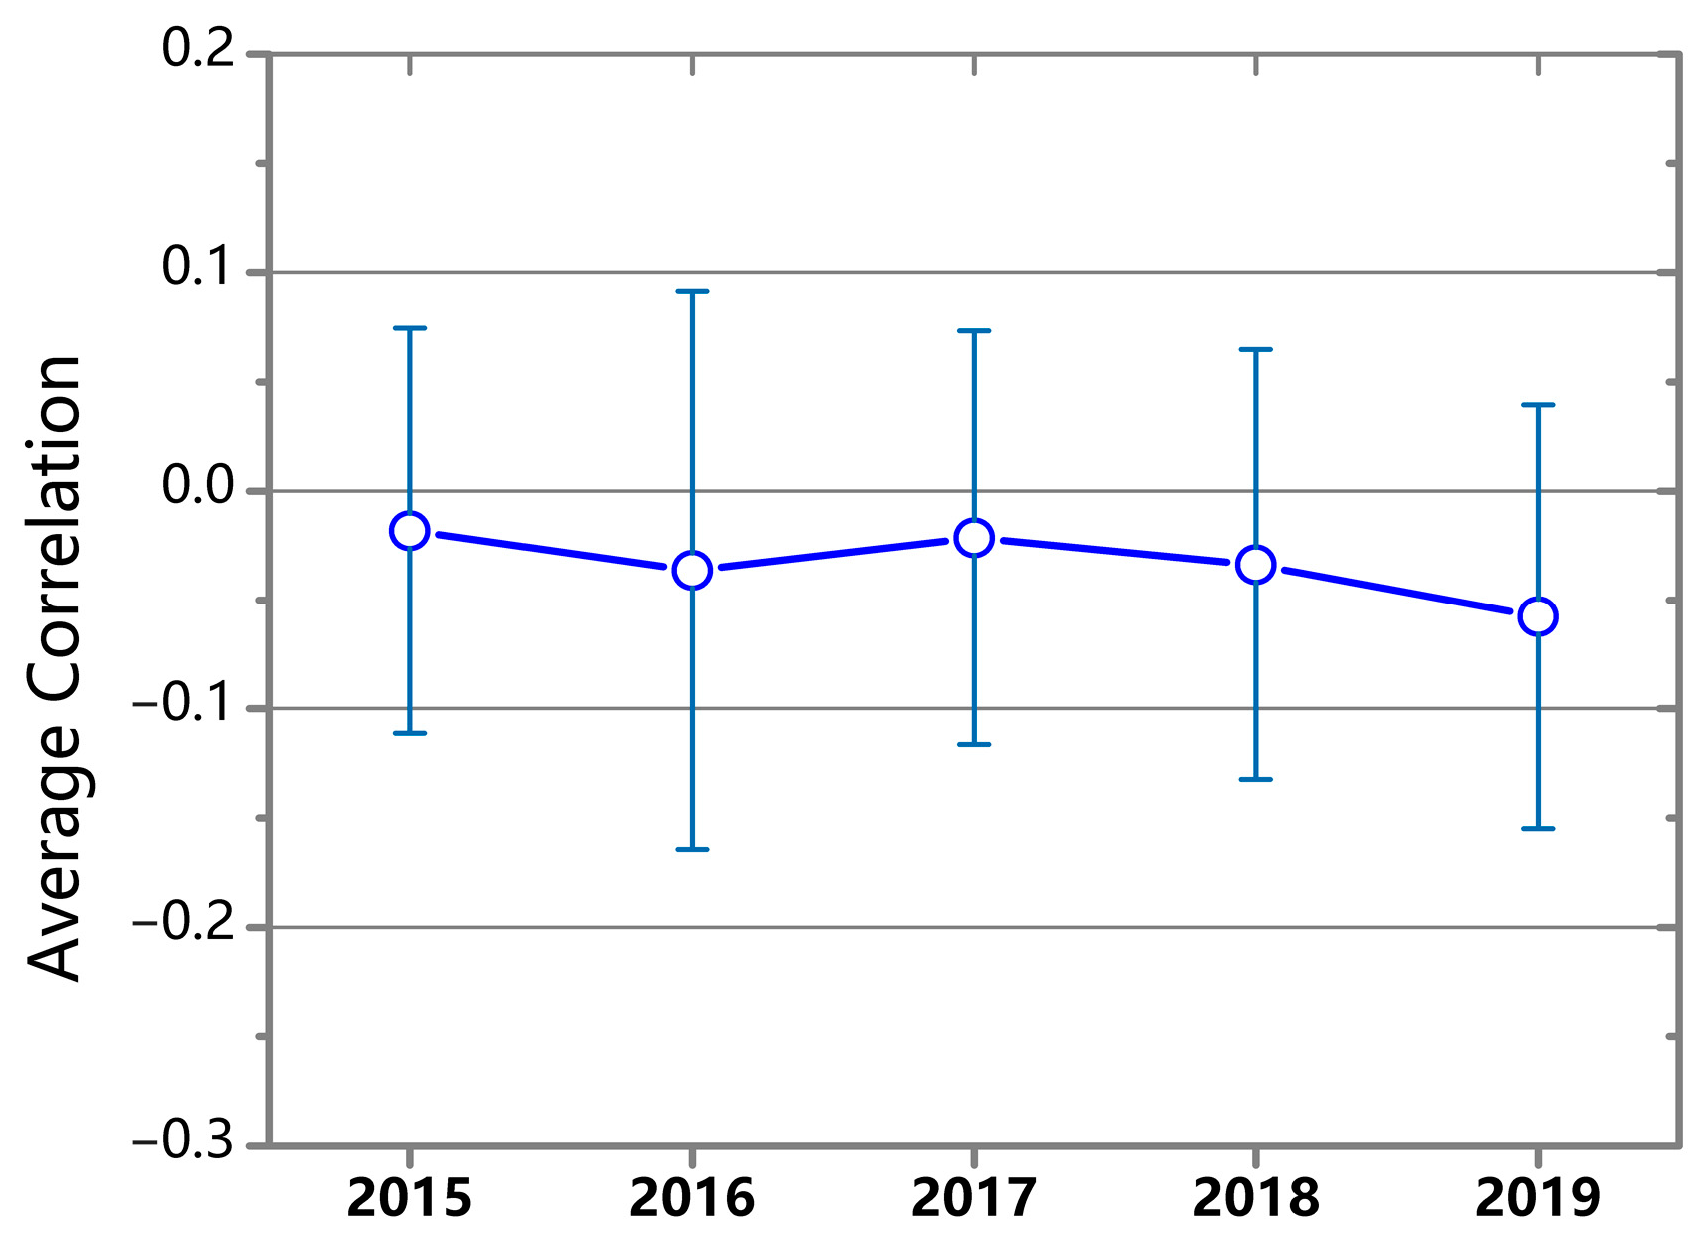
T = 30 days. We then calculate the correlation between balance degree and stock price movements.
The yearly-averaged correlations are shown in
Figure 4. The results indicate a negative correlation between structural balance and stock price movements, with an overall PCC of −0.034 (
p < 0.05). This negative correlation suggests that changes in structure balance could serve as a potential indicator for predicting stock price direction.
3.2.2. Assortativity Degree
Assortativity degree (AD) measures the tendency of nodes with similar degrees to be connected in a network. To examine how assortativity degree reflects stock price movements, we define the assortativity degree of each node by averaging the degree similarities between the focal node and its neighbors in the network.
For a node
vi, its weighted degree at time
t is defined as
where
is the weight of edge
eij at time
t, and
E represents the set of all edges in the network. The degree similarity between nodes connected by edge
eij at time
t is given by
The assortativity degree of node
vi is then defined as
The averaged correlation between assortativity degree and stock price is shown in
Figure 5. The results reveal that assortativity degree is positively correlated with stock price movements, with an overall PCC of 0.078 (
p < 0.05). This correlation is more pronounced in the competition network (PCC = 0.091,
p < 0.01) than in the cooperation network (PCC = 0.073,
p < 0.05). This suggests that assortative relationships have a more significant impact on stock price movements in competitive enterprises.
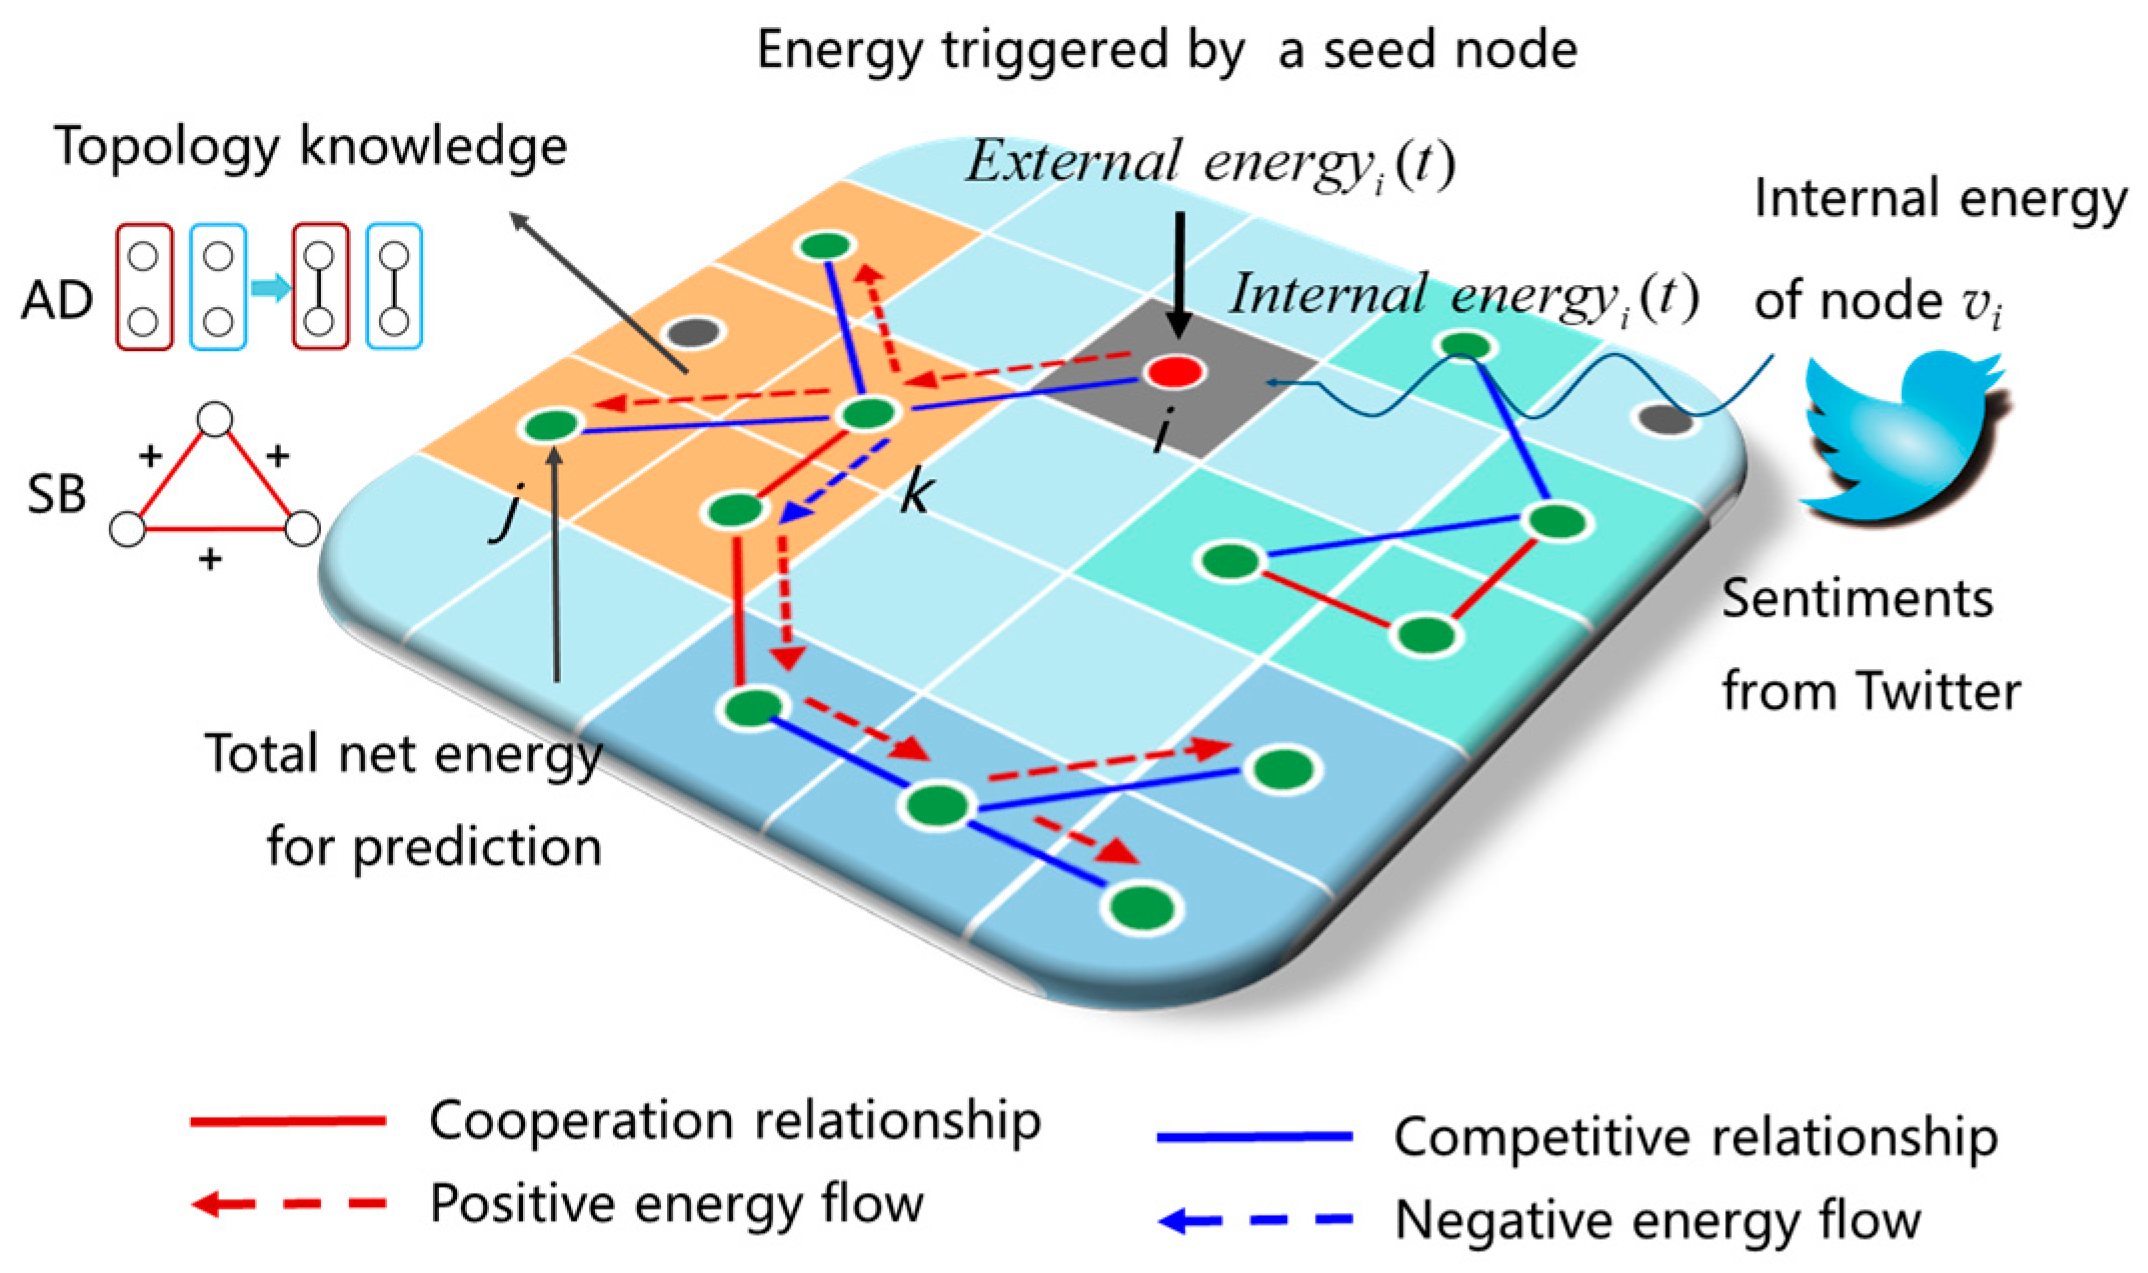
3.3. The DECM Model
Our analysis has revealed that net relation strength in the enterprise association network is positively correlated with the market index, while structural balance and assortativity degree significantly reflect the dynamic movements of individual enterprises’ stock prices. This motivates the development of the Dynamic Energy Cascading Model (DECM), which integrates these findings into a unified framework for predicting the directional movements of stock prices for individual enterprises.
The DECM models the effect of net relation strength through energy propagation, incorporating structural balance and assortativity degree as domain knowledge to enhance predictive performance. In this model, energy is initially triggered by stock price movements of a set of seed nodes, which then propagates through all potential paths from these seed nodes to sink nodes. As energy traverses these paths, countervailing effects may occur, leaving a residual net energy that predicts the stock price movement of the sink node. The entire process is illustrated in
Figure 6.
In DECM, two types of energy propagate through the enterprise association network: positive energy, which pushes stock prices upward, and negative energy, which suppresses them downward. Energy is initiated by stock price movements (upward for positive energy and downward for negative energy) from a set of seed nodes, whose selection is detailed in
Section 6.
A propagation path from node
vi to node
vj is denoted as
pij = (
vi,
vk), …, (
vk’,
vj). For an intermediate edge
eik = (
vi,
vk) on
pij, the dynamic influence at time
t, denoted as
, is primarily determined by its weight
. To incorporate additional knowledge from structural balance and assortativity degree, the influence factor is refined as follows:
where
and
are the structural balance and assortativity degree at time
t, respectively, as defined according to Equations (4) and (7), and
α and
β are tunable coefficients. This formulation accounts for both the dyadic relationship at the micro level and the broader impact of network topology.
The energy transferred from node
vi to node
vk through edge
eik is given by
where
denotes the external energy received by node
vk from other nodes. The susceptibility of node
vi, denoted as
, represents how susceptible node
vi is to external influences. Larger enterprises, which have more diverse resources, are generally less influenced by external forces [
40]. Susceptibility is defined as
where
is the market capitalization of
vi at time
t, and
is the average market capitalization of the sector to which
vi belongs.
Furthermore, the real-time state of each enterprise (i.e., its internal energy) also influences its stock price movements, which in turn affect the stock price movements of other enterprises through the enterprise association network. For instance, an enterprise with a negative market sentiment often exerts a downward influence on its partners, whereas a well-regarded enterprise tends to positively influence its partners. To quantify this effect, we define
as the weighted sentiment of node
vi:
where
and
are the sets of positive and negative opinion expressions for
vi, and
is the sentiment score determined using SentiStrength [
41].
Through the energy cascading process, the total energy transferred from node
vi to node
vj through the complete path
pij is given by
Aggregating energy across all possible paths, the energy propagating from node
vi to node
vj through all paths
Pij is
Finally, the total energy received by node
vj from all seed nodes
Vs is
To predict stock price movements, we focus on monthly changes. Let Δ
t = 1 month, and
T = 6 months. Using data from the preceding six months, we compute the cumulative energy,
, which serves as the primary driving force for stock price movements. The directional stock price movement at time
T + 1 is determined as
where
and
are thresholds empirically estimated from a training dataset.
The DECM model parameters are optimized through Maximum Likelihood Estimation on a training dataset. The computational complexity of predicting the stock price of an arbitrary node vj, given a seed node vi, is O(N2), where N is the number of nodes in the enterprise association network G.
4. Experimental Settings
This experiment uses two datasets: the S&P 500 stock dataset and the Twitter comment dataset.
S&P 500 Stock Dataset: The S&P 500 index is one of the most influential stock indices in the world, covering the 500 largest and most representative companies in the United States by market capitalization. Choosing this index’s dataset ensures that the model can reflect a widely representative network of enterprises and market behaviors. Since it includes companies across various industries, it effectively models the correlations between different companies and offers high predictive value. Furthermore, the S&P 500 dataset has undergone rigorous auditing and validation, making it highly reliable. By selecting this dataset, we ensure that our analysis is based on accurate, publicly available, and widely accepted data.
The S&P 500 stock dataset comes from Yahoo Finance, covering the period from 1 January 2015, to 1 January 2020, with a total of 1259 trading days. Companies that had missing data due to bankruptcy, mergers, or other factors were excluded. The dataset includes market capitalization and stock price data for 359 companies across 10 sectors.
To better highlight stock price fluctuations, this experiment uses stock price returns to represent price volatility. The calculation is as follows: , where represents the daily stock price return for the company i, and and represent the closing prices on day t and day t − 1, respectively.
Twitter Dataset: Twitter, as one of the largest social media platforms in the world, can capture real-time sentiment reactions from the public regarding companies and their actions. These sentiment reactions often influence market investors’ decisions, which in turn affect stock prices. Additionally, Twitter, as a platform for rapid information dissemination, can quickly reflect shifts in public sentiment. Many events (such as corporate scandals, management changes, new product releases, etc.) rapidly trigger discussions on social media, and these shifts in sentiment can have a significant impact on stock prices. In the experiment, the Twitter comment dataset is used to capture and quantify the public’s sentiment changes towards companies, treating these shifts in sentiment as an external energy that drives stock price movements.
The Twitter comment dataset includes tweets for 359 companies across 10 sectors, covering the period from 1 January 2015, to 1 January 2020. The preprocessing steps include (1) removing duplicate data to ensure no repeated tweets or identical content records; (2) deleting tweets with no meaningful content (e.g., those containing only links, emojis, or meaningless characters); and (3) removing special symbols (e.g., #, @, URLs) from the tweets. After preprocessing, the dataset contains a total of 985,090 comments.
Selection of Seed Nodes: In each evaluation year, we use the first six months to select seed nodes and train the network, while the remaining six months were reserved for testing. Specifically, for each testing node vtest, it was designated as a source node in the enterprise association network. We then selected the top k nodes that received the largest absolute energy as the seed nodes. In the experiments, we set k = 5, but we also tested values ranging from 3 to 11, with qualitatively similar results.
Evaluation: To evaluate the performance of the model, we used the selected seed node set
Vs as source nodes to assess the energy received by each testing node
vj, ultimately predicting its stock price movements. Specifically, given that stock data constitutes an imbalanced dataset, there exists a significant disparity in the number of labels indicating upward and downward price movements within a given time slice. Consequently, we employ Precision as the evaluation metric, which is calculated as follows:
where TP (True Positive) represents the number of correctly predicted positive instances, and FP (False Positive) represents the number of instances incorrectly predicted as positive. For each evaluation, we compute the proportion of predicted directions (either upward or downward movements) that align with the actual stock price movements.
Comparison Approaches: To validate the predictive performance of the DECM, we compared it with three mainstream approaches: ARIMA, LSTM, and ECM. ARIMA is a classical linear regression model commonly used for economic predictions. LSTM, a deep learning-based model, has shown promising results in large-scale time series tasks. ECM, on the other hand, is a traditional energy cascading model based on a static network.
5. Results
5.1. Prediction Performance
The prediction results for various approaches are summarized in
Table 2. For clarity, the top four sectors with the largest market capitalizations are listed separately. The results indicate that DECM outperforms all other approaches across nearly all sectors and on average.
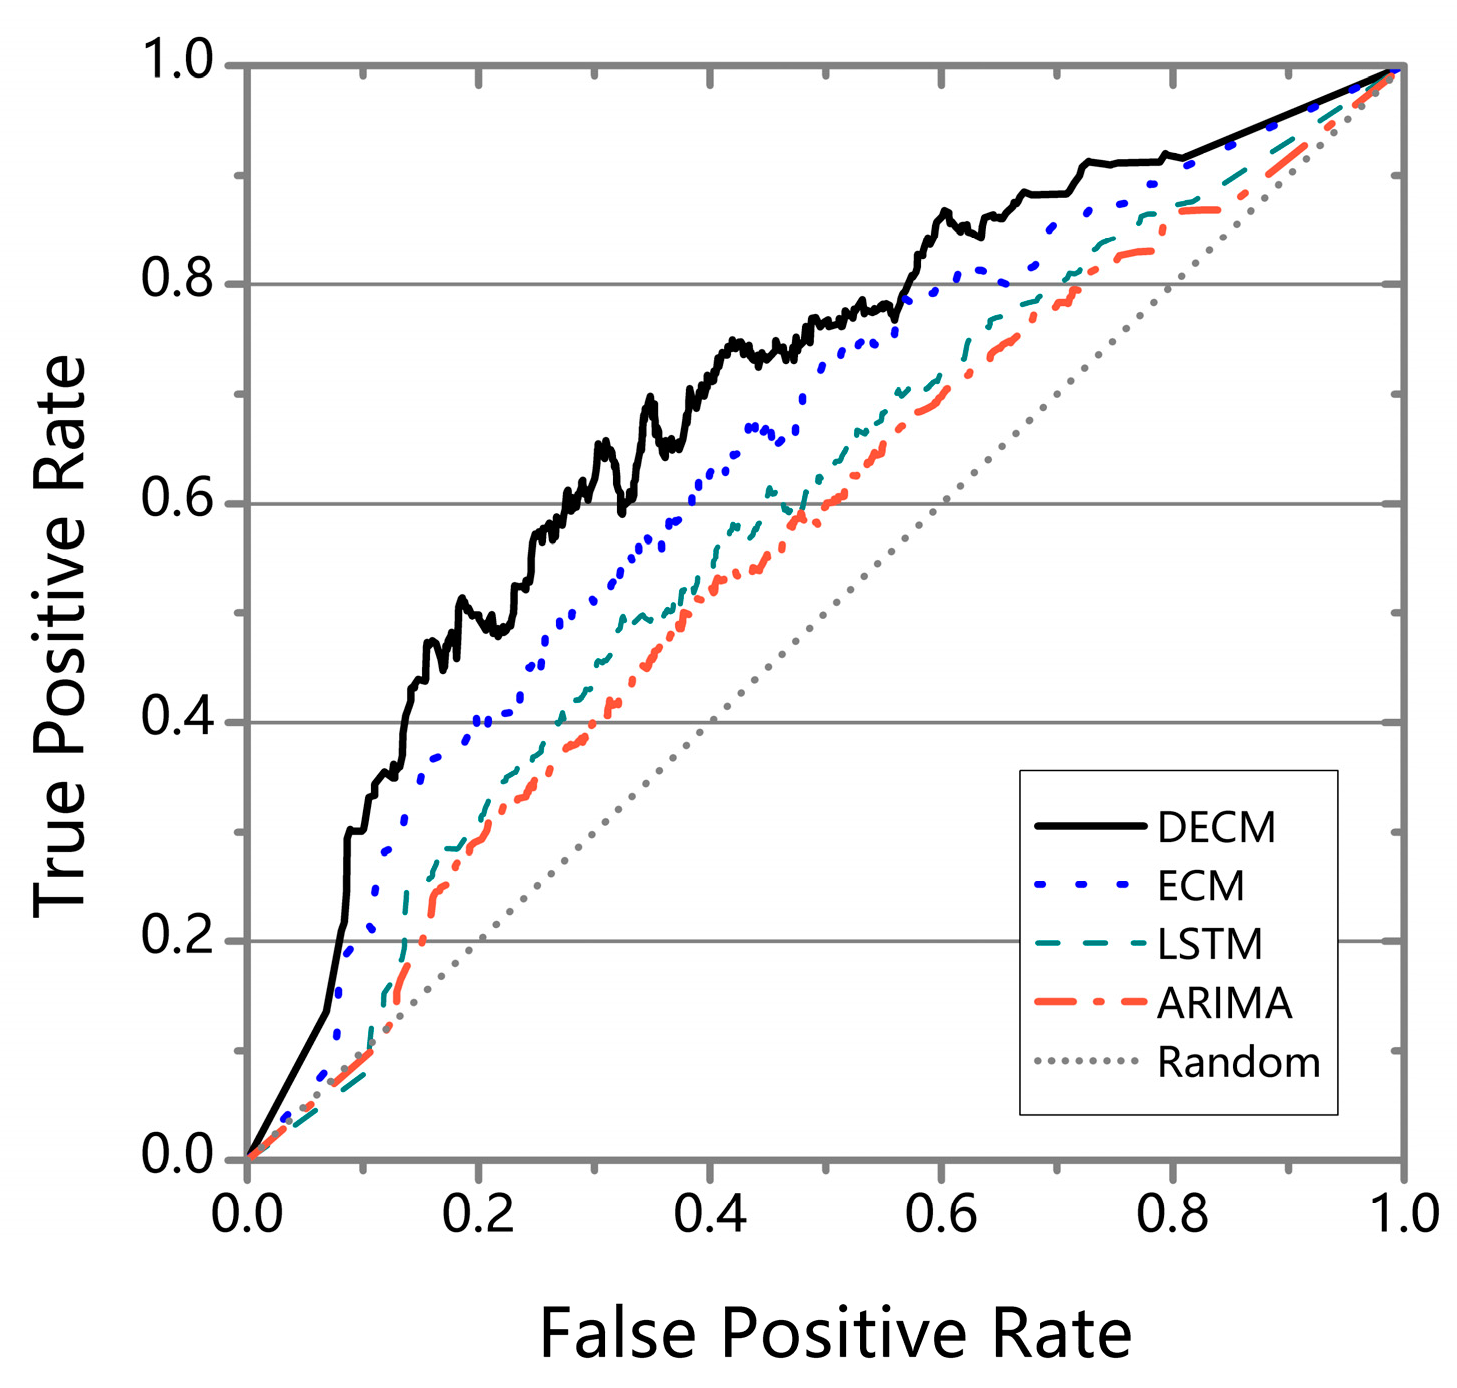
The predictive performance of a model is highly dependent on the setting of classification thresholds (θ+ and θ−). To comprehensively evaluate the performance of different methods under varying threshold settings, this study employs the ROC curve (Receiver Operating Characteristic curve) as an evaluation metric. The ROC curve is a graphical representation that illustrates the trade-off between the True Positive Rate (TPR) and the False Positive Rate (FPR) across a range of classification thresholds.
The True Positive Rate (TPR) is defined as
where TP (True Positive) represents the number of correctly predicted positive instances, and FN (False Negative) represents the number of positive instances incorrectly predicted as negative.
The False Positive Rate (FPR) is defined as
where FP (False Positive) represents the number of negative instances incorrectly predicted as positive, and TN (True Negative) represents the number of correctly predicted negative instances.
The ROC curve is constructed by plotting the TPR against the FPR at various threshold settings. A model with perfect discrimination ability has an ROC curve that passes through the top-left corner of the plot, indicating a TPR of 1 and an FPR of 0. The Area Under the ROC Curve (AUC) is a scalar value that summarizes the overall performance of the model across all possible thresholds. An AUC of 1 indicates perfect classification, while an AUC of 0.5 suggests no discriminative power, equivalent to random guessing.
By analyzing the ROC curve and the corresponding AUC values, this study evaluates the robustness and effectiveness of different methods in handling imbalanced datasets and varying classification thresholds. This approach provides a comprehensive understanding of the model’s performance, particularly in scenarios where the optimal threshold is not known a priori.
As shown in
Figure 7, ARIMA (represented by the orange dashed curve, AUC = 0.598) performs the worst. This suggests that stock price variation is highly nonlinear, limiting the effectiveness of linear-based models in such scenarios. In contrast, LSTM (represented by the green dashed curve, AUC = 0.615) accommodates the nonlinear characteristics and performs better, although it still lags behind the network-based ECM (represented by the blue dotted curve, AUC = 0.666). DECM, which models the time-varying correlations among enterprises and incorporates topological knowledge, achieves the highest performance (represented by the black curve, AUC = 0.725). These results demonstrate the reliability and superiority of DECM in predicting stock price movements.
5.2. Knowledge Contribution
Next, we evaluate the contribution of different types of topological knowledge, specifically structure balance and assortativity degree. Since DECM offers a flexible framework for incorporating additional topological knowledge, we derive four model variants: the naive model (DECM without any extra knowledge), naive + SB (DECM encoding structure balance), naive + AD (DECM encoding assortativity degree), and naive + SB + AD (the full DECM model).
Figure 8 illustrates the performance of these derived models. The naive model, which does not incorporate any additional topological knowledge, performs the worst (AUC = 0.624). This highlights the importance of incorporating topological information to improve prediction performance. Among the two topological factors, assortativity degree contributes more significantly than structure balance (AUC = 0.662 vs. AUC = 0.652). The contribution of each factor is also reflected in the coefficients;
α = −0.267 for structure balance (SB), and
β = 1.029 for assortativity degree (AD). Although both factors are important, assortativity degree is not a substitute for structure balance. When combined, the performance reaches its peak, with an AUC of 0.725.
6. Conclusions
To bridge the gap between enterprise performance and the underlying dynamic network, we have developed the Dynamic Energy Cascading Model (DECM). This model conceptualizes the propagation of business influence as a driving force for stock price movements, while also offering the flexibility to integrate various types of topological knowledge. Extensive evaluations demonstrate that DECM consistently outperforms other mainstream approaches in predicting stock price movements. Specifically, DECM achieves average precision improvements of 31.3% over ARIMA, 10.8% over LSTM, and 10.9% over ECM. These results confirm the reliability and superiority of DECM in capturing the dynamic and structural features of enterprise association networks. Additionally, the contribution of each factor is further reflected in the model coefficients; α = −0.267 for structural balance (SB), and β = 1.029 for assortativity degree (AD). These coefficients indicate that assortativity degree has a significantly stronger positive impact on prediction accuracy compared to structural balance, which has a weaker negative effect.
7. Discussion
The implications of our findings extend beyond academic research and have significant relevance for the economy and financial markets. For investors, DECM provides a powerful tool to better predict stock price movements by capturing the dynamic interactions within enterprise association networks. This can lead to more informed investment decisions, potentially improving portfolio performance and risk management. For policymakers, the model offers a novel approach to monitor systemic risks and market stability by analyzing the propagation of business influence across interconnected enterprises. This could enhance the ability of regulatory bodies to identify and mitigate potential market disruptions.
From a market efficiency perspective, DECM contributes to reducing information asymmetry by uncovering hidden relationships and dynamic patterns within enterprise networks. By improving the precision of stock price predictions, the model can help make financial markets more efficient, ensuring that asset prices more accurately reflect their true value. Furthermore, our findings highlight the importance of network topology, particularly assortativity degree, in understanding market dynamics. This insight can guide future research on the structural properties of economic networks and their impact on market behavior.
However, it is important to acknowledge certain limitations of the DECM model. First, the model’s performance is highly dependent on the quality and completeness of the input data. In real-world scenarios, enterprise association networks may contain incomplete or noisy data, particularly in capturing hidden or indirect relationships (e.g., informal collaborations or indirect competitors). Such data limitations could affect the model’s ability to accurately propagate business influence and predict stock price movements. Future work could explore the integration of external data sources, such as news articles or social media, to enhance the model’s ability to capture hidden associations and improve its robustness.
Second, the dynamic nature of enterprise association networks introduces significant computational complexity. As the network evolves over time, the model must continuously update its representations to reflect the latest interactions, which can be computationally intensive, especially for large-scale networks. While DECM demonstrates efficiency in our experiments, scaling it to even larger networks or real-time applications may require further optimization. Potential solutions include developing more efficient dynamic graph representation learning techniques or leveraging distributed computing frameworks to reduce computational overhead.
In future work, we plan to further investigate the impact of enterprise attributes on stock performance. Given that these attributes may influence both structural balance and assortativity degree, we aim to explore their correlations and examine how they contribute to the dynamics of the enterprise association network. Additionally, we will focus on addressing the aforementioned limitations by enhancing the model’s data adaptability and computational efficiency, thereby extending its applicability to a wider range of scenarios.


 ,
, 


