1. Introduction
Sulphur hexafluoride (SF
6) gas molecules readily capture a free electron to form stable negative ions, thereby weakening the ionization process caused by mutual collisions. Additionally, these negative ions can combine with positive ions in the arc, significantly reducing the breakdown of the arc and increasing the breakdown voltage. Therefore, under certain density conditions, SF
6 gas exhibits high electrical insulation strength and excellent arc-extinguishing performance, making it widely used in gas-insulated switchgears (GISs), circuit breakers, and other high-voltage electrical equipment [
1,
2,
3]. In recent years, numerous papers have conducted extensive research on issues related to SF
6 high-voltage equipment, including GIS partial discharge, fault diagnosis, real-time parameter monitoring, and SF
6 gas leakage.
Reference [
4] employs a Multitask Learning Network to assess the conditions that lead to partial discharge in a GIS, but relies on statistical features from a 5-min time window, which may result in approximately 2-s response delays during sudden discharge events. Reference [
5] utilizes a Collaborative Domain Adaptation Network to locate the sources of partial discharge in a GIS; however, when deploying heterogeneous sensors (e.g., UHF and ultrasonic) in mixed configurations in practical engineering, the feature alignment layer must be redesigned. Reference [
6] employs Photoacoustic Spectroscopy to detect hydrogen fluoride (HF) caused by partial discharge in a GIS, but its temperature compensation model faces over 80% signal attenuation due to frost formation in the photoacoustic cavity under low-temperature environments below −20 °C.
The decomposition products of SF
6 can be utilized for fault diagnosis in GISs, but when the environmental humidity exceeds 85%, the compensation residual of electrochemical sensors increases to 9.8% [
7]. Fault diagnosis methods based on artificial intelligence algorithms include the feature selection algorithm and convolutional neural networks, as strong vibration conditions cause a 61% decline in the signal-to-noise ratio (SNR) of spectral data from laser gas sensors [
8]. The improved lightweight CNN model with load-adaptive matching, but self-supervised learning, requires at least 100,000 h of normal operational data for pre-training, while most substations accumulate less than 10,000 h of valid data [
9], and use supervised contrastive learning based on phase-resolved partial discharge, but strong electromagnetic pulse interference leads to mis-extraction of pulse parameters [
10]. The literature [
11] proposes a fault redundancy method for high-voltage electrical appliances, called CHBMC.
A method for monitoring the parameters of SF
6 high-voltage equipment is proposed in refs. [
12,
13,
14,
15]. The specific parameters to be tested include the open/closed state of the GIS [
12], the temperature rise rate of the GIS busbar conductors [
13], the SF
6 Dynamic Capacitance [
14], and the SF
6 gas moisture concentration [
15], but these solutions require dedicated sensors and pre-embedded optical fibres, resulting in higher costs and a complex protection design.
In [
16], SF
6 gas leakage is detected based on a customized binocular infrared detection system. The images captured contain background noise and system noise, making the infrared detection system vulnerable to interference from such noise. SF
6 gas leakage is detected using Tiny Machine Learning [
17], but it requires the use of high-performance digital processors. To prevent the damage caused by leaked SF
6 gas to the environment and human health, it can be adsorbed by materials such as CuO-doped [
18], NiO-doped, and Ag₂O-doped SnSe monolayers [
19].
SF
6 gas is typically sealed within fixed gas compartments inside high-voltage equipment, and its abnormal condition is manifested by a decrease in density value, which leads to a reduction in the insulation and arc-quenching performance of the equipment [
20,
21]. The causes of SF
6 gas density reduction include gas leakage and liquefaction under cold conditions. Detecting SF
6 gas leakage alone is not sufficient to comprehensively assess whether the density is within the normal range. SF
6 gas density can be directly measured using SF
6 gas density relays. However, the proper functioning of SF
6 gas density relays directly affects the safe operation of high-voltage electrical equipment. Therefore, monitoring the SF
6 gas density relays is particularly important. In [
22], due to the inability to determine whether a single sensor is functioning properly, two different types of sensors are placed in the circuit breaker. The difference in the measured pressure values from the two sensors is used to monitor whether there is an abnormality in the SF
6 gas. However, this method increases the equipment cost, due to the additional number of sensors.
The SF
6 gas density relays can be calibrated in two ways: disassembled and on-site. The disassembly method involves powering down the high-voltage equipment, then sending the disassembled SF
6 gas density relay to a qualified laboratory. After connecting it to a gas distribution instrument, the density values are calibrated and compared point by point. If the calibration is qualified, the relay is then reinstalled and put back into operation [
23,
24]. This disassembled calibration method has the problems of low efficiency and high operation and maintenance costs, especially in the case of power failure, which seriously affects the normal operation of the power grid. The on-site calibration method is applied to SF
6 gas density relays equipped with inspection interfaces, utilizing specialized calibration instruments [
25,
26]. During calibration, the gas circuit of the high-voltage electrical equipment is first isolated from the gas circuit of the SF
6 gas density relay. The calibration instrument is connected to the inspection interface of the SF
6 gas density relay via a small-diameter pipeline. The SF
6 storage cylinder pressurizes the gas circuit, comprising the calibration instrument, SF
6 gas density relay, and pressure gauge. Once pressurization is complete, the valve is closed to isolate the SF
6 storage cylinder. The pressure within the sealed gas circuit is then adjusted slowly, while pressure and temperature sensors monitor the pressure and temperature in the gas circuit. Using density conversion formulas, the values are converted to standard pressure values at 20 °C. The pressure values obtained at each test point are compared with the readings from the pressure gauge to determine whether the SF
6 gas density relay is functioning normally [
27,
28,
29]. The pressure regulation mechanism of the on-site calibration device comprises a handwheel-driven piston pressure adjustment cylinder [
30,
31,
32], a motor-driven piston pressure adjustment cylinder [
33,
34], and compressors [
35,
36]. Manually controlled pressure regulation is inefficient, while motor-driven pressure regulation suffers from high energy consumption.
This device adopts a balance-based measurement core structure, eliminating complex pressure regulation mechanisms, resulting in a lightweight design that is more suitable for on-site deployment, without requiring large-scale equipment support. With extremely low power consumption, it supports long-term operation in grid-independent environments. By applying pressure directly through the measuring cylinder and utilizing real-time balance feedback, it achieves rapid pressure loading and high-precision closed-loop control. Regular loading of standard weights enables real-time correction of balance zero drift, reducing long-term operational errors. Calibration is achieved via direct pneumatic connection, without requiring power interruption or disassembly of relays.
2. Structure and Principle of Calibration Devices
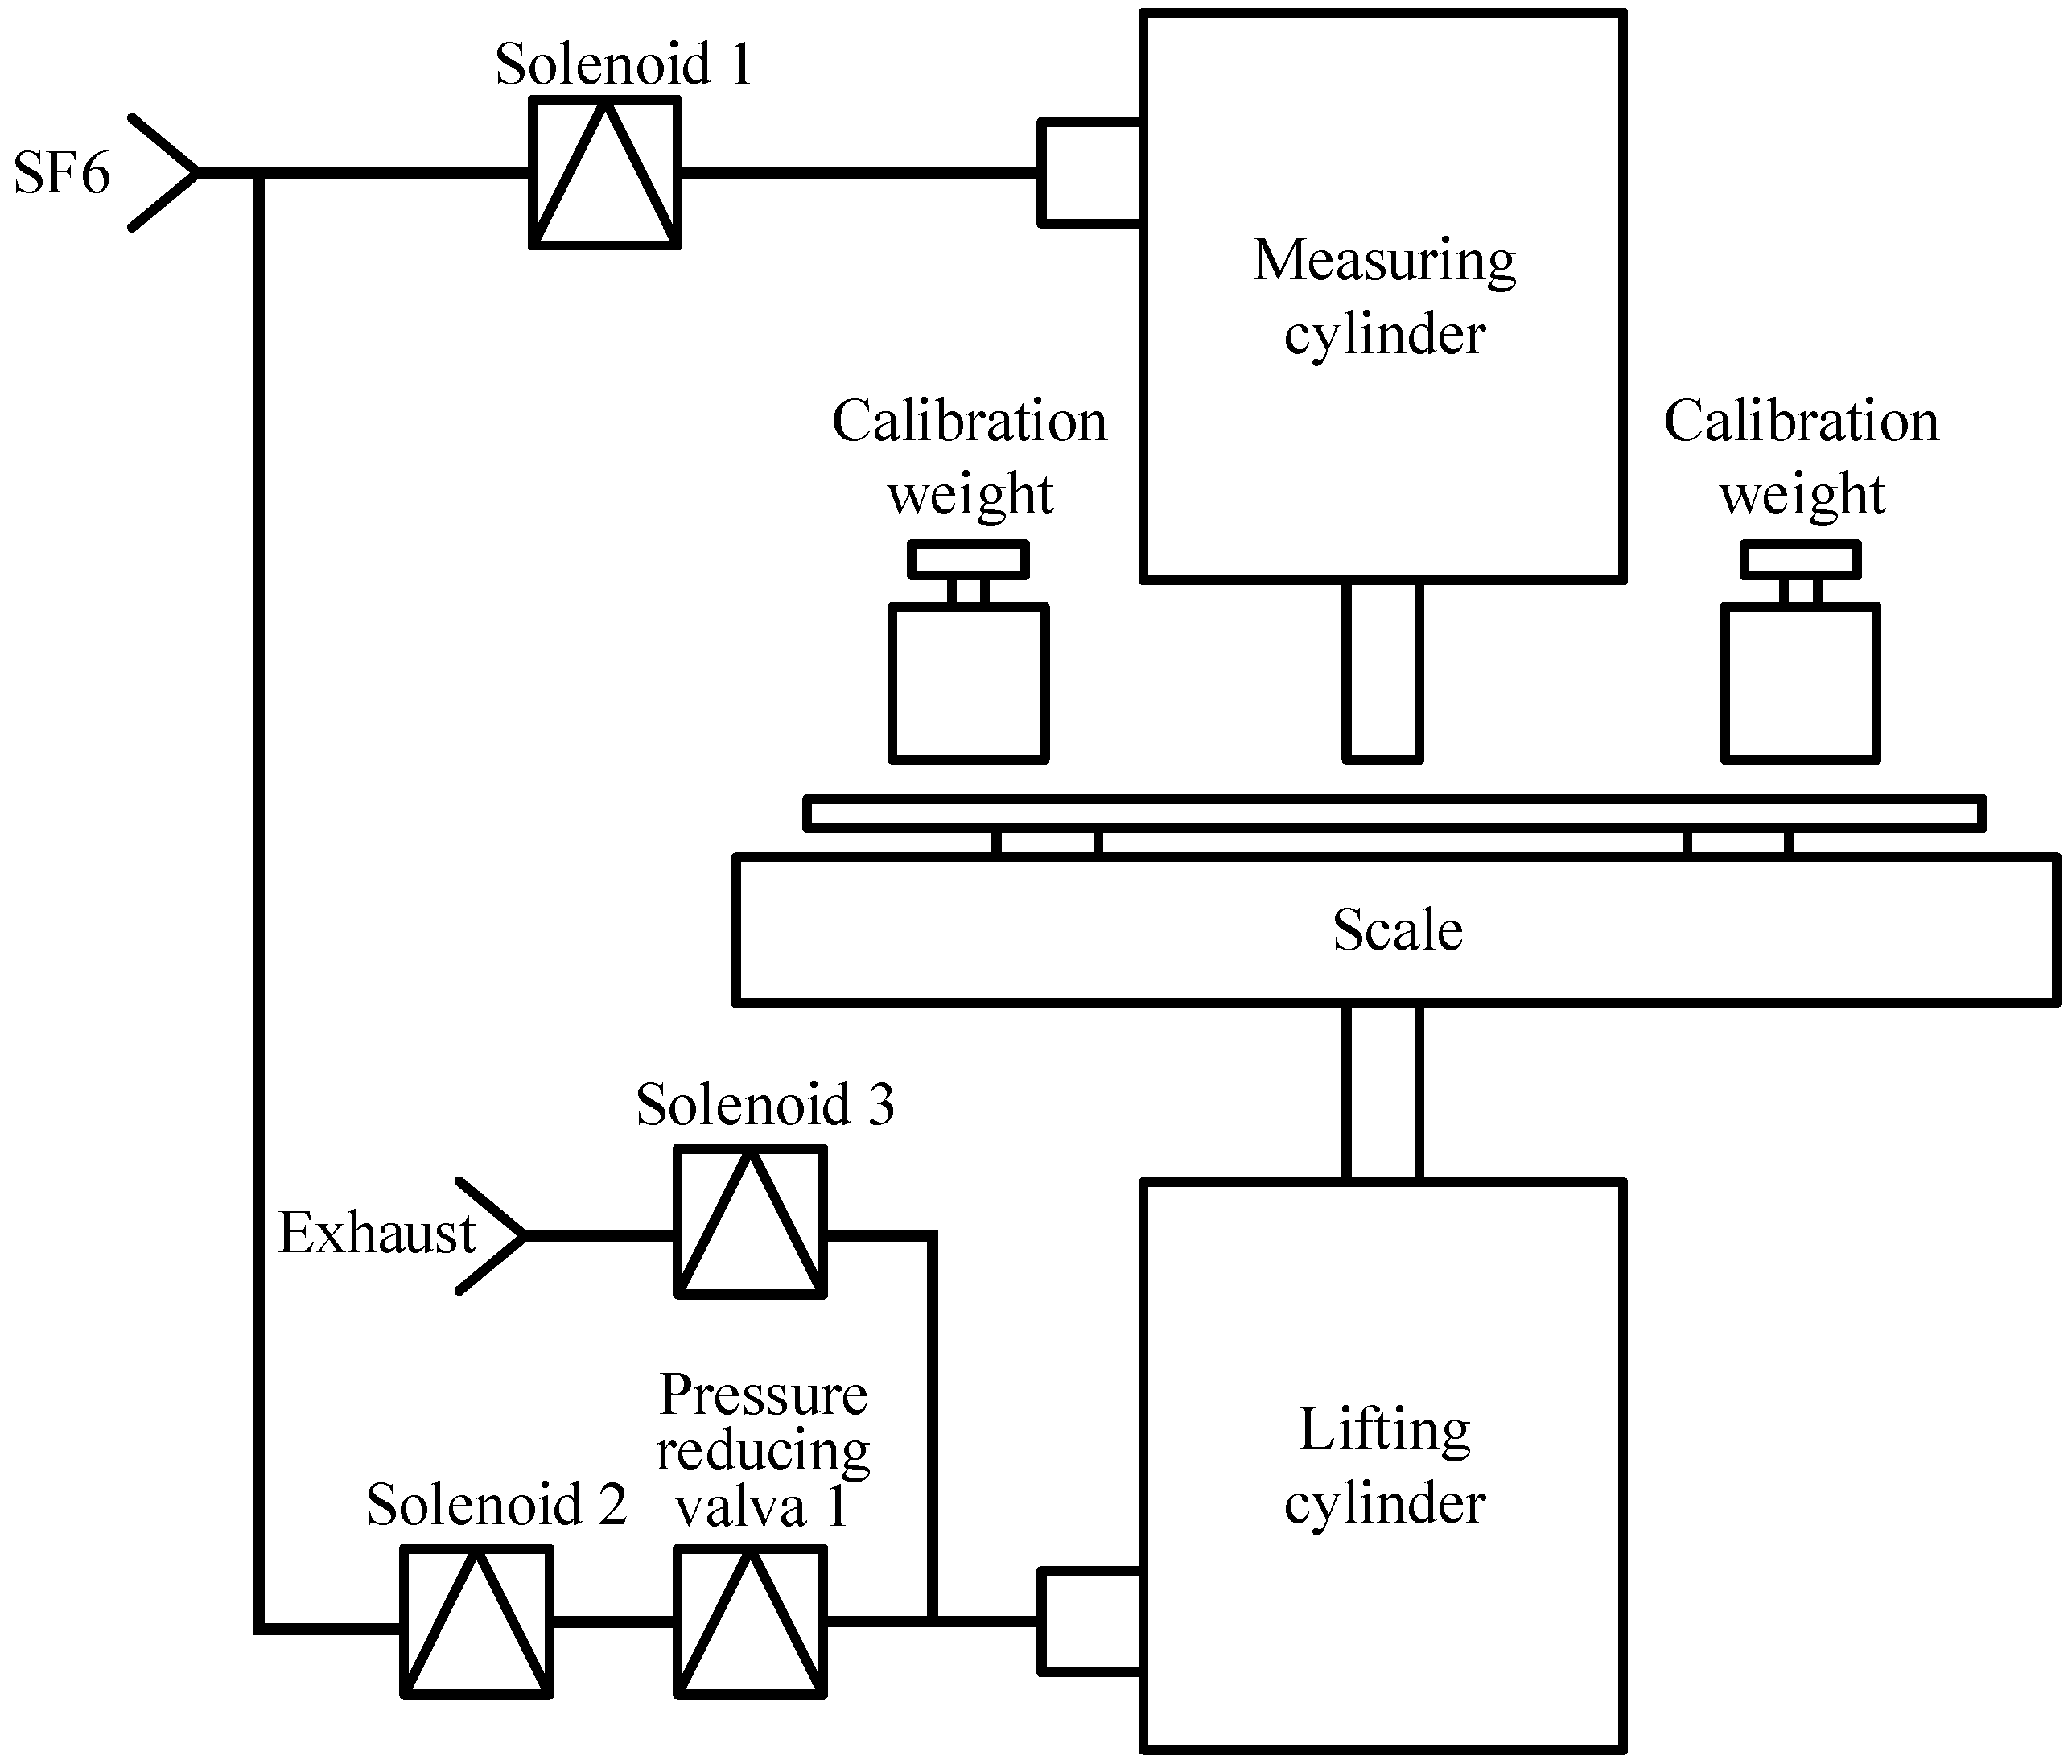
The structure of the calibration device is shown in
Figure 1, and consists of a measuring cylinder, a force-measuring balance, self-calibrating weights, a balance tray, a lifting cylinder, and a solenoid valve.
When the device is in self-calibration mode, the lifting cylinder is filled with SF
6 gas, which raises the force-measuring balance. The self-calibration weight falls onto the balance pan, and the reading of the force-measuring balance corresponds to the weight of the calibration mass. By comparing the weight of the calibration mass with the balance reading, self-calibration of the balance is performed. When the device is in pressure measurement mode, the self-calibration weight is removed from the balance pan, and SF
6 gas is introduced into the measurement cylinder, causing the measurement cylinder’s push rod to extend to the force-measuring balance. The reading of the force-measuring balance is
M2, and the pressure
P of the SF
6 gas at the current temperature is calculated as follows:
In the formula, g is the acceleration of gravity and A is the piston area of the measuring cylinder.
The working principle of the calibration device is divided into two stages: self-calibration and calibration of the density relay. In the self-calibration stage, the following steps need to be completed: (1) load the weights onto the force-measuring balance; (2) read the reading of the force-measuring balance; (3) convert the reading of the force-measuring balance into a mass result; (4) compare the measured mass result with the mass of the loaded weights to ensure that the error of the force-measuring balance is within the allowable range; and (5) remove the weights. During the density relay calibration stage, the following steps need to be completed: (1) introduce SF6 gas into the measuring cylinder to load the measuring cylinder’s piston onto the force-measuring balance; (2) read the reading of the force-measuring balance; (3) convert the reading of the force-measuring balance into a pressure result; (4) measure the temperature; (5) convert the measured pressure to the pressure value at 20 °C; (6) compare the measured density value with the result from the SF6 density relay to calculate the error; and (7) provide the calibration result.
The specific process for completing a calibration is shown in
Figure 2, combined with the calibration device shown in
Figure 1. Solenoid valve 1 and solenoid valve 3 are closed while solenoid valve 2 is open, to complete the self-calibration of the balance. Then, solenoid valve 1 and solenoid valve 2 are closed, and solenoid valve 3 is opened to discharge the gas from the lifting cylinder. The internal pressure of the lifting cylinder decreases, causing the self-calibration weight to detach from the balance. The absolute error
E of the balance self-calibration is calculated using the following formula:
In the formula, M1 is the measured value of the balance during the self-calibration process, and M is the total mass of the self-calibration weight. The range of the balance is 1500 g, with an accuracy of 0.1%, and the calibration weight is 1000 g, resulting in a maximum measurement error of 1500 × 0.1% = 1.5 g. If E is less than 1.5 g, the self-calibration of the balance is considered qualified.
Solenoid valve 1 is opened, while solenoid valves 2 and 3 are closed. After the push rod of the measurement cylinder stabilizes, a waiting period is observed, to ensure that the temperature of the gas inside the measurement cylinder equilibrates with the external environment. The balance reading is then converted into pressure, and the ambient temperature is measured. Using the Beattie–Bridgman equation [
37], the density of SF
6 is converted to the pressure value at 20 degrees Celsius. The accuracy level evaluation criteria for the SF
6 density relay, as shown in
Table 1, can be referred to the “People’s Republic of China Electric Power Industry Standard (DL/T 259-2023) [
38]: Calibration Regulations for SF
6 Gas Density Relay”. The relay error of the SF
6 density is calculated, and its accuracy class is determined according to
Table 1. All solenoid valves are then closed, marking the end of this calibration process.
3. Calibration Device Error Analysis
The key equipment and performance parameters of the calibration device are shown in
Table 2. From Equation (1), it can be seen that the factors affecting the measurement error of pressure
P include the force-measuring balance, gravitational acceleration, and the piston area of the measurement cylinder. Additionally, the friction force of the measurement cylinder, buoyancy, and the vertical alignment of the installation have a direct impact on
P.
- (A)
Errors caused by gravitational acceleration
Through a laser alignment system to ensure vertical installation of the equipment, keeping the tilt angle within ±0.5°, Δg/g ≈ 0.0038%.
- (B)
Errors caused by the weights and piston area
From
Table 2, the relative error
rM of the force-measuring balance is 0.1%. Piston area error is mainly caused by temperature changes; assuming that the temperature is maintained at −10–50 °C, and the amount of change is 60 K, the steel thermal expansion system is generally less than 20 ppm. Without any correction, in the entire temperature range, the piston area’s relative error
rA is 2 × 20 ppm × 60 × 0.12% = 0.24%.
- (C)
Errors caused by the friction force of the measuring cylinder
The measuring cylinder provides a minimum pressure of 0.002 MPa, with a cylinder diameter of 10 mm and a push rod diameter of 6 mm. The effective area of the piston is calculated as 3.14 × (102 − 62)/4 = 50.24 mm2. The force generated by a pressure of 0.002 MPa is 0.002 MPa × 50.24 mm2 = 0.10048 N. Converting this force to the mass of the weights gives 0.10048/9.8 ≈ 0.010253 kg. When the standard generator produces a pressure of 0.5 MPa, the required mass of the weights is 500,000 × 0.00005024/9.8 = 2.56 kg. Therefore, the relative error introduced is 0.010253/2.56 = 0.4%.
The minimum working pressure corresponds to the maximum static friction force when placed horizontally, and the actual dynamic friction coefficient is about 50–70%. Therefore, the relative error introduced by the cylinder friction force is approximately 0.2–0.28%.
While air dust will cause friction changes if it enters the cylinder, it is best to add an air filtration membrane to the open air inlet of the measuring cylinder.
- (D)
Errors caused by buoyancy and installation verticality
In a typical environment, the buoyancy is equivalent to 0.015% (150 ppm) of the weight of the weights, and its error is negligible.
The calibration device is installed at a vertical deviation of 90 degrees so that the vertical component of the force is reduced, and the value of the reduction is proportional to the cosine of the angle of deviation; if there is a deviation of 1 degree, there is a 0.015% error. This calibration device’s installation tilt is less than 4 degrees, caused by the relative error and the rest of the main relative error, which, being at least one order of magnitude smaller, is negligible.
In summary, the maximum relative error of the calibration device is 0.52 percent.
4. Calibration Device Gas Chamber Temperature Equilibration Process
There are two waiting processes in a complete calibration process; waiting for the self-calibration weights to be detached from the balance can be achieved visually, while waiting for the gas temperature inside the measuring cylinder to stabilize needs to be estimated beforehand. SF
6 gas is introduced into the 6 mm diameter measuring cylinder from the body of the high-voltage electrical equipment through a thin pipe of 100 mm length and 2.5 mm diameter, with a maximum stroke of the measuring cylinder of 10 mm. According to the actual size of the gas chamber, the simulation model shown in
Figure 3 was built with the help of COMSOL Multiphysics 6.2 software. Since the actual three-dimensional model is a symmetric structure, and the distribution of the solution variables does not have a gradient change in the width direction, a two-dimensional model is used for simplification. A number of 2D cut-off points are set at half of the diagonal of the cylinder in the simulation model, to detect the temperature change in the cylinder when the ambient temperature changes suddenly.
The simulation algorithm uses two multiphysics field feature nodes to couple gas flow and heat transfer (non-isothermal flow), as well as surface-to-surface radiation and heat transfer in the gas. One is the non-isothermal flow node, and this node couples the laminar, k-ε, and fluid heat transfer interfaces for modelling fluid flow, where fluid properties depend on temperature. The other node is the surface-to-surface radiation heat transfer, which couples the surface-to-surface radiation of the tank and convective heat transfer in the gas. Considering the extreme case, if the initial temperature of the gas chamber and the ambient excitation temperature change abruptly between −40 °C and 70 °C, the temperature change at each node in the cylinder is measured as shown in
Figure 4. From
Figure 4a, it can be found that when the initial temperature of the gas chamber is 70 °C and the ambient excitation temperature is −40 °C, the temperature of the SF
6 gas in the measuring cylinder basically reaches the equilibrium state after about 8 s. From
Figure 4b, it can be found that when the initial temperature of the gas chamber is −40 °C and the ambient excitation temperature is 70 °C, the measurement of the SF
6 gas temperature inside the cylinder basically reaches the equilibrium state after about 10 s. According to the simulation results of measuring the temperature balance process inside the cylinder under extreme conditions, the waiting time for temperature stability in the actual calibration process should be set to at least 15 s.
The actual operation of the calibration device should not be exposed to direct sunlight and should not be influenced by strong heat sources. The ambient temperature should be kept as stable as possible, and periods with large temperature fluctuation should be avoided during on-site calibration. In addition, the SF6 density relay should have been working or standing under the calibration environment for at least 3 h before calibration.
5. Experimental Results and Analysis
The test device is shown in
Figure 5, and the volume of the core part of the entire device is approximately 2.25 m
3. The density relay used for the experiment is the KTD100P type density relay (No. 01306422) produced by Zhengshi Industrial Automation Co., Ltd. in Taian City, China, with alarm values of 0.6 MPa, 0.55 MPa, and 0.5 MPa. The standard pressure gauge is a 0.25 class precision pressure gauge (No. HC73582808052) from Hongqi Instrument Co., Ltd. in Yueqing City, China. In addition, gas cylinders were used to simulate SF
6 gas tanks in high-voltage electrical equipment.
The working process of the calibration device is divided into two stages: self-calibration and calibration of the density relay. As shown in
Figure 6a, during the self-calibration state, valve 1 and valve 3 are closed, and valve 2 is open. The pressure-reducing valve 1 is adjusted to supply air to the lifting cylinder, which lifts the force balance. The reading of the force balance indicates the mass of the calibration weights. The balance is self-calibrated by comparing the weight mass with the balance reading. As shown in
Figure 6b, during the calibration state of the density relay, valve 1 is open, and valves 2 and 3 are closed. The measured gas is introduced into the measuring cylinder through valve 1. The rod of the measuring cylinder extends to the force balance, and the balance reading is converted to a pressure value at 20 °C. The SF
6 density relay is then calibrated.
5.1. Force Balance Accuracy Calibration
Firstly, the precision of the key component, the force balance, in the calibration device is calibrated using a standard pressure gauge, to ensure that the error of the force balance is within the allowable range. The experimental steps are as follows: (1) inflate the lifting cylinder to lift the force balance; (2) compare the mass of the weights and the balance readings to complete the self-calibration; (3) disconnect the lifting cylinder from the air supply and return to the pressure measurement state.
Table 3 shows the experimental data and error analysis for the accuracy of the force-measuring balance; the relative error at each point in the test is less than 0.5%, so the self-calibrating device meets the accuracy requirements for calibrating the density relay.
The force balance lifts a total mass of 1 kg of weights, and the reading of the force balance is converted into a mass result. The errors of the five readings are shown in
Table 4. It can be seen that the absolute errors are all less than 1.5 g. Therefore, the test device has achieved self-calibration.
5.2. SF6 Density Relay Calibration
At an ambient temperature of 26.7°, the tank is pressurized to a certain pressure value, and readings are taken from the standard gauge and the test set at least five points, from high to low. At each point, the theoretical value of the dynamometer is calculated using the conversion factor K. The absolute error is then calculated and converted to the full-scale relative error.
Table 5 shows the results of the calibration test for the SF
6 density relay, from which it can be seen that the accuracy of this density relay is within the permissible range.
5.3. Battery Pack Power Consumption Test
The standby current of the test device is 10 µA, and the maximum operating current is 125 mA. The single operating time is about 15 s, resulting in a power consumption of 0.125 × 15/3600 = 0.0052 AH per calibration cycle.
Table 6 shows the power consumption analysis for different calibration frequencies over a 5-year cycle. Therefore, by selecting a suitable lithium-ion battery pack, the device can be fully applied in the field without 220 V AC working power. However, under some extreme temperatures, such as below −40 °C, the internal resistance of the battery will increase to 8 times the normal temperature, the voltage will drop to below 2.7 v, and the capacity will be only 15% of the nominal value.
Finally, the online calibration device for the SF
6 gas density relay based on balance pressure measurement proposed in this paper is comprehensively evaluated in terms of calibration cycle, accuracy error, typical power consumption, usage scenarios, and calibration cost advantages, as shown in
Table 7 below.
The above comprehensive comparison clearly shows the significant advantages of this paper’s equipment in several key performance indicators, providing an efficient, reliable, and cost-effective solution for online calibration of SF6 gas density relays.
6. Conclusions and Limitations
This paper presents an online calibration device based on balance pressure measurement, which is simple in structure, light in weight, and low in power consumption. It can satisfy the calibration task for a long period of time by using a dry battery or a lithium battery, and it is suitable for field installation without a power supply. The calibration process of the SF6 density relay is divided into a self-calibration stage and a SF6 gas pressure measurement and conversion stage. By analyzing the influence of the force-measuring balance, gravity acceleration, the piston area of cylinder, the rubbing friction of cylinder, and the error of the installation verticality on the calibration device, the total synthetic relative error of the calibration device is controlled within 0.38%. According to the simulation results of the temperature balance of the gas chamber formed by the pipeline and the measuring cylinder in extreme cases, the time required to wait for the temperature of the gas inside the measuring cylinder to reach a stable level in the calibration process is not less than 15 s. In addition, according to the power consumption analysis of the device, the suitable lithium battery can be used in a field without a 220 V AC power supply to complete field calibration. The experimental results show that the calibration strategy proposed in this paper can be used to calibrate SF6 density relays effectively.
However, although the time required for the cylinder gas temperature to reach stability was observed in this study through a simulation model, the temperature fluctuation in the actual environment may be more complicated. In particular, in a scenario of extreme temperature difference or rapid temperature change, the temperature equilibrium time may be prolonged, which affects the calibration efficiency. In addition, the reliability of the device in harsh industrial environments, such as strong vibration, high humidity, or dust, has not been verified. It is hoped that in the future, it will be possible to incorporate machine learning algorithms to predict temperature trends and dynamically correct density values, and develop energy recovery technology to convert kinetic gas energy into electrical energy for storage during pressure relief.


