Article

An Adaptive Luminance Mapping Scheme for High Dynamic Range Content Display

1
Changchun Institute of Optics, Fine Mechanics and Physics, Chinese Academy of Sciences, Changchun 130033, China
2
Daheng College, University of Chinese Academy of Sciences, Beijing 100049, China
3
Changchun Cedar Electronics Technology Co., Ltd., Changchun 130103, China
*
Author to whom correspondence should be addressed.
Electronics 2025, 14(6), 1202; https://doi.org/10.3390/electronics14061202
Submission received: 14 February 2025 / Revised: 12 March 2025 / Accepted: 17 March 2025 / Published: 19 March 2025

Abstract

:
Ideally, the Perceptual Quantizer (PQ) for High Dynamic Range (HDR) image presentation requires a 12-bit depth to ensure accurate quantization. In most cases, mainstream displays employ a limited 10-bit PQ function for HDR image display, resulting in notable issues such as perceived contrast loss and the emergence of pseudo-contours in the image hierarchy, particularly in low-brightness scenes. To address this issue, this paper proposes a novel luminance mapping relationship while preserving a 10-bit depth. Unlike conventional methods that derive PQ using a fixed Just Noticeable Difference (JND) fraction, this approach incorporates an adaptive adjustment factor. By adjusting the JND fraction according to brightness levels, this method effectively optimizes the quantization interval, improves reproducible contrast, and ensures uniform perception. The results demonstrate that the proposed approach effectively reduces the perception of contrast loss in low-brightness scenes, eliminates potential artifacts, and enhances the presentation quality of the display system.

1. Introduction

Dynamic range in photography refers to the spectrum of luminance variations from the darkest to the brightest parts of an image. Throughout human evolution, our visual system has developed a high dynamic range to adapt to varying environmental conditions, whether exposed to bright sunlight during the day or navigating in low-light environments at night. Burns and Baylor found that the instantaneous dynamic range of the human visual system spans five orders of magnitude, with overall luminance detection extending up to fourteen orders of magnitude following adaptive adjustments [1]. Traditional Standard Dynamic Range (SDR) displays exhibit limited detail and are unable to fully capture the visual fidelity sought by human perception. As display technology progresses, HDR technology is rapidly emerging as a preferred solution for achieving more realistic visual displays. The significant enhancement in peak brightness of HDR displays facilitates a more accurate replication of real-life scenes, closely mirroring human visual perception [2,3]. In addition to hardware factors such as peak brightness, control accuracy, and device characteristics, the transfer function also plays a crucial role in determining the final display effect.
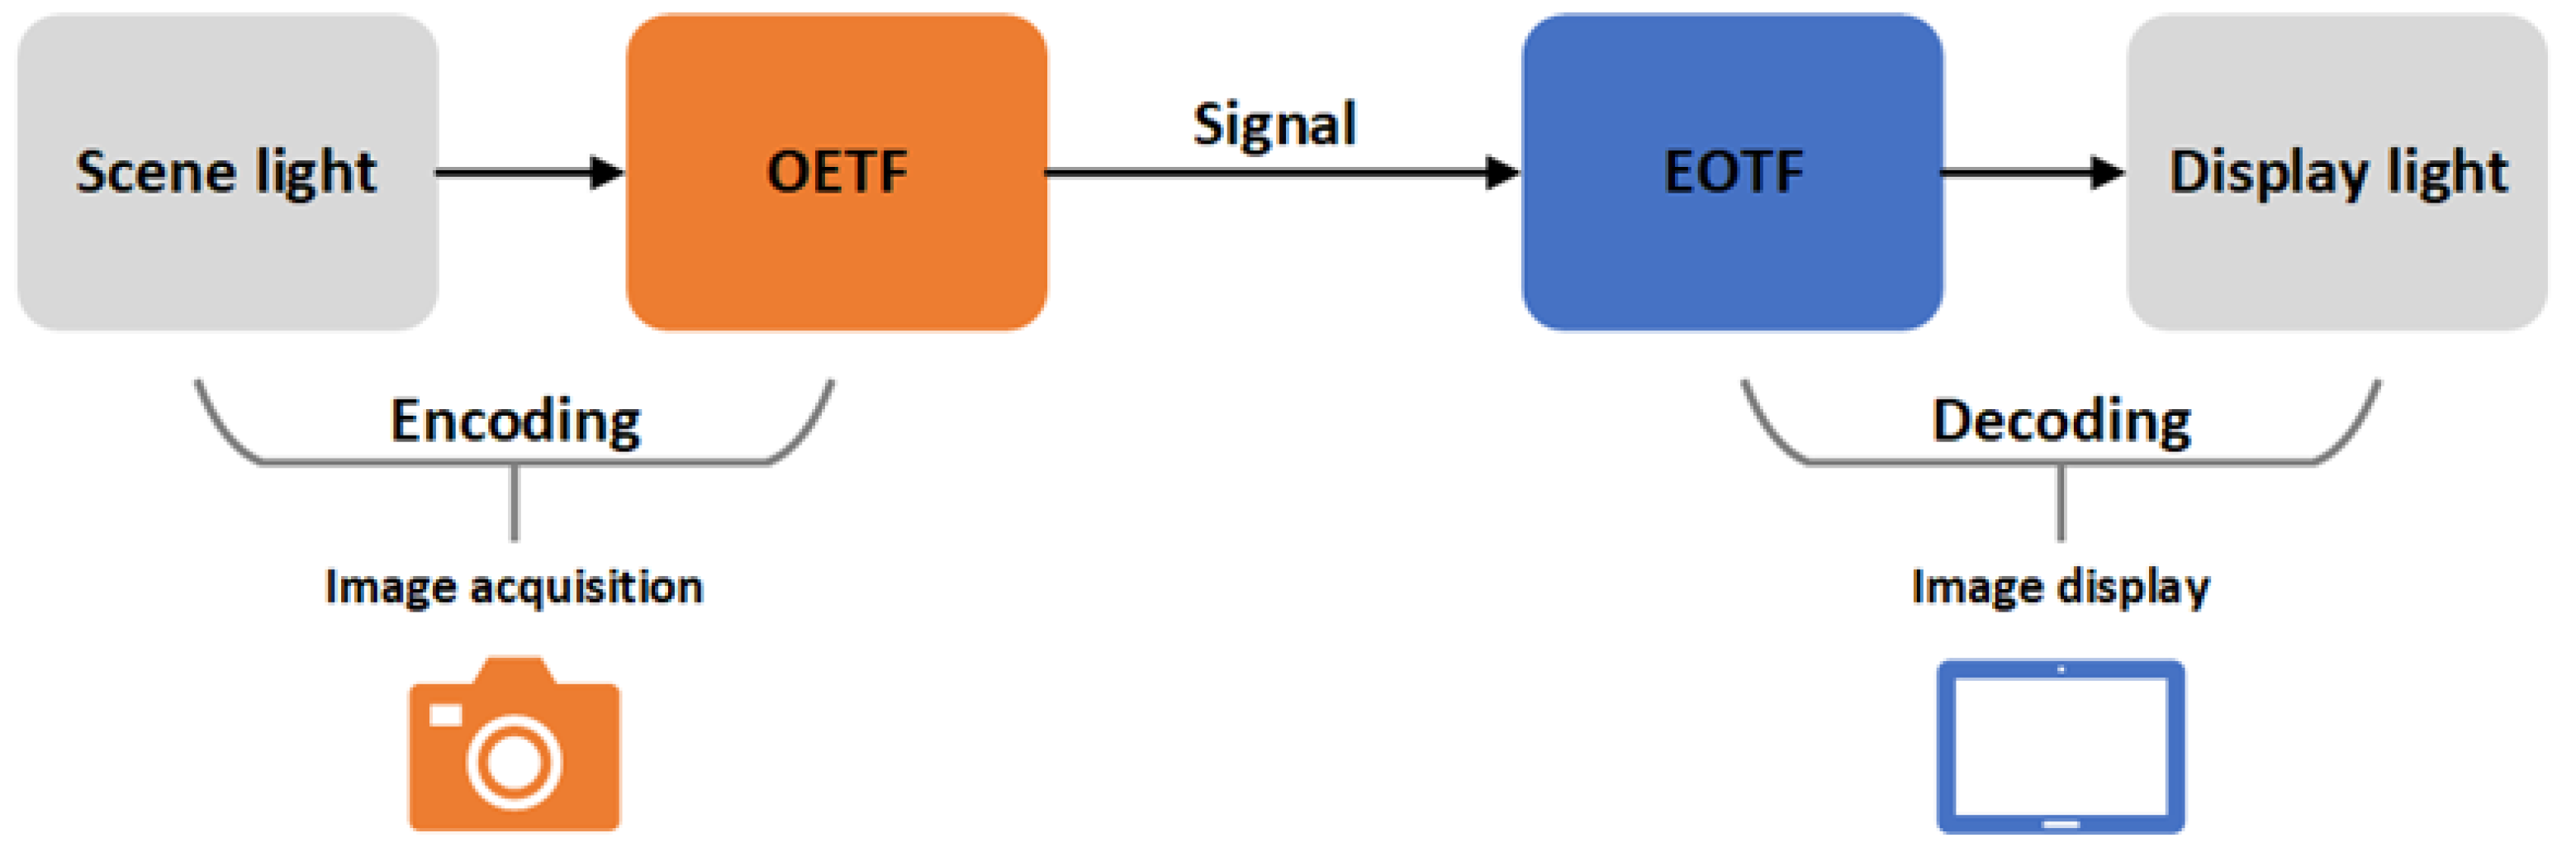
The transfer function is extensively employed in image acquisition and display, illustrating the relationship between actual brightness and digital signals. Acquisition equipment employs the Opto-Electronic Transfer Function (OETF) to transform actual brightness into digital signals, whereas display terminals utilize the Electro-Optical Transfer Function (EOTF) to convert digital signals into optical signals for screen presentation [4]. The design of the EOTF directly affects the level of quantization noise, potentially leading to color banding and artifacts that resemble contour lines. These imperfections introduce noticeable discontinuities in brightness or color within the otherwise smooth transitions in the image [5]. 
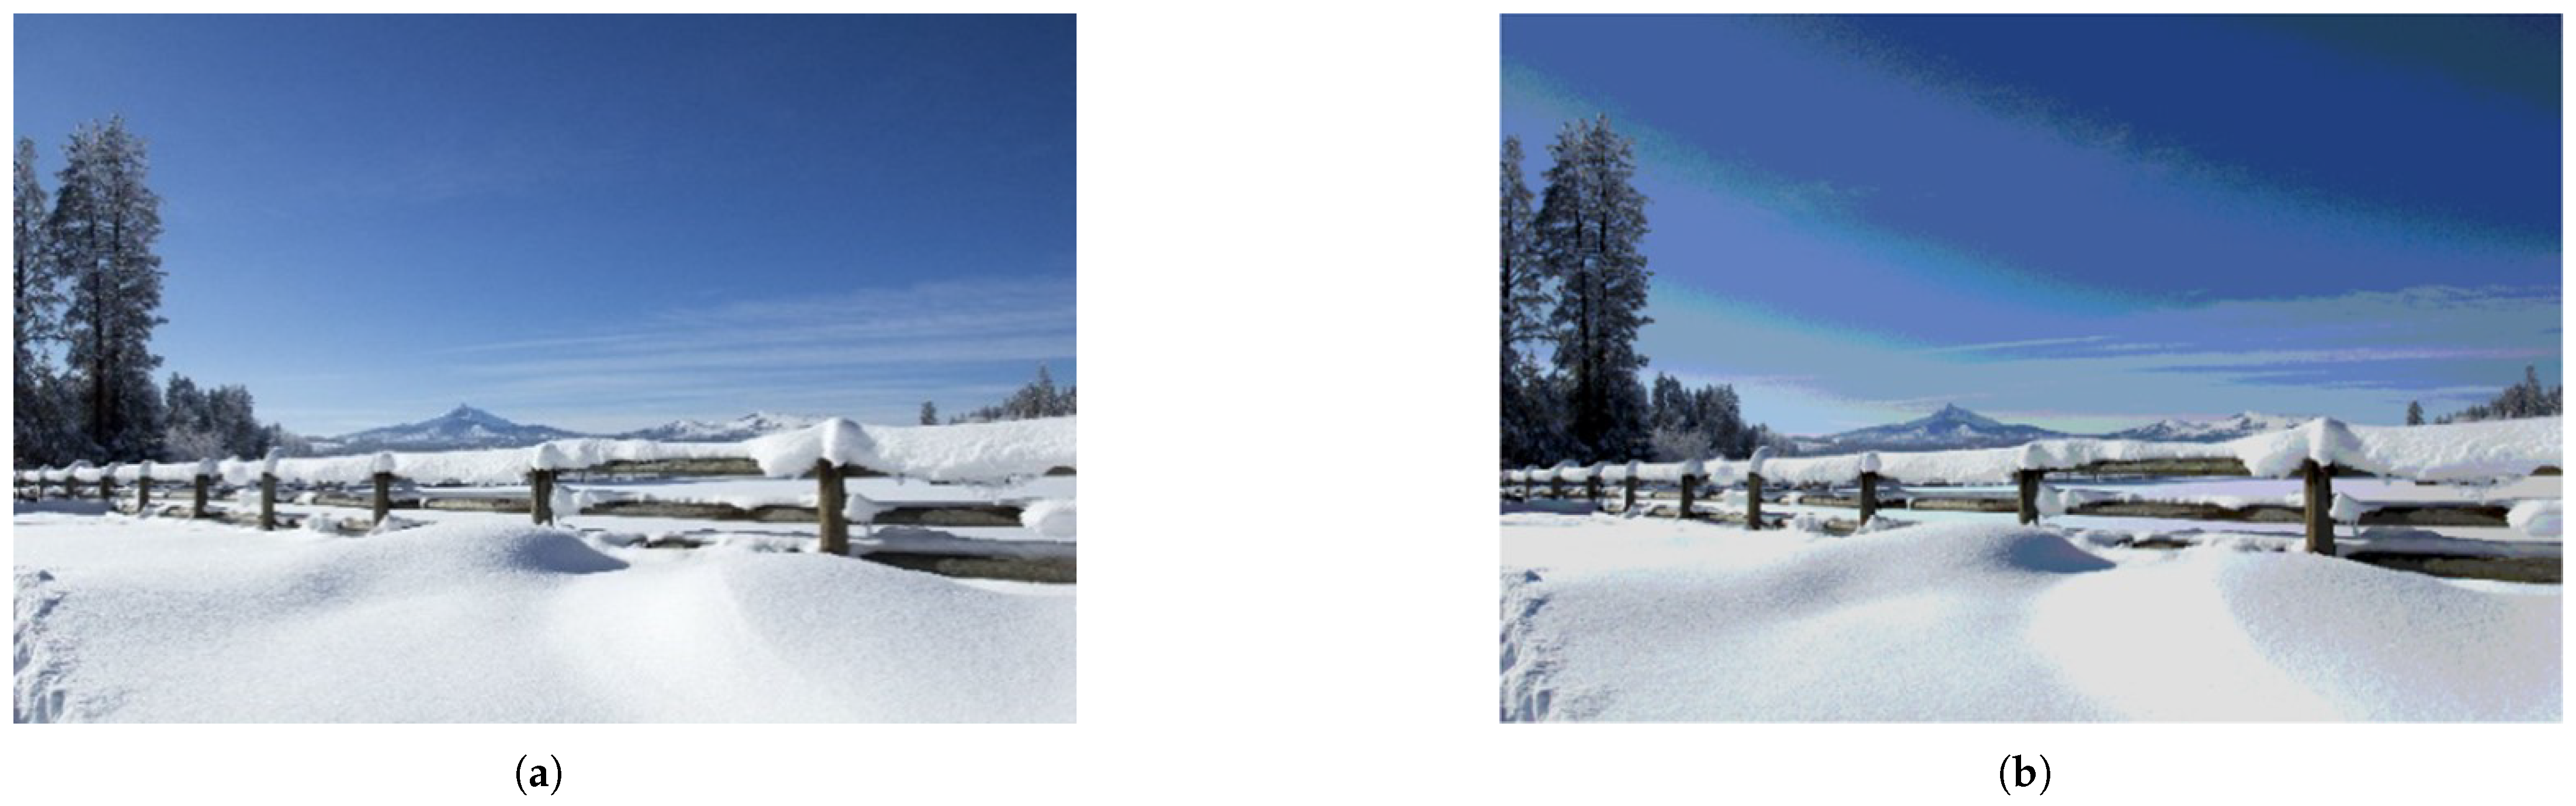
Figure 1 demonstrates an extreme case of quantization noise, where discrepancies between the luminance mapping of the EOTF and human visual perception lead to pseudo-contours in otherwise smooth regions. To mitigate these artifacts, the nonlinear characteristics of the EOTF must align with human visual perception.
The SDR system employs a transfer function known as ‘gamma’, with the nonlinear mapping it achieves referred to as ‘gamma correction’. It is widely accepted that ‘gamma’ originates from the Stevens power law [6]. The ‘gamma’ value typically ranges from 2.2 to 3.0 depending on the display material. In standards such as ITU-R BT.709 [7] and ITU-R BT.1886 [8], OETF is defined with a gamma value of 0.45, while EOTF is defined with a gamma value of 2.4. However, for HDR displays, ‘gamma’ alone is insufficient. With an increased dynamic range, a higher bit depth is necessary to effectively expand the luminance range; otherwise, visible artifacts may emerge [9].
Numerous studies have explored the optimal alignment between display terminal characteristics and input digital signals to support HDR systems. The UK’s BBC and Japan’s NHK have jointly introduced Hybrid Log-Gamma (HLG) to meet the requirements of HDR technology in digital TV broadcasting. HLG is notable for its backward compatibility with standard dynamic range (SDR) content, enabling HLG content to deliver a more vibrant and dynamic visual experience on existing SDR display devices [10,
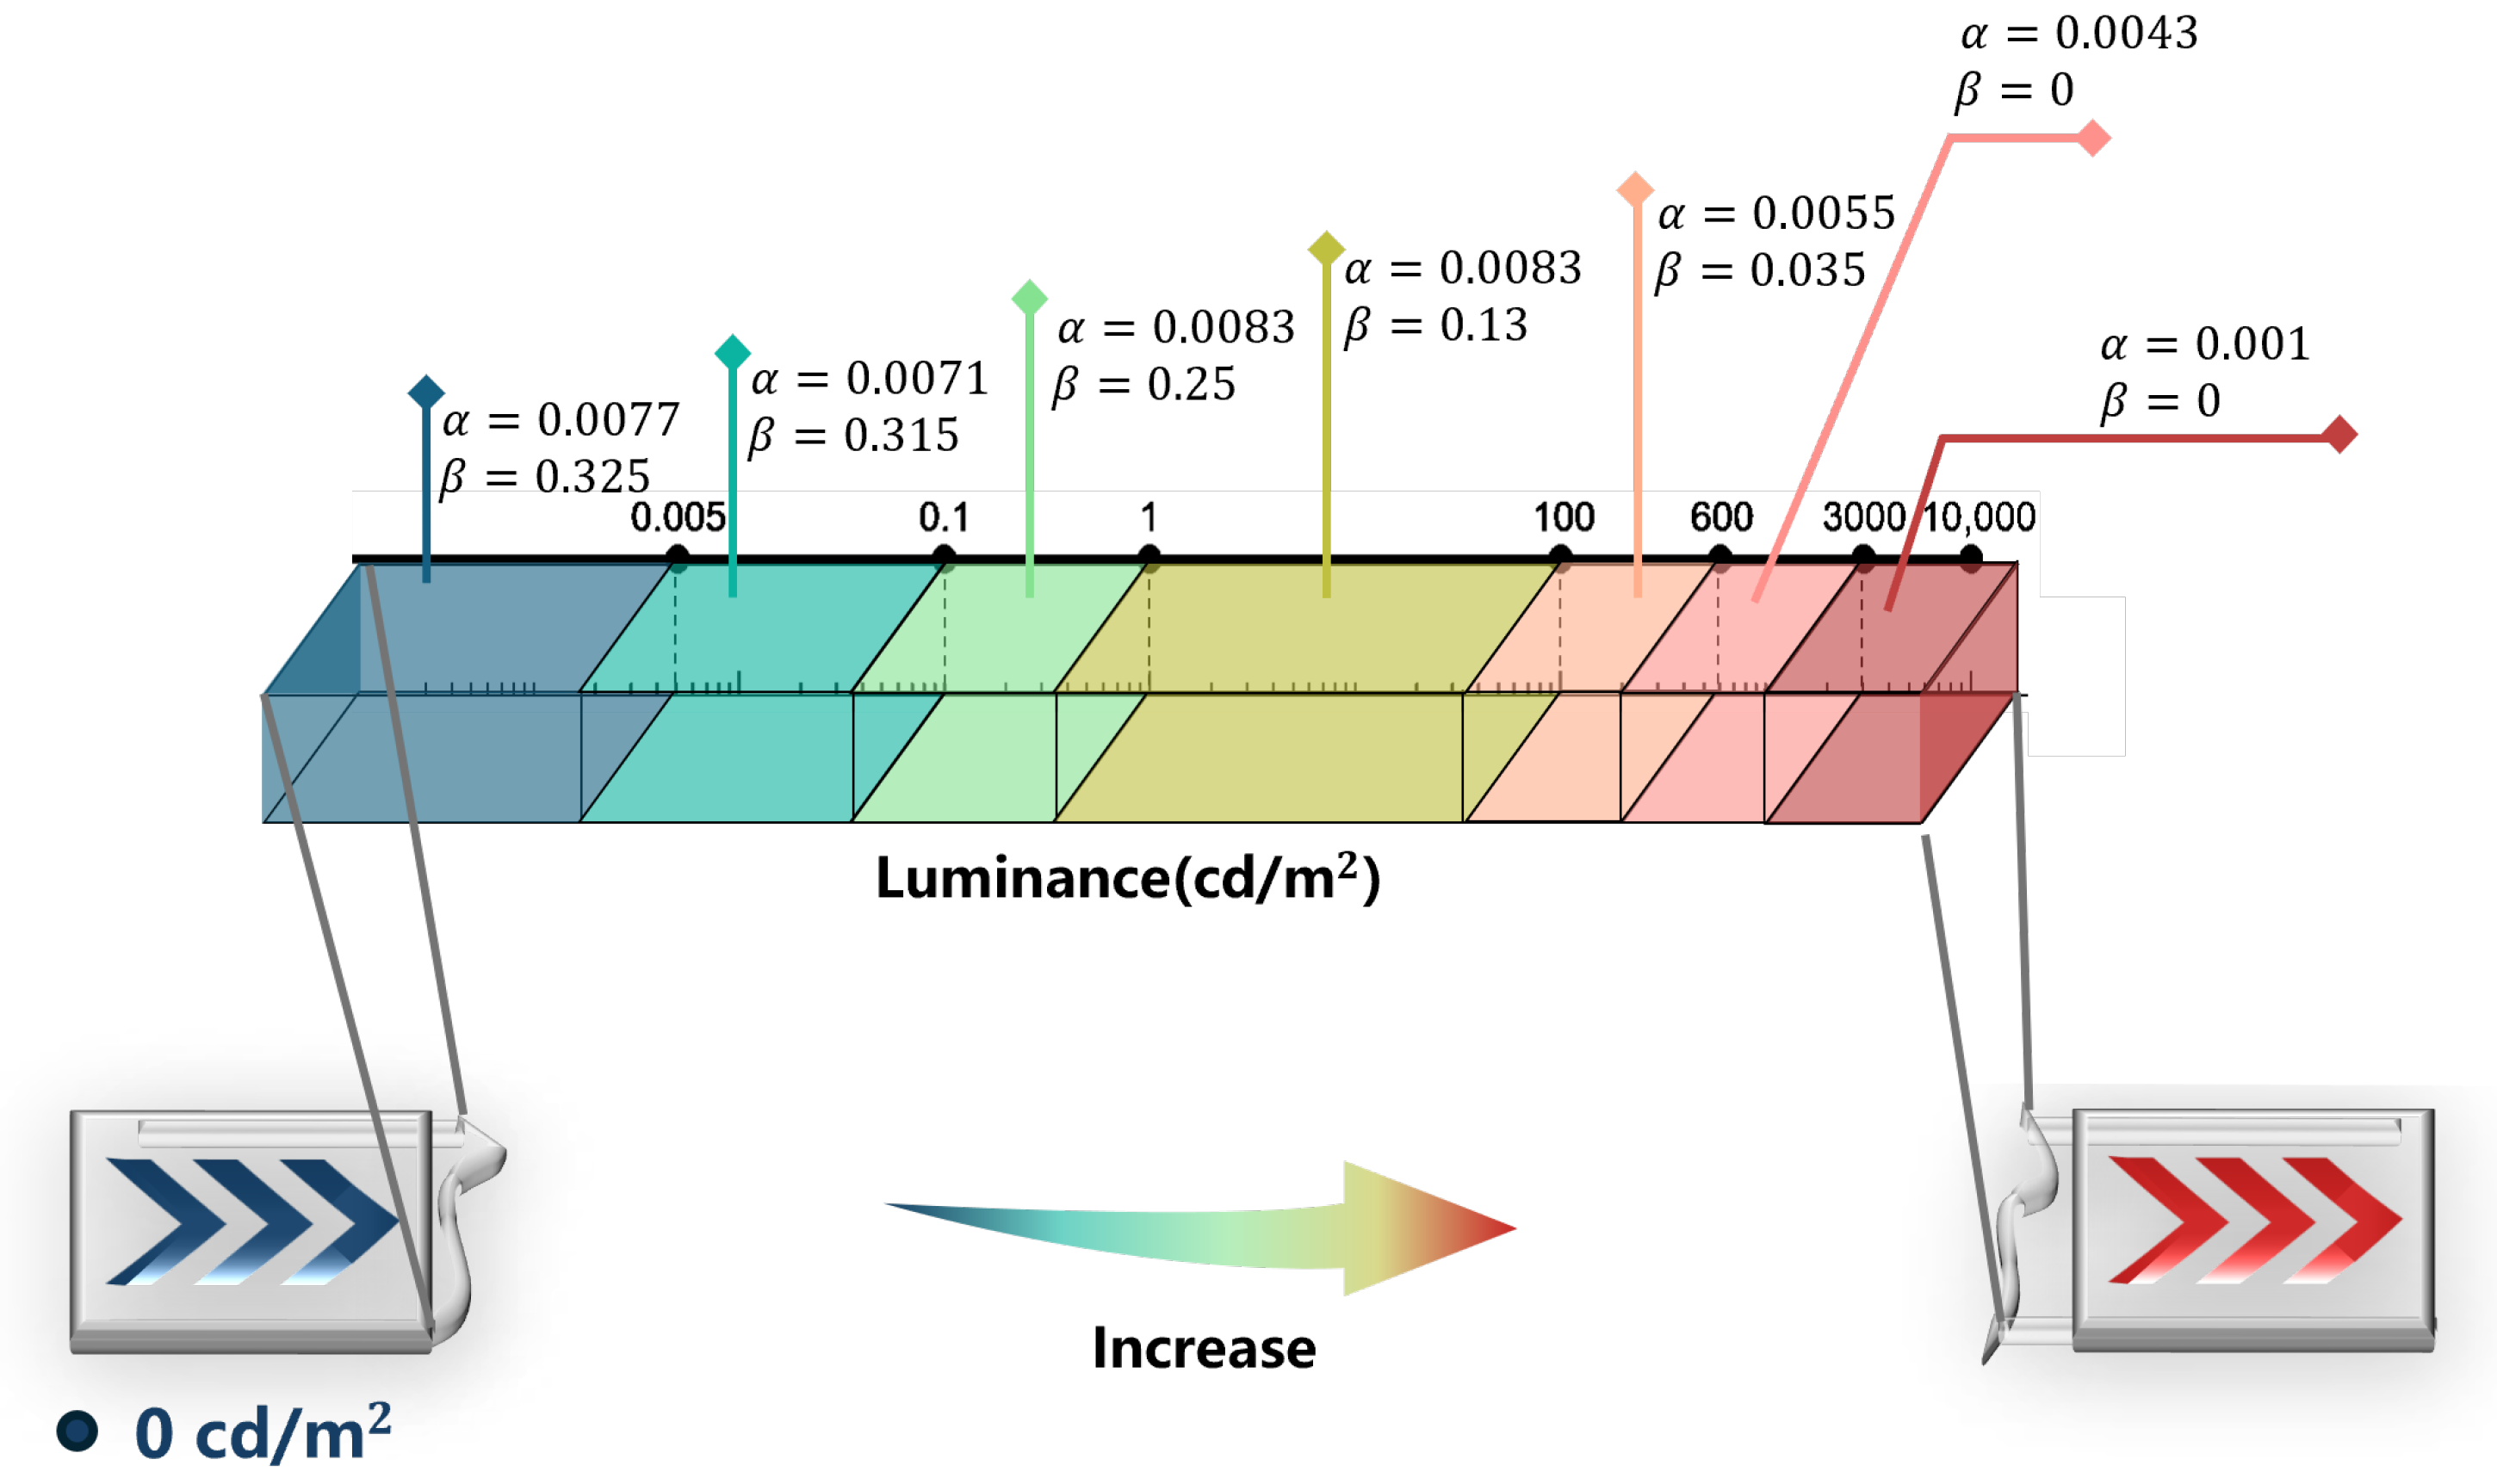
11]. Miller et al. introduced an EOTF known as Perceptual Quantizer (PQ), which is derived from Barten’s Contrast Sensitivity Function (CSF). This EOTF effectively quantizes luminance levels ranging from 10 6 to 10,000 cd/m2 using a 12-bit integer depth [12]. Due to compatibility issues with current consumer electronics, the 10-bit PQ is more commonly used as the EOTF for HDR displays to conserve resources [13]. PQ was standardized by the Society of Motion Picture and Television Engineers (SMPTE) in 2014 and is detailed in SMPTE ST-2084 [14]. Currently, both PQ and HLG are standardized by the International Telecommunication Union (ITU) and described in ITU-R BT.2100 [15]. Although 10-bit PQ has proven effective in many scenarios, distortion may still occur, particularly in high dynamic range conditions and low-brightness scenes where contrast information may not be fully preserved [12]. Yi Liu put forth a multi-modeling Electro-Optical Transfer Function [4] to enhance the 10-bit PQ. However, the method in question determines the parameter by calculating the average brightness of the content, which still carries the risk of visible artifacts for scenes with a considerable luminance span. In subsequent studies, Azimi et al. conducted further research in this area and proposed the PU21 encoding function [16] based on perceptual optimization. It is important to note that the original design goal of the PU21 framework is primarily focused on developing a quality assessment system for HDR video content rather than addressing the brightness mapping requirements of display terminal devices. This method employs a floating-point numerical encoding scheme, which poses significant constraints at the engineering implementation level. Given that current display terminal devices typically use a brightness mapping method based on a lookup table (LUT), converting the floating-point encoding scheme of PU21 to an integer encoding format will inevitably introduce quantization errors, resulting in the loss of image details and color gradation breaks. Therefore, from the perspective of display system engineering implementation, the PU21 framework has considerable limitations in terms of adaptability for terminal device applications. Thus, developing a new luminance mapping approach based on the CSF is crucial to enhance contrast retention and optimize the display quality of HDR content.
This paper examines the discrepancy in accuracy between the discrete relationship directly derived by Miller et al. [12] using Barten’s Contrast Sensitivity Function and the digital signal sampled after fitting to the PQ EOTF. To address the limitations of 10-bit PQ, a solution is proposed by us. This solution involves segmenting the entire range of brightness into multiple intervals, incorporating adaptive adjustment factors specific to each interval, and modifying the JND fraction by utilizing different parameters to establish a revised mapping relationship. Notably, this new mapping relationship requires a bit depth of only 10 bits. To assess its effectiveness in the HDR display process, the evaluation method outlined in ITU BT.2246 [17] was employed to predict and assess display results by comparing reproducible contrast. Additionally, the display effect was objectively evaluated through tPSNR and HDR-VDP-3 [18,19]. The results indicate that the mapping relation suggested in this study effectively preserves contrast information when compared to the standard 10-bit PQ. This helps in addressing issues like color banding and artifacts that can arise when displaying content in dark scenes, ultimately enhancing the visual quality of HDR content.
For the remainder of this paper, the structure is as follows: Section 2 discusses the application of human visual perception and contrast in the classical EOTF while outlining the proposed mapping relationship and the corresponding computational procedure. Section 3 presents the experimental results and compares them with those of the classical EOTF. Finally, Section 4 concludes the paper.

2. Methods

2.1. Visual and Perceptual Contrasts in the Human Eye

The visual quality of images is closely tied to the human eye’s perception mechanism, given that images are ultimately intended for human observation. When the luminance difference surpasses the contrast threshold of the human eye, the change becomes perceptible. If the original smooth luminance transition becomes noticeably uneven during quantization, it is considered to produce artifacts. Additionally, the appearance of artifacts is influenced by the Mach band effect of the human visual system. The Mach band effect, first identified by Austrian physicist E. Mach in 1868, is a subjective contrast phenomenon at edges. When two adjacent regions with slightly different luminance levels are viewed, the contrast at their boundaries is exaggerated, causing the edges to appear more prominent [20]. To achieve optimal output, it is necessary to establish a mapping relationship that makes the displayed image imperceptible to the human eye. This approach is both resource-efficient and ensures optimal display quality. Psychophysical studies are required to achieve this goal. The following analysis examines the impact of EOTF derived from various human visual models.
Several psychophysicists have extensively investigated the visual properties of the human eye, with the Stevens power law, the Schreiber fusion model [21], and Barten’s CSF [22] being the most widely used models for display systems. The Stevens power law, a model rooted in the uniformity of the power function, supersedes the Weber–Fechner law and effectively describes a broader range of sensory comparisons. It defines the relationship between human visual perception and luminance, as described in Equation (1).
ψ ( I ) = k · I a
The perceived intensity ψ ( I ) is determined by the stimulus intensity I, with k as a proportionality constant and a as an index dependent on the mode of perception. The ‘gamma’ EOTF utilizes this principle to enhance image display performance and correct distortion caused by the nonlinear relationship between human visual perception of luminance and the physical properties of the display device. The basic form of this EOTF is expressed in Equation (2).
L i = L p · i 2 n 1 γ w i t h i = 0 2 n 1
where L i represents the display brightness at the ith code value, L p is the peak brightness, n denotes the bit depth, and γ is the correction factor. In 1992, Schreiber reintegrated and introduced a fusion model based on both the Weber–Fechner law and the Stevens power law. This model posits that the human eye perceives luminance as square-root homogeneous up to 1 cd/m2 and logarithmically homogeneous beyond 1 cd/m2. The Schreiber threshold, derived from this model, was included in the ITU-R BT.2246 report in 2011 to assess luminance reproduction discontinuities in EOTF. Additionally, the HLG OETF, which is grounded in the Schreiber fusion model, was proposed by the BBC. The inverse of the HLG function serves as the EOTF at the display terminal [10], as defined by Equation (3).
E = O E T F 1 E = E r 2 , 0 E r exp E c a + b , r E
where E represents the digital signal for the R, G, and B color components, while E denotes the linear light intensity of each component. The coefficients are r = 0.5, a = 0.1788, b = 0.2847, and c = 0.5599. The scene brightness, based on the linear color components, can be derived as follows:
L s = 0.2627 R + 0.6780 G + 0.0593 B 12
Finally, the display brightness is determined by the following equation:
L d = α · L s γ + β
The values of α , β , and γ depend on the viewing environment. For instance, the BBC provides an example with a peak luminance of 4000 cd/m2 and γ = 1.6 .
Barten’s CSF not only accounts for the human eye’s sensitivity to luminance but also includes spatial frequency, viewing angle, and other factors that affect visual perception. Barten’s model is highly regarded in perceptual research and is widely applied in imaging and display studies. With the introduction of typical parameters, the equation for the model [23] is given by (6).
C S F = S u , L = 1 m t = 5200 e 0.0016 ( 100 L + 1 ) 0.08 u 2 0.64 u 2 + 1 + 0.09 63 L 0.83 + 1 1 e 0.02 u 2
where u is the spatial frequency, L is the luminance, S is the contrast sensitivity, and m t is the modulation threshold. The 3D surface diagram of the model is shown in Figure 2a.
The modulation threshold m t in (6) is the inverse of the CSF and can alternatively be expressed as (7).
m t = L i + 1 L i L i + 1 + L i
The luminance relationship between any two levels can then be derived as shown in (8).
L i + 1 = L i · 1 + m t 1 m t
Weighting m t by the JND fraction f adjusts the step precision of luminance change at each level, which equals 1 JND when f = 1 and is expressed as (9).
L i + 1 = L i · 1 + f · m t 1 f · m t
Miller et al. developed an EOTF, also referred to as the PQ curve, which can cover a luminance range from 10−6 to 10,000 cd/m2, based on Equations (6) and (9) [12]. The authors defined spatial frequency as the frequency at which the human eye most distinctly perceives luminance at a fixed level, establishing a one-to-one relationship between luminance levels and spatial frequencies. This leads to contrast sensitivity becoming a single-valued function of luminance. By determining the initial luminance, the corresponding modulation threshold can be calculated by substituting the initial luminance into Equation (6). Subsequently, the next luminance level at an interval of f JNDs can be obtained by substituting the modulation threshold into Equation (9). This process is repeated until the resulting luminance exceeds or equals 10,000 cd/m2, with the number of obtained luminance levels representing the desired bit depth. The findings indicate that an EOTF designed based on Barten’s CSF requires a 12-bit depth, with f 0.9 covering the full 12-bit range when luminance varies from 10−6 to 10,000 cd/m2, achieving an accuracy of 0.9 JNDs per luminance. The luminance levels of the 12-bit depth are fitted to a smooth curve, referred to as the PQ curve, as shown in Figure 2b, which illustrates the placement of the PQ curve on the CSF.
The discrete result of the currently widely used PQ EOTF is a luminance mapping relationship derived from sampling and fitting the PQ curve. This method introduces significant quantization errors compared to the luminance results obtained through the previously mentioned methods. The reproducible contrast between these methods is illustrated in Figure 3. The figure demonstrates that quantization errors have a more pronounced effect on visual perception, particularly when displaying images with dark scenes. Barten (RAMP) generally exceeds other contrasts in Figure 3, while in the dark light range, 12-bit PQ sampling partly exceeds RAMP, indicating substantial quantization error. It is anticipated that the quantization error will be even more pronounced with 10-bit sampling.
Figure 4 illustrates the Minimum Detectable Contrast (MDC) threshold curves as defined in ITU-R BT.2246. The curves reveal that changes in luminance become imperceptible when the Reproducible Contrast (RC) falls below the Barten (RAMP) threshold, whereas the risk of artifacts increases when the ratio exceeds the Schreiber threshold. Comparative analysis reveals that the 10-bit HLG, 10-bit Gamma 3.0, and PU21 with integer quantization remain below the Schreiber threshold in the bright-light range yet surpass it under low-light conditions. The deviation between 10-bit Gamma 3.0 and integer-encoded PU21 is particularly pronounced, posing a significant risk of artifacts that reduce the visual fidelity of the display system. Furthermore, the figure highlights that although 10-bit PQ demonstrates high accuracy in the bright light range, it exceeds the Schreiber threshold in dark scenes, leading to potential contour artifacts. Therefore, an adaptive approach is necessary to maintain an appropriate reproducible contrast at 10-bit depth.

2.2. Luminance Mapping Relations Based on Adaptive Adjustment Factors

2.2.1. Discussion of JND Fraction Boundary

PQ was originally developed with a fixed JND fraction. When compressing 12-bit depth to 10-bit, adaptively adjusting the JND fraction based on varying luminance levels presents an ideal solution. However, increasing the JND fraction causes the solution vector to enter a complex space. This complexity stems from the fact that as the JND fraction increases, the inequality 1− f · m t < 0 in Equation (9) leads to L ( i + 1 ) < 0, making m t unsolvable in the real number domain. Therefore, it is essential to first determine the bounds of the JND fraction.
To ensure a meaningful result, f must satisfy f < 1 m t = S ( u , L ) . Subsequently, it is critical to establish the relationship between the JND fraction, spatial frequency, and luminance. First, we calculate the first-order partial derivative of the CSF with respect to spatial frequency u, which yields the result shown in Equation (10).
S u = 2600 e 0.0016 100 L + 1 0.08 u 2 1.28 u 63 L 0.83 + 1 1 e 0.02 u 2 0.04 e 0.02 u 2 u 0.64 u 2 + 1.09 1 e 0.02 u 2 2 0.64 u 2 + 1.09 63 L 0.83 + 1 1 e 0.02 u 2 3 / 2 = = = = = = = = = = = = 16.64 100 L + 1 0.08 u e 0.0016 100 L + 1 0.08 u 2 0.64 u 2 + 1.09 63 L 0.83 + 1 1 e 0.02 u 2
By setting S u = 0 , the function of u with respect to L can be determined when the perception S reaches its maximum value. However, deriving direct function expressions is challenging due to the complexity of the equations. Consequently, the problem is transformed into an intersection problem between two surfaces, where the intersection line represents the solution.
Rearranging the terms to set both sides of the equation to 0 results in Equations (11) and (12).
f u , L = 2600 e 0.0016 ( 100 L + 1 ) 0.08 u 2 1.28 u 63 L 0.83 + 1 1 e 0.02 u 2 0.04 e 0.02 u 2 u 0.64 u 2 + 1.09 1 e 0.02 u 2 2 0.64 u 2 + 1.09 63 L 0.83 + 1 1 e 0.02 u 2 3 / 2 = 0
g u , L = 16.64 100 L + 1 0.08 u e 0.0016 ( 100 L + 1 ) 0.08 u 2 0.64 u 2 + 1.09 63 L 0.83 + 1 1 e 0.02 u 2 = 0
We draw f ( u , L ) and g ( u , L ) in the same 3D coordinate system as in Figure 5.
Analyzing the two surfaces reveals that as u approaches 0, f ( u , L ) tends toward negative infinity, while g ( u , L ) approaches 0. Similarly, as u approaches positive infinity, f ( u , L ) and g ( u , L ) converge toward 0, with f ( u , L ) in the positive direction and g ( u , L ) in the negative. Notably, 1 L 0.83 is a real number and always greater than 0. Therefore, the two surfaces intersect along a single line within the valid interval. The intersection of the two surfaces is marked by the point where the yellow and blue lines cross in Figure 5. Identifying this intersection point allows Equation (13) to be fitted as
u = 1.383 · ( L 0.1671 ) 1 10.5 · ( L 1 2.168 )
Substituting (13) into (6) yields S ( L ) as (14).
S ( L ) = 208 exp 100 L + 1 2 / 25 2 L 125 / 326 21 1383 L 1671 / 10 , 000 1000 2 25 1 25 · 16 2 L 125 / 326 21 1383 L 1671 / 10 , 000 1000 2 109 100 1 1 50 · exp 2 L 125 / 326 21 1383 L 1671 / 10 , 000 1000 2 1 63 L 83 / 100
To ensure that the Reproducible Contrast (RC) [17] consistently stays below the Schreiber threshold (ST ), the condition R C < S T must be met. Substituting Equation (9) into the formula for RC yields Equation (15).
R C = 2 · f · m t = 2 · f S ( L ) < S T ( L )
Therefore, S ( L ) · S T ( L ) 2 represents the upper boundary of the JND fraction.
To maintain the bit depth of code values, establishing a lower boundary for the JND fraction is essential. Barten employed sinusoidal gratings in constructing the CSF [22] because they provide continuous contrast variation and uniform spatial frequency properties. However, for MDC thresholding, a sawtooth wave is more suitable, as it generates sharper edges and a gradual luminance pattern [9]. Since the relative amplitude of the fundamental frequency component of the Fourier series expansion of the sawtooth wave is 2 π , the Barten (RAMP) threshold is calculated as shown in Equation (16).
B a r t e n ( R A M P ) = 1 C S F 2 π = π 2 · m t
Given that human perception cannot detect brightness changes below the Barten (RAMP) threshold and that a 10-bit depth is inadequate to meet these requirements, we set the Reproducible Contrast (RC) between the Schreiber threshold and the Barten (RAMP) threshold, with π 2 representing the lower boundary of the JND fraction.
Based on this, the final value of JND fraction should satisfy π 2 < f < S ( L ) · S T ( L ) 2 .

2.2.2. Proposed Adaptive Adjustment Factor

Experimental results from subjective tests by Dolby Laboratories [24] indicate that luminance levels of 0.1 cd/m2 and 600 cd/m2 meet the black level and diffuse white maximum level requirements for 50% of viewers, respectively. Furthermore, luminance levels of 0.005 cd/m2 and 3000 cd/m2 satisfy these requirements for 90% of viewers. Based on the conclusion above, and considering that 100 cd/m2 is the reference white brightness of the ITU-R BT.1886 [8], this study divides the range of 10 6 –10,000 cd/m2 into 7 brightness intervals. The dividing lines are set at 0.005 cd/m2 for dark to night scenes, 0.1 cd/m2 for night to dim scenes, 600 cd/m2 for medium brightness to bright scenes, and 3000 cd/m2 for bright to dazzling scenes. Combined with the JND fraction value range, the adaptive adjustment factor is defined. The final value of the JND fraction is determined by the adaptive adjustment factor and the CSF, as expressed in Equation (17).
f i = S L i · α · L i β 0 < i < 1023
where f i is the value of JND fraction at the ith luminance level, S ( L i ) is the contrast sensitivity of the human eye at the ith luminance level for L i , and α , β are the adjustment parameters. The values of α and β for different luminance intervals are provided in Figure 6.
After calculating the JND fraction, it should be substituted for f i in Equation (9) to determine the next luminance level L i + 1 . Considering the quantization errors associated with fitting and sampling, the proposed mapping relationship is presented in tabular format in Supplementary Documents.
For different display systems, a deterministic relationship between the drive signal and absolute brightness can be defined, despite variations in drive characteristics. For instance, the brightness of an LED display can be approximated by a linear function of its drive current. According to the method described in this section, the mapping function between the quantization value (image gray level) and absolute brightness can be precisely constructed. Based on this, the LUT linking the quantized value to the drive signal of the display system can be further derived and stored in FLASH memory for real-time retrieval by the display system.

3. Results and Discussions

This section verifies and discusses the performance of the proposed mapping relationship. To assess the effectiveness of the proposed mapping on HDR display, we implement it on HDR video sequences for objective evaluation. The comparison is made between 10-bit PQ, multi-PQ as proposed in Ref. [
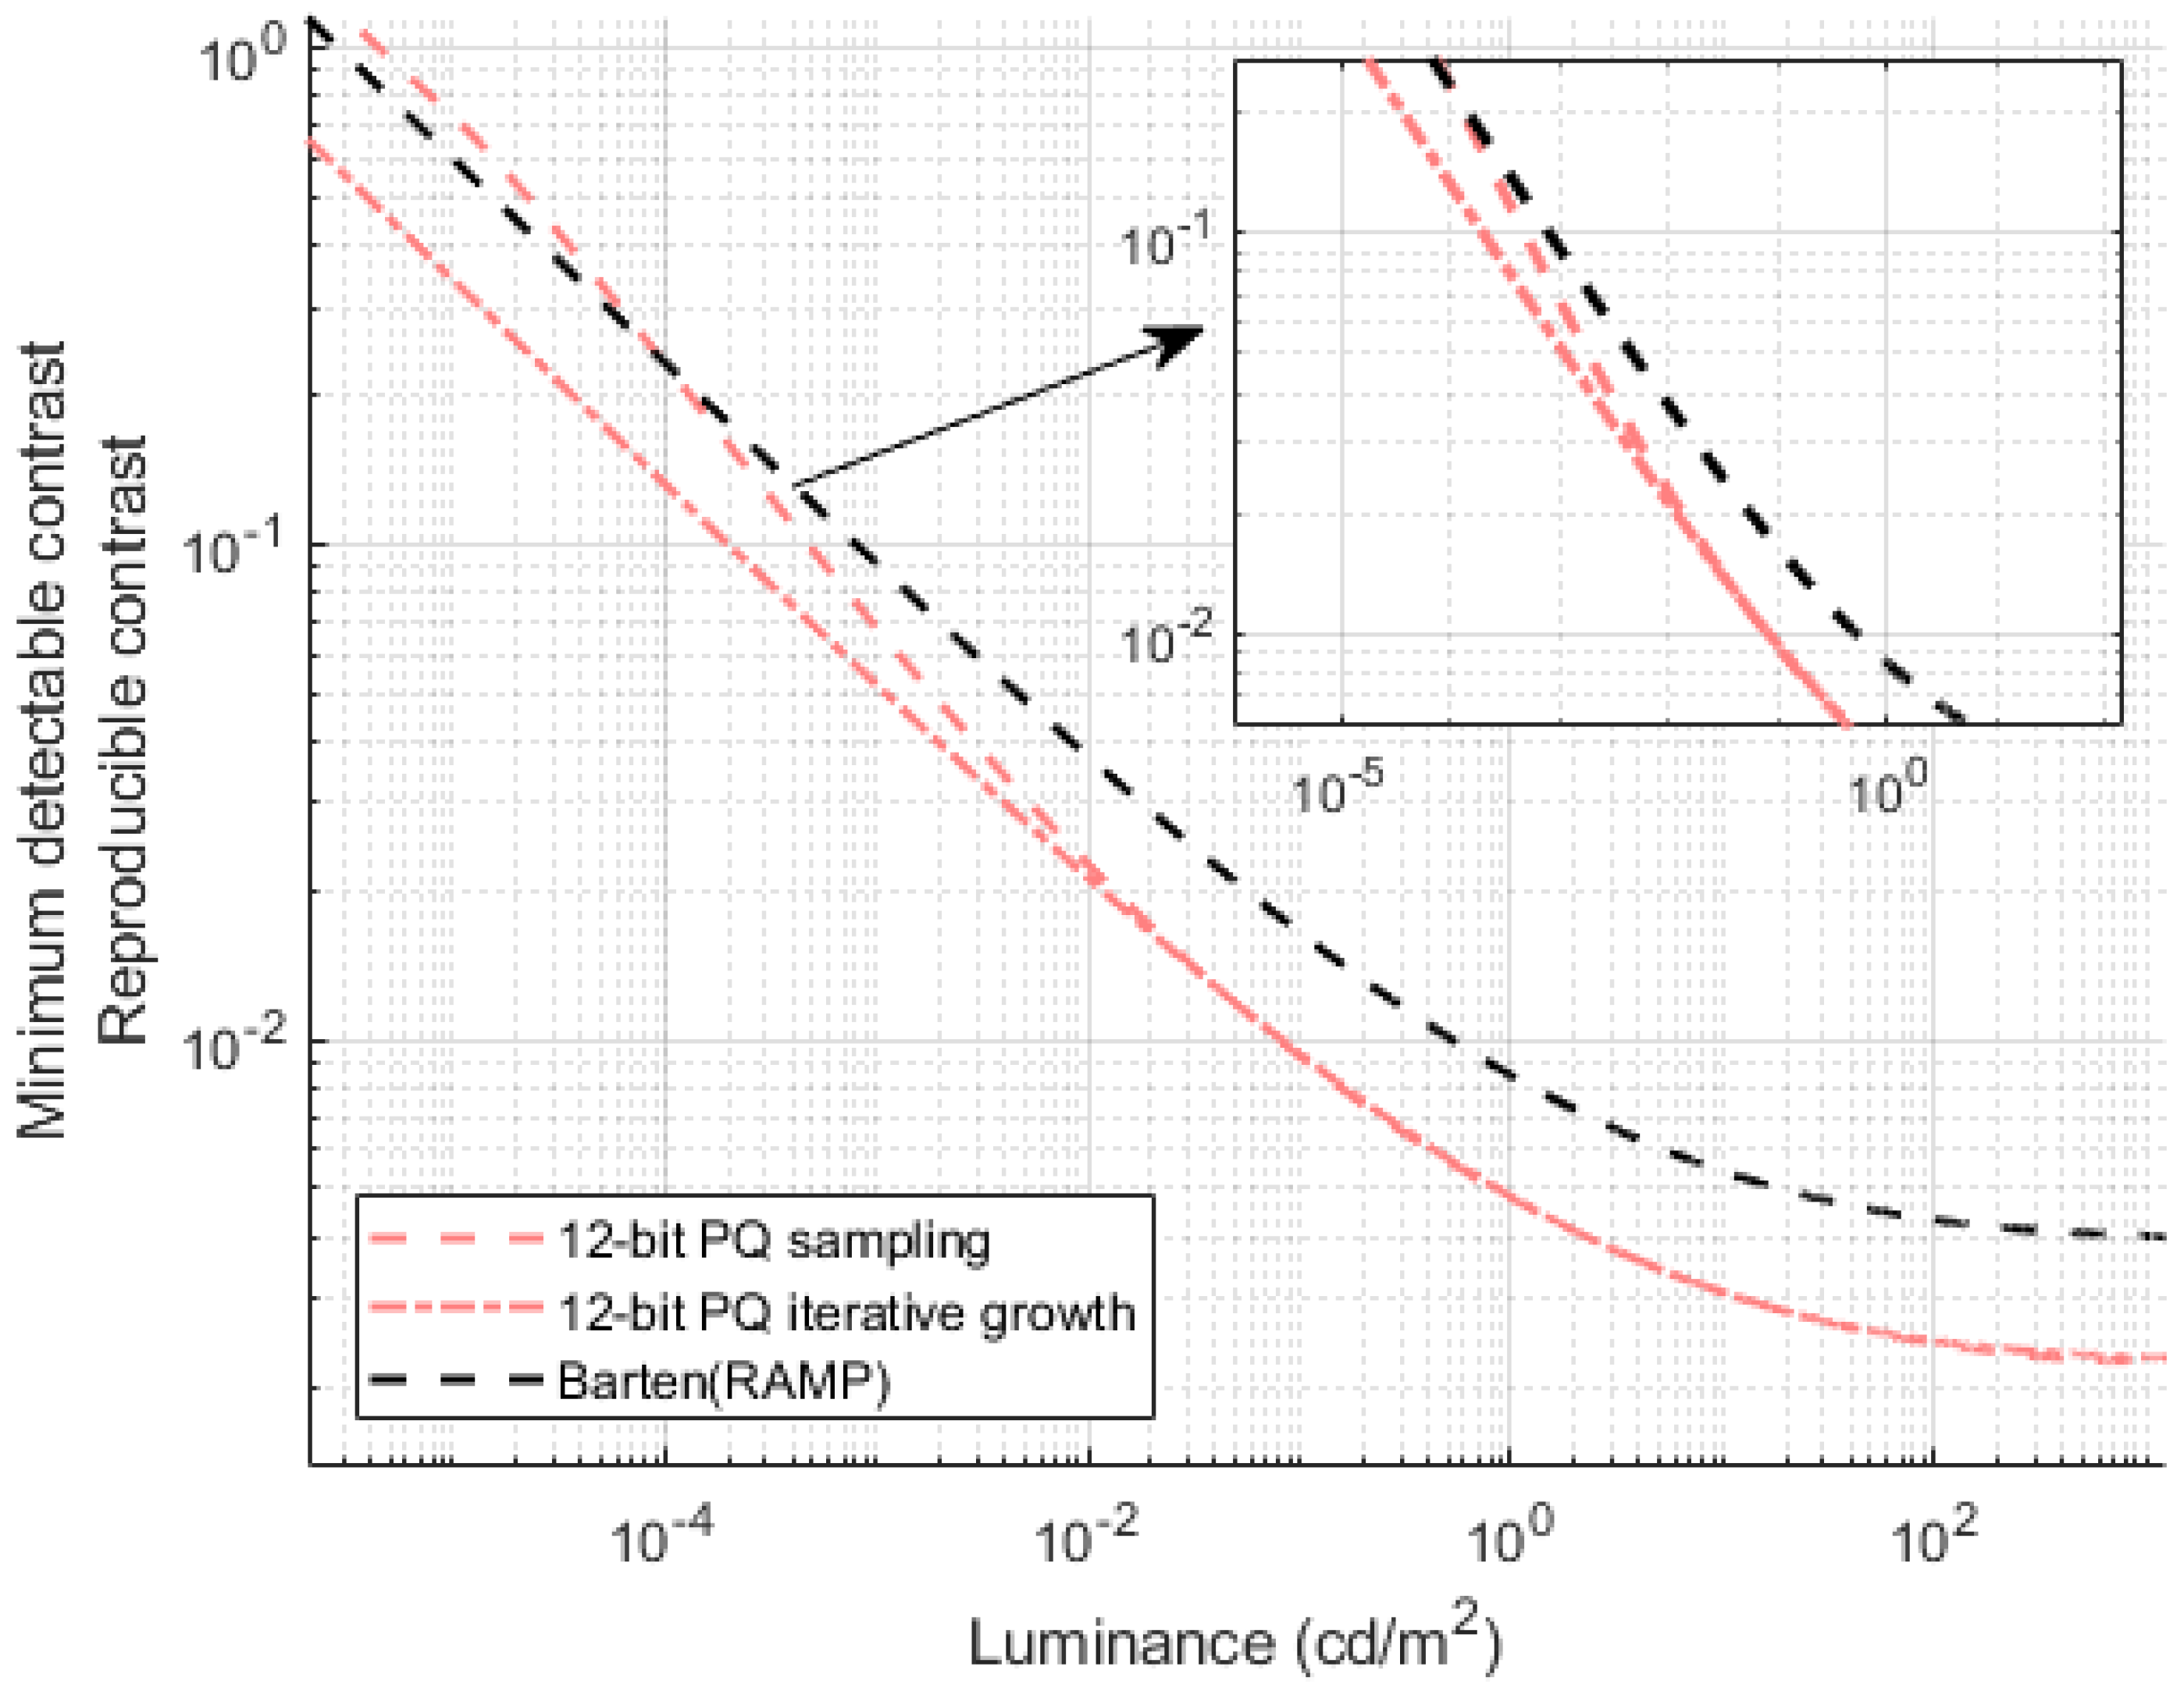
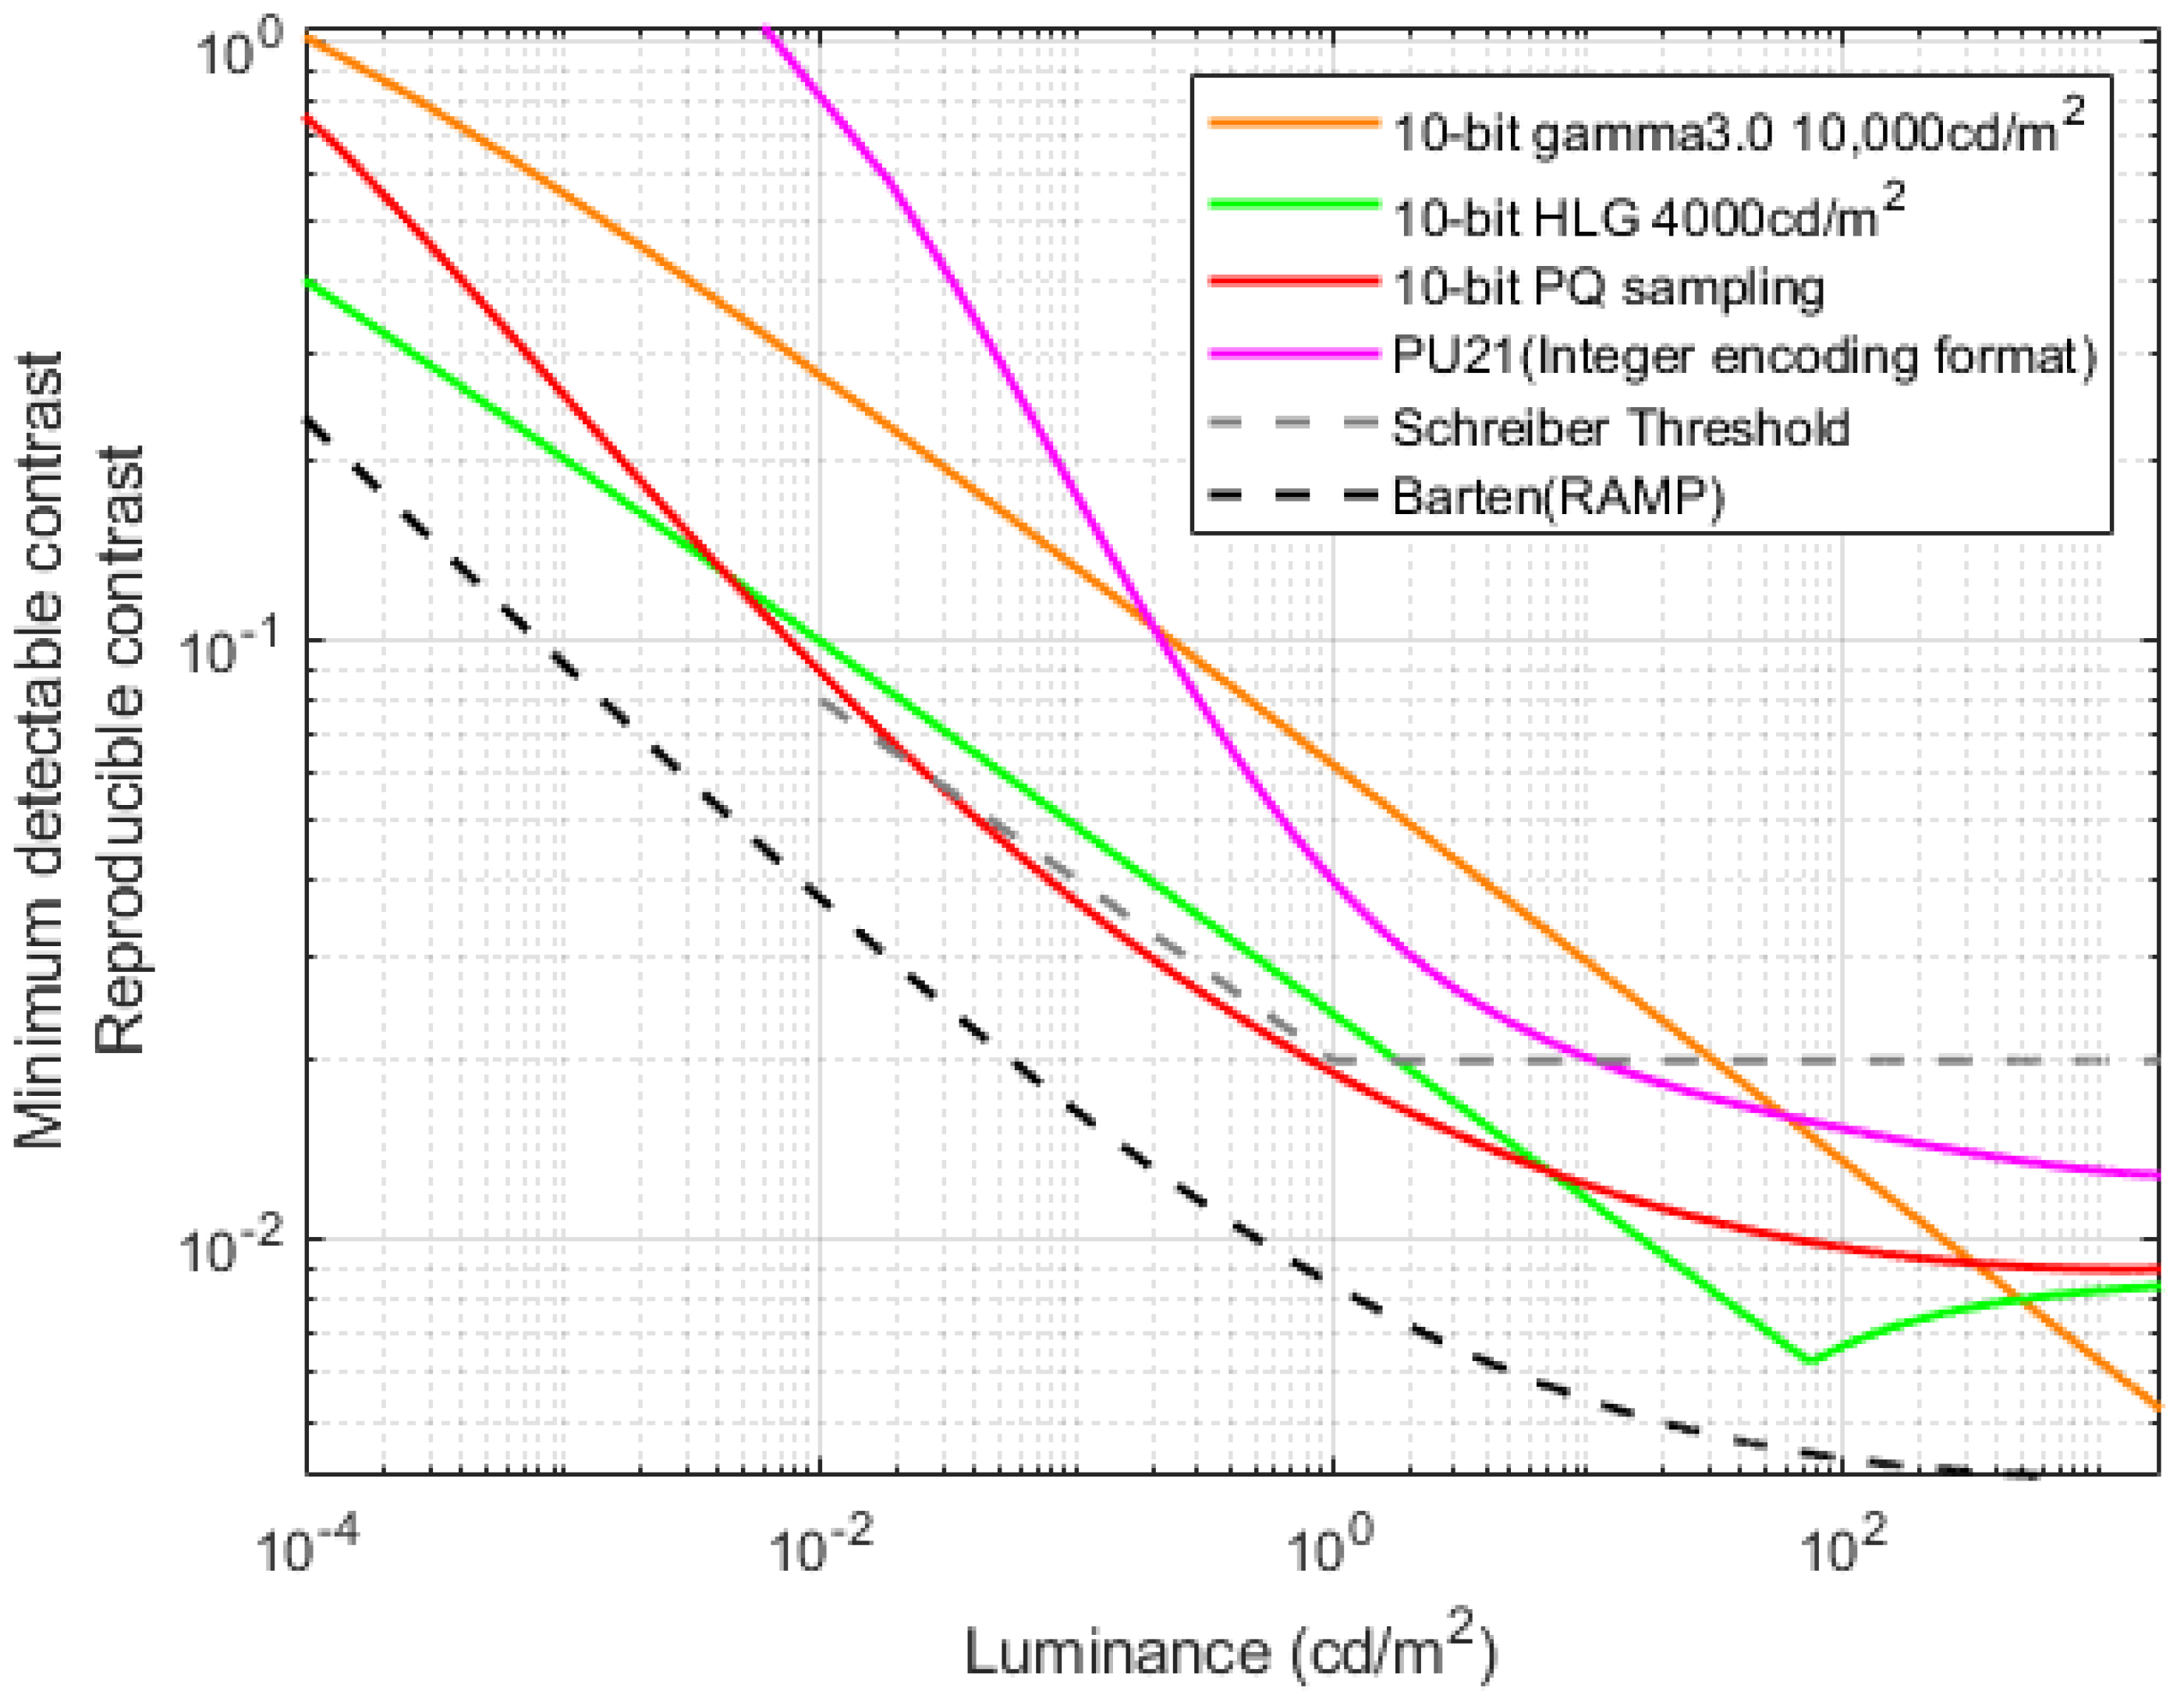
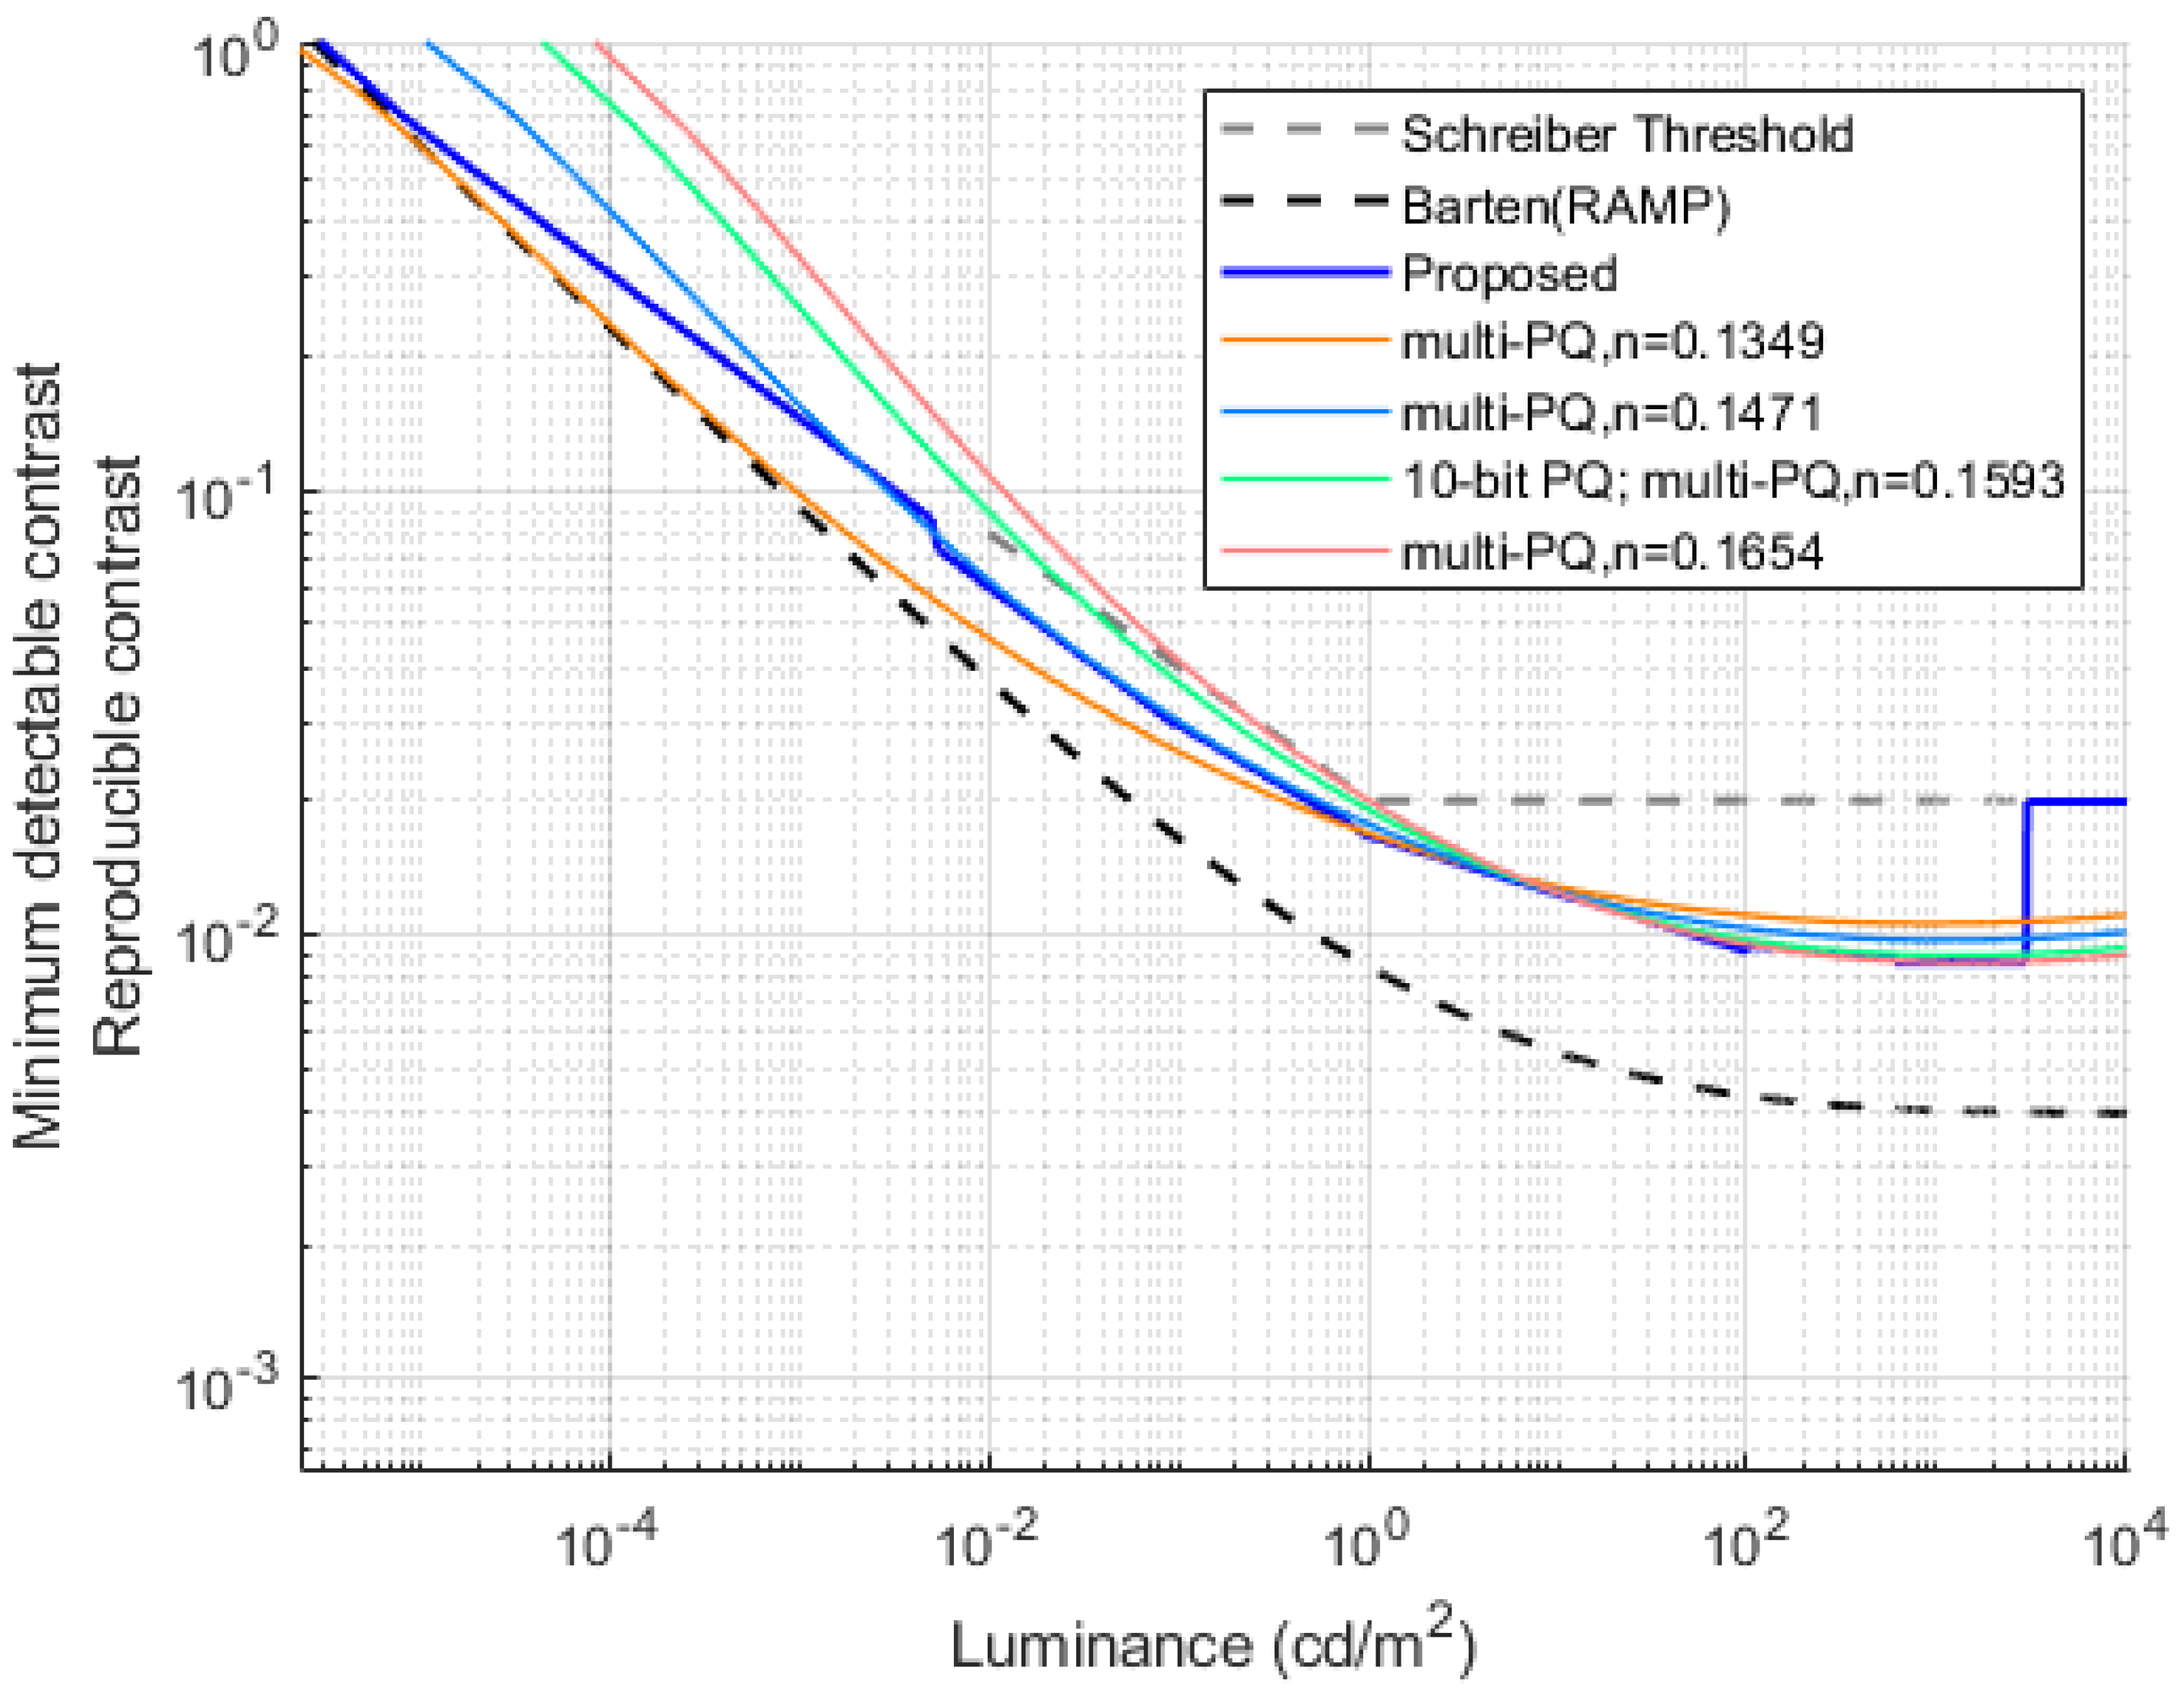
4], and the mapping suggested in this paper. Given the article’s focus on addressing potential artifacts of 10-bit PQ in display terminals, the minimum detectable contrast outlined in the ITU BT.2246 report serves as the primary evaluation criterion, as illustrated in Figure 7.
The horizontal axis in Figure 7 represents absolute luminance (cd/m2), while the vertical axis denotes Minimum Detectable Contrast and Reproducible Contrast. Minimum Detectable Contrast refers to the smallest luminance difference perceivable by the human eye under specific conditions, namely the Schreiber threshold and Barten (RAMP) threshold, both derived from distinct human vision models. Its value is determined by the Contrast Sensitivity Function, which depends on spatial frequency, luminance, viewing angle, and other factors. A lower value implies greater sensitivity of the human eye to subtle differences, necessitating more stringent system requirements. The Barten (RAMP) threshold is highly stringent, as it considers spatial frequency in extreme conditions, rendering luminance differences below this threshold imperceptible to the human eye. The Schreiber threshold, on the other hand, is less stringent and represents the upper limit at which the human eye perceives a comfortable luminance difference. Luminance differences exceeding the Schreiber threshold are perceived as visual artifacts, causing discomfort to the human eye. Due to multiple influencing factors, the Schreiber threshold has been adopted as the standard for HDR displays to optimize resource utilization and is widely applied in visual systems, including broadcasting and television. Reproducible Contrast refers to the contrast that a display device or system can effectively reproduce. To meet industry standards and ensure high-quality visual performance, the Reproducible Contrast of a system must always remain below the Schreiber threshold. Additionally, the closer the Reproducible Contrast is to the Barten (RAMP) threshold, the more refined and accurate the display quality becomes. However, due to limitations in quantization precision, achieving the Barten (RAMP) threshold requires at least 11-bit precision, which exceeds the capability of current mainstream display systems. Therefore, to mitigate the risk of artifacts under the constraint of 10-bit precision, it is essential to optimize for human visual perception and reallocate precision across different luminance levels.
The multi-PQ method selects parameters to mitigate artifacts based on the average luminance of each image frame. However, as shown in Figure 7, the reproducible contrast at low luminance levels still exceeds the Schreiber threshold at n = 0.1593 and n = 0.1654. This limitation arises because multi-PQ relies solely on average luminance as a selection criterion, overlooking individual pixel variations that can lead to suboptimal parameter choices. Additionally, the mean luminance value may be skewed by extreme luminance levels, failing to accurately represent the overall distribution. This issue becomes particularly pronounced in high dynamic range (HDR) images, potentially leading to display artifacts when using multi-PQ.
Figure 7 further demonstrates that both PQ and multi-PQ exhibit high accuracy with some redundancy at luminance levels above 1 cd/m2. Since 3000 cd/m2 satisfies 90% of viewers’ diffuse white light requirements [24] and the dazzling regions of an image typically occupy a small proportion of pixels, the proposed solution involves increasing the Just Noticeable Difference (JND) fraction through parameter tuning. This adjustment reduces quantization precision in dazzling intervals, enabling more efficient codeword redistribution and optimizing the overall performance of the mapping function. By maintaining the JND score within acceptable boundaries, the luminance mapping strategy proposed in this study ensures that the reproducible contrast remains below the Schreiber threshold, effectively minimizing potential artifacts in 10-bit PQ display results. Furthermore, the method optimally leverages coding redundancy in high-luminance scenes by preserving 10-bit depth in the final mapping function.
In this study, HDR content is processed according to the method illustrated in 
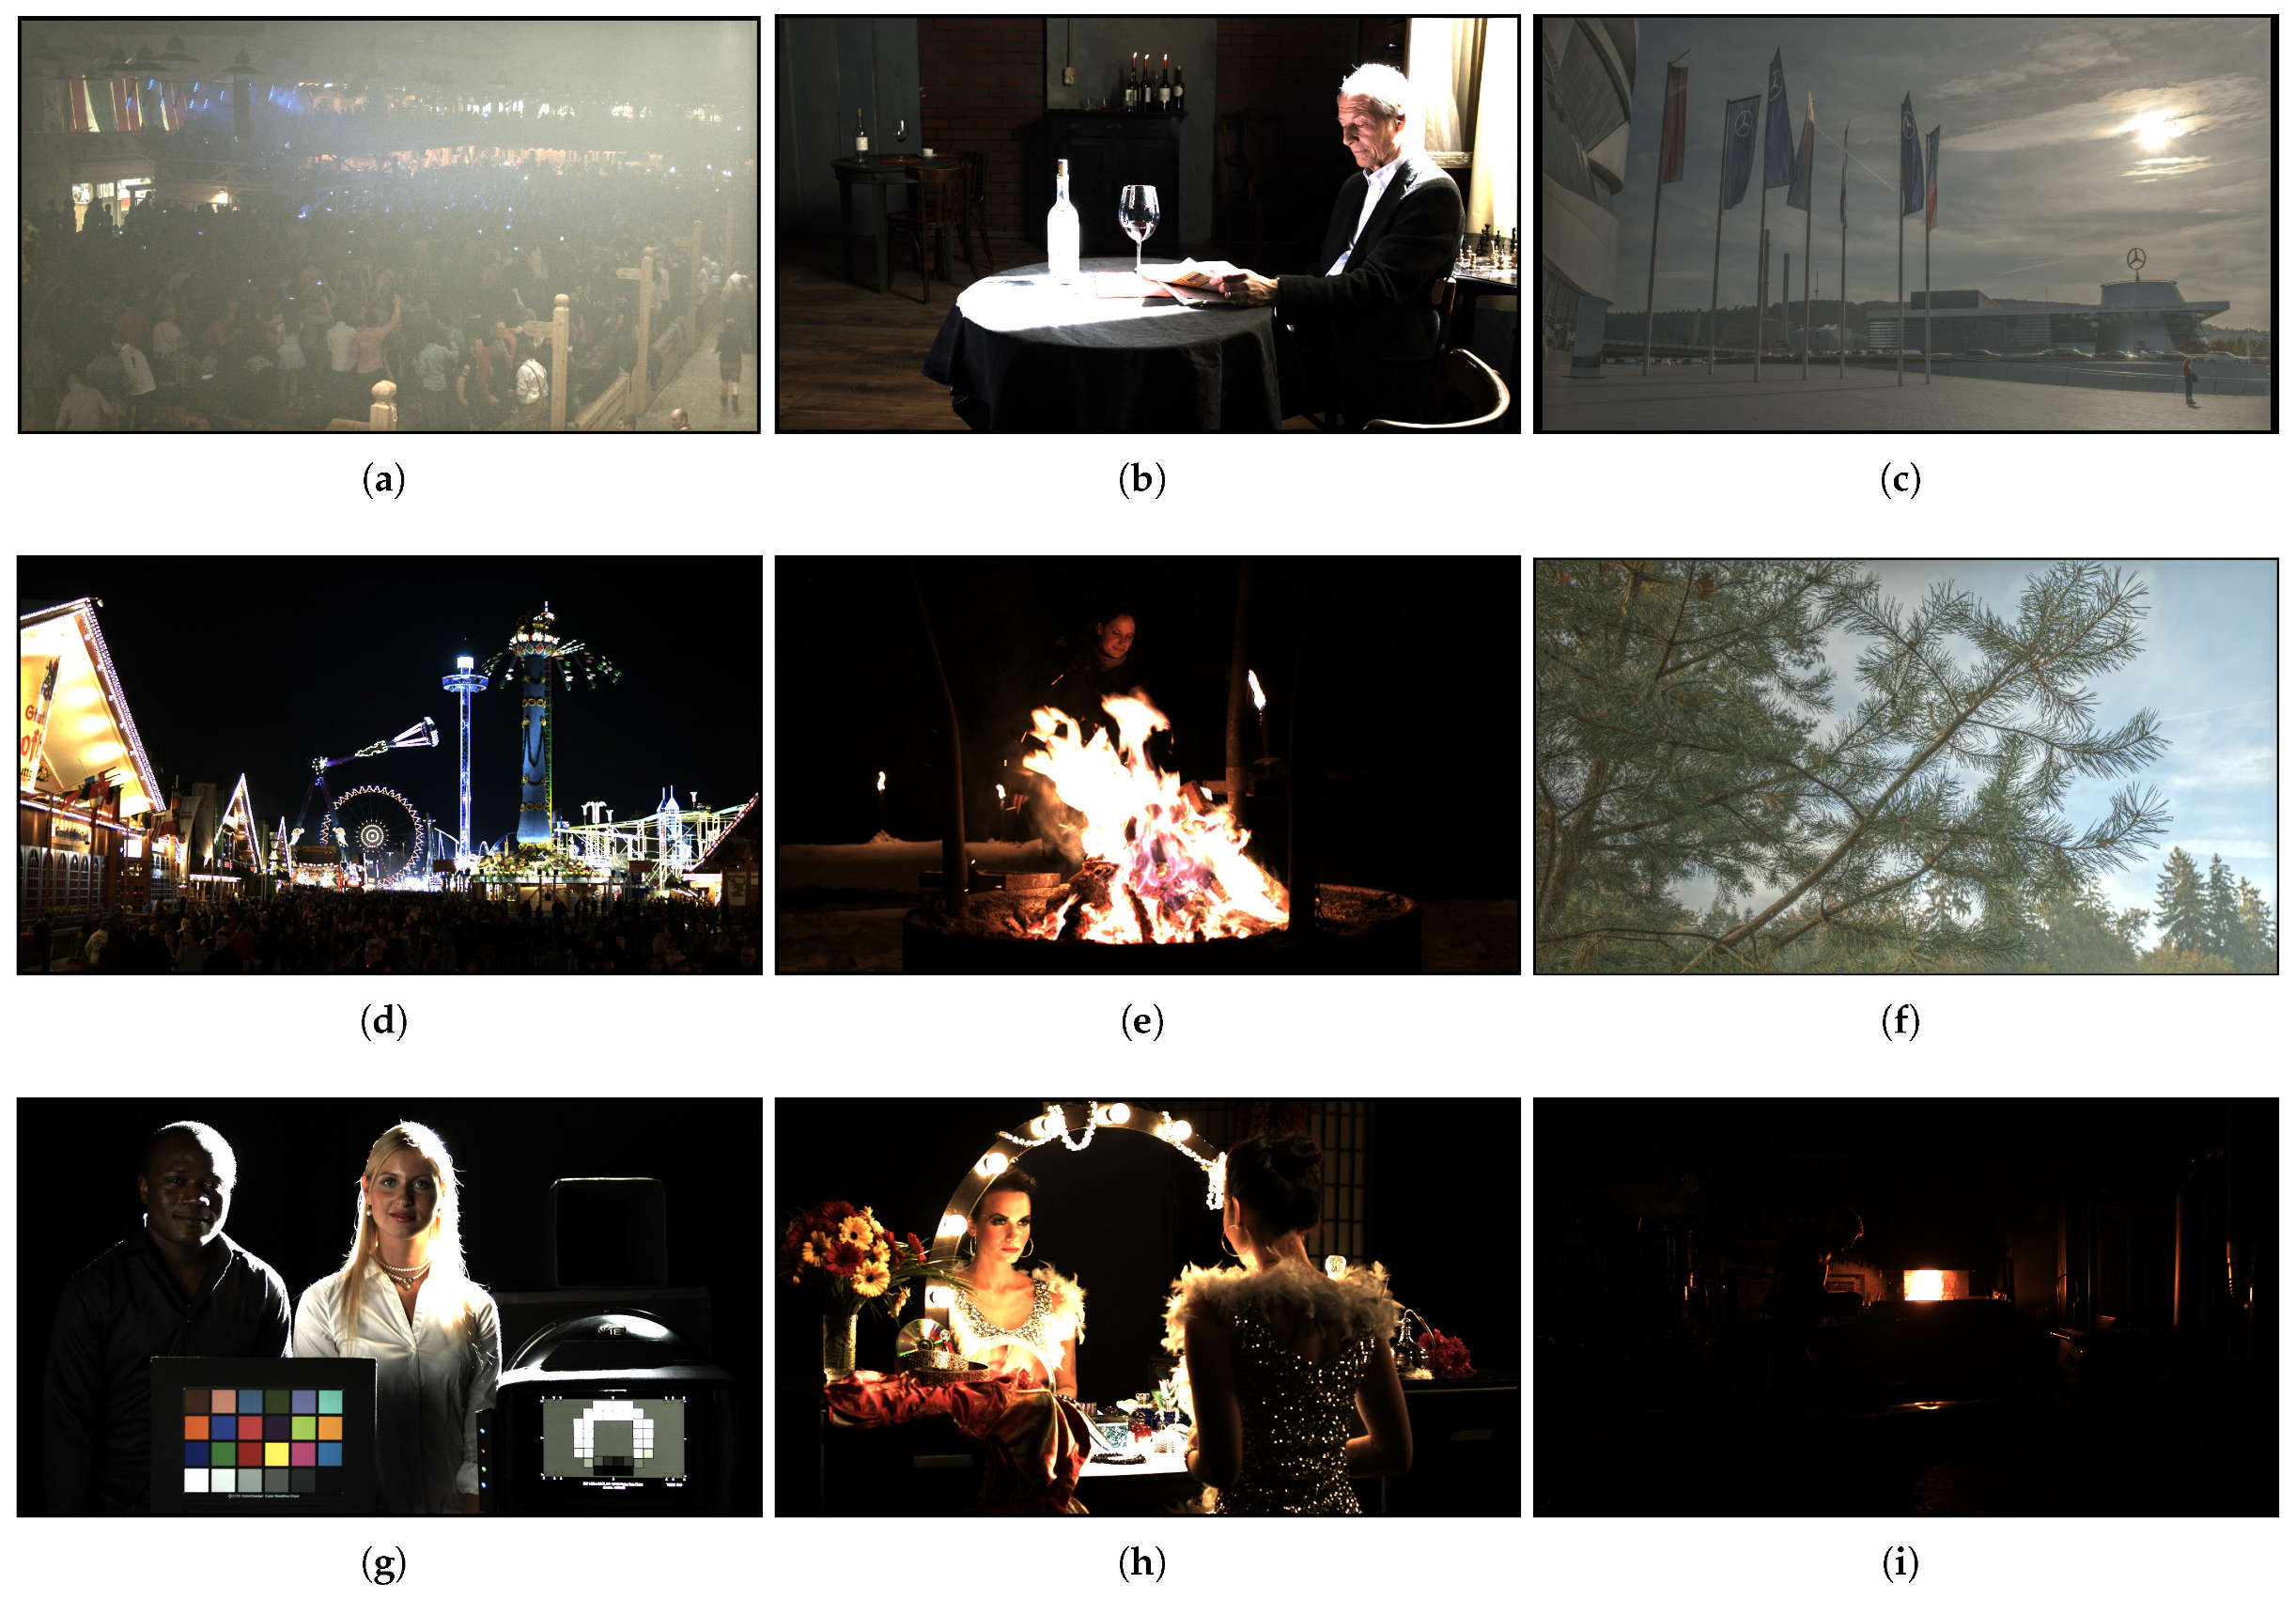
Figure 8. The test sequences employed in this study are stored as individual-frame images in OpenEXR format, which supports 32-bit floating-point pixel color values and facilitates scene-referred linear data recording. Each pixel’s color value is treated as an accurate representation of the scene. Specifically, we incorporate the 10-bit PQ, multi-PQ, and the mapping relationship introduced in this study into the OETF and EOTF, respectively. To objectively assess the output results, we use HDR-VDP-3.07 as a reference, offering empirical validation for the effectiveness of the mappings proposed in this study. Signal transmission and video compression effects on HDR content are not considered, as the focus is solely on display purposes. The HDR video sequence used for verification is detailed in Table 1, and the tone mapping of the first frame is illustrated in Figure 9.
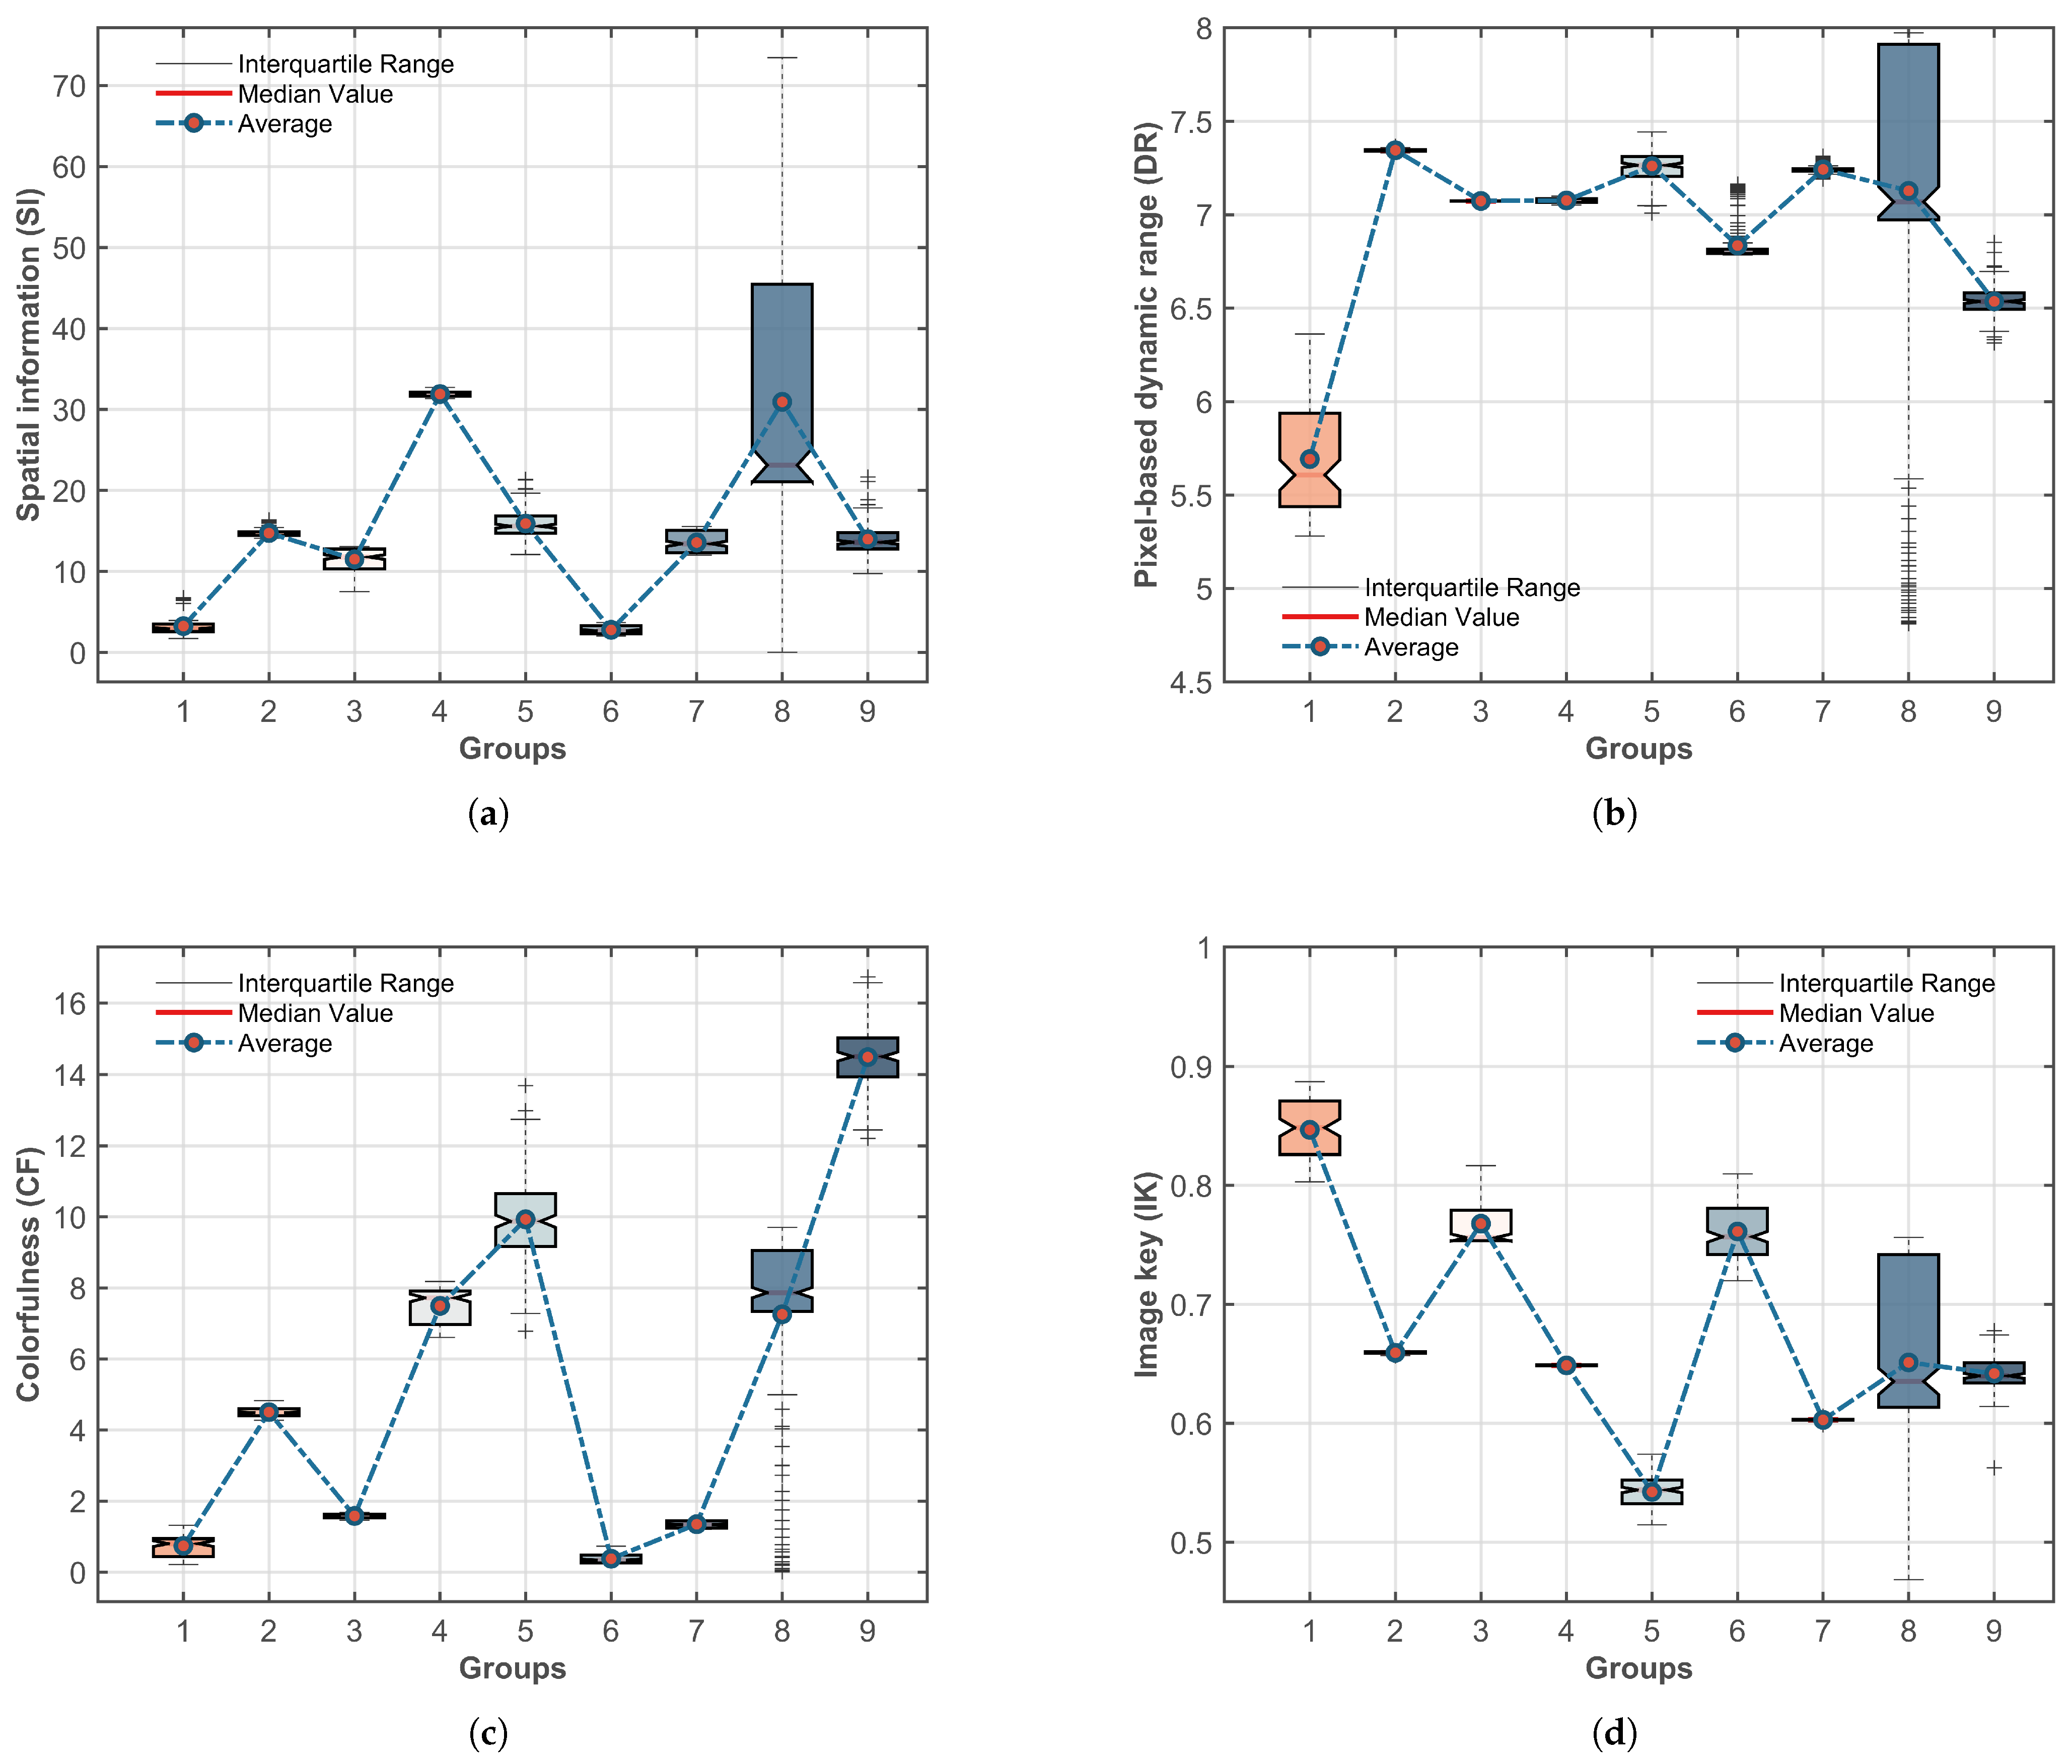
To investigate the performance of the proposed mapping relation under the influence of different scene types, illumination conditions, edge complexity, and color variations, this paper analyzes the video sequences using parameters such as Spatial Information (SI), Pixel-based Dynamic Range (DR), Colorfulness (CF), and Image Key (IK) [25,26]. The statistical information of the sequence parameters is presented in the box plot in 
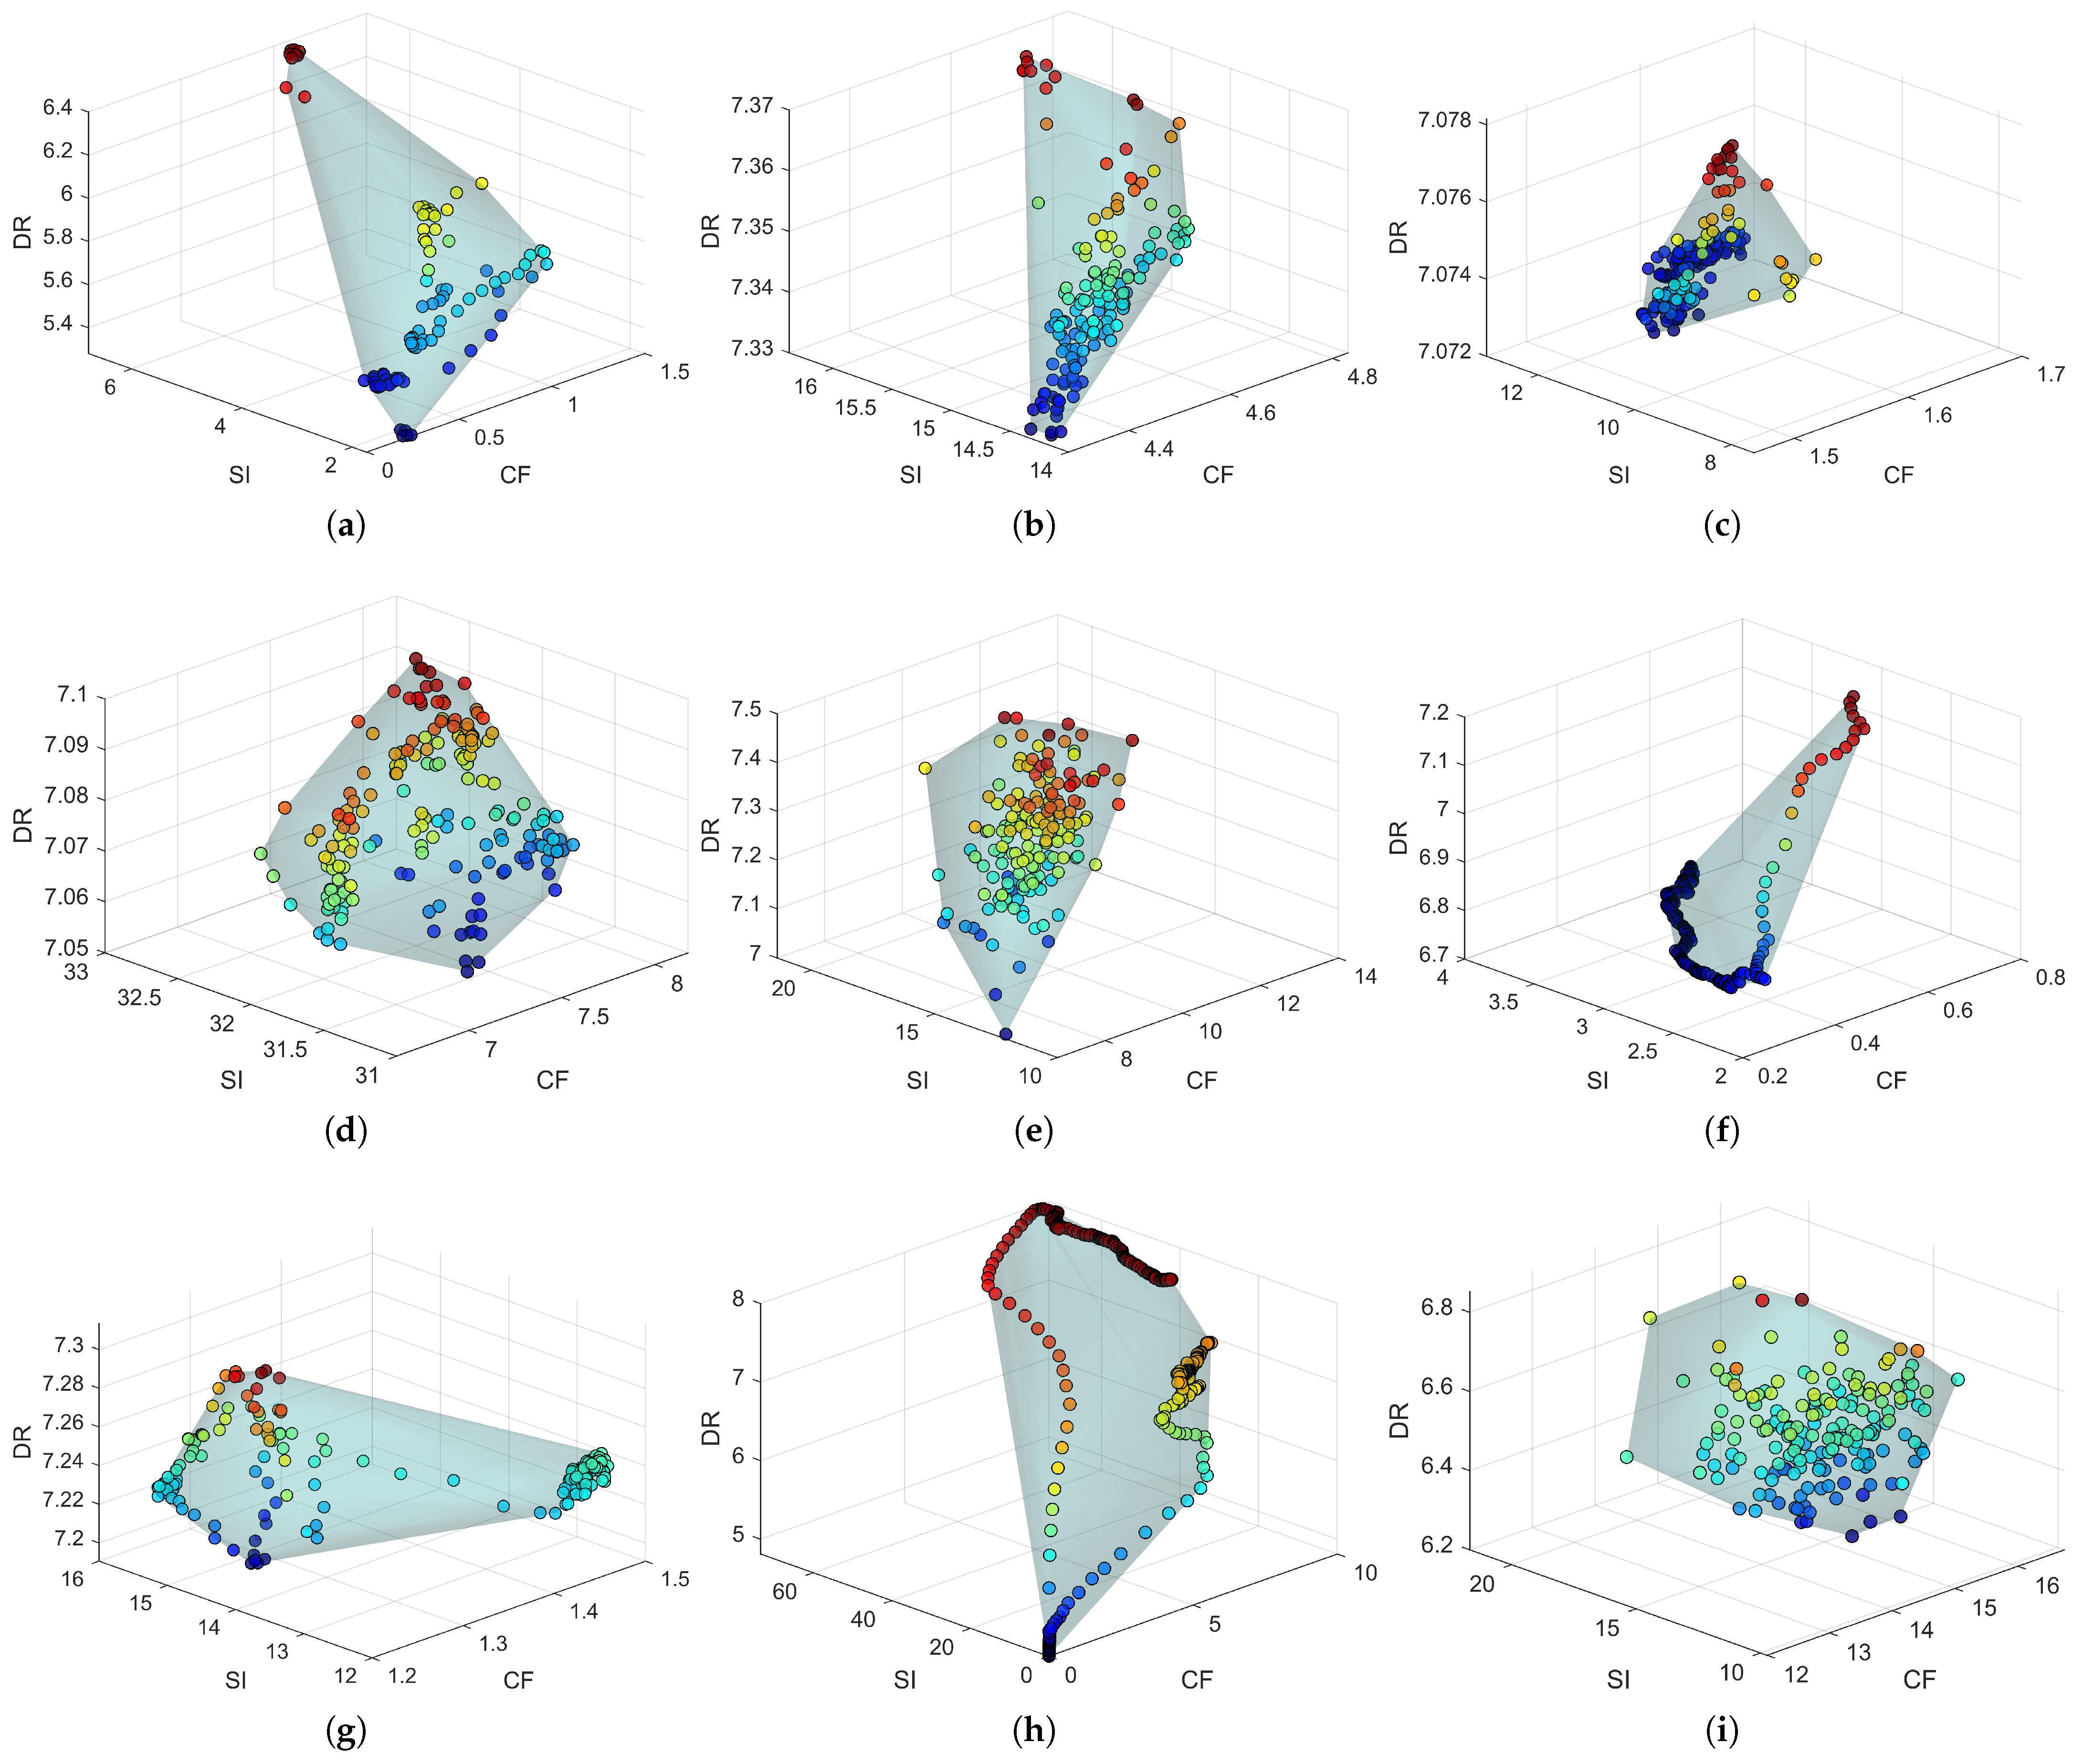
Figure 10, while the 3D joint distribution of SI, CF, and DR is illustrated in Figure 11. Additionally, this study employs tPSNR to quantify temporal differences between frames, assessing temporal consistency during the display process, with results presented in Table 2. To prevent tPSNR from becoming infinite when tMSE is 0, the maximum tPSNR value is capped at 100.
Table 1. Introduction to HDR test sequence.
HDR Test SequencesResolution (Width × Height)Frames EncodedAverage DR (f-Stops)Source/Copyrights
Beerfest lightshow 011920 × 10801591–168428.34
Bistro 011920 × 1080296–44529.31
Cars longshot1920 × 1080658–83729.15
Carousel fireworks 011920 × 10801187–136629.31
Fireplace 021920 × 1080319–49829.42HDM [27]
Fishing longshot1920 × 1080445–62423.72
Hdr test1920 × 10801191–137028.84
Show girl 021920 × 1080348–68828.50
Smith welding1920 × 10801163–134229.14
The box plots in Figure 10 illustrate the distribution patterns of the HDR video sequence characteristics across four dimensions, revealing significant differences among the data. In the SI dimension, Beerfest lightshow 01, Bistro 01, Carousel fireworks 01, and Fishing longshot exhibit narrower interquartile spacing, with the median closely aligning with the mean, indicating that these sequences are spatially stable, corresponding to static scenes or content with minimal texture variation. In contrast, the SI distribution of Show girl 02 exhibits a significant positive skew and a broader interquartile range, reflecting large variations in intra-frame complexity and a more dispersed distribution of SI values. This suggests that the sequence includes both high-complexity frames (e.g., dense edges) and low-complexity frames (e.g., extensive smoothing), with certain frames exhibiting extreme complexity, leading to an SI mean greater than the median. Additionally, Beerfest lightshow 01, Bistro 01, Fireplace 02, and Smith welding contain significant outliers, indicating that certain frames exhibit substantially higher complexity than the rest of the sequence.
Pixel-based Dynamic Range refers to the dynamic range measured after excluding the top 1% of extreme pixel values. Its distribution characteristics indicate that most sequences exhibit low dispersion and high dynamic range stability. With the exception of Beerfest lightshow 01 and Show girl 02, the remaining sequences exhibit minimal intra-sequence dynamic range variation. The brightness coverage is both strong and stable, typical of high-contrast scenes (e.g., backlit or heavily shaded environments). However, significant outliers are observed in the DR distributions of Show girl 02, Fishing longshot, and Smith welding, indicating that certain frames may experience dynamic range compression due to exposure imbalance. Beerfest lightshow 01 exhibits a significantly larger interquartile range in the DR dimension compared to other sequences, except for Show girl 02. Its distribution demonstrates positive skewness, indicating substantial dynamic range variation, with certain frames containing extreme luminance values (e.g., brief exposure to laser lights at night).
In the CF dimension, sequences Fireplace 02, Show girl 02, and Smith welding exhibit significant outliers, indicating substantial frame-to-frame variations in color richness. Notably, the CF distribution of Show girl 02 reveals a lower anomaly, suggesting the presence of extremely low-saturation content within certain frames. When combined with the findings from the SI and DR analyses, these anomalies can be attributed to exposure-related issues. Furthermore, the pronounced distribution differences across sequences highlight the strong color variability of the source content.
IK is used to quantify the overall luminance distribution of a video. Higher IK values indicate that the video is predominantly composed of highlights, whereas lower values suggest dominance by low-light environments. In both Show girl 02 and Cars longshot, the IK distribution exhibits bias, typically caused by the coexistence of localized bright and dark regions, which is characteristic of scenes with alternating light and shadow. Additionally, Show girl 02 presents a significant lower anomaly, indicating the presence of underexposed frames. Meanwhile, Beerfest lightshow 01 has a high median IK value of 0.85, which, when analyzed alongside the results from other dimensions, suggests that this sequence corresponds to a high-exposure scene with relatively low contrast and reduced image detail.
Figure 11 presents the 3D joint distribution of SI, DR, and CF. The scatter distributions and convex hull volumes of different video sequences highlight the intricate interactions between these multidimensional features. Notably, the convex hull volume serves as an indicator of the dispersion of the distribution, while the scatter position reveals the correlation trends among the three dimensions within each sequence.
For video sequences exhibiting a broad distribution without a distinct pattern of variation (e.g., Beerfest Lightshow 01, Fireplace 02, Smith Welding), the values of SI, DR, and CF display a high degree of randomness. This suggests a lack of intrinsic correlation between spatial complexity, dynamic range, and color richness in the video content. Such distributions typically arise from frequent scene transitions or the presence of multiple independently varying elements (e.g., rapidly edited mixed content or randomly moving objects), making it challenging to establish a synergistic trend across these metrics. The convex hull volume of these videos is generally large yet exhibits low eccentricity, with a relatively uniform distribution in all directions. This indicates that the content spans a broad coverage within the 3D feature space, encompassing diverse visual characteristics.
In contrast, video sequences exhibiting a broad scatter distribution yet following clear patterns of variation (e.g., Fishing Longshot, Show Girl 02) demonstrate significant positive or negative correlations. For instance, the scatter distribution of Fishing Longshot is narrowly concentrated along the DR axis, while SI and CF exhibit a strong positive correlation. This indicates that the dynamic range of the content gradually increases over time, while spatial detail and color saturation experience limit synergistic enhancement under fixed luminance conditions. Furthermore, such videos exhibit high convex hull eccentricity, characterized by pronounced elongation or stretching. This suggests that while the content maintains structural consistency, it simultaneously ensures feature diversity.
Additionally, the scatter plots of certain videos (e.g., Bistro 01, Carousel Fireworks 01, HDR Test) exhibit highly concentrated distributions without significant correlations. Such distribution patterns typically arise from static scenes with minimal variation, such as close-up shots of architectural details or character features. These videos are characterized by smaller convex hull sizes, lower eccentricity, and highly stable, localized features, making them ideal for evaluating the algorithm’s performance in static scenes with varying texture complexity and dynamic range.
Both tPSNR and HDR-VDP-3.07 use the absolute luminance of the content (cd/m2) as an input parameter for predicting human visual perception across multiple dimensions and evaluating the test images. Figure 12 presents the HDR-VDP-3.07 evaluation results, where the horizontal axis represents the frame sequence and the vertical axis represents the quality score. As an advanced high dynamic range visual disparity predictor, HDR-VDP-3.07 scores perceptual differences by simulating the human visual system, with scores expressed in Just Objectionable Differences (JODs) (which differ from JNDs as described in the previous section, with specific differences detailed in the literature [28]). According to the scoring criteria, a difference of 1 JOD indicates that 75% of the population is able to perceive a display difference, and higher scores signify better visual quality. When the difference in scoring results is within 1 JOD, each increment of 0.01 JOD corresponds to 0.27% of the population perceiving a difference in display quality [18,29].
By analyzing Figure 10, Figure 11 and Figure 12 comprehensively, we observe significant differences in the scores across different sequences, with the overall score trends closely related to the distributions of SI and IK. Specifically, a larger number of outliers and greater absolute deviations in SI lead to greater fluctuations in the score curves (e.g., Fireplace 02 and Smith welding). This is attributed to highly variable spatial information in certain frames, resulting in distributions with high variability. Such cases correspond directly to the randomness in the 3D scatter distribution, indicating a weak correlation between the metrics and the dispersion of extreme values among frames, which causes substantial score variations between consecutive frames. On the other hand, the range of the IK distribution determines the overall variations in the score curve, with wider interquartile spacing leading to more pronounced fluctuations. For sequences with a broad IK distribution but no outliers in the SI distribution (e.g., Cars longshot, Fishing longshot, and Show girl 02), score fluctuations between adjacent frames are smaller, resulting in a smoother overall trend with gradual variations influenced by IK distribution characteristics. This scenario is typically characterized by a moderate correlation between indicators and temporal continuity across frames.
As observed in Figure 7 and Figure 10, the multi-PQ method proposed in Ref. [4] exhibits excellent display quality when processing content with luminance levels below 0.1 cd/m2. This improvement is particularly evident when the scene exhibits a generally low DR distribution. For instance, in Beerfest lightshow 01 and Smith welding, multi-PQ achieved improvements of 0.086 and 0.025 over 10-bit PQ, respectively, indicating that 2.322% and 0.675% of observers could perceive the difference and preferred multi-PQ. However, when the dynamic range is significantly extended and the DR distribution improves overall (potentially accompanied by distribution skewness or outliers that introduce extreme brightness or special frames), the enhancement effect of multi-PQ diminishes significantly. In some cases, the display quality may fail to surpass that of 10-bit PQ, leading to noticeable differences (e.g., Carousel fireworks 01, Fireplace 02, and Hdr test). Compared to multi-PQ, the proposed mapping function effectively handles a large dynamic range, demonstrates strong robustness, and adapts well to feature-dispersed scenarios, showing significant improvements when applied to these sequences. Particularly for the Fireplace 02 sequence, which exhibits high parameter variability, an extensive dynamic range, and substantial inter-frame fluctuations, the proposed method demonstrates significant advantages in enhancing display quality compared to multi-PQ and 10-bit PQ. For sequences characterized by extensive parameter variations and strong internal correlation, such as Fishing Longshot and Show Girl 02, the proposed method exhibits performance comparable to multi-PQ without demonstrating a substantial improvement. Therefore, the primary advantage of the proposed method over multi-PQ lies in its superior performance in handling scenes with higher dynamic range and broader luminance span, whereas multi-PQ is specifically optimized for scenarios with a constrained dynamic range. Ultimately, for the video sequences analyzed in this study, the average HDR-VDP-3.07 score increases by 0.0743 and 0.0822 compared to 10-bit PQ and multi-PQ, respectively, indicating that 2.0061% and 2.2194% of the population can perceive the enhancement in visual quality.
During video playback, different EOTF directly influence the luminance distribution and dynamic range of video frames by modifying the nonlinear mapping of luminance signals, thereby affecting temporal coherence. When the absolute luminance of pixels within a frame undergoes nonlinear shifts, it results in greater-than-expected differences between consecutive frames, thereby increasing temporal variation and reducing the tPSNR. As shown in Table 2, the average tPSNR of the proposed mapping approach across nine video sequences is 33.622 dB, exceeding the 33.14 dB of multi-PQ and marginally surpassing the 33.557 dB of 10-bit PQ. This suggests that the proposed method more effectively preserves image details, minimizes inter-frame luminance fluctuations, and mitigates nonlinear distortions in luminance trajectories of moving objects by dynamically adjusting the quantization step size, thereby reducing the mean-square error in the temporal domain. Moreover, the proposed method achieves the most significant improvements on the Fireplace 02 and Smith Welding sequences, which exhibit the highest inter-frame fluctuations, with increases of 0.68 dB and 0.66 dB over multi-PQ, respectively. This suggests that the proposed method enhances temporal consistency more effectively in highly complex scenarios involving intricate motion patterns or frequent scene transitions.
In terms of computational complexity, the mapping function proposed in this paper is independent of the image content and requires only the generation of the LUT based on the conversion relationship among the quantized value, the display system drive signal, and the absolute luminance. Once the LUT is generated, the computation for each image frame, regardless of its resolution, can be accomplished using a single lookup operation. In addition, the size of the LUT is fixed and remains constant regardless of the input scale. Therefore, the time complexity and space complexity of the proposed method are O(1), which is the same as that of the PQ algorithm. In contrast, multi-PQ requires real-time computation of the image’s average brightness during implementation and selects the corresponding LUT based on the computed result. Assuming that the number of pixels in the image is N, multi-PQ performs N−1 additions and one division, resulting in a time complexity of O(N), while the selection of the corresponding LUT based on the average brightness has a time complexity of O(1). Consequently, the final time complexity of multi-PQ is O(N), whereas its LUT remains independent of the input data size, maintaining a space complexity of O(1). In summary, compared with multi-PQ, the proposed method has a lower time complexity and better meets real-time processing requirements. In addition, regarding hardware cost, multi-PQ requires four LUTs, whereas the proposed method requires only one LUT, thereby reducing the storage requirement by 75% and offering significant practical advantages.

4. Conclusions

In this paper, a luminance mapping method for HDR content display is proposed, offering a novel approach to advancing HDR display technology. The effectiveness of the method in eliminating visible artifacts perceived by the human visual system due to discontinuities in luminance transitions is verified through comparative analysis with the commonly used electro-optical transition function (EOTF). The objective evaluation results indicate that the method significantly enhances display quality when handling scenes with high dynamic range and wide luminance span, particularly in complex scenes characterized by highly stochastic features and pronounced inter-frame variations. Furthermore, under extreme conditions involving complex motion scenes or frequent frame content transitions, the method demonstrates superior temporal consistency compared to existing approaches. The proposed method can be implemented in HDR display terminals using a look-up table (LUT), offering low complexity, high real-time performance, ease of implementation in terminal hardware, and broad applicability.

Supplementary Materials

The following supporting information can be downloaded at: https://www.mdpi.com/article/10.3390/electronics14061202/s1, Table S1: Proposed mapping relation.

Author Contributions

D.H.: Conceptualization; Methodology development and design; Model creation; Writing—Original Draft. X.Z.: Supervision and leadership of research planning and execution, including external mentorship. J.L.: Visualization. J.C.: Formal Analysis. F.L.: Investigation. X.M.: Funding acquisition and resource provision. Y.C. (Yufeng Chen): Data curation. Y.C. (Yu Chen): Writing—Review and Editing. All authors have read and agreed to the published version of the manuscript.

Funding

This work was financially supported by the Jilin Provincial Scientific and Technological Development Program—Jilin Provincial Key R & D Program (No. 20240301001GX).

Data Availability Statement

All the data used in this study are based on publicly available data sets and can be found in Ref. [27]. Requests for further information and resources should be directed to and will be fulfilled by the lead contact, Xinyue Mao (maoxy@ccxida.com).

Acknowledgments

The authors thank Yang Wang from Changchun Institute of Optics, Fine Mechanics and Physics for their valuable advice and the critical reading of the manuscript.

Conflicts of Interest

Authors Xifeng Zheng, Yufeng Chen, Xinyue Mao and Yu Chen was employed by the company Changchun Cedar Electronics Technology Co., Ltd. The remaining authors declare that the research was conducted in the absence of any commercial or financial relationships that could be construed as a potential conflict of interest.

References

  1. Graziano, B.R.; Gong, D.; Anderson, K.E.; Pipathsouk, A.; Goldberg, A.R.; Weiner, O.D. A module for Rac temporal signal integration revealed with optogenetics. J. Cell Biol. 2017, 216, 2515–2531. [Google Scholar] [CrossRef] [PubMed]
  2. De Praeter, J.; Díaz-Honrubia, A.J.; Paridaens, T.; Van Wallendael, G.; Lambert, P. Simultaneous encoder for high-dynamic-range and low-dynamic-range video. IEEE Trans. Consum. Electron. 2016, 62, 420–428. [Google Scholar] [CrossRef]
  3. Kim, M.H.; Weyrich, T.; Kautz, J. Modeling human color perception under extended luminance levels. In ACM SIGGRAPH 2009 Papers; ACM: New York, NY, USA, 2009; pp. 1–9. [Google Scholar]
  4. Liu, Y.; Hamidouche, W.; Déforges, O.; Pescador, F. A multi-modeling electro-optical transfer function for display and transmission of high dynamic range content. IEEE Trans. Consum. Electron. 2017, 63, 350–358. [Google Scholar] [CrossRef]
  5. Borer, T.; Cotton, A.; Wilson, P. Perceptual Uniformity for High-Dynamic-Range Television Systems. SMPTE Motion Imaging J. 2016, 125, 75–84. [Google Scholar] [CrossRef]
  6. Buchsbaum, M. Neural events and psychophysical law. Science 1971, 172, 502. [Google Scholar] [CrossRef] [PubMed]
  7. ITU-R BT.709; Parameter Values for the HDTV Standards for Production and International Programme Exchange. ITU: Geneva, Switzerland, 2002.
  8. ITU-R BT.1886; Reference Electro-Optical Transfer Function for Flat Panel Displays Used in HDTV Studio Production. ITU: Geneva, Switzerland, 2011.
  9. Candry, P.; Maximus, B. Projection displays: New technologies, challenges, and applications. J. Soc. Inf. Disp. 2015, 23, 347–357. [Google Scholar] [CrossRef]
  10. Borer, T. Non-linear opto-electrical transfer functions for high dynamic range television. BBC White Pap. 2014, 283, 1–20. [Google Scholar]
  11. Borer, T.; Cotton, A. A display-independent high dynamic range television system. SMPTE Motion Imaging J. 2016, 125, 50–56. [Google Scholar] [CrossRef]
  12. Miller, S.; Nezamabadi, M.; Daly, S. Perceptual signal coding for more efficient usage of bit codes. SMPTE Motion Imaging J. 2013, 122, 52–59. [Google Scholar] [CrossRef]
  13. SMPTE. Study Group Report High-Dynamic-Range (HDR) Imaging Ecosystem. 2015. Available online: https://www.smpte.org/technology-reports-downloads (accessed on 28 November 2023).
  14. Standard, S. High dynamic range electro-optical transfer function of mastering reference displays. SMPTE ST 2014, 2084, 11. [Google Scholar]
  15. ITU-R BT.2100; Image Parameter Values for High Dynamic Range Television for Use in Production and International Programme Exchange. ITU: Geneva, Switzerland, 2018.
  16. Azimi, M.; Mantiuk, R.K. PU21: A novel perceptually uniform encoding for adapting existing quality metrics for HDR. In Proceedings of the 2021 Picture Coding Symposium (PCS), Virtual, 29 June–2 July 2021; IEEE: New York, NY, USA, 2021; pp. 1–5. [Google Scholar]
  17. ITU-R BT.2246; The Present State of Ultra-High Definition Television. ITU: Geneva, Switzerland, 2015.
  18. Mantiuk, R.K.; Hammou, D.; Hanji, P. HDR-VDP-3: A multi-metric for predicting image differences, quality and contrast distortions in high dynamic range and regular content. arXiv 2023, arXiv:2304.13625. [Google Scholar]
  19. Mikhailiuk, A.; Pérez-Ortiz, M.; Yue, D.; Suen, W.; Mantiuk, R.K. Consolidated dataset and metrics for high-dynamic-range image quality. IEEE Trans. Multimed. 2021, 24, 2125–2138. [Google Scholar] [CrossRef]
  20. Essock, E.A.; Hansen, B.C.; Zheng, Y.; Haun, A.M.; Gunvant, P. “Mach Bands” in the Orientation Dimension: An Illusion Due to Inhibition of Nearby Orientations. J. Vis. 2004, 4, 778. [Google Scholar] [CrossRef]
  21. Schreiber, W.F. Fundamentals of Electronic Imaging Systems: Some Aspects of Image Processing; Springer Science & Business Media: Berlin/Heidelberg, Germany, 2012; Volume 15. [Google Scholar]
  22. Barten, P.G. Contrast Sensitivity of the Human Eye and Its Effects on Image Quality; SPIE Press: Bellingham, WA, USA, 1999. [Google Scholar]
  23. Barten, P.G. Formula for the contrast sensitivity of the human eye. In Proceedings of the Image Quality and System Performance; SPIE: Bellingham, WA, USA, 2003; Volume 5294, pp. 231–238. [Google Scholar]
  24. Daly, S.; Kunkel, T.; Sun, X.; Farrell, S.; Crum, P. 41.1: Distinguished paper: Viewer preferences for shadow, diffuse, specular, and emissive luminance limits of high dynamic range displays. In Proceedings of the SID Symposium Digest of Technical Papers; Wiley Online Library: Hoboken, NJ, USA, 2013; Volume 44, pp. 563–566. [Google Scholar]
  25. Winkler, S. Analysis of public image and video databases for quality assessment. IEEE J. Sel. Top. Signal Process. 2012, 6, 616–625. [Google Scholar] [CrossRef]
  26. Hulusic, V.; Valenzise, G.; Provenzi, E.; Debattista, K.; Dufaux, F. Perceived dynamic range of HDR images. In Proceedings of the 2016 Eighth International Conference on Quality of Multimedia Experience (QoMEX), Lisbon, Portugal, 6–8 June 2016; IEEE: New York, NY, USA, 2016; pp. 1–6. [Google Scholar]
  27. Fröhlich, J. HdM Original HDR Camera Footage. 2014. Available online: https://www.hdm-stuttgart.de/~froehlichj/ (accessed on 10 June 2024).
  28. Zerman, E.; Hulusic, V.; Valenzise, G.; Mantiuk, R.K.; Dufaux, F. The relation between MOS and pairwise comparisons and the importance of cross-content comparisons. Electron. Imaging 2018, 30, 1–6. [Google Scholar] [CrossRef]
  29. Mantiuk, R.K.; Denes, G.; Chapiro, A.; Kaplanyan, A.; Rufo, G.; Bachy, R.; Lian, T.; Patney, A. Fovvideovdp: A visible difference predictor for wide field-of-view video. ACM Trans. Graph. (TOG) 2021, 40, 1–19. [Google Scholar] [CrossRef]
Figure 1. Comparison of quantization noise. (a) Original image. (b) Images with extreme noise.
Electronics 14 01202 g001
Figure 2. Three-dimensional image of the Contrast Sensitivity Function. (a) CSF surface. (b) PQ curve on CSF.
Electronics 14 01202 g002
Figure 3. Reproducible contrast ratio of 12-bit PQ.
Electronics 14 01202 g003
Figure 4. Reproducible contrast for different EOTFs.
Electronics 14 01202 g004
Figure 5. Schematic diagram of surface intersection. (a) Default view. (b) Top view.
Electronics 14 01202 g005
Figure 6. Parameter values for different luminance intervals.
Electronics 14 01202 g006
Figure 7. Reproducible contrast of our mapping relation, 10-bit PQ and multi-PQ.
Electronics 14 01202 g007
Figure 8. Schematic diagram of the process from acquisition to display of HDR content.
Electronics 14 01202 g008
Figure 9. First frame of test sequence.(a) Beerfest lightshow 01. (b) Bistro 01. (c) Cars longshot. (d) Carousel fireworks 01. (e) Fireplace 02. (f) Fishing longshot. (g) Hdr test. (h) Show girl 02. (i) Smith welding.
Electronics 14 01202 g009
Figure 10. Statistics on frame sequence parameters. (The order of 1–9 in the figure corresponds to the order of (a–i) in Figure 9) (a) Spatial information (SI). (b) Pixel-based dynamic range (DR). (c) Colorfulness (CF). (d) Image key (IK).
Electronics 14 01202 g010
Figure 11. Three-dimensional joint distribution of SI, CF, and DR. (a) Beerfest lightshow 01. (b) Bistro 01. (c) Cars longshot. (d) Carousel fireworks 01. (e) Fireplace 02. (f) Fishing longshot. (g) Hdr test. (h) Show girl 02. (i) Smith welding.
Electronics 14 01202 g011
Figure 12. HDR-VDP-3.07 evaluation results comparison.(a) Beerfest lightshow 01. (b) Bistro 01. (c) Cars longshot. (d) Carousel fireworks 01. (e) Fireplace 02. (f) Fishing longshot. (g) Hdr test. (h) Show girl 02. (i) Smith welding.
Electronics 14 01202 g012
Table 2. Comparison of tPSNR evaluation values.
NameProposed10-Bit PQMulti-PQ
Beerfest lightshow 0149.15 dB49.04 dB48.82 dB
Bistro 0131.67 dB31.54 dB31.13 dB
Cars longshot33.34 dB33.27 dB32.88 dB
Carousel fireworks 0130.60 dB30.55 dB29.99 dB
Fireplace 0229.70 dB29.69 dB29.02 dB
Fishing longshot40.81 dB40.80 dB40.81 dB
Hdr test32.05 dB31.95 dB31.47 dB
Show girl 0227.63 dB27.54 dB27.15 dB
Smith welding27.65 dB27.63 dB26.99 dB
Average33.622 dB33.557 dB33.14 dB
Disclaimer/Publisher’s Note: The statements, opinions and data contained in all publications are solely those of the individual author(s) and contributor(s) and not of MDPI and/or the editor(s). MDPI and/or the editor(s) disclaim responsibility for any injury to people or property resulting from any ideas, methods, instructions or products referred to in the content.

