Abstract
With advancements in the miniaturization and lightweight design of computers and electronic devices, wearable sensors are now widely utilized in fields such as healthcare and medicine. Signals obtained from wearable sensors often contain a mix of biological signals and noise. Typically, wearable sensor measurements focus on a single signal of interest (SoI), treating other signals as noise. While methods for separating multiple signals exist, the stable tracking of frequency variations during signal separation remains an unresolved challenge. Biological signal and human motion measurements often face issues such as noise, temporal disconnections, dropouts, and frequency variations. To address these challenges, we developed a method that can stably separate and extract SoI from measurement data. We demonstrated the effectiveness of the proposed method through simulations replicating common measurement issues. By applying the method, we show that SoI frequency estimates can be obtained with a high accuracy. Furthermore, we confirm that the method can separate multiple SoIs from a single measurement dataset, highlighting its utility. Finally, we validate that the proposed method can reliably extract multiple SoIs, such as heart rate, walking rhythm, and breathing rate, from actual data measured using stretch sensors, achieving results consistent with simulations.
1. Introduction
In recent years, wearable sensors have become increasingly popular, and research on their practical applications has been actively conducted [1,2]. Wearable sensors enable the measurement of biometrics such as heart rate [3,4], respiration rate [5,6], blood pressure [7], blood oxygen levels [8], sweat pH [9], and eye movements [10]. Human behavior and health status can be monitored through data derived from human-body measurements [1,11]. There is a high expectation for the utilization of such data in the medical and healthcare sectors [12,13].
The predominant approach in general measurements of physical phenomena is to employ sensors with a high sensitivity to the phenomena to be focused on. Consequently, when multiple phenomena are measured simultaneously, multiple sensors are combined [14,15,16]. However, an increase in the number of measurement parameters leads to a corresponding increase in the number of required sensors, making it infeasible for routine monitoring. Therefore, research has been focused on developing signal processing techniques to extract diverse types of information from a limited number of sensors.
When conducting human-body measurements, various wearable sensors, such as skin potential sensors, electromyography (EMG) devices, and stretch sensors, are used depending on the application. The signals observed by these sensors contain multiple biological signals as well as motion-related signals from human movements. For example, EMG signals include electrocardiogram (ECG), while stretch sensors used for respiratory monitoring contain movement-related signals from body motion. In these measurements, signals outside the targeted frequency band often act as noise. For instance, EMG signals in isometric tasks were observed below maximum voluntary contraction (MVC) of EMG activation, making muscle activity analysis difficult under certain conditions [17]. Additionally, in respiratory monitoring, excessive movement by the wearer of a stretch sensor may prevent proper sensor adhesion, leading to interrupted or inaccurate measurements [18]. Thus, noise occurring during measurements may pose a significant problem [18]. In many biological measurements, motion artifacts caused by human movements often introduce noise [19,20]. Besides respiratory monitoring, such noise includes eye blinks in electroencephalogram (EEG) recordings [10,21] and motion-related noise in imaging techniques like MRI [22]. To observe the signal of interest (SoI) from an observed signal containing noise, it is crucial to use features that facilitate the classification of the SoI [23].
Various studies have explored methods for separating the signal of interest from noise in observed signals, with filtering being a representative approach that utilizes frequency as a feature. When the frequency band of an SoI is known in advance, these techniques are useful for extracting signals within a specific passband from the measured signal. When the frequency band of an SoI is unknown, methods such as Blind Source Separation (BSS) designed using neural networks [24] and Independent Component Analysis [25,26] can be used for frequency analysis. BSS offers a means to disentangle multiple unknown signals into their respective independent source signals. These methods are effective in separating an SoI from an measured signal when the frequency band of the targeted signal is constant. However, when the frequency band changes over time, signal separation cannot be performed if the frequency moves outside the passband. Furthermore, conventional frequency analysis methods are not suitable for handling noise such as motion artifacts that cause data loss, as mentioned above. Therefore, there is a need for methods that can perform stable frequency analyses even when the frequency band of the target signal changes over time or when data are missing.
The measurement made using sensors faces the following challenges: (1) contamination by noise and signals from unwanted frequency bands, (2) temporal disconnection and dropout, and (3) temporal changes in the frequency band of the SoI. Therefore, a useful analysis method for these issues, (1)–(3), is required. The objective of this study was to achieve a stable separation of the SoI from the measured signal even under these conditions: (1)–(3). We propose a signal separation method based on frequency entrainment phenomena. Through the application of the Van der Pol oscillator, our proposed method enables the generation of a robust SoI output that is resilient to data gaps and noise contamination in the input signal [27]. Even when the input signal is missing, the Van der Pol oscillator maintains its internal state and continues self-oscillation, making it robust against noise such as motion artifacts that cause data loss. Furthermore, since the synchronized frequency is variable with respect to the input, it can accommodate time-varying frequency bands of the SoI. The rest of the article is organized as follows. Section 2 explains the mechanism by which the frequency entrainment phenomenon is used to separate the SoI from the measured signal. Additionally, it demonstrates that the proposed method addresses issue (2) by stably generating the SoI during sensor-based measurements. Section 3 presents simulations that show that the proposed method can separate the SoI from data containing issues (1) and (3). Section 4 discusses the strengths of the proposed method based on the results, includes a comparison with conventional methods, and examines its application to real-world scenarios. Section 5 covers the conclusions.
2. Methods
2.1. Design Concept
In this study, we focused on the following challenges encountered in wearable sensor-based measurements: (1) The inclusion of noise and signals from irrelevant physiological information, (2) The occurrence of temporal disconnection and dropout, and (3) The time-varying frequency of the target signal. This study aimed to stably separate and analyze the SoI from measured signals containing multiple signals. To achieve stable signal separation, we propose a system with the functions shown in Figure 1.
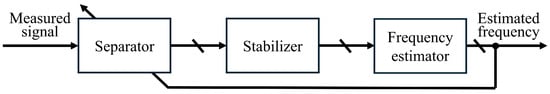
Figure 1.
The concept of a system for estimating the frequency of an SoI from measured data.
Identifying the exact frequency of an SoI is challenging. Therefore, we extract the signal within the frequency band that is likely to contain the SoI from the measured signal using a separator, based on physiological conditions. The extracted signal is input to the stabilizer, and a signal synchronized with a frequency that allows for stable periodic motion is output from the stabilizer. The synchronized signal is subsequently fed into the frequency estimator to determine the frequency of the SoI.
In our proposed system, the stabilizer and frequency estimator estimate the frequency of the SoI from the frequency band of the filter within the separator. The feedback of the estimated frequency to the filter’s frequency band ensures that the filter is always tuned to the frequency of the target signal. Consequently, a frequency analysis method is developed to address the three aforementioned challenges. We describe in the following subsections the design theory behind each of the separator, stabilizer, and frequency estimator. The parameters used in this paper are summarized in Table 1.

Table 1.
Nomenclature for parameters appearing in this paper.
2.2. Separator for Signal Decomposition
For measurement challenges under condition (1), reducing the impact of noise is effective. Therefore, the separator extracts the frequency band containing the SoI, separating the target signal from other signals and minimizing noise interference. Let represent a composite signal of M types of periodic signals with different frequencies, and let represent noise signals caused by motion artifacts and similar sources. The measured signal can be expressed as shown in Equation (1). Furthermore, among , the SoI consists of N types, while the remaining consists of types. can be divided into the SoI, unwanted periodic signals, and noise signals.
is a function of time and is defined by Equation (2).
, , and represent the amplitude, angular frequency, and phase difference, respectively. t represents time.
In the following text, we focus on a frequency band that contains a single SoI. In the subsequent explanation, . The frequency of is . Let the center frequency of the passband be and the bandwidth of the filter be . The passband of the bandpass filter is then given by . If the transfer function of the designed bandpass filter is , filtering can be expressed as follows:
where denotes the Laplace transform, and denotes the inverse Laplace transform. The signal processed by the filter is expressed as shown in Equation (4).
Here, represents the amplitude of the signal, and represents the phase of the signal. These are defined considering the amplitude gain of the sensor, . is defined in Section 3.
2.3. Stabilization for Signal of Interest
To address the challenges in conditions (1) and (2), in addition to the separator for further noise reduction, stabilization is employed. This ensures stable signal classification even when there are periods without input signals. The separator extracts signals within a specific frequency band from the measured signal, but it may also include unwanted signals. The stabilizer utilizes the frequency entrainment phenomenon to output a signal that contains only the frequency components of interest, extracted from the signal separated by the separator [28]. The frequency entrainment phenomenon ensures the stable output of a signal synchronized with the input and is observed in equations that satisfy the Liénard equation [29]. One of the equations that satisfy the Liénard equation is the Hybrid Van der Pol equation, which is as follows:
where , , and are the gain of convergence, the angular frequency of self-excited oscillation, and the gain of the input signal, respectively. In Equation (5), the filtered signal , separated by the separator, is input. The angular frequency of the internal state synchronizes with the component having the maximum energy among the signals contained in . This phenomenon is called frequency locking and occurs with and that satisfy and [27]. If the frequency of the synchronized internal state is denoted as , the internal state , which represents the output signal, can be expressed as a function of time in Equation (6).
The filtered signal , extracted by the separator, is input into Equation (5). The solution of the differential equation exhibits synchronization with the dominant component within the filtered signal.
where represents the amplitude of the output signal, and in the ideal synchronization state of the Hybrid Van der Pol equation, .
Additionally, represents the phase difference between the input signal and the output signal. can be obtained as something similar to . In the case of , the input and output synchronize as a forced oscillation. However, in Equation (5), even when , self-excited vibration occurs at . This self-excited vibration allows for a stable output of in cases of temporal disconnection and dropout, as shown in Figure 2a. Subsequently, when a signal is input again into Equation (5) and becomes non-zero, synchronizes with the angular frequency of the SoI. In the case of temporal disconnection and dropout, can output a signal synchronized with the SoI, as illustrated in Figure 2b. From the above, it can be concluded that the signal can be stably extracted even in cases of temporal disconnection and dropout.
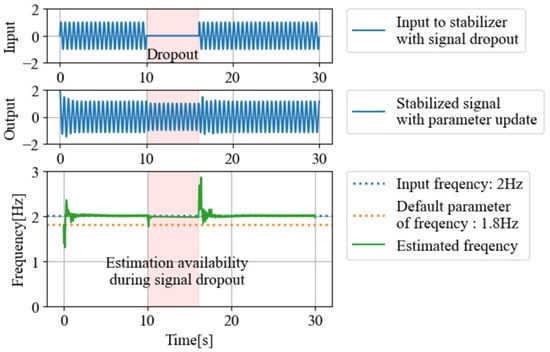
Figure 2.
Signal stabilization in the case of input signal dropout.
2.4. Frequency Estimator for Instantaneous Angular Frequency
For measurement challenges under condition (3), observing the instantaneous frequency helps prevent losing track of the SoI. Therefore, the frequency estimator utilizes the Hybrid Van der Pol equation to induce the frequency entrainment phenomenon, enabling the algebraic calculation of the instantaneous angular frequency of the SoI using the synchronized signal .
When frequency entrainment occurs, the solution trajectory of the state vector , calculated using the Hybrid Van der Pol oscillator, forms an ellipse on the phase plane. In the normalized phase plane, where the velocity axis is scaled by the angular frequency, the solution trajectory forms a perfect circle. This prevents the mixing of unwanted high-frequency components. On this normalized phase plane, the solution trajectory of the state vector rotates clockwise on the unit circle with an angular frequency . The frequency estimator takes advantage of this characteristic to estimate the instantaneous angular frequency such that . By normalization, the phase angle can be calculated from the state vector using Equation (7).
Here, since the variation of is gradual compared to , is treated as a constant in Equation (8). The instantaneous angular frequency can be expressed by differentiating , as shown in Equation (8).
Using Equation (8), the frequency of the signal can be derived from the state through algebraic calculations alone, without the need for frequency analysis such as the Fourier transform.
2.5. Algorithm Using Proposed System for Signal Decomposition and Tracking
This section explains the algorithm for obtaining the instantaneous angular frequency vector , which consists of N types of time-series data extracted from . The instantaneous angular frequency vector is expressed as . Figure 3 shows the block diagram for extracting from . The algorithm is as follows:
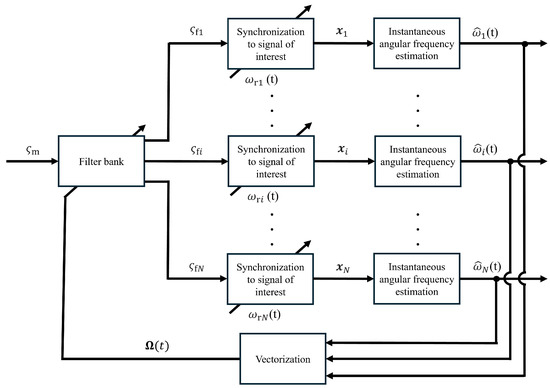
Figure 3.
Block diagram of proposed method that can stabilize and decompose SoI.
- (1)
- The filter bank serves the function of a separator, as shown in Figure 1. In the filter bank, signals corresponding to the number N of SoIs are extracted from . The N signals output from the filter bank are input into N frequency entrainment phenomena.
- (2)
- A frequency entrainment phenomenon serves the function of a stabilizer described in Section 2.3. For each , a frequency entrainment phenomenon induced, and the output synchronized with the input signal is calculated.
- (3)
- The instantaneous frequency estimation serves the function of the frequency estimator described in Section 2.4. By inputting into each of the N instantaneous frequency estimators, is output.
is fed back to the filter bank, and the passband frequency of the filter for each SoI is updated accordingly. By combining the separator and stabilizers, stable frequency analysis can be achieved with minimal influence from signals and noise caused by temporal disconnection and dropout. Furthermore, by feeding back to the separator, the system can stably track signals with frequency fluctuations.
3. Experiment and Results
3.1. Setup for Simulation Experiment
In measurements using wearable sensors, there is a problem where correctly synchronized outputs cannot be obtained when a composite wave containing noise and signals with fluctuating frequencies is input. In this section, we describe the application of the proposed method to input signals containing noise and signals with fluctuating frequencies to address the problem. The effectiveness of the method was verified through simulations, and the simulation results are presented here.
In the simulation, the input signal is a composite wave consisting of six signals with different frequency characteristics, as described in Equation (2), along with random noise. Additionally, it is assumed that a sensor with an amplitude gain , peaking at the angular frequency , is used to obtain the input signal . The amplitude gain is assumed to follow the form given in Equation (9).
represents the maximum value of the signal, and denotes the angular frequency of each signal contained in the input. Here, in this study, was set to make each signal distinct. was set as to maximize sensitivity to the representative value of the respiratory rate distribution during light exercise because is peaking at the angular frequency that adjusts sensitivity to facilitate the measurement of physical and physiological phenomena. Figure 4 shows the amplitude calculated using Equation (9).
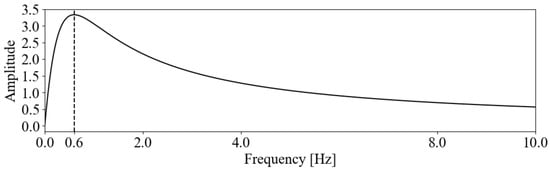
Figure 4.
Signal amplitude gain during frequency shifts.
Table 2 shows the angular frequency and phase difference . Here, the noise signal is assumed to be random noise.
Table 2.
Parameter values of each signal.
3.2. Signal Separation Through Frequency Estimation
Figure 5 shows the input signal described above. Figure 5a shows the general shape of the input signal , and Figure 5b shows the spectrogram obtained by applying a continuous wavelet transform to . The initial values of the angular frequency are set as , based on the approximate frequency band visible in Figure 5b. Additionally, the parameters for the Van der Pol equation are set as , , and .
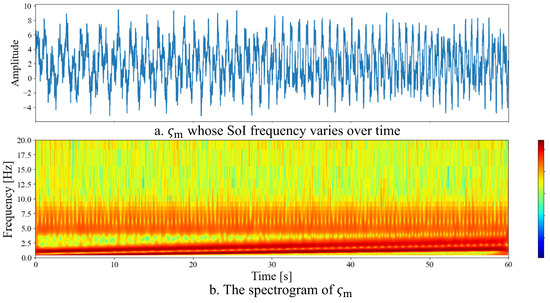
Figure 5.
Measured signal as a composite wave of , , , , , , and .
For the simulation under the conditions described above, Figure 6a shows the output signals and synchronized with the input using the proposed stabilizer. Both output signals were confirmed to have been stably synchronized. Figure 6b shows the spectrogram results of , , and . The black line represents the spectral values of , while the green lines represent the spectral values of and . Figure 6b shows that by appropriately adjusting the initial values of the angular frequency , the output signal was synchronized with signals in different frequency bands.
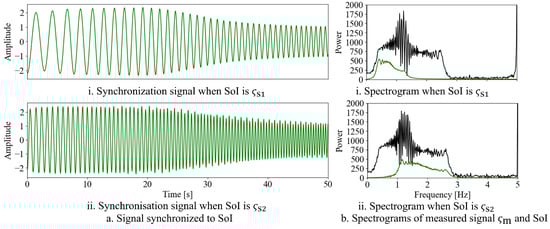
Figure 6.
Signal decomposed based on frequency entrainment phenomena.
Figure 7 shows the estimated results of the instantaneous angular frequencies and calculated from and . The black lines represent the true frequencies of and , the blue line represents the estimated frequency of , and the green line represents the estimated frequency of . It can be observed that and overlap with the frequencies of their respective input signals, demonstrating that frequency estimation was achieved with a high accuracy. From these results, it is confirmed that the frequency estimation for the SoI was performed with a high accuracy and that signal separation is feasible.
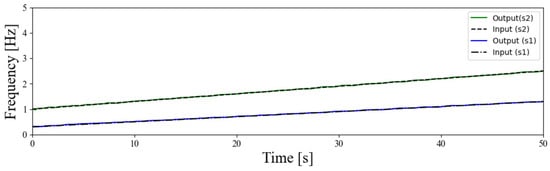
Figure 7.
Frequency change estimation of signal decomposition into and based on frequency entrainment phenomena.
4. Discussion and Application
4.1. Benefit of Stabilized Synchronous Signals
In Section 4.1, the three advantages of the proposed method, as indicated by the results obtained in Section 3, are discussed.
First, the proposed method enables the continuous output of periodic signals synchronized with the frequency of SoI. Since the input signal used in the simulation is a composite wave of various signals and noise, becomes a discontinuous and complex signal, as shown in Figure 5a. By applying the frequency entrainment phenomenon using the Hybrid Van der Pol equation to such signals, a continuous synchronized signal can be stably obtained, as shown in Figure 6a. This can be explained as follows: when a frequency entrainment phenomenon occurs, the state converges to a condition with the target energy. This phenomenon can be observed on the phase plane of the state vector , calculated using the Hybrid Van der Pol equation, where the solution trajectory converges to a limit cycle. As a result, a continuous output signal can be stably maintained. Moreover, when temporal disconnection and dropout occur while the solution trajectory is converged, the control input becomes zero. However, the solution trajectory continues self-sustained oscillation along the limit cycle. Thus, even if the input signal ceases, a continuous output signal can still be obtained. When the input signal resumes, the frequency entrainment phenomenon is reactivated, and a synchronized signal is output again. These characteristics ensure that continuous and stable signals can be maintained both during synchronization and in cases of temporal disconnection and dropout.
Second, the proposed method can track the frequency fluctuations of an SoI. In the simulation, SoI and exhibited frequency fluctuations, as shown in Figure 5. For these SoIs, the synchronized signals obtained using frequency entrainment phenomena oscillated at frequencies close to those of the input signals, as demonstrated in Figure 7. Considering the normalized phase plane, in an ideal synchronized state, the state vector synchronizes and fluctuates in response to the frequency variations of the input signal. As a result, the observer can estimate the frequency from the state vector. Thus, the output adapts to track the frequency fluctuations of the input signal. The proposed method achieves this by feeding back the estimated instantaneous angular frequency, maintaining the ideal synchronized state, and ensuring that the frequency of the output signal tracks the frequency of the input signal. Moreover, even if the input signal is interrupted, the Hybrid Van der Pol equation continues to generate a signal at a constant frequency through self-excited oscillation. As long as the frequency shifts of the input signal are not excessively large, the output frequency remains close to that of the input signal. This feature helps prevent situations where frequency estimation becomes impossible due to sensor detachment during online monitoring. Additionally, the proposed method has a computational complexity of concerning the number of data points n in the sliding window, which is generally low. Additionally, in the proposed method, real-time data processing can be performed with a computational complexity of , where n is the width of the sliding window used for analysis, which is generally low. It enables fast computation while requiring minimal memory usage and power consumption. Therefore, it is well-suited for real-time processing in embedded systems.
Third, the proposed method separates the measured signal into multiple frequency bands using a filter bank while simultaneously performing frequency estimation for each band. For a given SoI, the advantages mentioned above ensure that the output signal can track the frequency of each signal, as shown in Figure 7. Although the simulation demonstrated this for two signals, similar output signals can be obtained for three or more signals. In this way, the proposed method enables a stable separation of multiple signals from the measured signal. When the signals decomposed by the proposed method are represented in the frequency domain, as shown in Figure 7, frequency information such as that shown in the range of 0–2.5 Hz in Figure 5 can be obtained.
The proposed method has the following limitations: when multiple signals exist within the same frequency band as the SoI, an accurate frequency estimation of the SoI becomes impossible, and it cannot distinguish between a situation where the physical phenomenon generating the SoI is not occurring and a situation where the measurement is interrupted due to sensor detachment. In the proposed method, the stabilizer synchronizes with the input signal, producing an output that follows the signal with the highest energy. Consequently, the frequency estimator also tracks the frequency of this dominant signal. Additionally, the proposed method utilizes the observer function of the Hybrid Van der Pol equation to observe the instantaneous angular frequency. This allows the method to detect when input signals are lost and continue providing a plausible frequency even during signal dropout. However, the method cannot identify the cause of the signal loss, meaning it is unable to distinguish whether the dropout is due to a physical interruption of the phenomenon or sensor detachment. These factors can lead to misinterpretation of the frequency estimation results. Therefore, the assumptions for applying the proposed method include the following: (1) different physical phenomena generate distinct frequency bands, and (2) the target physical phenomenon continues during measurement for a successful signal separation.
4.2. Comparison of Proposed and Conventional Methods
A comparative accuracy evaluation was conducted between the bandpass filter (BPF), the most common method for signal classification, and the proposed method. In this evaluation, white noise was added to the measured data from Section 3, modifying the noise ratio. Both the BPF and the proposed method were applied under these conditions, and the frequency estimation accuracy of and was compared.
When performing a performance comparison, the measured data were evaluated using the signal-to-noise ratio (SNR) as the noise ratio as follows:
where is the SNR of the SoI , and P represents signal energy. The measurement data were adjusted so that , range from to dB.
BPF was applied to the measured data to capture the frequency variations of and , with the median of the passband set to Hz and Hz, and the passband width set to Hz. The frequency variations of the filtered signals were analyzed by performing a short-time Fourier transform on the filtered signals, and the frequency band with the highest energy in the spectrogram was taken as the result of frequency estimation using the BPF. To evaluate the estimation accuracy, root mean square error (RMSE) was used to quantify the differences between the frequencies of and and the frequencies estimated by both the proposed method and BPF.
Figure 8 shows the estimation accuracy of the proposed method and BPF. Figure 8a,b represent the estimation accuracy for the frequencies of and , respectively. The proposed method achieved a higher frequency estimation accuracy than the BPF across the entire analysis range. As the frequencies of and change over time, there are periods when signals other than the signal of interest (SoI) exist within the passband of the BPF. This results in a lower frequency estimation accuracy for the BPF. In contrast, the proposed method calculates the instantaneous angular frequency and applies feedback when the SoI undergoes frequency variations, allowing it to track the SoI and perform frequency estimation. As a result, the proposed method can isolate the SoI more effectively, leading to a higher estimation accuracy.
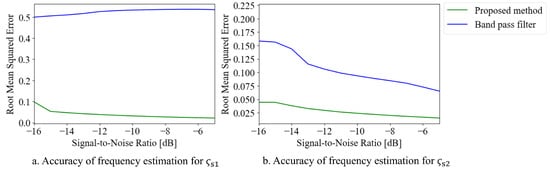
Figure 8.
Comparison of the estimation accuracy between the proposed method and BPF under varying SNR conditions.
4.3. Application to Wearable Stretch Sensor
As a practical application of the proposed method, we applied it to data obtained from a walking individual wearing a stretch sensor on the chest, as shown in Figure 9a, to verify its effectiveness in actual data. The measurements from the stretch sensor contain skin movements caused by respiration, heartbeat, and human motion, resulting in a signal composed of multiple overlapping components. The stretch sensor (Murata Machinery, Ltd., Kyoto, Japan) shown in Figure 9a changes its resistance value as the sensor element stretches [30]. This enables the measurement of small skin expansions and contractions caused by biological phenomena. As a preliminary test, the skin stretch on the chest of a single participant walking at m/s was measured, as shown in Figure 9b. The data were acquired using an AD converter with a sampling frequency of 100 Hz, which is sufficient for observing biological signals.
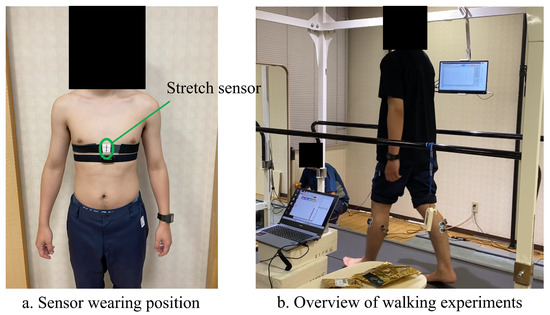
Figure 9.
Stretch sensor placement and walking experiment setup.
Figure 10 shows the measured signal and the results of its wavelet transform. Figure 10a illustrates the stretch of the stretch sensor, while Figure 10b presents the spectrogram of the signal shown in Figure 10a. From Figure 10, it can be confirmed that the power of the signals around 0.5 Hz and 2 Hz is high. Here, 1.54 m/s corresponds to light-to-moderate exercise. During this type of activity, the respiratory rate, heart rate, and walking rhythm are known to range between 0.40 and 0.90 Hz, 1.67 and 2.17 Hz, and 1.92 and 2.2 Hz, respectively. Examining Figure 10b, the frequency bands with a high energy align with these ranges. Therefore, it can be inferred that the biological signals included in consist of components related to respiration and components where heartbeats and walking rhythms are mixed.
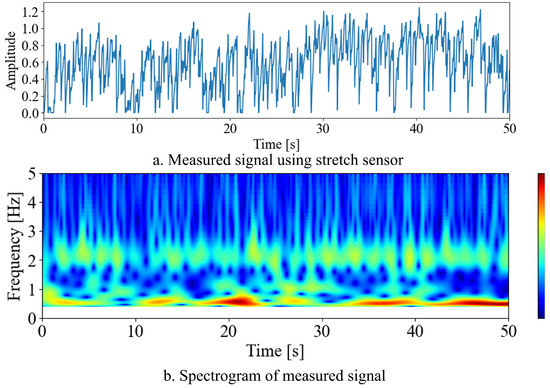
Figure 10.
Outline and frequency characteristics of measured signal.
Using the proposed method, signal decomposition was performed in two frequency bands corresponding to the predicted components of breath rate, heart rate, and walking. The initial values were set as . Here, by applying the proposed method with the Hybrid Van der Pol equation, the frequency entrainment phenomena were induced, resulting in stable synchronized signals being output for the input signals.
Figure 11 shows the results of the instantaneous angular frequencies analytically calculated using the state vector of the synchronized signals. In Figure 11a, the estimated frequencies of the two lines suggest that the green line represents the heart rate, while the blue line corresponds to the breath rate. The green line fluctuates around 2 Hz with minimal variation, which suggests that under steady-load exercise, the heart rate, proportional to exercise intensity and oxygen consumption, remains relatively constant. On the other hand, the blue line exhibits more frequency variations than the green line. This suggests that it represents respiration, which is sensitive to changes in the internal environment of the body, such as carbon dioxide concentration in the blood, and exhibits dynamic changes. These results indicate that biological signals can be separated from the stretch sensor’s measurement data. Furthermore, the separated signals have the potential to represent vital signs and biomechanical characteristics.
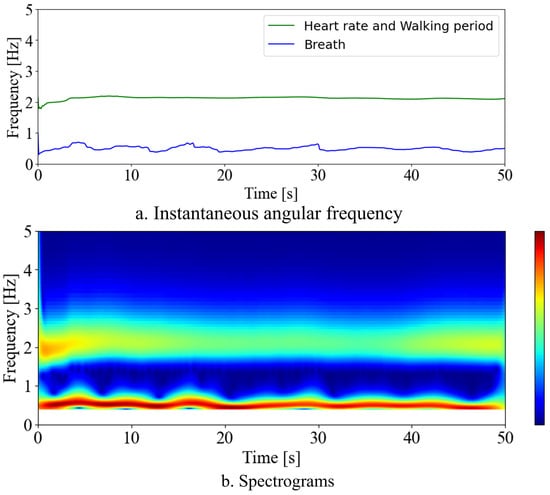
Figure 11.
Frequency estimation results obtained using the proposed method.
Compared to Figure 10b, for the SoI, approximately 0.6 Hz and 2 Hz are separated from other frequency bands.
These results demonstrate that stable signal decomposition can be achieved even for real measurement data containing noise and frequency shifts.
5. Conclusions
This study aimed to achieve stable signal separation even in the following scenarios encountered during measurements using wearable sensors: (1) the mixture of noise and unwanted signals in the measured signal, (2) temporal disconnection and dropout during measurement, and (3) frequency shifts of the SoI. To deal with these challenges, we proposed a system comprising a separator, stabilizers, and frequency estimators. The separator utilizes a filter bank to separate the measured signal into frequency bands corresponding to each SoI. The stabilizers employ the frequency entrainment phenomenon based on the Van der Pol equation to stably output the state vector synchronized with the input. The frequency estimator analytically calculates the instantaneous angular frequency from the state vector and estimates the frequency of the SoI. By feeding back the estimated frequency, the system can track the SoI even when its frequency shifts. The proposed method enables the signal decomposition of an SoI from a measured signal of multiple signals by combining these functionalities effectively.
The proposed method’s robustness to issues encountered during measurement was indicated by reproducing them through simulations. They confirmed that the proposed method enables signals to be decomposed into stable signals under such conditions. For future research, we will improve the proposed method to address the limitation caused by multiple signals existing within closely spaced frequency bands and uncertainty about whether the interruption is due to measurement discontinuity or a physical phenomenon.
Author Contributions
Conceptualization, K.K., T.K., and T.T.; methodology, K.K. and T.K.; application and experiment, K.S.; validation, K.K.; writing—original draft preparation, K.K.; writing—review and editing, T.K. and T.T.; supervision, T.T. All authors have read and agreed to the published version of the manuscript.
Funding
This research received no external funding.
Institutional Review Board Statement
This study is a preliminary research involving a single healthy young male participant. The study meets the criteria for exemption from ethical review as confirmed by Fukuyama Memorial Hospital, the approving institution, due to appropriate participant protection, non-collection of personal information, data handling solely by the research team, lack of financial interests, not targeting socially vulnerable groups, absence of psychological or other interventions, no experimental stimuli beyond everyday experiences or ordinary conversations, and no false explanations regarding the research purpose. The experiment is conducted in accordance with the Helsinki Declaration.
Informed Consent Statement
Written informed consent was obtained from all participants before their involvement.
Data Availability Statement
The data presented in this study are available on request from the corresponding author (privacy and ethical restrictions).
Conflicts of Interest
The authors declare no conflicts of interest.
References
- Pantelopoulos, A.; Bourbakis, N.G. A Survey on Wearable Sensor-Based Systems for Health Monitoring and Prognosis. IEEE Trans. Syst. Man, Cybern. Part C Appl. Rev. 2010, 40, 1–12. [Google Scholar] [CrossRef]
- Lmberis, A.; Dittmar, A. Advanced Wearable Health Systems and Applications—Research and Development Efforts in the European Union. IEEE Eng. Med. Biol. Mag. 2007, 26, 29–33. [Google Scholar] [CrossRef]
- Baig, M.M.; Gholamhosseini, H.; Connolly, M.J. A comprehensive survey of wearable and wireless ECG monitoring systems for older adults. Med Biol. Eng. Comput. 2013, 51, 485–495. [Google Scholar] [CrossRef]
- Prieto-Avalos, G.; Cruz-Ramos, N.A.; Alor-Hernández, G.; Sánchez-Cervantes, J.L.; Rodríguez-Mazahua, L.; Guarneros-Nolasco, L.R. Wearable Devices for Physical Monitoring of Heart: A Review. Biosensors 2022, 12, 292. [Google Scholar] [CrossRef] [PubMed]
- Tai, H.; Wang, S.; Duan, Z.; Jiang, Y. Evolution of breath analysis based on humidity and gas sensors: Potential and challenges. Sens. Actuators B Chem. 2020, 318, 128104. [Google Scholar] [CrossRef]
- De Fazio, R.; Stabile, M.; De Vittorio, M.; Velázquez, R.; Visconti, P. An Overview of Wearable Piezoresistive and Inertial Sensors for Respiration Rate Monitoring. Electronics 2021, 10, 2178. [Google Scholar] [CrossRef]
- Ng, K.G.; Ting, C.M.; Yeo, J.H.; Sim, K.W.; Peh, W.L.; Chua, N.H.; Chua, N.K.; Kwong, F. Progress on the development of the MediWatch ambulatory blood pressure monitor and related devices. Blood Press. Monit. 2004, 9, 149–165. [Google Scholar] [CrossRef]
- Vogel, S.; HÜlsbusch, M.; Hennig, T.; Blazek, V.; Leonhardt, S. In-Ear Vital Signs Monitoring Using a Novel Microoptic Reflective Sensor. IEEE Trans. Inf. Technol. Biomed. 2009, 13, 882–889. [Google Scholar] [CrossRef]
- Nakata, S.; Shiomi, M.; Fujita, Y.; Arie, T.; Akita, S.; Takei, K. A wearable pH sensor with high sensitivity based on a flexible charge-coupled device. Nat. Electron. 2018, 1, 596–603. [Google Scholar] [CrossRef]
- Vidal, M.; Turner, J.; Bulling, A.; Gellersen, H. Wearable eye tracking for mental health monitoring. Comput. Commun. 2012, 35, 1306–1311. [Google Scholar] [CrossRef]
- A Comprehensive Review on Wearable Health Monitoring Systems. Open Biomed. Eng. J. 2021, 15, 213–225. [CrossRef]
- Chan, M.; Estève, D.; Fourniols, J.Y.; Escriba, C.; Campo, E. Smart wearable systems: Current status and future challenges. Artif. Intell. Med. 2012, 56, 137–156. [Google Scholar] [CrossRef]
- Iqbal, S.M.A.; Mahgoub, I.; Du, E.; Leavitt, M.A.; Asghar, W. Advances in healthcare wearable devices. Npj Flex. Electron. 2021, 5, 1–14. [Google Scholar] [CrossRef]
- Price, K.; Bird, S.R.; Lythgo, N.; Raj, I.S.; Wong, J.Y.L.; Lynch, C. Validation of the Fitbit One, Garmin Vivofit and Jawbone UP activity tracker in estimation of energy expenditure during treadmill walking and running. J. Med. Eng. Technol. 2017, 41, 208–215. [Google Scholar] [CrossRef]
- McCarthy, C.; Pradhan, N.; Redpath, C.; Adler, A. Validation of the Empatica E4 wristband. In Proceedings of the 2016 IEEE EMBS International Student Conference (ISC), Ottawa, ON, Canada, 29–31 May 2016; pp. 1–4. [Google Scholar] [CrossRef]
- Hiremath, S.; Yang, G.; Mankodiya, K. Wearable Internet of Things: Concept, Architectural Components and Promises for Person-Centered Healthcare. In Proceedings of the 2014 4th International Conference on Wireless Mobile Communication and Healthcare-Transforming Healthcare Through Innovations in Mobile and Wireless Technologies (MOBIHEALTH), Athens, Greece, 3–5 November 2014. [Google Scholar]
- Drake, J.D.M.; Callaghan, J.P. Elimination of electrocardiogram contamination from electromyogram signals: An evaluation of currently used removal techniques. J. Electromyogr. Kinesiol. 2006, 16, 175–187. [Google Scholar] [CrossRef]
- Lee, P.J. Clinical evaluation of a novel respiratory rate monitor. J. Clin. Monit. Comput. 2016, 30, 175–183. [Google Scholar] [CrossRef] [PubMed]
- Conforto, S.; D’Alessio, T.; Pignatelli, S. Optimal rejection of movement artefacts from myoelectric signals by means of a wavelet filtering procedure. J. Electromyogr. Kinesiol. 1999, 9, 47–57. [Google Scholar] [CrossRef] [PubMed]
- Li, G.; Li, Y.; Yu, L.; Geng, Y. Conditioning and Sampling Issues of EMG Signals in Motion Recognition of Multifunctional Myoelectric Prostheses. Ann. Biomed. Eng. 2011, 39, 1779–1787. [Google Scholar] [CrossRef]
- Islam, M.K.; Rastegarnia, A.; Yang, Z. Methods for artifact detection and removal from scalp EEG: A review. Neurophysiol. Clin. Neurophysiol. 2016, 46, 287–305. [Google Scholar] [CrossRef]
- Zaitsev, M.; Maclaren, J.; Herbst, M. Motion artifacts in MRI: A complex problem with many partial solutions. J. Magn. Reson. Imaging 2015, 42, 887–901. [Google Scholar] [CrossRef]
- Veeranki, Y.R.; Ganapathy, N.; Swaminathan, R. Non-Parametric Classifiers Based Emotion Classification Using Electrodermal Activity and Modified Hjorth Features. In Public Health and Informatics; IOS Press: Amsterdam, The Netherlands, 2021; pp. 163–167. [Google Scholar] [CrossRef]
- Amari, S.; Cichocki, A. Adaptive blind signal processing-neural network approaches. Proc. IEEE 1998, 86, 2026–2048. [Google Scholar] [CrossRef]
- Poh, M.Z.; McDuff, D.J.; Picard, R.W. Non-contact, automated cardiac pulse measurements using video imaging and blind source separation. Opt. Express 2010, 18, 10762–10774. [Google Scholar] [CrossRef] [PubMed]
- Yang, W.; Pilozzi, A.; Huang, X. An Overview of ICA/BSS-Based Application to Alzheimer’s Brain Signal Processing. Biomedicines 2021, 9, 386. [Google Scholar] [CrossRef] [PubMed]
- Kusaka, T.; Tanaka, T.; Kajiwara, H. Motion-tracking skill assist and power assist for sinusoidal motions with a semi-active assist mechanism using energy control. Robomech J. 2017, 4, 2. [Google Scholar] [CrossRef]
- Yoshihiko, S.; Yuuichi, Y.; Hikihara, T. Energy-based analysis of frequency entrainment described by van der Pol and PLL equations. IEICE Tech. Rep. IEICE Tech. Rep. 2006, 106, 57–62. [Google Scholar]
- Tsatsos, M. The Van der Pol Equation. arXiv 2008, arXiv:0803.1658. [Google Scholar] [CrossRef]
- Creating Nanocarbon Application Technology. Available online: http://www.ostec-tec.info/coe-osaka/en/cnt.html (accessed on 14th March 2025).
Disclaimer/Publisher’s Note: The statements, opinions and data contained in all publications are solely those of the individual author(s) and contributor(s) and not of MDPI and/or the editor(s). MDPI and/or the editor(s) disclaim responsibility for any injury to people or property resulting from any ideas, methods, instructions or products referred to in the content. |
© 2025 by the authors. Licensee MDPI, Basel, Switzerland. This article is an open access article distributed under the terms and conditions of the Creative Commons Attribution (CC BY) license (https://creativecommons.org/licenses/by/4.0/).