Article

A Novel Machine Vision-Based Collision Risk Warning Method for Unsignalized Intersections on Arterial Roads

1
College of Computer Science, Chongqing University, Chongqing 400044, China
2
China Merchants Chongqing Communications Research and Design Institute Co., Ltd., Chongqing 400067, China
3
National & Local Joint Engineering Research Center of Transportation Civil Engineering Materials, Chongqing Jiaotong University, Chongqing 400074, China
4
School of Civil Engineering, Chongqing Jiaotong University, Chongqing 400074, China
*
Authors to whom correspondence should be addressed.
Electronics 2025, 14(6), 1098; https://doi.org/10.3390/electronics14061098
Submission received: 13 February 2025 / Revised: 3 March 2025 / Accepted: 5 March 2025 / Published: 11 March 2025
(This article belongs to the Special Issue Computer Vision and Image Processing in Machine Learning)

Abstract

:
To address the critical need for collision risk warning at unsignalized intersections, this study proposes an advanced predictive system combining YOLOv8 for object detection, Deep SORT for tracking, and Bi-LSTM networks for trajectory prediction. To adapt YOLOv8 for complex intersection scenarios, several architectural enhancements were incorporated. The RepLayer module replaced the original C2f module in the backbone, integrating large-kernel depthwise separable convolution to better capture contextual information in cluttered environments. The GIoU loss function was introduced to improve bounding box regression accuracy, mitigating the issues related to missed or incorrect detections due to occlusion and overlapping objects. Furthermore, a Global Attention Mechanism (GAM) was implemented in the neck network to better learn both location and semantic information, while the ReContext gradient composition feature pyramid replaced the traditional FPN, enabling more effective multi-scale object detection. Additionally, the CSPNet structure in the neck was substituted with Res-CSP, enhancing feature fusion flexibility and improving detection performance in complex traffic conditions. For tracking, the Deep SORT algorithm was optimized with enhanced appearance feature extraction, reducing the identity switches caused by occlusions and ensuring the stable tracking of vehicles, pedestrians, and non-motorized vehicles. The Bi-LSTM model was employed for trajectory prediction, capturing long-range dependencies to provide accurate forecasting of future positions. The collision risk was quantified using the predictive collision risk area (PCRA) method, categorizing risks into three levels (danger, warning, and caution) based on the predicted overlaps in trajectories. In the experimental setup, the dataset used for training the model consisted of 30,000 images annotated with bounding boxes around vehicles, pedestrians, and non-motorized vehicles. Data augmentation techniques such as Mosaic, Random_perspective, Mixup, HSV adjustments, Flipud, and Fliplr were applied to enrich the dataset and improve model robustness. In real-world testing, the system was deployed as part of the G310 highway safety project, where it achieved a mean Average Precision (mAP) of over 90% for object detection. Over a one-month period, 120 warning events involving vehicles, pedestrians, and non-motorized vehicles were recorded. Manual verification of the warnings indicated a prediction accuracy of 97%, demonstrating the system’s reliability in identifying potential collisions and issuing timely warnings. This approach represents a significant advancement in enhancing safety at unsignalized intersections in urban traffic environments.

1. Introduction

1.1. Background and Motivation

Pedestrians and non-motorized vehicles are essential components of urban transportation systems and constitute a vulnerable group among road users, as shown in Figure 1. This type of scenario is common in arterial roads and rural roads, where the main road typically consists of two-way, two-lane traffic, while the secondary road is usually a single-lane roadway. The main road primarily serves motor vehicles, while the secondary road is mainly used by pedestrians, non-motorized vehicles, and agricultural vehicles. The traffic volume is generally low, but the lack of signal control results in significant conflicts over the right-of-way between pedestrians and motor vehicles. This lack of regulation exacerbates safety risks at intersections, as pedestrians and non-motorized vehicles often struggle to navigate the roads alongside faster-moving motor vehicles. Globally, one-third of all traffic accidents involve pedestrians [1]. According to the World Health Organization’s (WHO) Global Status Report on Road Safety 2018, approximately 1.35 million people die annually in road traffic accidents worldwide, with pedestrians and cyclists accounting for 26% of these fatalities [2]. In China, 273,098 road traffic accidents were reported in 2021 [3]. Statistics indicate that pedestrians accounted for 25.15% of fatalities and 17.21% of injuries in these accidents [4]. Ensuring the safety of vulnerable road users (VRUs), particularly pedestrians and non-motorized vehicle users, has become a key research focus in both academia and industry.
Unsignalized intersections present a significant challenge to traffic safety due to the absence of regulatory control devices such as traffic signals and stop signs. This lack of control requires road users to rely heavily on their judgment to navigate these intersections safely. Consequently, these intersections have a higher risk of accidents compared to signalized intersections [5]. According to the Federal Highway Administration (FHWA), intersection-related crashes account for approximately 50% of all traffic accidents, with unsignalized intersections being a critical contributor [6]. These accidents often result in severe injuries and fatalities, emphasizing the need for improved safety measures.
Human factors are a major cause of accidents at unsignalized intersections. Driver behavior, including a failure to yield, distracted driving, and speeding, significantly increases the risk of accidents [7]. Similarly, pedestrians and cyclists may also exhibit unpredictable behavior, further complicating the safety dynamics of these intersections [8]. Studies have shown that driver misjudgment of gaps and speeds is a common cause of accidents at unsignalized intersections [9].
Environmental and infrastructural factors also play a crucial role in the safety of these intersections. Poor visibility due to inadequate lighting or obstructed sightlines, adverse weather conditions, and roadway design flaws contribute to the risk of accidents [10]. For instance, intersections located on curves or with multiple entry points pose additional challenges for road users [11].
Traditional safety measures at unsignalized intersections include road signs, pavement markings, and public awareness campaigns. However, these measures often fall short of preventing accidents due to their static nature and the reliance on road users’ compliance and attentiveness [12]. The advent of intelligent transportation systems (ITS), machine learning, and computer vision technologies offer new opportunities for enhancing traffic safety at these intersections [13]. Systems that can monitor traffic in real time, detect potential collision risks, and provide timely warnings to road users are emerging as promising solutions. Trajectory prediction models can provide a real-time assessment of potential traffic conflicts, issuing early warnings and enabling timely interventions to prevent accidents. In high-risk areas like unsignalized intersections, predicting conflicts between vehicles and pedestrians not only helps prevent accidents but also provides technical support for future intelligent transportation systems and autonomous driving technologies. Therefore, there is an urgent need to develop conflict trajectory prediction models that adapt to the characteristics of unsignalized intersections in order to address the complex and dynamic traffic environments at these locations. Although trajectory prediction has made significant progress in fields like traffic flow and autonomous driving, there is still a notable gap in research on vehicle–pedestrian conflict trajectory prediction at unsignalized intersections, which are complex traffic environments. At unsignalized intersections, due to the lack of signal control, road users (such as pedestrians, non-motorized vehicles, and motor vehicles) must rely heavily on their own judgment, leading to poorer traffic flow and safety. Currently, research on trajectory prediction for conflicts at unsignalized intersections is limited, especially concerning the interaction and prediction of conflicts between vehicles and pedestrians. Existing trajectory prediction models typically focus on predicting the trajectory of individual road users (e.g., vehicles or pedestrians alone), but there is insufficient research on the complex interactions and potential conflicts between vehicles and pedestrians or vehicles and non-motorized vehicles [14].
Furthermore, existing studies do not fully consider the impact of dynamic traffic environments on prediction accuracy. Factors such as traffic participants’ decision-making behaviors (e.g., whether a pedestrian decides to cross the road or whether a vehicle slows down or changes lanes) significantly influence the collision risk. In addition, most current models rely on historical trajectory data without sufficiently addressing the effect of environmental factors (such as lighting conditions, weather, and road obstructions) on behavior prediction.

1.2. Problem Statement

Despite advancements in traffic management technologies, the inherent risk at unsignalized intersections persists due to the absence of control mechanisms. Traditional methods, such as static signs and road markings, are often inadequate as they depend heavily on the compliance and alertness of road users [15]. Existing traffic management systems primarily focus on signalized intersections, where traffic signals help regulate the flow and reduce the likelihood of collisions. However, these systems are not directly applicable to unsignalized intersections, where the absence of signals requires a different approach [16].
The dynamic nature of traffic flow at unsignalized intersections requires real-time monitoring and proactive intervention to effectively mitigate collision risks. This involves accurately detecting and tracking the movements of various road users and predicting their trajectories to identify potential conflicts [17]. Advanced object detection and tracking technologies, such as YOLOv8 [18] and Deep SORT (Simple Online and Real-time Tracking) [19], provide the necessary tools to monitor traffic in real time. These technologies can identify and track multiple road users simultaneously, offering a comprehensive view of the traffic dynamics at unsignalized intersections.
Deep learning-based trajectory prediction models can analyze the historical movement patterns of road users to forecast their future positions. By predicting potential collision points, these models enable the system to issue timely warnings and prevent accidents [20]. The integration of these technologies into a cohesive system designed for unsignalized intersections represents a significant advancement in traffic safety.
  • The primary objectives of this research are:
  • To develop a real-time collision warning system for unsignalized intersections using YOLOv8 and Deep SORT for object detection and tracking.
  • To implement deep learning models for accurate trajectory prediction of road users.
  • To evaluate the effectiveness of the proposed system in various traffic scenarios and assess its potential for reducing accident risks.

1.3. Organization of the Paper

This research aims to develop a predictive collision warning system for unsignalized intersections that integrates advanced object detection, tracking, and trajectory prediction technologies. Specifically, the system will utilize YOLOv8 for high-precision object detection and Deep SORT for the robust tracking of pedestrians and non-motorized vehicles and then predict their trajectories by using deep Bi-LSTM networks [21]. With the use of predicted trajectories, this system infers collision risk areas statistically. Further, the severity of the levels is categorized as danger, warning, and relatively safe.
The remainder of this paper consists of three chapters as follows:
(1) Materials and Methods: Descriptions of a predictive collision risk area estimation system based on Bi-LSTM networks and the statistical inference method.
(2) Experiments and Results: Validating the feasibility and applicability of the proposed system and a discussion of the results and limitations.
(3) Conclusions: A summary of our study and future research directions.

2. Literature Review

2.1. Traffic Accident Prevention Systems

Recent advancements in intelligent transportation systems (ITS) have introduced dynamic and proactive measures to enhance traffic safety. ITS applications, such as adaptive traffic control systems, vehicle-to-infrastructure (V2I) communication, and automated enforcement technologies, have shown promise in reducing accidents and improving traffic flow [22]. Adaptive signal control technologies, for example, can significantly reduce delays and improve safety at intersections by adjusting signal timings based on real-time traffic conditions [23].
Collision avoidance systems, utilizing sensors and communication technologies, are increasingly integrated into modern vehicles. Systems such as the forward collision warning (FCW) and automatic emergency braking (AEB) have been shown to reduce rear-end collisions and other types of accidents [24,25]. Integrating these systems into broader traffic management infrastructures remains a vital area of ongoing research and development [26].

2.2. Object Detection and Tracking Technologies

Object detection and tracking are crucial for modern traffic safety systems. The evolution of computer vision technologies has enabled the accurate and efficient detection and tracking of objects [27]. Fusion techniques for different scenes and images have significantly enhanced the accuracy and efficiency of visual object detection technology. By combining multiple sources of information or integrating various imaging techniques, these methods enable the model to better understand complex environments, leading to more precise detections under diverse conditions. The fusion of data from different perspectives, such as from multiple cameras or sensor modalities, helps address challenges like occlusion, varying lighting, and different object scales, ultimately improving the robustness and performance of object detection systems [28]. YOLO (You Only Look Once) and its variants, like YOLOv8, are noted for their high-speed and high-accuracy object detection capabilities [29,30,31].
YOLOv8 uses deep convolutional neural networks to detect objects in real time, making it particularly suitable for traffic monitoring applications where real-time performance is crucial [32]. Deep SORT combines deep learning for appearance feature extraction with a traditional Kalman filter and Hungarian algorithm for data association, providing robust tracking of detected objects [33].
The combination of YOLOv8 and Deep SORT has been explored in various studies, demonstrating their effectiveness in tracking multiple objects simultaneously in dynamic environments [34,35]. This combination is particularly useful in traffic scenarios where accurate detection and the continuous tracking of vehicles and pedestrians are essential for collision prevention. Many studies have proposed signal denoising and fault detection methods based on wavelet packets and machine learning algorithms to improve data quality and decision support accuracy in intelligent transportation systems and industrial processes [36]. In this paper, the tracking algorithm employs the Deep SORT approach, utilizing the linear Kalman filter for state estimation and prediction in dynamic environments. The advantage of this method lies in its ability to effectively handle uncertainty and noise in both object motion and sensor measurements, allowing for reliable and accurate object tracking even in challenging conditions such as occlusions and fast-moving targets. The Kalman filter’s prediction and update steps enable robust tracking by continuously refining state estimates, making it highly efficient for real-time applications.

2.3. Trajectory Prediction Methods

Trajectory prediction is essential for proactive traffic safety systems, allowing for the forecasting of future positions of road users based on historical movement patterns. Existing trajectory prediction methods, including physics-based models, machine learning techniques (e.g., regression, decision trees, neural networks), and deep learning approaches (e.g., RNNs, LSTMs, GANs), each have their advantages and limitations. Physics-based models are simple and computationally efficient but lack the ability to model complex interactions in dynamic environments. Data-driven methods, particularly machine learning and deep learning models, excel at capturing complex patterns but require large datasets and significant computational resources and may struggle with generalizing to unseen environments [37,38]. Recurrent neural networks (RNNs) and long short-term memory (LSTM) networks are effective at modeling temporal dependencies but are sensitive to noise and require substantial training data.
LSTM-based models, for instance, outperform traditional methods in predicting pedestrian trajectories by capturing the temporal dependencies in their movements more effectively [39,40]. Similarly, Transformers, with their attention mechanisms, demonstrate superior performance in capturing long-range dependencies and complex motion patterns [41,42]. Applying these deep learning models to traffic safety systems is a rapidly growing area of research, highlighting their potential to enhance collision prediction and prevention [43,44,45].
Generative models like GANs can handle uncertainty by predicting multiple trajectories, but their computational costs and complexity are high [46]. Reinforcement learning (RL) offers potential for dynamic environments but faces challenges in stability and real-time application [47]. Hybrid models, combining the strengths of different approaches, offer promising solutions but are complex to implement [48]. For unsignalized intersections, where traffic behavior is highly dynamic and unpredictable, a hybrid approach that integrates data-driven techniques with physics-based models or reinforcement learning could provide more accurate and efficient predictions, balancing accuracy, computational efficiency, and real-time applicability.

3. Methodology

The proposed predictive collision warning system integrates cutting-edge object detection, tracking, and trajectory prediction technologies specifically designed for deployment at unsignalized intersections. The system architecture is designed to operate in real time, processing data from multiple sensors to monitor and predict potential collision risks among various road users, as shown in Figure 2.

3.1. System Architecture

The system comprises several key components:
(1) Data sources: High-definition cameras and edge computing units installed at strategic locations around the intersection.
(2) Preprocessing: (1) Object detection—utilizing YOLOv8 for detecting vehicles, pedestrians, and cyclists; (2) object tracking—implementing Deep SORT to track detected objects over time; and (3) trajectory prediction—using a Bi-LSTM model for predicting future positions of tracked objects.
(3) Risk estimation: Evaluating the likelihood of collisions based on predicted trajectories.
(4) Dangers warning: Through variable message signs (VMS) and audio-visual warning devices installed on the roadside, warnings are issued to vehicles on the main road and to pedestrians and non-motorized vehicles on the side roads.

3.2. Object Detection

YOLOv8 is employed for real-time object detection due to its high accuracy and speed. YOLOv8 is particularly suited for real-time applications, such as traffic monitoring at unsignalized intersections.
This paper proposes a small-target vehicle detection model for road traffic (RGGE-YOLOv8) based on YOLOv8, incorporating large kernels and multi-scale gradient composition. The network structure is shown in Figure 3.
In the Backbone module, the RepLayer module replaces the original C2f module, introducing large-kernel depthwise separable convolution to capture contextual information more effectively.
To address issues such as missed or incorrect detections caused by overlapping and occlusions during vehicle operations, the GIoU loss function is introduced. By integrating the minimum enclosing box information into the loss calculation, the model can accurately evaluate and correct the deviation between the predicted bounding box and the ground truth, thereby improving detection performance.
Additionally, the GAM (Global Attention Mechanism) is added to the neck network to enhance learning of both location and semantic information for key features.
Finally, the ReContext gradient composition feature pyramid is introduced, replacing the original FPN with CSPNet. Furthermore, the traditional 3 × 3 convolutional feature fusion in CSPNet is replaced by Res-CSP, which not only retains the advantages of CSPNet’s partial connection structure but also enables more efficient and flexible feature fusion, enhancing the model’s ability to detect multi-scale objects in complex scenarios.

3.3. Object Tracking

Deep SORT is used for tracking detected objects across frames. Deep SORT enhances the original SORT algorithm by incorporating appearance information through a deep learning-based feature extractor.
Multi-target tracking enables the continuous and dynamic tracking of the movement of vehicles, non-motorized vehicles, and pedestrians within a scene, allowing for a more accurate capture and analysis of their trajectory behavior. The Deep SORT algorithm is widely used for multi-target tracking, and its workflow is shown in Figure 4 and Figure 5.
The process begins with YOLOv8 detecting target locations. A Kalman filter then predicts the object’s position in the next frame. The predicted position is compared with the actual detected position, and their similarity is calculated based on Intersection over Union (IoU). Finally, the Hungarian matching algorithm assigns corresponding IDs between consecutive frames, enabling the consistent tracking of target types and behaviors.
As Deep SORT compares the features of objects across frames and incorporates cascade matching and new trajectory confirmation, it enhances tracking accuracy. As illustrated in Figure 5, after the detection network extracts each object’s unique features, the algorithm strengthens these features through processes like prediction, observation, and update. This ensures that the object’s ID remains consistent throughout tracking, allowing for more precise detection and analysis of its movement behavior.
In the Deep SORT algorithm, the Kalman filter is a crucial tool for estimating the state of each tracked object. It predicts the object’s future position and updates this prediction using new measurements. The linear Kalman filter used in Deep SORT is ideal for dynamic tracking applications, where object motion can be effectively modeled with linear equations. The performance of the Kalman filter depends on the proper tuning of two key parameters: the process noise covariance Q and the measurement noise covariance R . In this implementation, Q and R are dynamically adjusted based on certain weight coefficients reflecting the uncertainties in position and velocity, which are applied during the prediction and update steps. This dynamic adjustment allows the filter to adapt to varying conditions and ensures more accurate tracking results in real-time applications.
Prediction Phase:
In the prediction phase, the Kalman filter predicts the future state based on the previous state estimate and the motion model. The predicted state x ˆ k is calculated as:
x ˆ k = A x ˆ k 1 ,
where x ˆ k is the predicted state at time k , x ˆ k 1 is the state estimate at time k 1 , and A is the state transition matrix. This matrix A defines how the previous state evolves into the predicted state based on the motion model.
The predicted error covariance P k is updated as follows:
P k = A P k 1 A T + Q ,
where P k 1 is the error covariance from the previous step, and Q is the process noise covariance matrix. In this implementation, Q is dynamically adjusted based on the uncertainties in the predicted position and velocity. The adjustment is based on the standard deviation weights for position and velocity, which are calculated using the target’s size (bounding box height). The weight coefficients, such as std-weight-position and std-weight-velocity, control how much uncertainty is assigned to the predicted position and velocity.
For instance, when the target’s size or motion becomes unpredictable (such as fast movement or significant changes in direction), the system increases the value of Q to account for higher uncertainty in the motion model. Conversely, if the target is moving smoothly or predictably, Q can be reduced.
Update Phase:
In the update phase, the Kalman filter corrects the predicted state using new measurements. The Kalman gain K k is computed to determine how much to adjust the predictions based on the new measurement:
K k = P k C T C P k C T + R   ,
where C is the observation matrix, and R is the measurement noise covariance matrix. In this implementation, R is also dynamically adjusted based on the uncertainties in the measurements. Specifically, the uncertainty in the position measurements (which depends on the target’s height) influences R .
When measurements are noisy or unreliable, R increases, causing the Kalman filter to rely more on the model’s predictions. Conversely, if the measurements are of high quality, R is reduced, allowing the filter to place more trust in the measurements.
The updated state estimate is calculated as follows:
x ˆ k = x ˆ k + K k ( y k C x ˆ k )   ,
where y k is the new measurement at time k , and C x ˆ k is the predicted measurement based on the predicted state. This step adjusts the predicted state by incorporating the new measurement, and the Kalman gain K k determines how much weight to give to the prediction versus the measurement.
Finally, the error covariance P k is updated as follows:
P k = I K k C P k   ,
where I is the identity matrix. This update reduces the uncertainty in the state estimate by incorporating the new measurement and the Kalman gain.

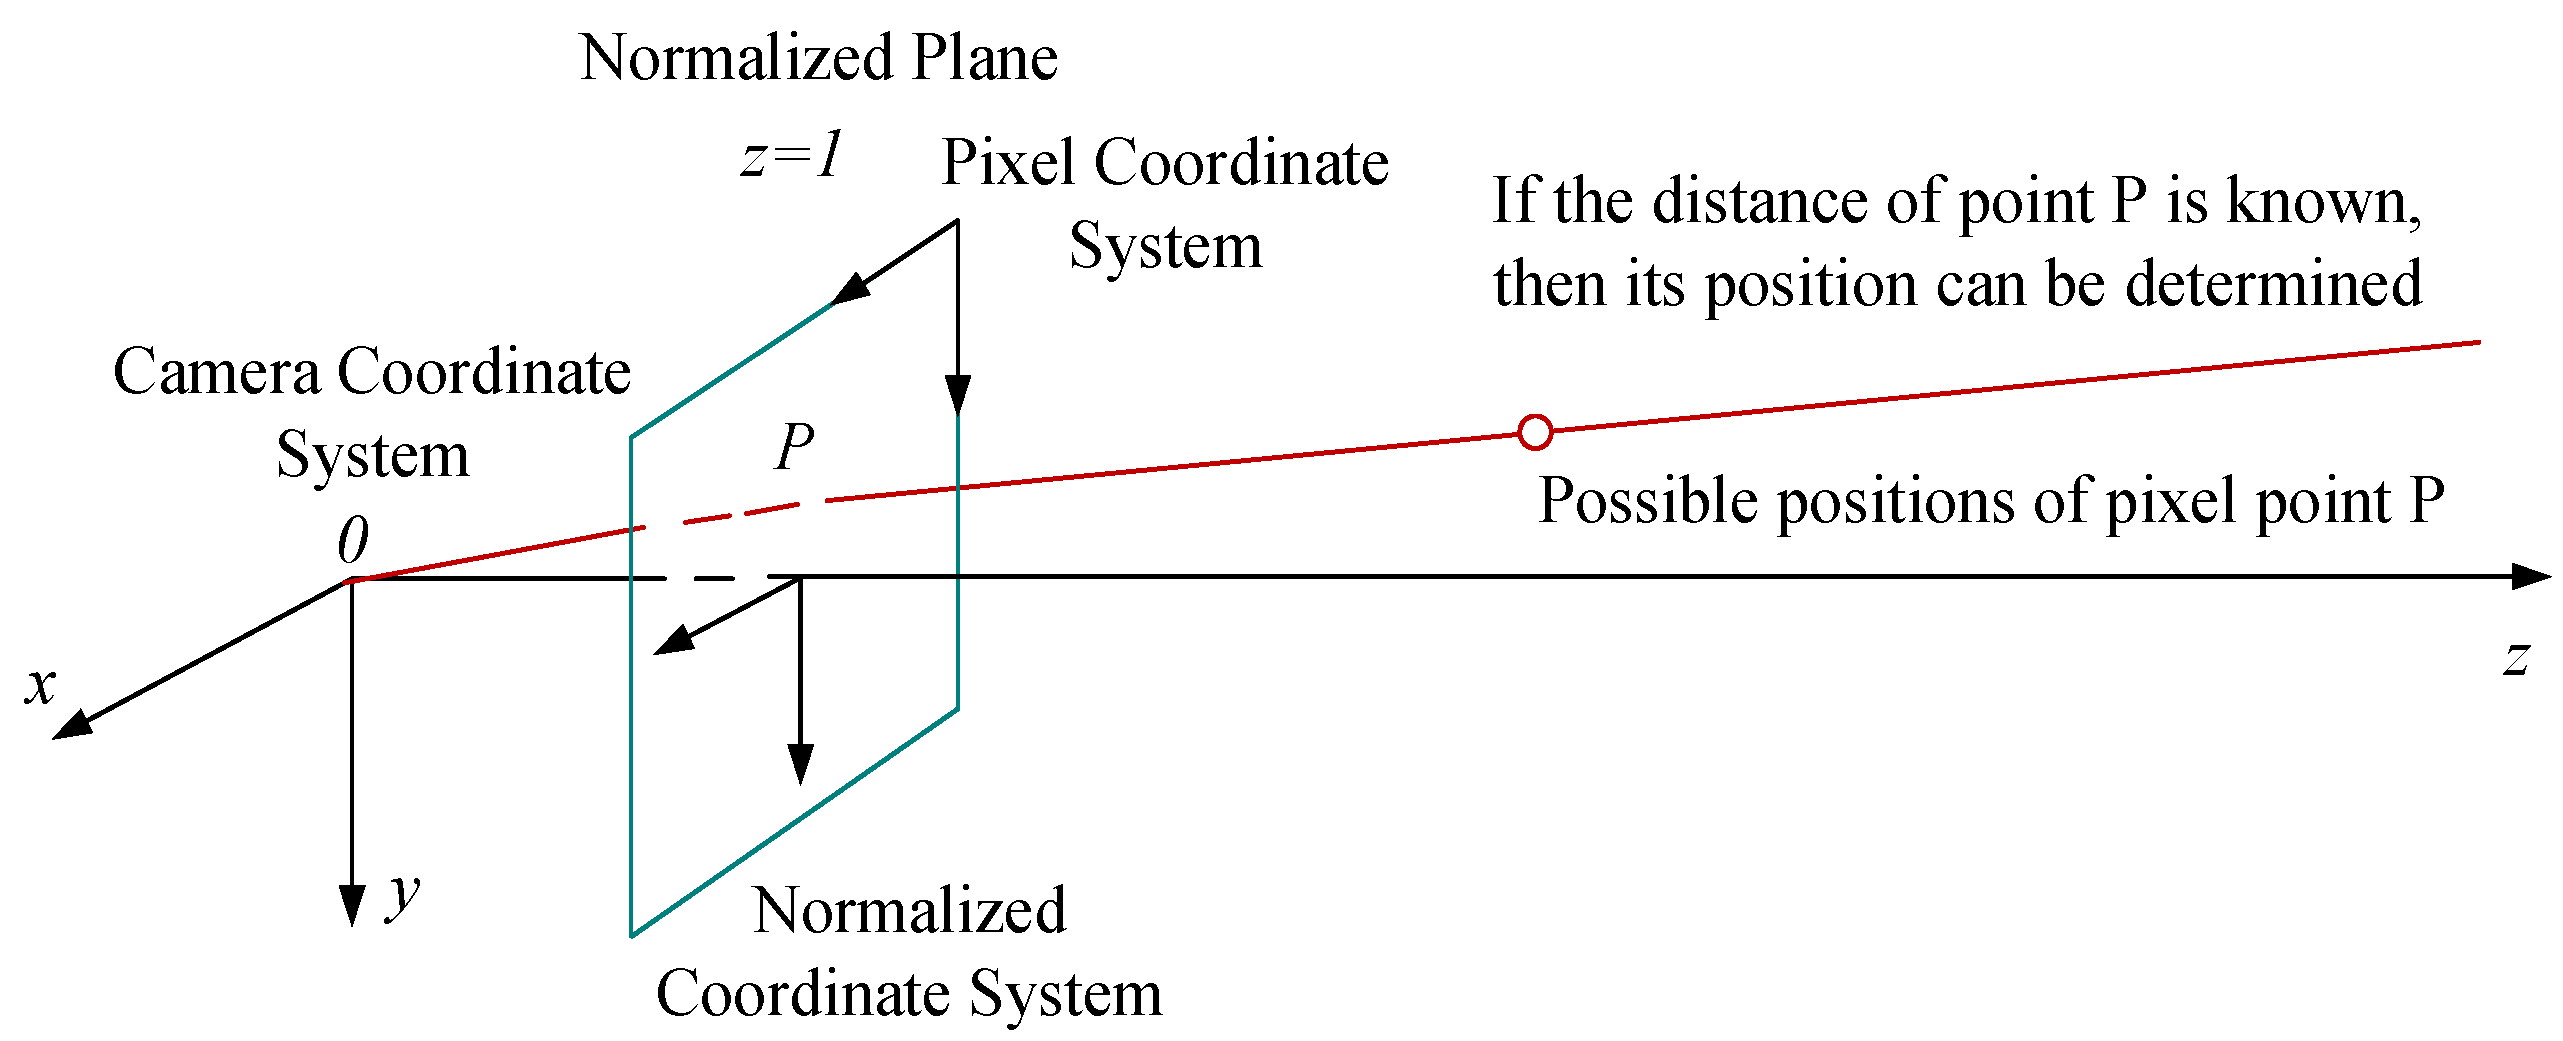
3.4. Vehicle Speed Measurement Model

3.4.1. Model Assumptions

To establish a reliable vehicle speed detection model, this study proposes the following foundational assumptions based on the following highway monitoring scenario characteristics [49]: (1) Road Plane Mapping Property: Through camera calibration technology, all target positions in the monitoring images can be mapped to the Z w   = 0 plane of the world coordinate system (as shown in Figure 6). This assumption relies on the high flatness and absence of significant undulations characteristic of highway road surfaces. (2) Vehicle Motion Continuity: Within the time interval between consecutive video frames, vehicle trajectories can be approximated as linear changes. This assumption not only applies to straight-moving vehicles but is also compatible with curved driving scenarios through piecewise linearization processing. (3) Temporal Consistency Constraint: The time interval between adjacent frames in the video stream remains constant, ensuring a unified time reference for speed calculations.

3.4.2. Model Design and Implementation

Based on the aforementioned assumptions, the vehicle speed detection model is constructed through the following workflow: First, the YOLO object detection algorithm is employed to extract vehicle bounding boxes. Geometric parameters of the detection boxes are calculated to obtain the bottom-edge center coordinates as the vehicle position reference point (providing closer proximity to the actual ground contact point compared to traditional vertex coordinates). For each target vehicle in every video frame, a displacement vector relationship between adjacent frames is established (as shown in Equation (6)).
d i = u i t u i t t   ,
Here, u i t represents the bottom-edge center coordinates of the vehicle detection box in the current frame; u i t t denotes the corresponding coordinates in the previous frame; Δ t is the fixed frame interval; and i indicates the trajectory tracking point sequence. To convert pixel displacement d i into actual speed values, a coordinate mapping model is required to transform the image pixel coordinate system into the world coordinate system. Traditional methods rely on camera parameter calibration (e.g., focal length, installation height, intrinsic matrix), but such calibration processes are operationally complex and environmentally sensitive. This study reduces the calibration error impacts on speed calculation by optimizing the position reference of the bottom-edge center point of the detection boxes while simplifying the coordinate mapping process based on highway scenario characteristics. The model ultimately outputs instantaneous speed sequences between consecutive frames, providing data support for subsequent traffic state analysis.

3.4.3. Vehicle Speed Measurement

Through coordinate transformation, the pixel coordinates u i t and u i t t are projected onto the world coordinate system to derive the physical displacement vector S i , as formalized in Equation (7). The Euclidean norm S i , measured in meters, quantifies the actual distance traveled by the target vehicle between consecutive frames. Vehicle speed v i is then computed using the relationship:
S i = φ a , b , c · u i t φ a , b , c · u i t t   ,
v i = S i t = φ a , b , c · u i t φ a , b , c · u i t t t   ,
where t denotes the fixed time interval between frames (in seconds), determined as the reciprocal of the video frame rate. For instance, in highway surveillance systems operating at 25 frames per second (fps), t equals 1/25 s. This framework leverages the prior camera calibration results to bypass complex real-time geometric computations, ensuring efficient and robust speed estimations while maintaining compatibility with the assumptions outlined in Section 3.4.1.
For a vehicle trajectory spanning m consecutive frames, instantaneous speeds v 1 , v 2 , , v m 1 between adjacent frames are derived from sequential displacement vectors. As formalized in Equations (9)–(11).
v 1 = S 1 t = φ a , b , c · u 2 t φ a , b , c · u 1 t t  
v 2 = S 2 t = φ a , b , c · u 3 t φ a , b , c · u 2 t t  
v m 1 = S m 1 t = φ a , b , c · u m t φ a , b , c · u m 1 t t  
Therefore, the target vehicle’s average speed v ¯ across the m-frame sequence is then computed through temporal aggregation, as follows:
v ¯ = i = 1 m 1 v i m 1  
This multi-frame averaging strategy mitigates instantaneous measurement noise and transient tracking errors, enhancing speed detection robustness. The framework aligns with the motion continuity assumption by treating piecewise linear displacements as approximations of continuous trajectories.

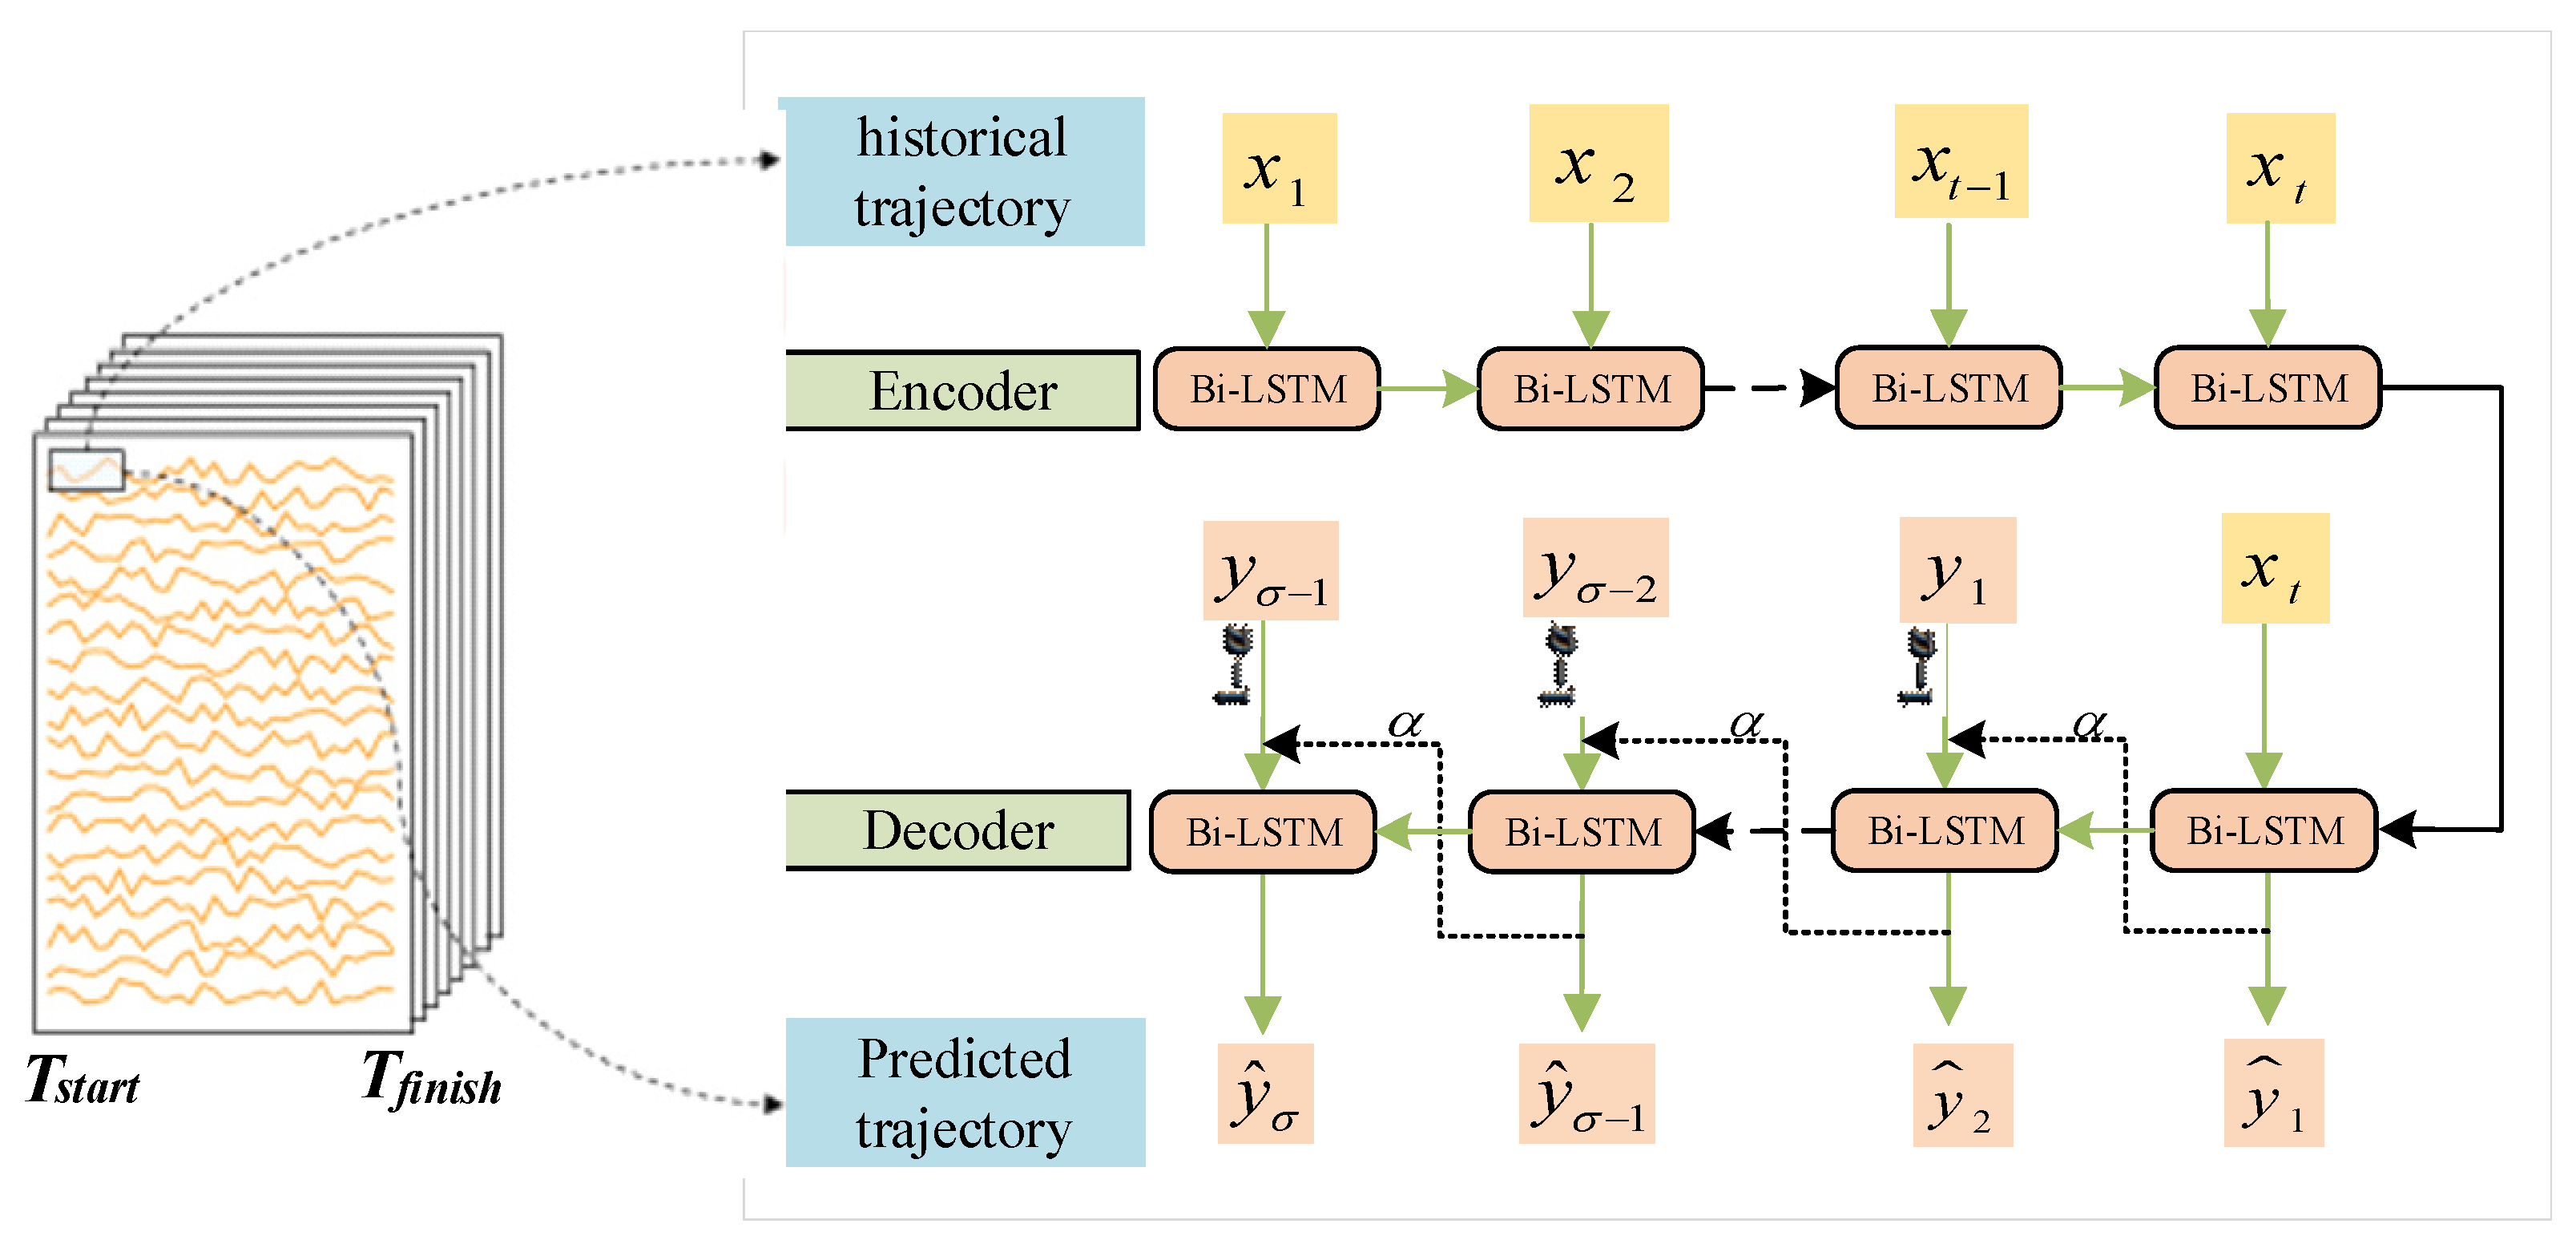
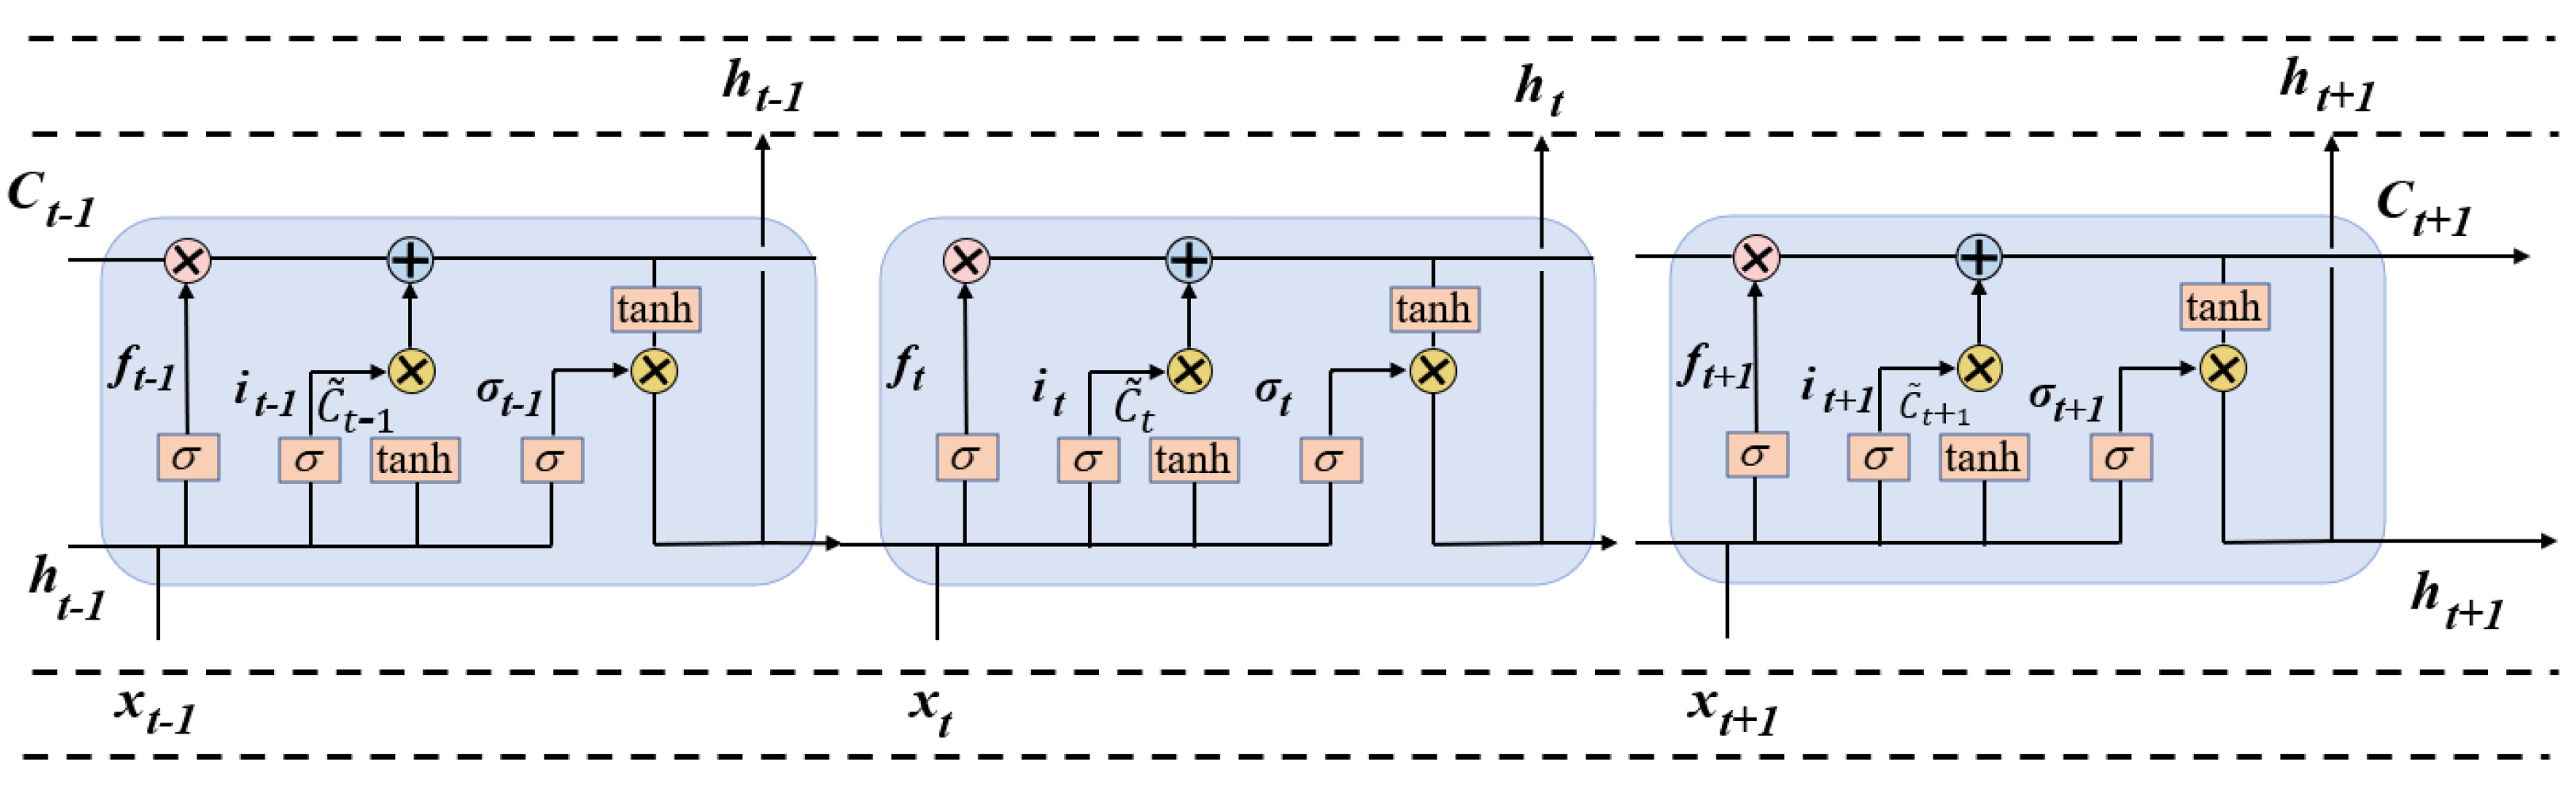
3.5. Trajectory Prediction

For trajectory prediction, we employ a Bi-LSTM model, which is highly effective in capturing long-range dependencies and complex movement patterns of road users, as shown in Figure 7. LSTM, known for its attention mechanisms, provides a robust solution for modeling the temporal and spatial dynamics of object trajectories.
Currently, recurrent neural networks (RNNs) and long short-term memory (LSTM) modules are commonly used to capture the memory retention and partial forgetting characteristics of the vehicle position information during operation [50]. These models are designed to predict trajectories by unfolding along the time dimension. Through the internal state memory of the network, short-term prediction results from previous time steps are stored and fed into the current prediction module. This ensures that each output (i.e., risk level) in the network is a function of the previous state, improving both the continuity and efficiency of predictions.
LSTM employs a gated output mechanism with three gates (input gate, forget gate, and output gate) and two states (cell state and hidden state). The core of the LSTM is the cell state, which functions as the network’s memory, propagating information through the sequence. This is represented by the direct path from ( C t 1 ) to ( C t ), enabling the model to carry essential information over long time steps, as shown in Figure 8.
The memory cell (as shown in Figure 9) receives two inputs: the previous output value h t 1 and the current input value x t . These two parameters first pass through the forget gate, where the information to be discarded, f t (i.e., low-weight information), is determined. Next, the inputs are processed through the input gate, which determines the information to be updated, i t (i.e., high-weight information compared to the previous cell). At this stage, the current cell state C ~ t (a candidate vector, serving as an intermediate variable to store the information of the current cell state) is also generated. The outputs of the forget gate and the input gate (i.e., f t ,   i t ,   C ~ t ) are then combined. Specifically, the previous cell state C t 1 is multiplied by the activation value f t (the information to be forgotten), while the current cell state C ~ t is multiplied by the activation value i t (the information to be remembered). These two components are added together to produce the long-term state   C t and short-term state h t , which are stored and serve as inputs for the next neuron. The detailed calculation process is as follows:
(1)
Forget Gate
f t = σ ( w f · h t 1 , x t + b f )   ,
(2)
Input Gate
i i = σ ( w i · h t 1 , x t + b i )   ,
C ~ t = t a n h   ( W C · h t 1 , x t + b c )   ,
The equation for the cell state at time t (long-term state) is:
C t = f t · C t 1 + i t · C ~ t   ,
(3)
Output Gate
o t = σ ( W o · h t 1 , x t + b o ) ,
h t = σ t · t a n h   ( C t ) ,
where σ is the activation function of the gate, and t a n h is the activation function for the candidate cell state C ~ t   and hidden state h t .
In a unidirectional LSTM, the predicted output at the next time step is influenced only by the inputs from previous time steps. However, during feature extraction, valuable information may be lost. In many cases, predictions are affected not only by past inputs but also by future ones. Incorporating both directions can lead to more accurate predictions. This study utilizes BI-LSTM (Bidirectional LSTM) to capture data features from both directions. Since future data also plays a role in prediction, a backward recurrent neural network (RNN) is introduced to complement the traditional forward RNN, which only processes historical data. By combining the forward and backward networks, both past and future data can be leveraged. The forward network computes the hidden vector h in the forward direction, while the backward network computes the hidden vector h in the reverse direction [19]. These two hidden vectors are then combined, as shown in Equation (19). Figure 3 illustrates an unfolded Bidirectional LSTM, and Figure 10 shows the BI-LSTM model structure.
- In the forward network layer, computations are performed sequentially from the beginning to the end, yielding the forward hidden state outputs for each time step.
- In the backward network layer, the sequence is processed in reverse, from the end to the beginning, producing the backward hidden state outputs at each time step.
- Finally, the outputs from both the forward and backward layers are combined to provide the comprehensive output for each time step. This dual-direction approach ensures that the model captures richer temporal dependencies, resulting in more accurate predictions.
y t = h + h   ,

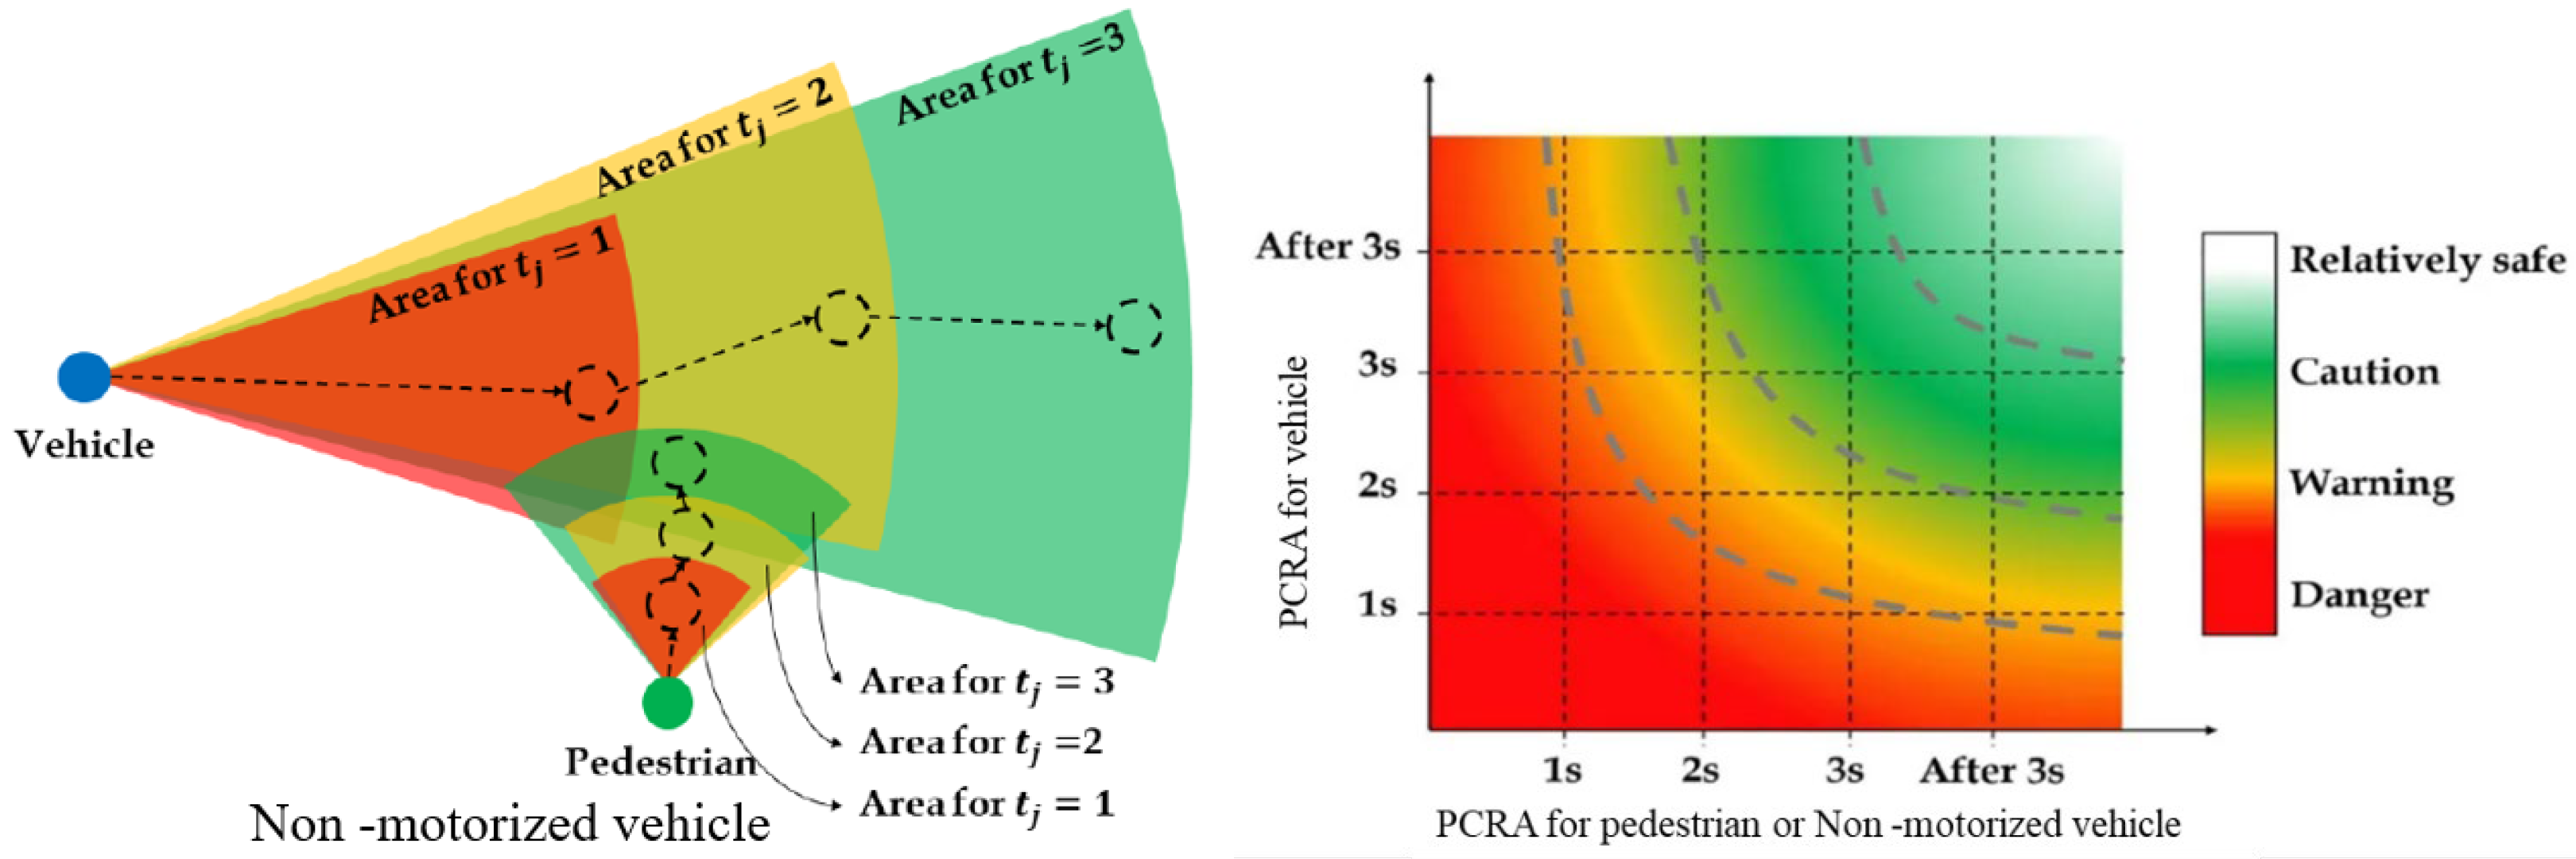
3.6. Collision Risk Estimation

Collision risk estimation involves evaluating the likelihood of a collision based on predicted trajectories. This is done by computing the intersection points of the predicted paths and determining the proximity and timing of these intersections. Based on the predicted trajectories, the predictive collision risk area (PCRA) [51] is estimated using confidence intervals for speed and angle. By combining these confidence intervals, the PCRA is represented as an area reflecting the predicted collision risk. In this experiment, the trajectories of objects were predicted for approximately 1, 2, and 3 s into the future. Therefore, multiple PCRAs were generated for 1, 2, and 3 s, as illustrated in Figure 11.
The PCRA levels are then defined to measure the severity of risk based on the degree of overlap between the PCRAs of vehicles and pedestrians, as follows:
(1) Danger: When the PCRAs of vehicles and pedestrians overlap 1 s into the future.
(2) Warning: When the PCRAs overlap 2 s into the future.
(3) Caution: When the PCRAs overlap 3 s into the future.
(4) Relatively Safe: When there is no overlap between the PCRAs.

4. Experimental Analysis

4.1. Experimental Setup and Model Training

The experiments were conducted on a Windows 10 64-bit system equipped with an NVIDIA GeForce RTX3080ti GPU (24 GB VRAM) and 64 GB RAM. The software stack included CUDA V11.2 and OpenCV 4.5.3 to support deep learning frameworks and image processing tasks.

4.1.1. Dataset Annotation

A custom dataset comprising 30,000 annotated images was developed, covering diverse traffic scenarios with variations in lighting, viewing angles, and occlusions. The annotation guidelines included:
(1) Bounding Box Criteria: Tightly fitted rectangular boxes around vehicle contours, excluding instances with a >50% occlusion, unidentifiable vehicle types, or objects smaller than 10 × 10 pixels.
(2) Augmentation Strategy: Synthetic data enrichment via geometric transformations (scaling, cropping, and rotation) and photometric adjustments (exposure and saturation) to enhance model robustness against environmental variability.

4.1.2. Dataset Training

During model training, the dataset was divided into an 80:20 ratio for training and testing. Data augmentation techniques were applied to enhance the model’s generalization ability, including Mosaic augmentation, random scaling, cropping, and arrangement. Additional augmentations included random rotation, random exposure, and saturation adjustment. The initial learning rate was set to 0.001 and adjusted to 0.0005 after 40,000 iterations to optimize model convergence. The training was conducted for a total of 50,000 iterations, with input image dimensions of 416 × 416 and a batch size of 8. Furthermore, to better adapt to traffic scene characteristics, additional augmentation methods such as Random_perspective, Mixup, HSV adjustments, Flipud, and Fliplr were employed to improve model accuracy and generalization performance.

4.2. Selection of Evaluation Metrics

Model performance was quantified using standard object detection metrics:
(1) Intersection over Union ( IoU ): Measures localization accuracy between the predicted and ground-truth bounding boxes. The calculation formula is shown as Equation (20).
IoU   =   Detection   Result     Ground   Truth     Detection   Result     Ground   Truth    
(2) Precision Recall Analysis (PR): In object detection, Precision and Recall are key evaluation metrics used to assess model performance. Precision measures the proportion of detected objects that are actual targets, while Recall represents the proportion of real targets successfully identified by the model. These metrics are calculated using the following formulas:
P r e c i s i o n = T P T P + F P  
R e c a l l = T P T P + F N  
where TP (True Positive) represents correctly detected targets, FP (False Positive) denotes incorrectly identified objects, and FN (False Negative) refers to missed targets.
(3) Average Precision ( A P ): To evaluate a model’s detection performance, a Precision–Recall (PR) curve is plotted based on computed Precision and Recall values. Average Precision ( A P ), a widely used performance metric, is derived by averaging Precision values across the PR curve. To enhance accuracy, the PR curve is smoothed, and the area under the curve (AUC) is calculated using integral methods to obtain the final A P score. The calculation formula is shown as Equation (23).
A P = 0 1 P s m o o t h ( r ) d r
(4) Mean Average Precision ( m A P ): Another critical performance metric in object detection is m A P (mean Average Precision). It is determined by calculating the A P (Average Precision) for each category and then computing the mean across all categories. This metric provides a comprehensive evaluation of the model’s detection accuracy across different object classes. The calculation formula is shown in Equation (24).
m A P = A P i n , i = 1 , 2 , , n

5. Results and Discussion

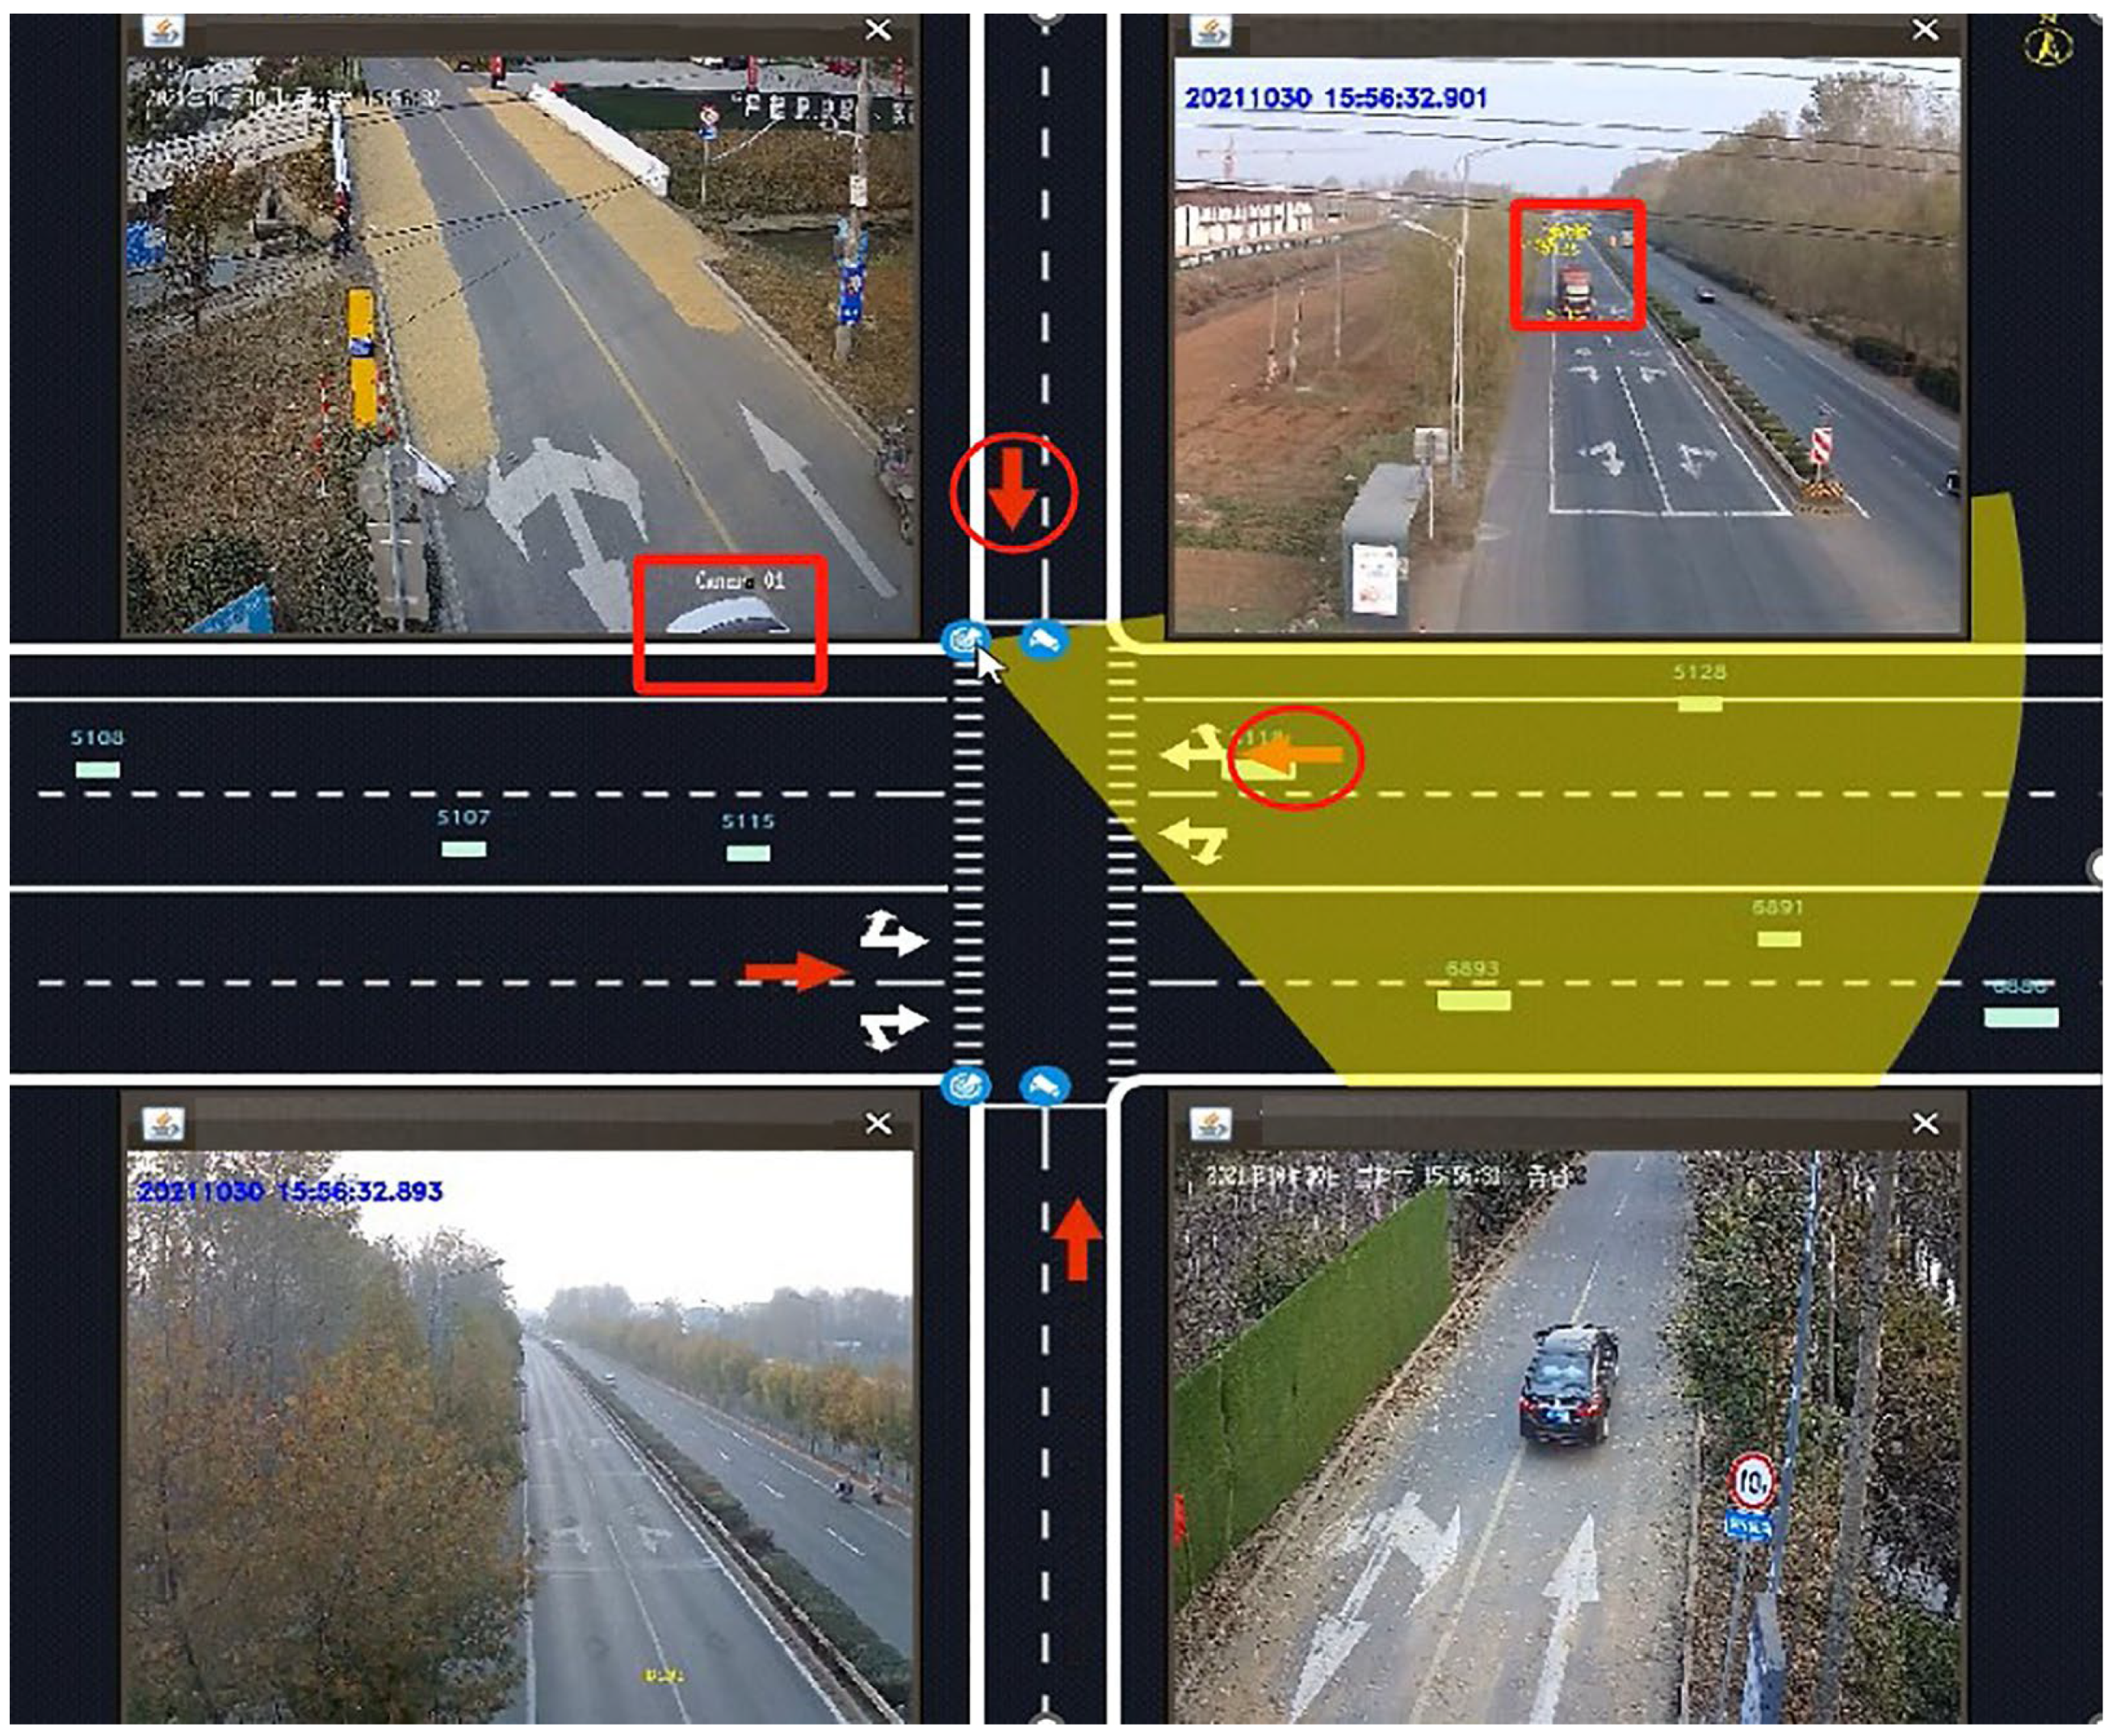
5.1. Detection and Tracking Performance

The algorithm proposed in this paper consists of several improved modules. To better assess the impact of each module on the model, ablation experiments were conducted on the same dataset. The results are shown in Table 1.
As shown in Table 1, although the processing efficiency has decreased due to model improvements, the p-value, R, mAP50, and mAP50-95 have increased by 12.1%, 6.1%, 4.2%, and 16.2%, respectively.

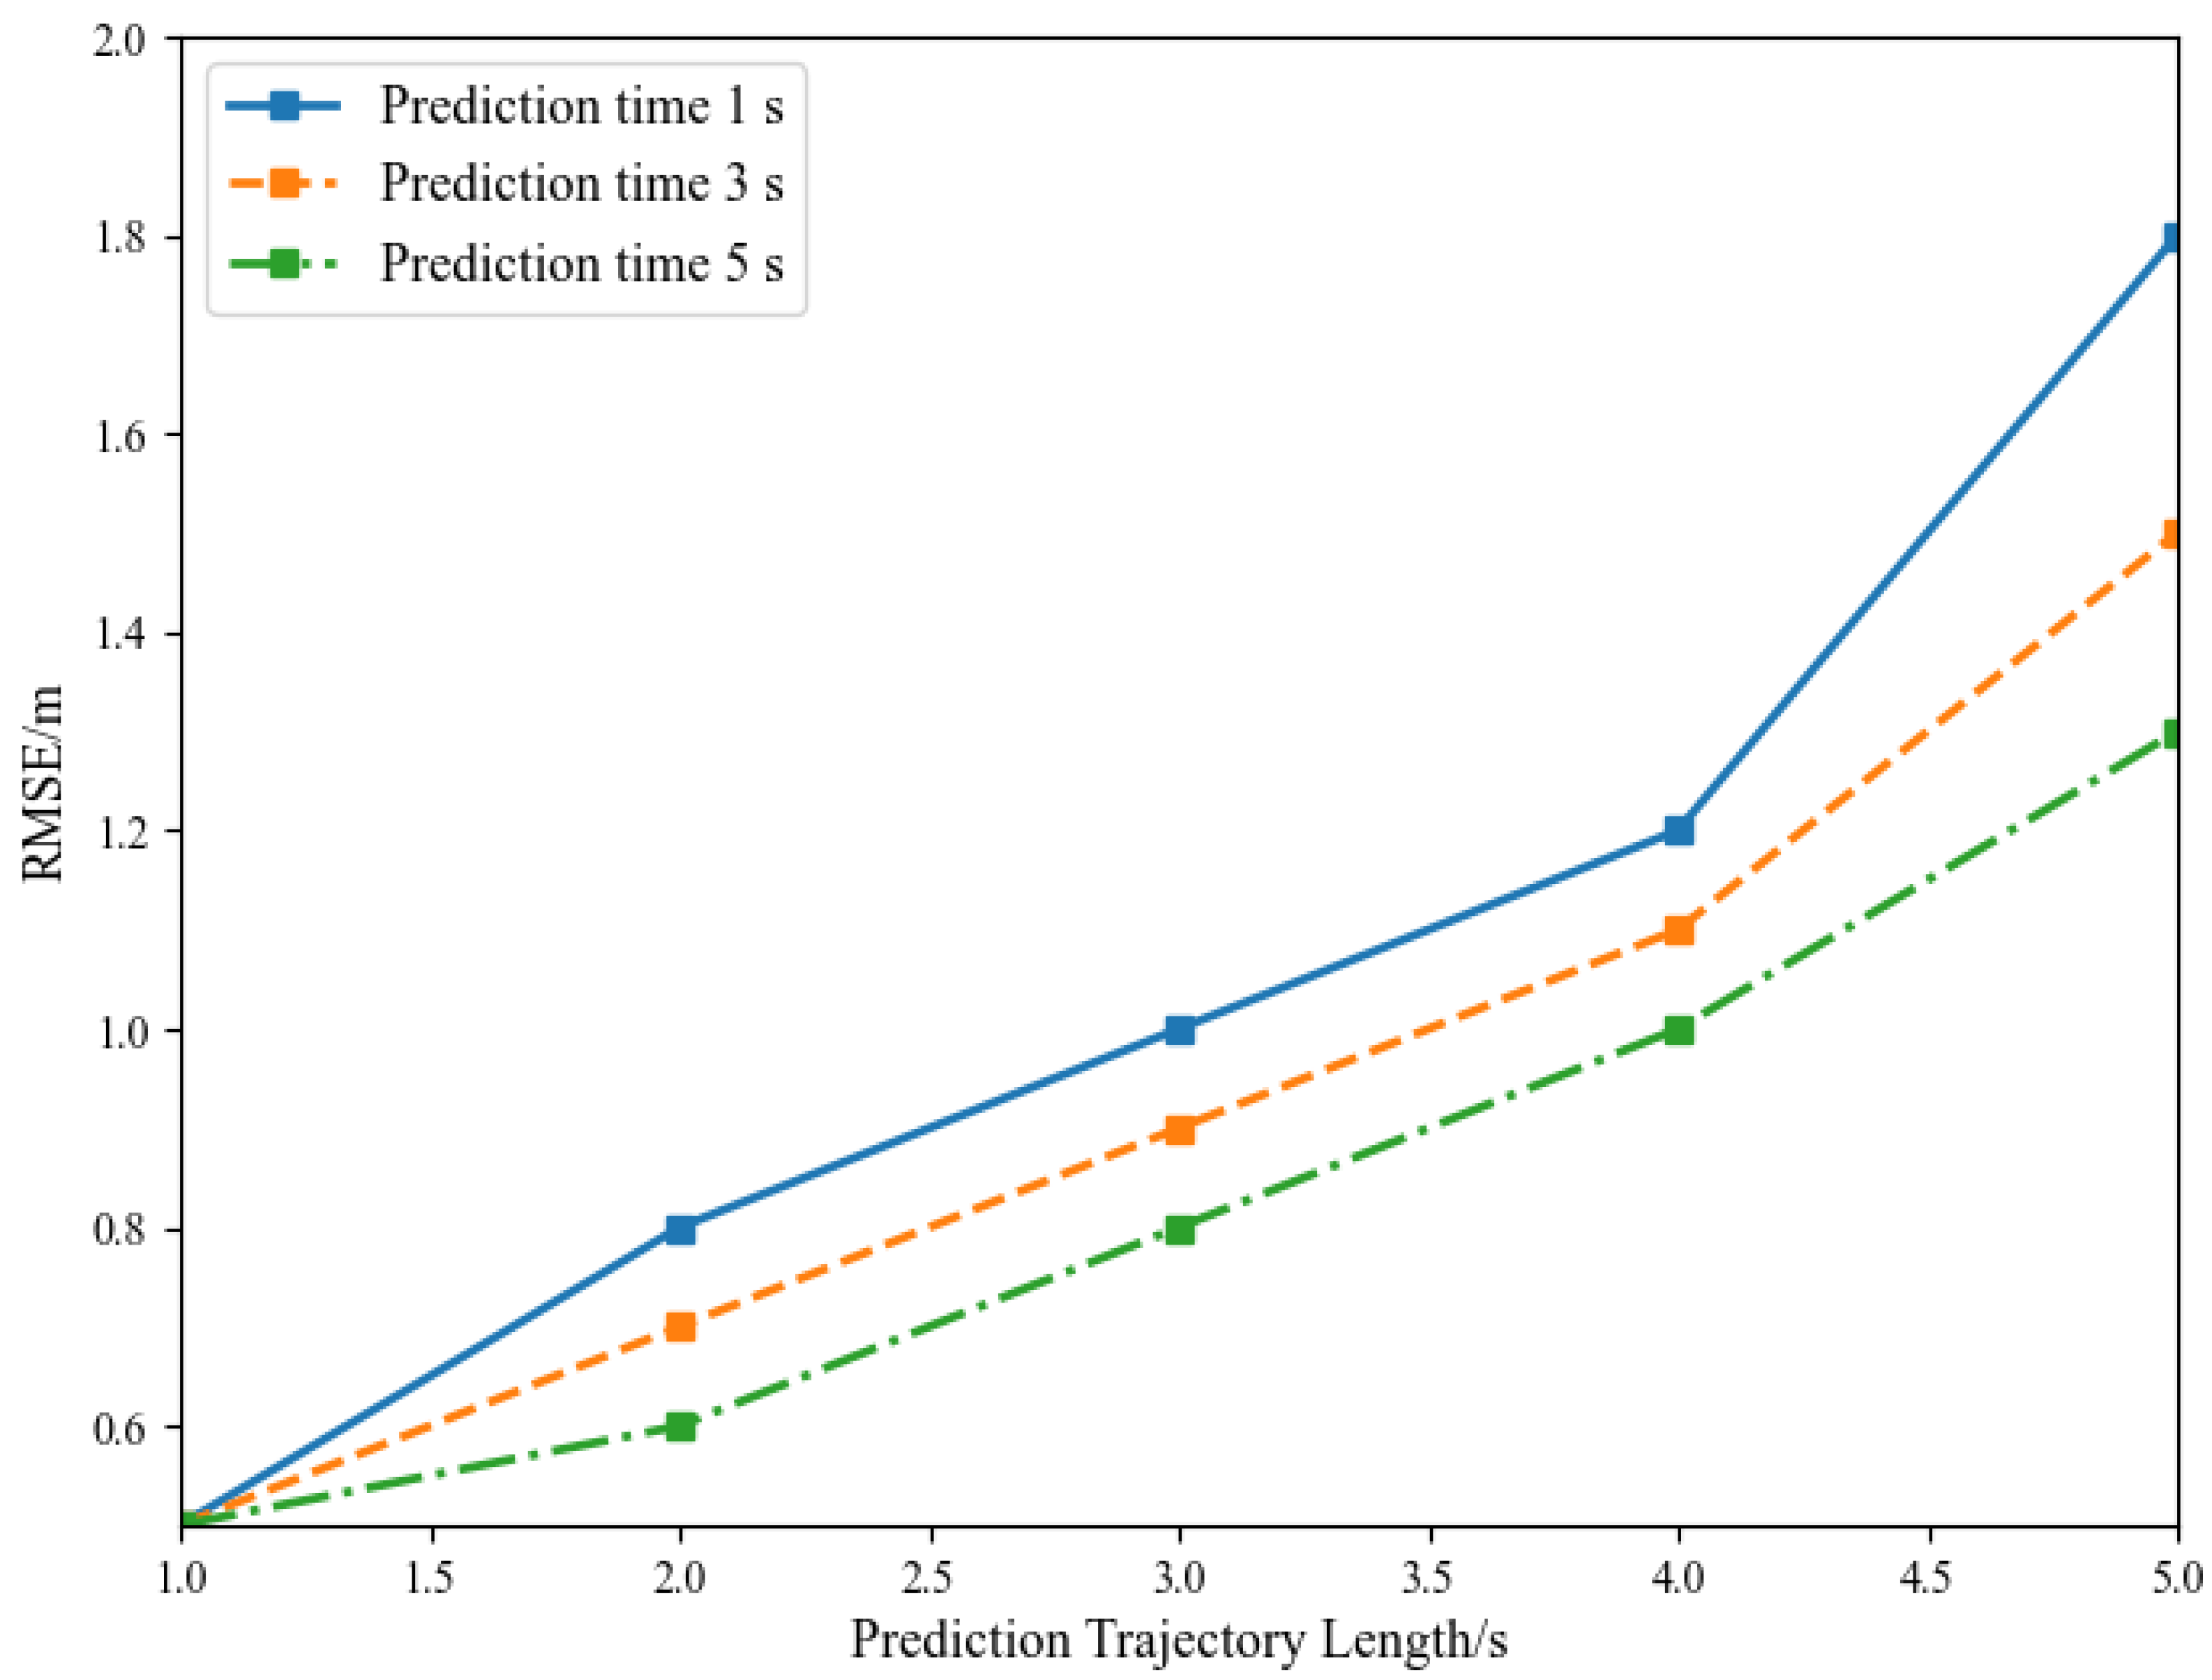
5.2. Trajectory Prediction Accuracy

To further validate the accuracy of the trajectory prediction algorithm proposed in this paper, the target trajectory detected by the radar-vision fusion device is used as ground truth. A specific target’s trajectory was selected for the precision comparison and analysis. Additionally, the prediction performance for the trajectories of vehicles, pedestrians, and non-motorized vehicles was compared with the CNN-LSTM and LSTM models. The comparative results for the X- and Y-axis trajectories are shown in Figure 12.
From Figure 12, it can be observed that the predicted trajectories of the target by the three models maintain the same trend as the actual trajectories. However, the model constructed in this paper achieves higher accuracy in single-step predictions of the target trajectory and demonstrates excellent performance as the prediction horizon increases. As shown in the subplots of Figure 12, when the target performs maneuvers (with significant variations in X and Y), the model maintains a smaller prediction error and outperforms both the LSTM and CNN-LSTM models. This highlights the ability of the bidirectional self-attention mechanism to extract features at different time steps, thereby improving prediction performance.
Further analysis is conducted on trajectory prediction for different time horizons. Figure 13 illustrates that the longer the prediction horizon, the lower the prediction accuracy. This is because driving behavior is inherently unpredictable, and as the prediction time increases, the error also grows. Moreover, in sequence prediction tasks, neural networks tend to accumulate errors over time, leading to larger deviations between the predicted trajectory points further in the sequence and the vehicle’s actual trajectory.

5.3. System Performance

To further validate the effectiveness of the early warning system, a proactive safety warning system for unsignalized intersections was developed as part of the Science and Technology Safety Demonstration Project on the G310 highway in the Donghai section of Lianyungang, as shown in Figure 14. This system integrates video surveillance, real-time data analysis, and digital twin technology to automatically detect incidents such as traffic accidents, vehicle anomalies, and congestion. It immediately triggers alerts on the interface and uploads the results to the management platform in real time. The front-end warning system predicts risks based on the movement of vehicles, pedestrians, and non-motorized vehicles on both main and side roads. It issues variable message board alerts to drivers on the main road and provides localized rapid warnings through audible and visual alarms for pedestrians and non-motorized vehicles on side roads. To verify the effectiveness of trajectory prediction and the warning system, warning logs and video records from 1 September to 30 September 2024, were analyzed. A total of 120 alerts involving vehicles, pedestrians, and non-motorized vehicles were recorded. Through manual comparison and analysis, the warning system achieved an accuracy rate of 97%.

5.4. System Limitations

While the system exhibits robust performance under moderate rain and overcast conditions, its detection accuracy may decline in low-visibility scenarios such as heavy fog, snowfall, or nighttime operations, primarily due to its reliance on optical cameras. A critical limitation lies in the assumption of uninterrupted camera functionality; transient sensor failures (e.g., power disruptions) or physical obstructions (e.g., lens contamination by dirt or debris) could result in temporary system downtime, underscoring the need for redundant sensor arrays or periodic maintenance protocols. Additionally, real-time processing on edge computing platforms may encounter computational bottlenecks during high-density traffic scenarios (>50 concurrent objects), leading to latency in collision risk alerts. To ensure scalability for large-scale urban deployments, future iterations could integrate hardware accelerators (e.g., TensorRT-optimized GPUs) or adopt lightweight algorithmic optimizations to mitigate latency constraints.

6. Conclusions

The background and problem statement sections underscore the critical safety challenges at unsignalized intersections and the limitations of existing solutions. By leveraging state-of-the-art object detection, tracking, and trajectory prediction technologies, this research aims to develop a proactive collision warning system that enhances the safety of unsignalized intersections. This article proposes an improved YOLOv8+DeepSORT-based collision risk warning system for unsignalized intersections, integrating vehicle and pedestrian detection, tracking, and trajectory prediction to enhance traffic safety. The main conclusions are as follows:
(1) YOLOv8 is employed as the primary detector, optimized with the RepLayer module, GIoU loss, and Global Attention Mechanism (GAM) to improve object detection accuracy, especially in complex traffic environments. The model demonstrated high detection precision, with a mAP50 exceeding 96.7%, and significant improvements in detecting multi-scale objects due to the ReContext gradient composition feature pyramid.
(2) Deep SORT was modified to enhance tracking robustness, reducing the identity switches caused by occlusions and ensuring continuous monitoring of vehicles, pedestrians, and non-motorized users. This allows for reliable multi-target tracking, which is essential for accurate collision prediction at intersections.
(3) A Bi-LSTM network was implemented for trajectory prediction, effectively capturing long-range dependencies and predicting future movements with high precision. The predictive collision risk area (PCRA) approach was used to assess collision risk levels (danger, warning, and caution) based on the spatial overlap of predicted paths.
(4) In the experimental setup, the dataset used for training the model consisted of 30,000 images that were annotated with bounding boxes around vehicles, pedestrians, and non-motorized vehicles. Data augmentation techniques, such as Mosaic, Random_perspective, Mixup, HSV adjustments, Flipud, and Fliplr, were applied to enrich the dataset and improve model robustness.
(5) In field tests on the G310 highway project, the system achieved 97% accuracy in collision risk prediction across 120 recorded events involving vehicles and pedestrians. The system’s reliable performance in real-time collision warnings demonstrates its applicability and effectiveness in reducing accident risks at unsignalized intersections.
This system establishes a scalable and adaptive framework for traffic safety, with substantial potential for performance optimization through multi-sensor fusion. Integrating radar and video modalities would enable the cross-validation of detection outputs, synergistically enhancing robustness across diverse environmental conditions (e.g., fog, glare, or nighttime operations). The architecture’s modular design permits a seamless extension to address emerging traffic challenges, including construction zones and dynamic traffic controls. For instance, real-time integration of geofencing data—leveraging V2X communications or digital twin platforms—could dynamically recalibrate the risk estimation algorithms to accommodate temporary lane closures or detour scenarios. To further refine trajectory prediction fidelity, future iterations could incorporate pedestrian intent recognition modules utilizing gaze estimation and skeletal pose prediction, which is particularly critical for abrupt directional changes in pedestrian behavior. Longitudinal studies will investigate the fusion of crowd-sourced traffic analytics (e.g., trajectory patterns, near-miss incidents) to revolutionize situational awareness in heterogeneous urban ecosystems.

Author Contributions

Methodology, Y.B.; software, Q.Y. and S.W.; validation, Y.L.; writing—original draft preparation, Z.L.; funding acquisition, Y.B. and S.W. All authors have read and agreed to the published version of the manuscript.

Funding

This work was supported in part by the National R&D Program of China (Grant No. 2023YFB2504704); the National Natural Science Foundation of China (52208424); the Natural Science Foundation of Chongqing (2022NSCQ-MSX1939); the Chongqing Municipal Education Commission Foundation (KJQN202300728); the Chongqing Talent Innovation Leading Talent Project (CQYC20210301505); and the Key Research and Development Program of Guangxi, China, (Grant No. AB21196034).

Data Availability Statement

The original contributions presented in this study are included in the article. Further inquiries can be directed to the corresponding author.

Acknowledgments

We sincerely appreciate the invaluable support of our colleagues throughout the data acquisition process, as well as their assistance in proofreading and reviewing this work. Their contributions have significantly enhanced the quality and accuracy of this study. Additionally, we extend our heartfelt gratitude to the editor and reviewers for their insightful suggestions and constructive feedback, which have greatly contributed to improving this paper.

Conflicts of Interest

The authors declare that the research was conducted in the absence of any commercial or financial relationships that could be construed as a potential conflicts of interest.

References

  1. Fernando, D.M.; Tennakoon, S.U.; Samaranayake, A.N.; Wickramasinghe, M. Characteristics of Road Traffic Accident Casualties Admitted to a Tertiary Care Hospital in Sri Lanka. Forensic Sci. Med. Pathol. 2017, 13, 44–51. [Google Scholar] [CrossRef] [PubMed]
  2. Peličić, D.; Ristić, B.; Radević, S. Epidemiology of Traffic Traumatism. Sanamed 2024, 19, 233–238. [Google Scholar] [CrossRef]
  3. Yang, P.; Yang, R.; Luo, Y.; Zhang, Y.; Hu, M. Hospitalization Costs of Road Traffic Injuries in Hunan, China: A Quantile Regression Analysis. Accid. Anal. Prev. 2024, 194, 107368. [Google Scholar] [CrossRef] [PubMed]
  4. Song, L.; (David) Fan, W. Exploring Truck Driver-Injury Severity at Intersections Considering Heterogeneity in Latent Classes: A Case Study of North Carolina. Int. J. Transp. Sci. Technol. 2021, 10, 110–120. [Google Scholar] [CrossRef]
  5. Shao, Y.; Luo, Z.; Wu, H.; Han, X.; Pan, B.; Liu, S.; Claudel, C.G. Evaluation of Two Improved Schemes at Non-Aligned Intersections Affected by a Work Zone with an Entropy Method. Sustainability 2020, 12, 5494. [Google Scholar] [CrossRef]
  6. Sharafeldin, M.; Farid, A.; Ksaibati, K. Examining the Risk Factors of Rear-End Crashes at Signalized Intersections. J. Transp. Technol. 2022, 12, 635. [Google Scholar] [CrossRef]
  7. Singh, H.; Kathuria, A. Analyzing Driver Behavior under Naturalistic Driving Conditions: A Review. Accid. Anal. Prev. 2021, 150, 105908. [Google Scholar] [CrossRef]
  8. Schepers, P.; Hagenzieker, M.; Methorst, R.; van Wee, B.; Wegman, F. A Conceptual Framework for Road Safety and Mobility Applied to Cycling Safety. Accid. Anal. Prev. 2014, 62, 331–340. [Google Scholar] [CrossRef]
  9. Pawar, D.S.; Patil, G.R. Response of Major Road Drivers to Aggressive Maneuvering of the Minor Road Drivers at Unsignalized Intersections: A Driving Simulator Study. Transp. Res. Part F Traffic Psychol. Behav. 2018, 52, 164–175. [Google Scholar] [CrossRef]
  10. Luo, Z.; Shi, H.; Liu, W.; Jin, Y. HMM-Based Traffic Situation Assessment and Prediction Method. In Proceedings of the 20th COTA International Conference of Transportation Professionals, Xi’an, China, 14–16 August 2020. [Google Scholar]
  11. Cheng, H.T.; Shan, H.; Zhuang, W. Infotainment and Road Safety Service Support in Vehicular Networking: From a Communication Perspective. Mech. Syst. Signal Process. 2011, 25, 2020–2038. [Google Scholar] [CrossRef]
  12. Khan, M.N.; Das, S. Advancing Traffic Safety through the Safe System Approach: A Systematic Review. Accid. Anal. Prev. 2024, 199, 107518. [Google Scholar] [CrossRef] [PubMed]
  13. Yuan, T.; Da Rocha Neto, W.; Rothenberg, C.E.; Obraczka, K.; Barakat, C.; Turletti, T. Machine Learning for Next-Generation Intelligent Transportation Systems: A Survey. Trans. Emerg. Telecommun. Technol. 2022, 33, e4427. [Google Scholar] [CrossRef]
  14. Geng, M.; Cai, Z.; Zhu, Y.; Chen, X.; Lee, D.-H. Multimodal Vehicular Trajectory Prediction with Inverse Reinforcement Learning and Risk Aversion at Urban Unsignalized Intersections. IEEE Trans. Intell. Transp. Syst. 2023, 24, 12227–12240. [Google Scholar] [CrossRef]
  15. Mihalj, T.; Li, H.; Babić, D.; Lex, C.; Jeudy, M.; Zovak, G.; Babić, D.; Eichberger, A. Road Infrastructure Challenges Faced by Automated Driving: A Review. Appl. Sci. 2022, 12, 3477. [Google Scholar] [CrossRef]
  16. Nigam, N.; Singh, D.P.; Choudhary, J. A Review of Different Components of the Intelligent Traffic Management System (ITMS). Symmetry 2023, 15, 583. [Google Scholar] [CrossRef]
  17. Luo, Z.; Bi, Y.; Lei, Q.; Li, Y.; Song, L. Method for Identifying and Alerting to Operational Risks of En-Route Vehicles on Arterial Road. In Proceedings of the Ninth International Conference on Electromechanical Control Technology and Transportation (ICECTT 2024), Guilin, China, 24–26 May 2024. [Google Scholar]
  18. YOLOv8: Advancements and Innovations in Object Detection|SpringerLink. Available online: https://link.springer.com/chapter/10.1007/978-981-97-1323-3_1 (accessed on 31 October 2024).
  19. Wojke, N.; Bewley, A.; Paulus, D. Simple Online and Realtime Tracking with a Deep Association Metric. In Proceedings of the 2017 IEEE International Conference on Image Processing (ICIP), Beijing, China, 17–20 September 2017; pp. 3645–3649. [Google Scholar]
  20. Balasubramani, S.; Aravindhar, D.J.; Renjith, P.N.; Ramesh, K. DDSS: Driver Decision Support System Based on the Driver Behaviour Prediction to Avoid Accidents in Intelligent Transport System. Int. J. Cogn. Comput. Eng. 2024, 5, 1–13. [Google Scholar] [CrossRef]
  21. Shahid, F.; Zameer, A.; Muneeb, M. Predictions for COVID-19 with Deep Learning Models of LSTM, GRU and Bi-LSTM. Chaos Solitons Fractals 2020, 140, 110212. [Google Scholar] [CrossRef]
  22. Torbaghan, M.E.; Sasidharan, M.; Reardon, L.; Muchanga-Hvelplund, L.C. Understanding the Potential of Emerging Digital Technologies for Improving Road Safety. Accid. Anal. Prev. 2022, 166, 106543. [Google Scholar] [CrossRef]
  23. Wang, Y.; Yang, X.; Liang, H.; Liu, Y. A Review of the Self-Adaptive Traffic Signal Control System Based on Future Traffic Environment. J. Adv. Transp. 2018, 2018, 1096123. [Google Scholar] [CrossRef]
  24. Cicchino, J.B. Effects of Forward Collision Warning and Automatic Emergency Braking on Rear-End Crashes Involving Pickup Trucks. Traffic Inj. Prev. 2023, 24, 293–298. [Google Scholar] [CrossRef]
  25. Cicchino, J.B. Effectiveness of Forward Collision Warning and Autonomous Emergency Braking Systems in Reducing Front-to-Rear Crash Rates. Accid. Anal. Prev. 2017, 99, 142–152. [Google Scholar] [CrossRef]
  26. Ismagilova, E.; Hughes, L.; Dwivedi, Y.K.; Raman, K.R. Smart Cities: Advances in Research—An Information Systems Perspective. Int. J. Inf. Manag. 2019, 47, 88–100. [Google Scholar] [CrossRef]
  27. Zhu, Z.; He, X.; Qi, G.; Li, Y.; Cong, B.; Liu, Y. Brain Tumor Segmentation Based on the Fusion of Deep Semantics and Edge Information in Multimodal MRI. Inf. Fusion 2023, 91, 376–387. [Google Scholar] [CrossRef]
  28. Liu, Y.; Qi, Z.; Cheng, J.; Chen, X. Rethinking the Effectiveness of Objective Evaluation Metrics in Multi-Focus Image Fusion: A Statistic-Based Approach. IEEE Trans. Pattern Anal. Mach. Intell. 2024, 46, 5806–5819. [Google Scholar] [CrossRef] [PubMed]
  29. Hussain, M. YOLOv1 to v8: Unveiling Each Variant–A Comprehensive Review of YOLO. IEEE Access 2024, 12, 42816–42833. [Google Scholar] [CrossRef]
  30. Bakirci, M. Enhancing Vehicle Detection in Intelligent Transportation Systems via Autonomous UAV Platform and YOLOv8 Integration. Appl. Soft Comput. 2024, 164, 112015. [Google Scholar] [CrossRef]
  31. Wang, H.; Liu, C.; Cai, Y.; Chen, L.; Li, Y. YOLOv8-QSD: An Improved Small Object Detection Algorithm for Autonomous Vehicles Based on YOLOv8. IEEE Trans. Instrum. Meas. 2024, 73, 1–16. [Google Scholar] [CrossRef]
  32. Bakirci, M. Utilizing YOLOv8 for Enhanced Traffic Monitoring in Intelligent Transportation Systems (ITS) Applications. Digit. Signal Process. 2024, 152, 104594. [Google Scholar] [CrossRef]
  33. Adžemović, M.; Tadić, P.; Petrović, A.; Nikolić, M. Beyond Kalman Filters: Deep Learning-Based Filters for Improved Object Tracking. arXiv 2024, arXiv:2402.09865. [Google Scholar] [CrossRef]
  34. Hu, D.; Al Shafian, S. Segmentation and Tracking of Moving Objects on Dynamic Construction Sites. In Proceedings of the Construction Research Congress 2024, Des Moines, IA, USA, 20–23 March 2024. [Google Scholar]
  35. Zhao, J.; Chen, J. YOLOv8 Detection and Improved BOT-SORT Tracking Algorithm for Iron Ladles. In Proceedings of the 2024 7th International Conference on Image and Graphics Processing, Association for Computing Machinery, New York, NY, USA, 3 May 2024; pp. 409–415. [Google Scholar]
  36. Mercorelli, P. Denoising and Harmonic Detection Using Nonorthogonal Wavelet Packets in Industrial Applications. Jrl Syst. Sci. Complex. 2007, 20, 325–343. [Google Scholar] [CrossRef]
  37. He, Y.; Huang, P.; Hong, W.; Luo, Q.; Li, L.; Tsui, K.-L. In-Depth Insights into the Application of Recurrent Neural Networks (RNNs) in Traffic Prediction: A Comprehensive Review. Algorithms 2024, 17, 398. [Google Scholar] [CrossRef]
  38. Bharilya, V.; Kumar, N. Machine Learning for Autonomous Vehicle’s Trajectory Prediction: A Comprehensive Survey, Challenges, and Future Research Directions. Veh. Commun. 2024, 46, 100733. [Google Scholar] [CrossRef]
  39. Korbmacher, R.; Tordeux, A. Review of Pedestrian Trajectory Prediction Methods: Comparing Deep Learning and Knowledge-Based Approaches. IEEE Trans. Intell. Transp. Syst. 2022, 23, 24126–24144. [Google Scholar] [CrossRef]
  40. Zhang, C.; Ni, Z.; Berger, C. Spatial-Temporal-Spectral LSTM: A Transferable Model for Pedestrian Trajectory Prediction. IEEE Trans. Intell. Veh. 2024, 9, 2836–2849. [Google Scholar] [CrossRef]
  41. Pereira, G.A.; Hussain, M. A Review of Transformer-Based Models for Computer Vision Tasks: Capturing Global Context and Spatial Relationships. arXiv 2024, arXiv:2408.15178. [Google Scholar]
  42. Hussain, A.; Hussain, T.; Ullah, W.; Baik, S.W. Vision Transformer and Deep Sequence Learning for Human Activity Recognition in Surveillance Videos. Comput. Intell. Neurosci. 2022, 2022, 3454167. [Google Scholar] [CrossRef] [PubMed]
  43. Berhanu, Y.; Alemayehu, E.; Schröder, D. Examining Car Accident Prediction Techniques and Road Traffic Congestion: A Comparative Analysis of Road Safety and Prevention of World Challenges in Low-Income and High-Income Countries. J. Adv. Transp. 2023, 2023, 6643412. [Google Scholar] [CrossRef]
  44. Formosa, N.; Quddus, M.; Ison, S.; Abdel-Aty, M.; Yuan, J. Predicting Real-Time Traffic Conflicts Using Deep Learning. Accid. Anal. Prev. 2020, 136, 105429. [Google Scholar] [CrossRef]
  45. Wei, X. Enhancing Road Safety in Internet of Vehicles Using Deep Learning Approach for Real-Time Accident Prediction and Prevention. Int. J. Intell. Netw. 2024, 5, 212–223. [Google Scholar] [CrossRef]
  46. Hegde, C.; Dash, S.; Agarwal, P. Vehicle Trajectory Prediction Using GAN. In Proceedings of the 2020 Fourth International Conference on I-SMAC (IoT in Social, Mobile, Analytics and Cloud) (I-SMAC), Palladam, India, 7–9 October 2020; pp. 502–507. [Google Scholar]
  47. Pang, Y.; Kashiyama, T.; Yabe, T.; Tsubouchi, K.; Sekimoto, Y. Development of People Mass Movement Simulation Framework Based on Reinforcement Learning. Transp. Res. Part C Emerg. Technol. 2020, 117, 102706. [Google Scholar] [CrossRef]
  48. Li, C.; Liu, Z.; Lin, S.; Wang, Y.; Zhao, X. Intention-Convolution and Hybrid-Attention Network for Vehicle Trajectory Prediction. Expert Syst. Appl. 2024, 236, 121412. [Google Scholar] [CrossRef]
  49. Luo, Z.; Bi, Y.; Yang, X.; Li, Y.; Yu, S.; Wu, M.; Ye, Q. Enhanced YOLOv5s + DeepSORT Method for Highway Vehicle Speed Detection and Multi-Sensor Verification. Front. Phys. 2024, 12, 1371320. [Google Scholar] [CrossRef]
  50. Xing, L.; Liu, W. A Data Fusion Powered Bi-Directional Long Short Term Memory Model for Predicting Multi-Lane Short Term Traffic Flow. IEEE Trans. Intell. Transp. Syst. 2022, 23, 16810–16819. [Google Scholar] [CrossRef]
  51. Noh, B.; Park, H.; Yeo, H. Analyzing Vehicle–Pedestrian Interactions: Combining Data Cube Structure and Predictive Collision Risk Estimation Model. Accid. Anal. Prev. 2022, 165, 106539. [Google Scholar] [CrossRef]
Figure 1. Unsignalized intersection scenario.
Electronics 14 01098 g001
Figure 2. The overall structure of the proposed system.
Electronics 14 01098 g002
Figure 3. Overall framework diagram of RGGE-YOLOv8.
Electronics 14 01098 g003
Figure 4. Overall framework diagram of RGGE-YOLOv8 structure of Deep SORT.
Electronics 14 01098 g004
Figure 5. Workflow diagram of Deep SORT algorithm.
Electronics 14 01098 g005
Figure 6. Pixel coordinate conversion diagram.
Electronics 14 01098 g006
Figure 7. Bi-LSTM network architecture.
Electronics 14 01098 g007
Figure 8. LSTM modules.
Electronics 14 01098 g008
Figure 9. LSTM memory cell processing workflow.
Electronics 14 01098 g009
Figure 10. Bi-LSTM model schematic diagram.
Electronics 14 01098 g010
Figure 11. PCRA levels.
Electronics 14 01098 g011
Figure 12. Trajectory tracking performance of different models.
Electronics 14 01098 g012
Figure 13. The impact of different prediction trajectory lengths on prediction accuracy.
Electronics 14 01098 g013
Figure 14. Proactive safety warning system for unsignalized intersections.
Electronics 14 01098 g014
Table 1. Ablation results.
TypeFps (frame/s)p-Value (%) R (%) mAp50 (%)mAp50-95 (%)
YOLOv8n25680.284.692.568.3
+ RepLayer24382.585.393.372.6
+ GIoU22684.686.394.675.8
+ GAM18290.689.395.679.8
+ ReContext16592.390.796.784.5
Disclaimer/Publisher’s Note: The statements, opinions and data contained in all publications are solely those of the individual author(s) and contributor(s) and not of MDPI and/or the editor(s). MDPI and/or the editor(s) disclaim responsibility for any injury to people or property resulting from any ideas, methods, instructions or products referred to in the content.

