Systematic Review

Design, Algorithms, and Applications of Microstrip Antennas for Image Acquisition: Systematic Review

by
Luis Fernando Guerrero-Vásquez
1,*,†,
Nathalia Alexandra Chacón-Reino
1,†,
Byron Steven Sigüenza-Jiménez
2,
Felipe Tomas Zeas-Loja
2,
Jorge Osmani Ordoñez-Ordoñez
1 and
Paúl Andrés Chasi-Pesantez
1
1
Telecommunications and Telematics Research Group, Universidad Politécnica Salesiana, Cuenca EC010103, Ecuador
2
Electronic Engineering School, Universidad Politécnica Salesiana, Cuenca EC010103, Ecuador
*
Author to whom correspondence should be addressed.
These authors contributed equally to this work.
Electronics 2025, 14(6), 1063; https://doi.org/10.3390/electronics14061063
Submission received: 27 January 2025 / Revised: 26 February 2025 / Accepted: 4 March 2025 / Published: 7 March 2025
(This article belongs to the Section Microwave and Wireless Communications)

Abstract

:
This systematic literature review investigates microstrip antenna applications in image acquisition, focusing on their design characteristics, reconstruction algorithms, and application areas. We applied the PRISMA methodology for article selection. From selected studies, classifications were identified based on antenna patch geometry, substrate types, and image reconstruction algorithms. According to inclusion criteria, a significant increase in publications on this topic has been observed since 2013. Considering this trend, our study focuses on a 10-year publication range, including articles up to 2023. Results indicate that medical applications, particularly breast cancer detection, dominate this field. However, emerging areas are gaining attention, including stroke detection, bone fracture monitoring, security surveillance, avalanche radars, and weather monitoring. Our study highlights the need for more efficient algorithms, system miniaturization, and improved models to achieve precise medical imaging. Visual tools such as heatmaps and box plots are used to provide a deeper analysis, identify knowledge gaps, and offer valuable insights for future research and development in this versatile technology.

1. Introduction

In the continuous framework of technological development and optimization, demand for advanced and efficient imaging systems has experienced exponential growth, which generates significant interest among researchers [1]. Among emerging technologies that emerged in the the last decade, microstrip antennas are a fundamental component due to their outstanding versatility and potential for image acquisition [2]. Since their creation in 1985, microstrip antennas have evolved significantly due to their wide variety of designs, properties, and characteristics [3]. They are known for their unique properties such as high directivity, operability over a wide frequency band, compact size, and lightweight. Additionally, their manufacturing process is cost-effective [4,5].
These characteristics are crucial in design and construction, which makes them suitable for image acquisition applications in various scenarios and environments [6]. Their utility is not limited to communication systems but also extends to more specialized fields such as medicine, remote sensing or surveillance, agriculture, cartography, and more [3,7,8].
Microstrip antennas offer significant advantages over conventional antennas in an image acquisition context and combine compactness, lightweight design, and high performance [9]. Their reduced size and weight make them ideal for integration into portable or wearable systems and facilitate their use in dynamic environments such as medical diagnostics or aerial imaging [10]. Additionally, their planar structure allows for easy fabrication on flexible or non-conventional substrates, thus enhancing their versatility for applications where conventional antennas may be impractical.
Microstrip patch antennas exhibit diverse geometries tailored to specific applications and encompass a radiating patch on a dielectric substrate, which is linked to a transmission line and a ground plane [3,11]. Common geometric shapes include circular, rectangular, square, elliptical, triangular, and ring [12,13]. Innovative designs, such as fractals, Vivaldi apertures, and nature-inspired shapes, have also shown promising results [14,15,16].
In the image acquisition area, a suitable antenna design alone is not enough; it is necessary to generate a reconstruction from retrieved information. In this case, algorithms for signal processing, data analysis, and image reconstruction are used [17]. Methods such as convolution, edge segmentation, pattern recognition, Fourier transform, and filtering processes are implemented, facilitating a variety of operations to improve image quality and extract precise information from images [17,18].
The current variety of algorithms and techniques applied for image acquisition and reconstruction covers a wide range of applications, notably in the field of medicine, playing a crucial role in disease diagnosis and treatment through imaging [19]. These techniques are used in medical diagnostics such as computed tomography (CT), Magnetic Resonance Imaging (MRI), and confocal microwave imaging (CMI) [20]. In addition to these systems, image reconstruction algorithms are applied in the security field, focusing on surveillance and detection systems for tracking objects and people through facial image reconstruction from data captured by security cameras [21,22].
In this context, it is observed that patch antenna applications for image generation is an area of interest for both researchers and developers. The large number of existing studies in databases invite the creation of literature reviews that present information clearly, orderly, and systematically, allowing for the identification of trends or knowledge gaps. Thus, this article presents a systematic literature review that uses the PRISMA methodology [23] for discriminating information and selecting the most representative articles with clear inclusion and exclusion criteria. Additionally, an analysis based on constructive and functional characteristics of antennas and on applications and algorithms used in image reconstruction is generated. Trends, challenges, and possible areas for improvement have been identified, making this work a potential reference point for future researchers or developers.
The article is organized as follows. Section 2 presents a prior review of the studies that address related topics, describing their main findings and limitations in order to establish this research contribution. In Section 3, PRISMA-based methodology is described, starting from research questions formulation, keywords, and search equation, as well as inclusion and exclusion criteria used. Subsequently, Section 4 answers research questions, presenting the results clearly and combining graphical visualizations with narratives that describe the most important contributions of each study. The results are also discussed, which identify trends and research niches that have not yet been addressed, through a comparative analysis of the studies’ proposed variables. The analysis has been divided into two sections: correlation analysis between variable classifications (Section 6) and correlation analysis with antenna constructive characteristics (Section 5). Finally, Section 7 summarizes the main conclusions on the most relevant findings and some perspectives from authors as a starting point for generating new ideas in this area.

2. Related Work

This section provides a description of various existing literature reviews related to the functioning and imaging capabilities of patch antennas. This information offers a foundation on the work that has already been developed and analysis lines that could be addressed in a new systematic literature review. Table 1 shows a comparative summary of several previous studies related to patch antennas and their use in image acquisition.
  • In 2013, Reig and Ernesto [24] conducted a review of the most recent advances in printed antennas for sensor applications, collecting and analyzing information from a decade. They analyzed applications that employ these antennas, which are mainly used in wireless communication systems, specifically in sensor networks focusing on medium and long-range links, On-body applications, and On-chip applications. Regarding image acquisition, authors identified that RFID antennas are useful in applications related to creating detailed images of objects and environments. While the article does not focus on image acquisition using antennas, it addresses the topic as an emerging trend worth studying for potential future developments.
  • In 2015, Priya et al. [25] conducted a review compiling, analyzing, and synthesizing information from different sources on the design, manufacturing, and applications of portable antennas based on textile materials. They described the interaction effects between a portable antenna and a human body, classifying them into two categories: antenna effects on the human body and human body effects on the antenna’s performance. For radar applications, they designed a broadband antenna prototype for a wearable antenna system with eight elements. An eight-element array was tested in the same frequency range, including a multifunction box for SAR imaging. Obtained SAR images provided detailed information about terrain topography, location, and movement of enemy forces. They also mentioned the need to balance efficiency, size, and bandwidth to design a small antenna for high-resolution imaging for hazard monitoring.
  • A relevant study was proposed in 2018 by Mahmud et al. [26], who presented a review of microwave imaging obtained for breast cancer detection using UWB sensor antennas. They highlighted microwave imaging as a promising tool and briefly explained its operation based on analyzing backscattered signals with different dielectric properties of healthy and tumorous tissues. They also explained current detection technique limitations, focusing on microwave tomography imaging systems due to their simulations and measurements on 3D phantoms where algorithms are applied to improve reconstructed image quality. Finally, they discussed microwave imaging challenges, mentioning the difference between real breast tissue and simple prototypes. This review emphasized possible solutions to these challenges by proposing the combination of hybrid imaging and scattering programs with commercial electromagnetic (EM) simulators to find a suitable frequency range for correct imaging and better identification between healthy and tumorous cells.
  • In 2019, an article published by Jumaat et al. [27] proposed a review of previous works on frequency selection systems and antenna configurations for microwave imaging in early breast cancer detection. They briefly described the importance of some techniques such as mammography, tomography, thermography, ultrasound, and microwave imaging. They highlighted microwave imaging advantages as it presents a simpler, safer system with cost-saving capabilities. The review emphasized the importance of selecting the operating frequency since calculations for antenna design depend on frequency. They analyzed antenna configurations for breast cancer detection through microwave imaging, focusing on single-layer antenna configurations and reviewing articles proposing single-layer antenna arrays. In this regard, the review highlighted that the appropriate broadband frequency is 1 to 20 GHz for microwave imaging. Additionally, they noted that the number of antennas in an array affects image resolution, recommending a large number of antennas for good image quality.
  • In 2020, Imani et al. [28] presented a literature review on merging metasurface antenna design concepts and Computational Imaging (CI) techniques for imaging systems. First, they explained the metamaterial antenna operation capable of generating diverse radiation patterns. They also described hardware and software design applied to computational imaging in metasurface antennas. The review analyzed key factors for microwave imaging, including measurement quality, measurement number, signal fidelity, signal-to-noise ratio, and spatial sampling. Additionally, they proposed an alternative approach in the form of dynamic antennas, focusing on their configuration, evolution of DMAS, hybrid imaging systems, and single-frequency imaging.
  • Finally, in 2021, Arora et al. [29] presented a literature review on microstrip patch antennas (MSPA) applied to the human body for disease detection and prevention. The authors addressed medical diagnosis for monitoring various pathological changes related to breast cancer, conducting a detailed evaluation using microwave imaging techniques. This technique, based on differences in dielectric properties between healthy and cancerous breast tissue, provides information through images about cancerous tissue presence. They described a broadband patch antenna model for tumor detection, which can radiate directly into breast tissue. For breast cancer monitoring, they proposed a patch antenna with a slot and forked feed for radar-based microwave imaging. Additionally, for monitoring skin, bone, and muscle pathologies, they suggested a compact implantable patch antenna design with slightly high signal waves to obtain tissue images and assess their condition.
According to previous reviews, the techniques and methods for image acquisition have experienced notable and constant growth over the years with the development of different patch antenna models. These antennas have proven efficient in a wide range of imaging applications as progress has been observed in images with improvements in resolution, quality, and reliability. These advances have been driven by the development of new techniques such as design optimization and image processing algorithms. However, despite the multiple existing reviews, no work relates antenna designs, algorithms applied in image reconstruction, and the applications in which these systems are used. In this context, our work proposes to develop a systematic review considering the combination and relationship of these three aspects. Additionally, it provides an updated view of the literature on the use of patch antennas for image capture, helping to identify trends, areas for improvement, and possible future research directions.

3. Methodology

This work was developed following a systematic methodological approach that starts with the formulation of research questions and seeks to answer them by investigating relevant works selected based on specific criteria for information discrimination. PRISMA method [23] facilitates the structuring and presentation of results, ensuring the quality and transparency of review.
We began by formulating research questions that will guide the entire process of searching for and selecting information. These questions must be specific and focused on identifying and addressing knowledge gaps in the image generation area with patch antennas. We formulated the following research questions to guide our systematic review:
  • RQ1: What are the key design characteristics and properties of microstrip antennas used for image acquisition?
    This research question aims to identify key trends and developments in antenna geometry, material selection, and electromagnetic properties influencing the performance of microstrip antennas in imaging applications. Unlike previous studies, this question enables a comparative analysis of various design configurations concerning their structural characteristics.
  • RQ2: Which algorithms are most commonly employed for image reconstruction using microstrip antennas?
    This research question explores the relationship between algorithms used for image reconstruction and microstrip antenna performance in generating high-quality images. The goal is to identify the most frequently employed algorithms and their correlation with other structural characteristics.
  • RQ3: What are the primary applications of microstrip antennas in image acquisition?
    This research question aims to map the diverse application fields of microstrip antennas in imaging acquisition, covering areas such as medicine, security, environmental monitoring, and other emerging domains. It seeks to provide a comprehensive overview of how these antennas are utilized across various sectors to meet specific imaging requirements. Unlike previous studies that primarily focused on the role of microstrip antennas in medical diagnosis, this review expands the scope by evaluating their applicability across a broader range of industries. This extended perspective highlights the versatility of microstrip antennas and underscores their potential to address imaging challenges in both established and emerging applications.
Our search strategy consisted of identifying relevant articles in databases pertinent to the area. Search terms were selected according to the research questions, including the following terms: “microstrip antennas”, “image acquisition”, “image reconstruction algorithms”, and “applications”. Research String (RS) combined these keywords with Boolean operators to refine the results.
RS = (microstrip antenna OR patch antenna) AND (image) AND (acquisition OR obtaining OR processing) AND (techniques OR design OR algorithm)
Databases selected for this purpose are IEEE Xplore, Web of Science, Scopus, Springer, Science Direct, ACM Library, Hindawi, MDPI, SAGE, and Taylor & Francis. These databases were selected based on previous works. Additionally, it has been observed within Google Scholar that these databases usually present the highest number of results related to the research topic.
Subsequently, inclusion and exclusion criteria are applied within three clearly defined stages in the methodology: identification, screening, and included. A summary of the process is shown in Figure 1.
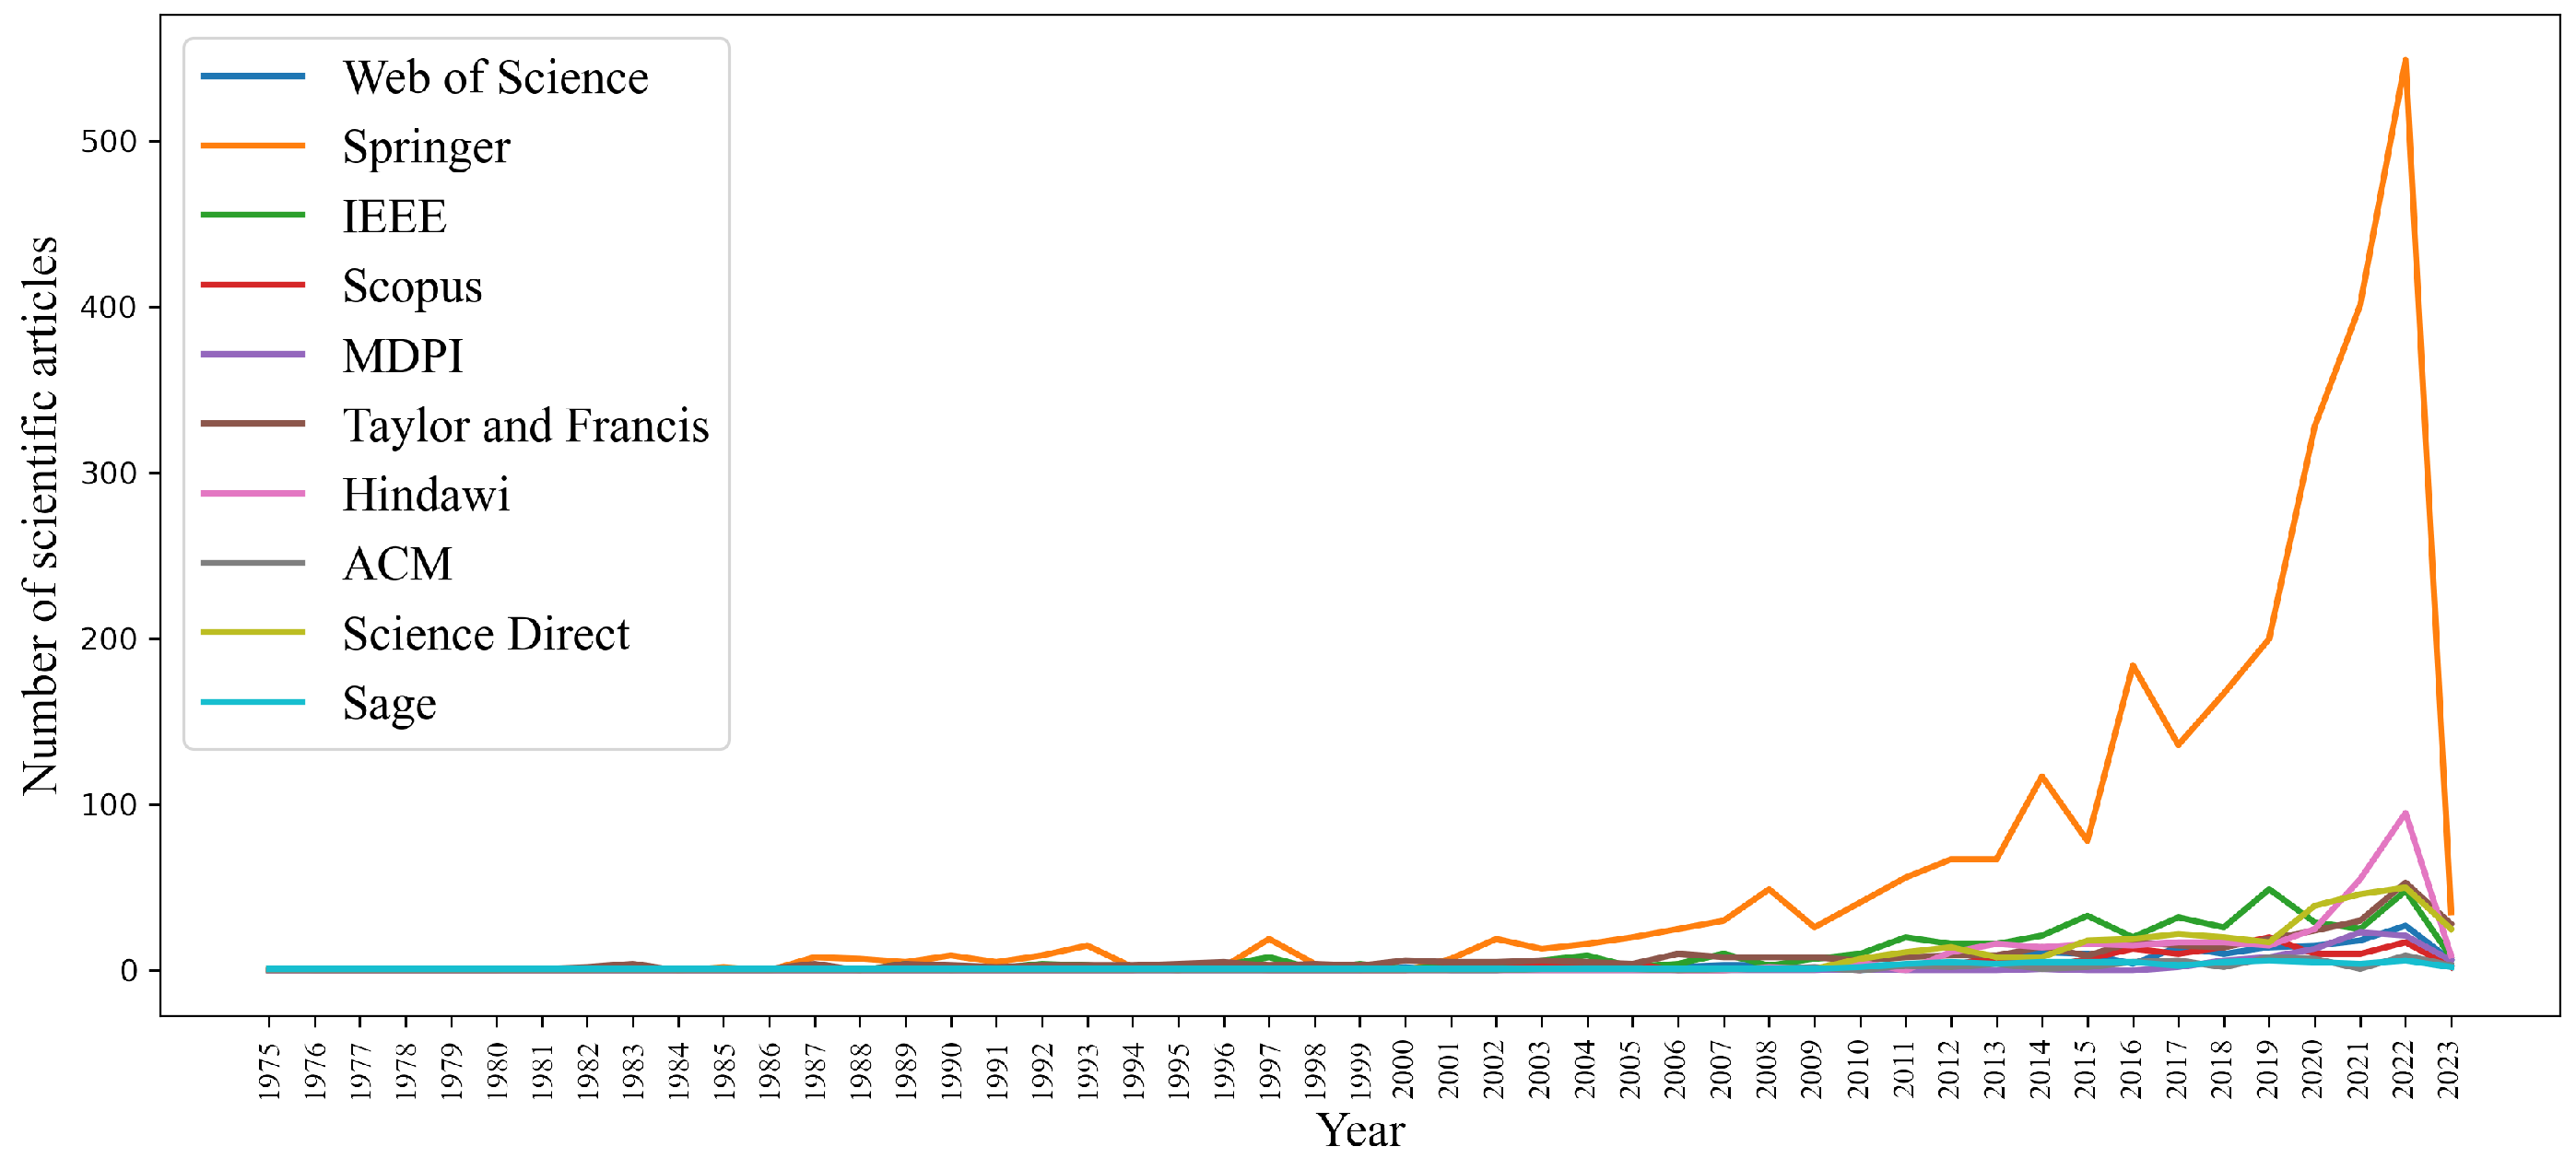
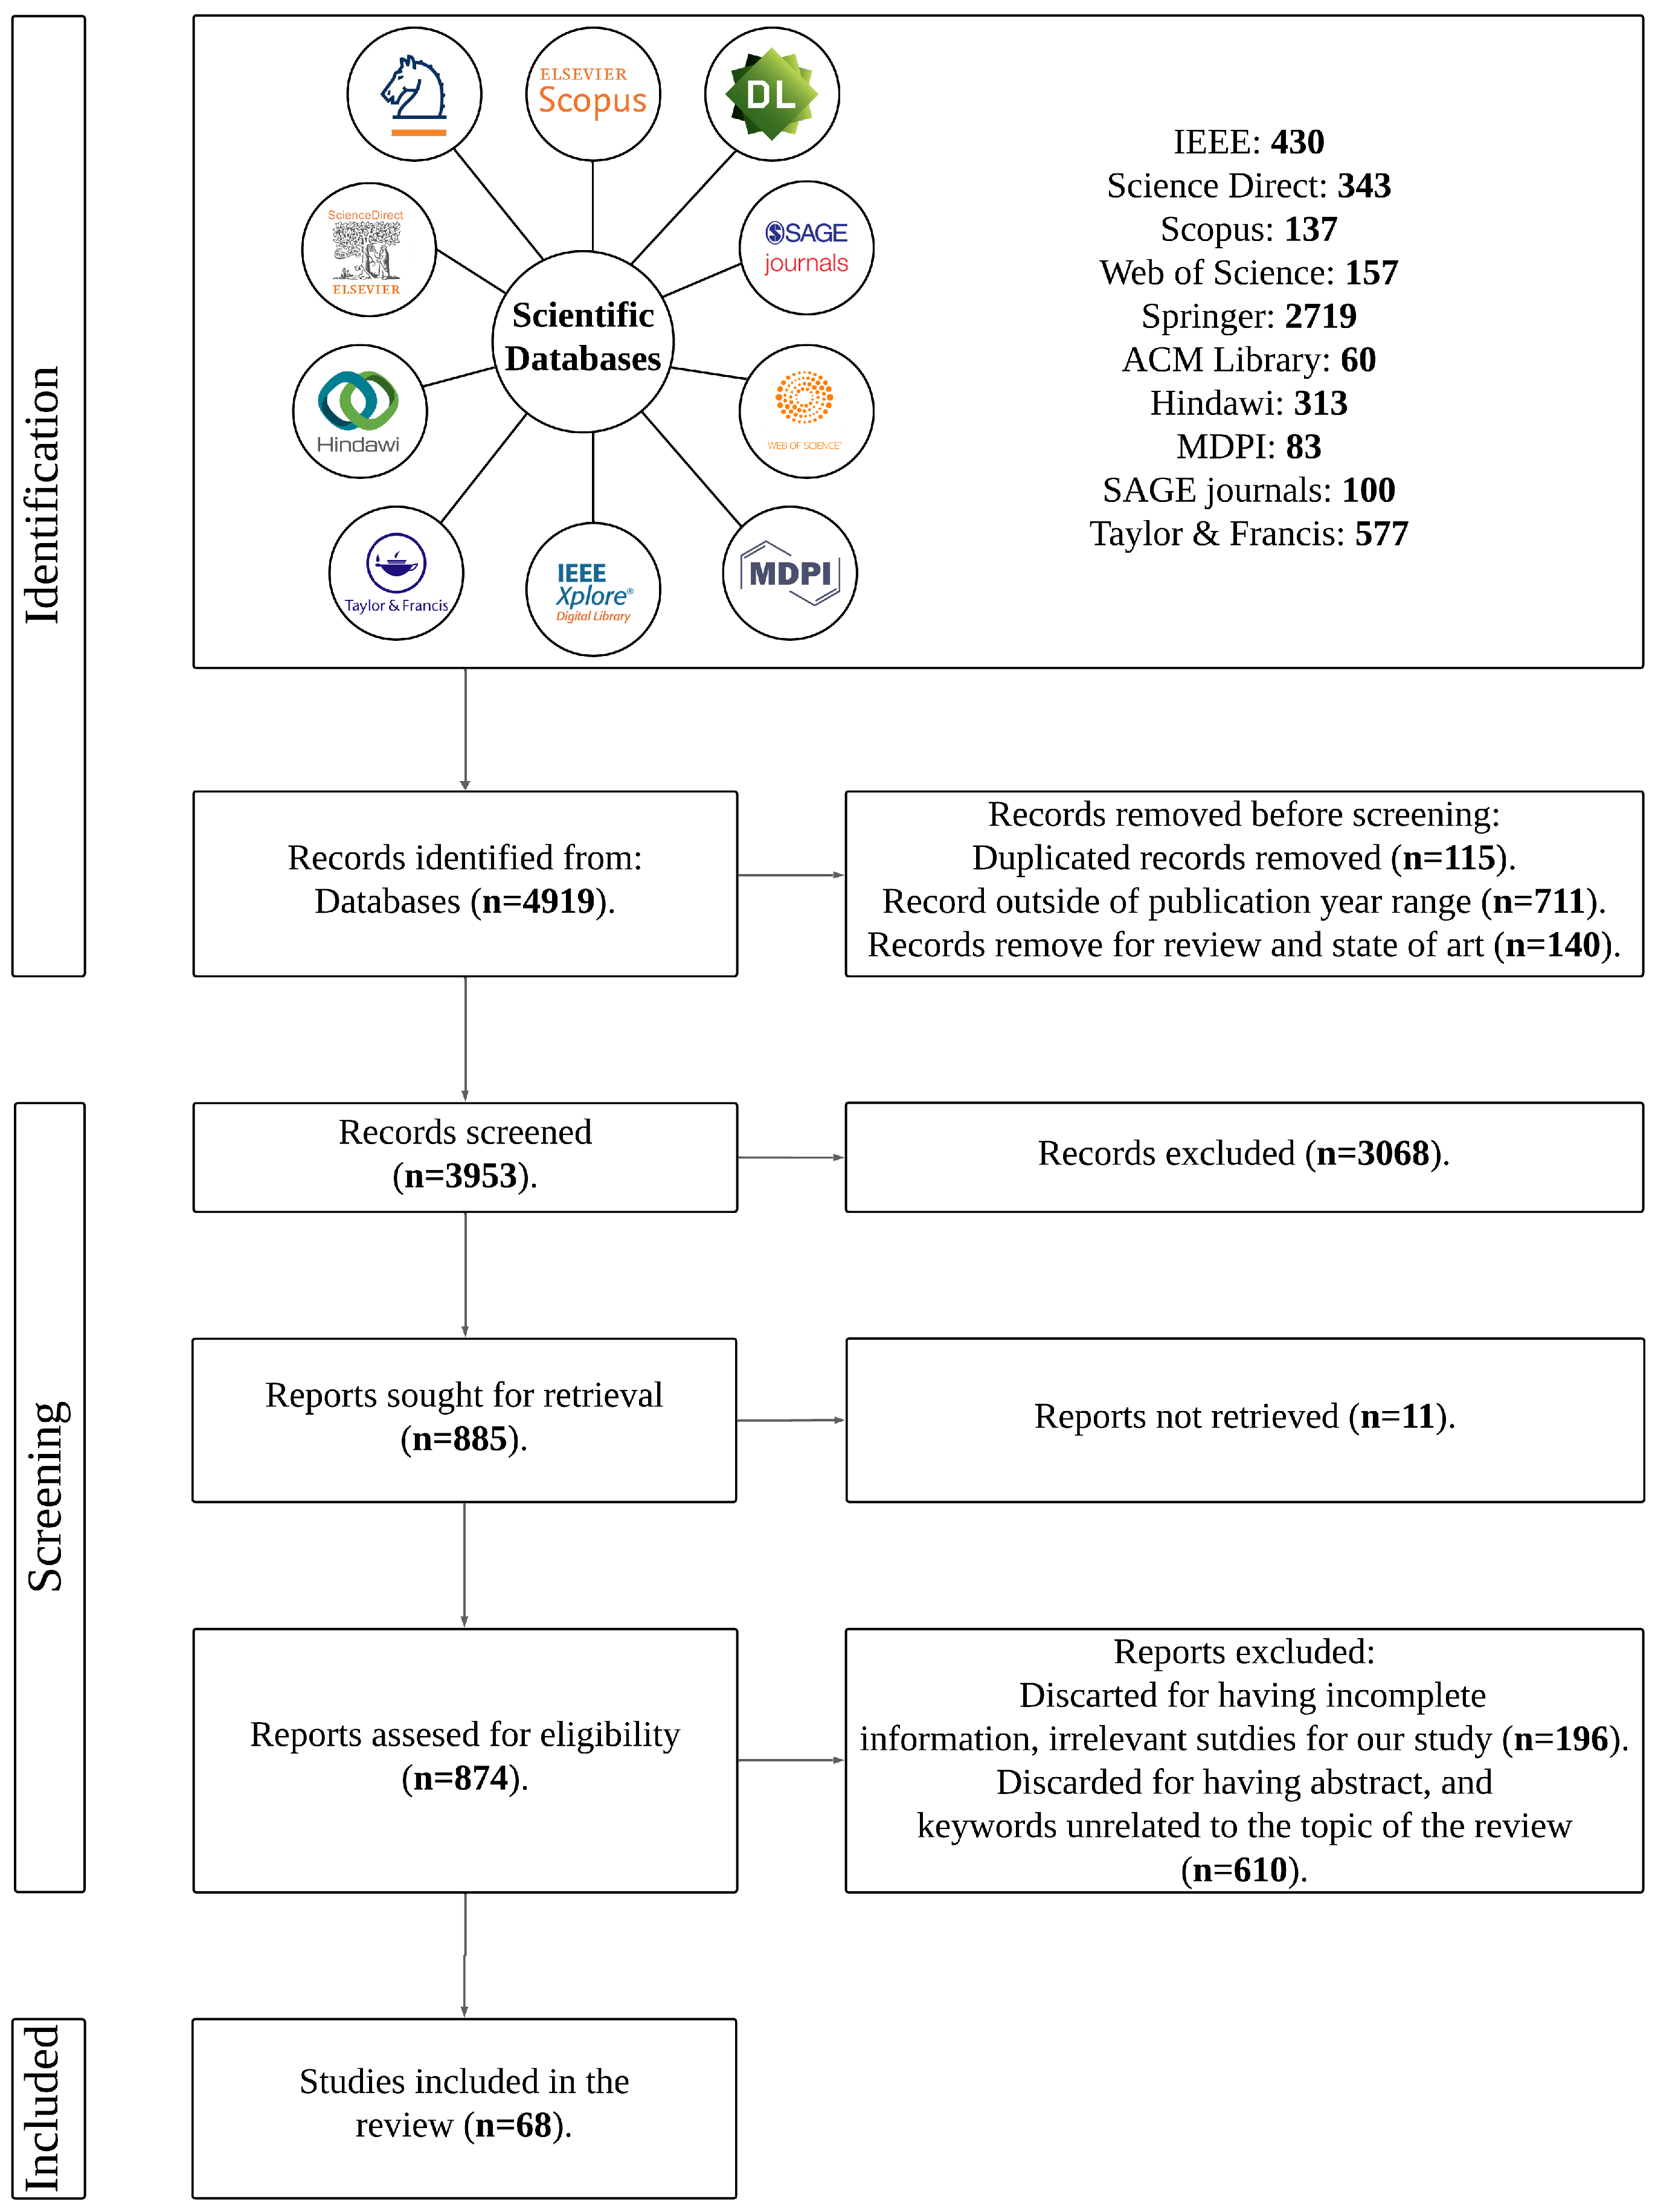
  • Identification: To begin, a filtering process was conducted based on the year of publication. By extracting articles metadata, a graph was generated according to publication year, as shown in Figure 2. There has been an increase in article publications related to the topic from the year 2013 onwards, so all previous publications were excluded. The search process and the downloading of metadata ended in June 2023. They cover a decade of articles in total. Additionally, state-of-the-art reviews that did not provide an analysis or lacked a scientific research basis were eliminated. Duplicate articles were also excluded.
  • Screening: Articles that were not directly related to the review topic were excluded. Each article was reviewed based on the topic, abstract, and keywords. Subsequently, documents that were not available or did not offer open access were discarded. The screening process was conducted by three independent reviewers, who evaluated each record and report retrieved. Each reviewer worked independently to ensure objectivity, and discrepancies were resolved through discussion until a consensus was reached. No automation tools were used during the screening process.
  • Included: Finally, A detailed review of each article was conducted, focusing on the characteristics of microstrip antennas, including patch dimensions, bandwidth, operating frequency, substrate material, type of algorithm applied for image reconstruction, and the corresponding application field.
Table 2 shows article summaries that are part of this review. It includes information about the authors, the countries where the research was conducted, sources (database), and publication years. Regarding the origins of the studies, Figure 3 shows that the country with the highest number of works was India, with 23.53% (n = 16). This is followed by Bangladesh with 14.71% (n = 10), and then Malaysia contributes with 10.29% (n = 7). Iran contributes with 7.35% (n = 5), and Italy and Morocco with 4.41% (n = 3) each. The countries of Saudi Arabia, Algeria, Australia, the United States, France, Kuwait, and the United Kingdom each contribute 2.94% (n = 2). Finally, other countries such as Germany, Basel, Spain, Greece, Iraq, Lebanon, New Zealand, Sudan, Thailand, and Turkey represented contributions of 1.47% (n = 1), which means only one article each.
Figure 2. Publication scheme of articles by year.
Electronics 14 01063 g002
Figure 3. Distribution of studies by countries.
Electronics 14 01063 g003

4. Results and Discussion

The review results consist of answers to research questions. Based on these questions, metadata were extracted from the different articles while considering the following variables:
  • Antenna structure (geometric design and substrate).
  • Type of reconstruction algorithm.
  • Type of application.
For each variable, sub-variables have been generated as needed to present more specific classifications, allowing us to display the information in an organized and systematic manner.

4.1. RQ1. What Are the Key Design Characteristics and Properties of Microstrip Antennas Used for Image Acquisition?

Our analysis identified several common design characteristics of microstrip antennas used for image acquisition:
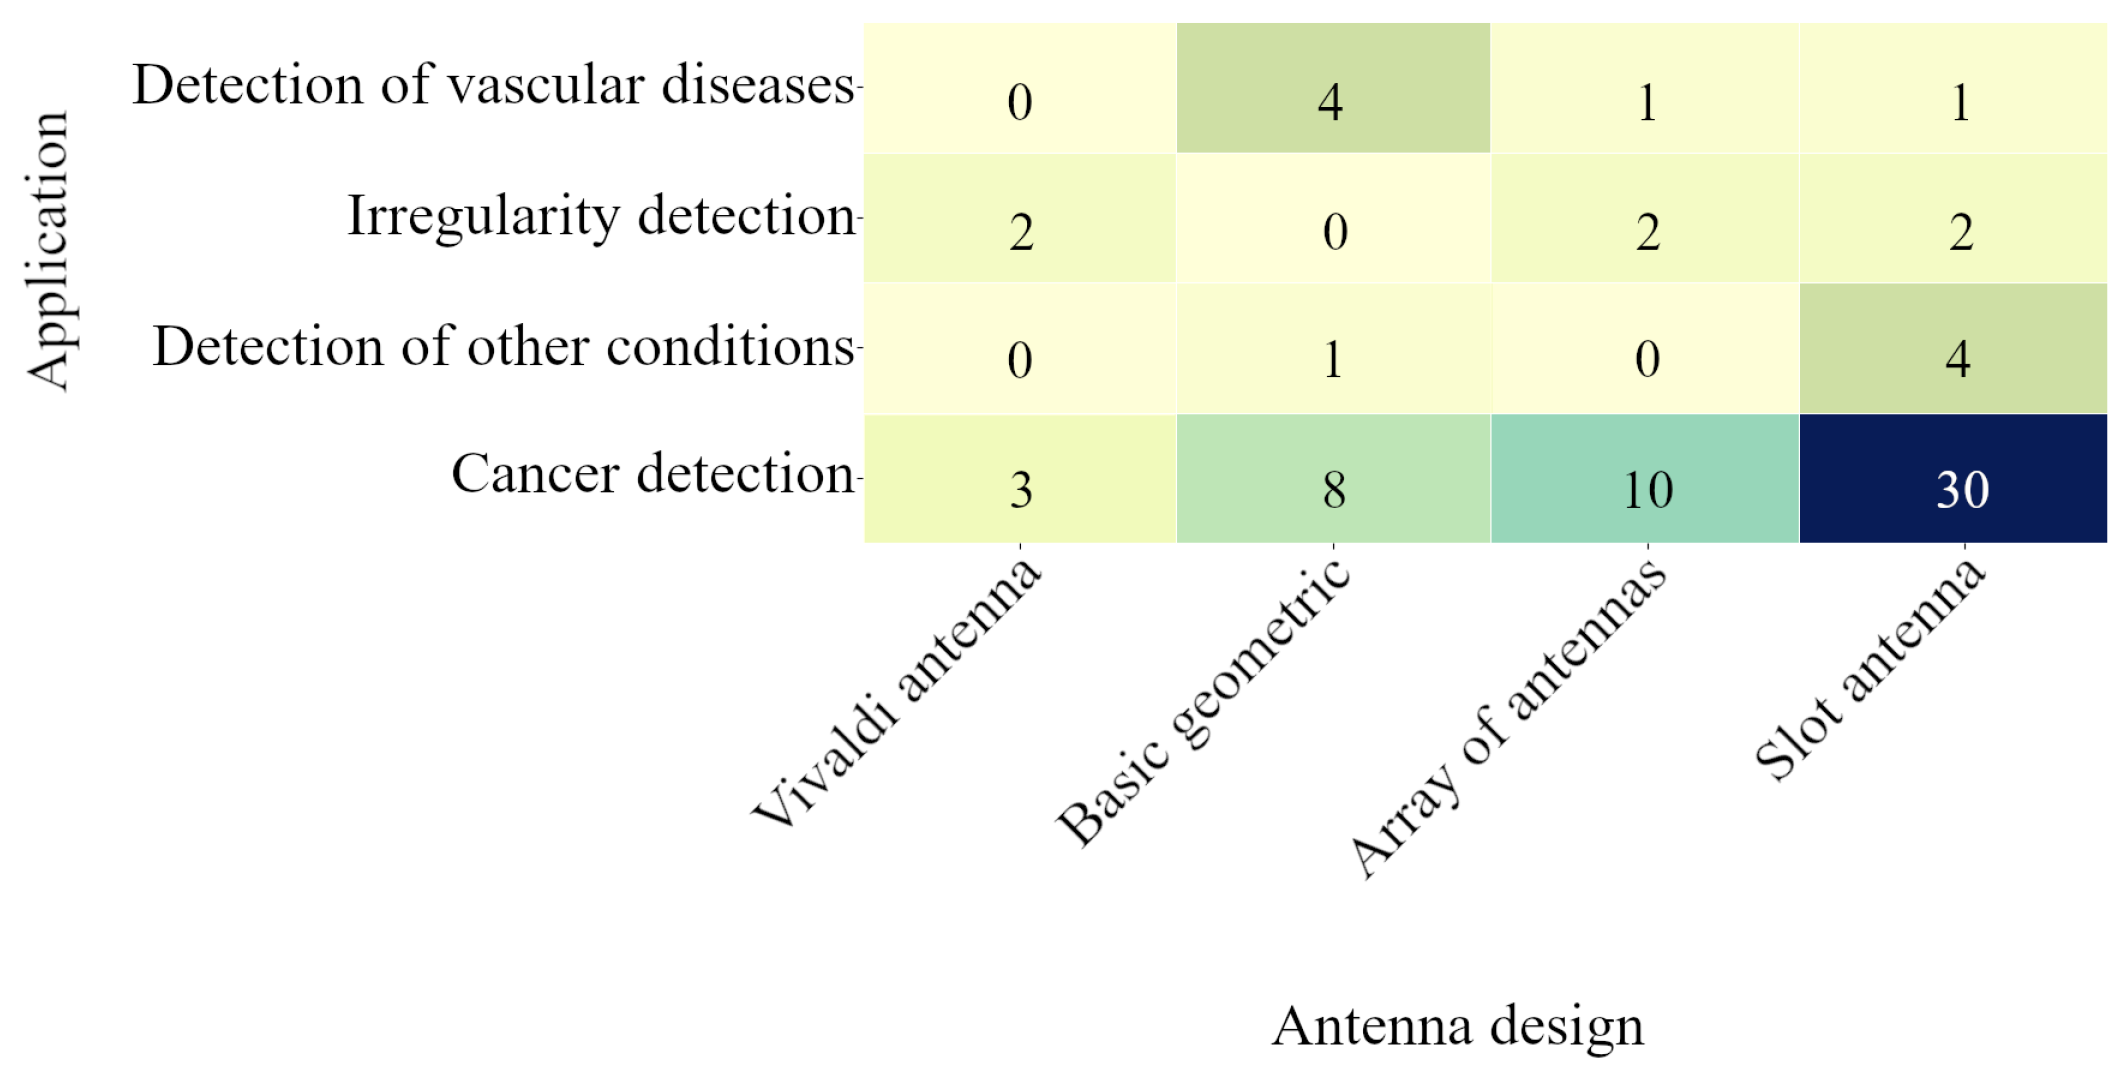
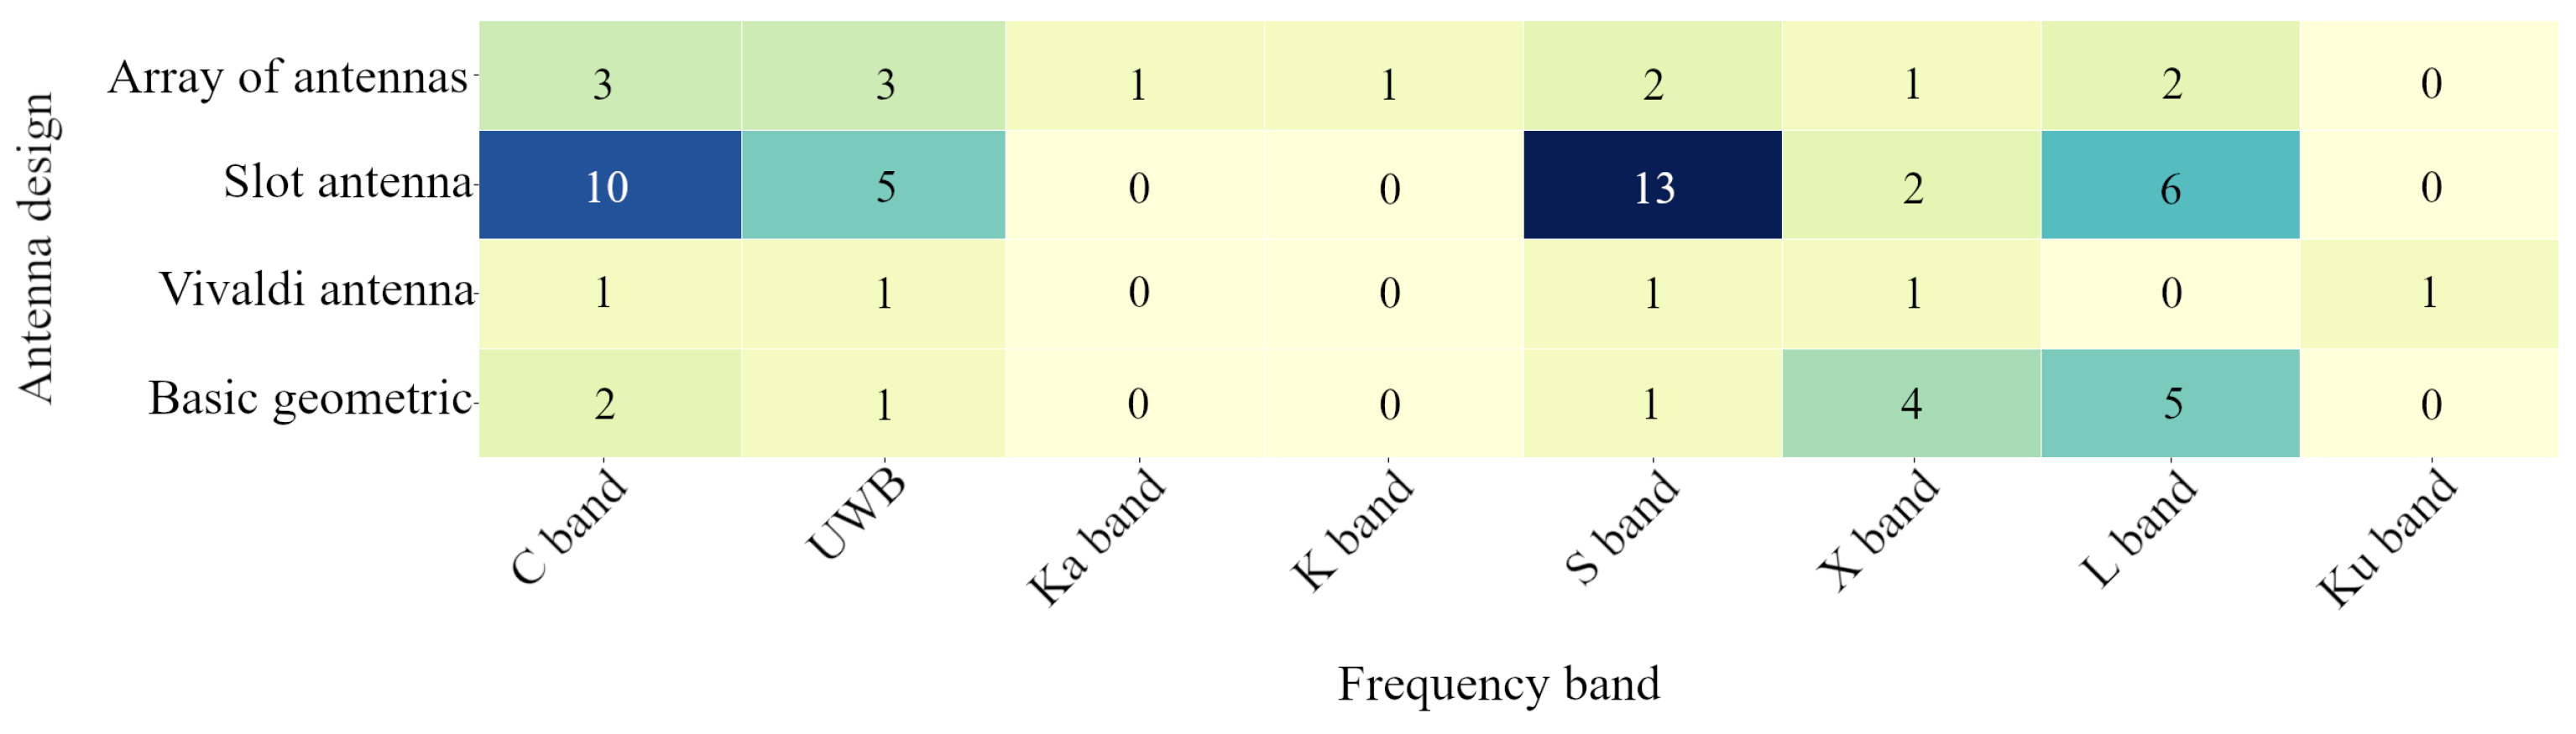
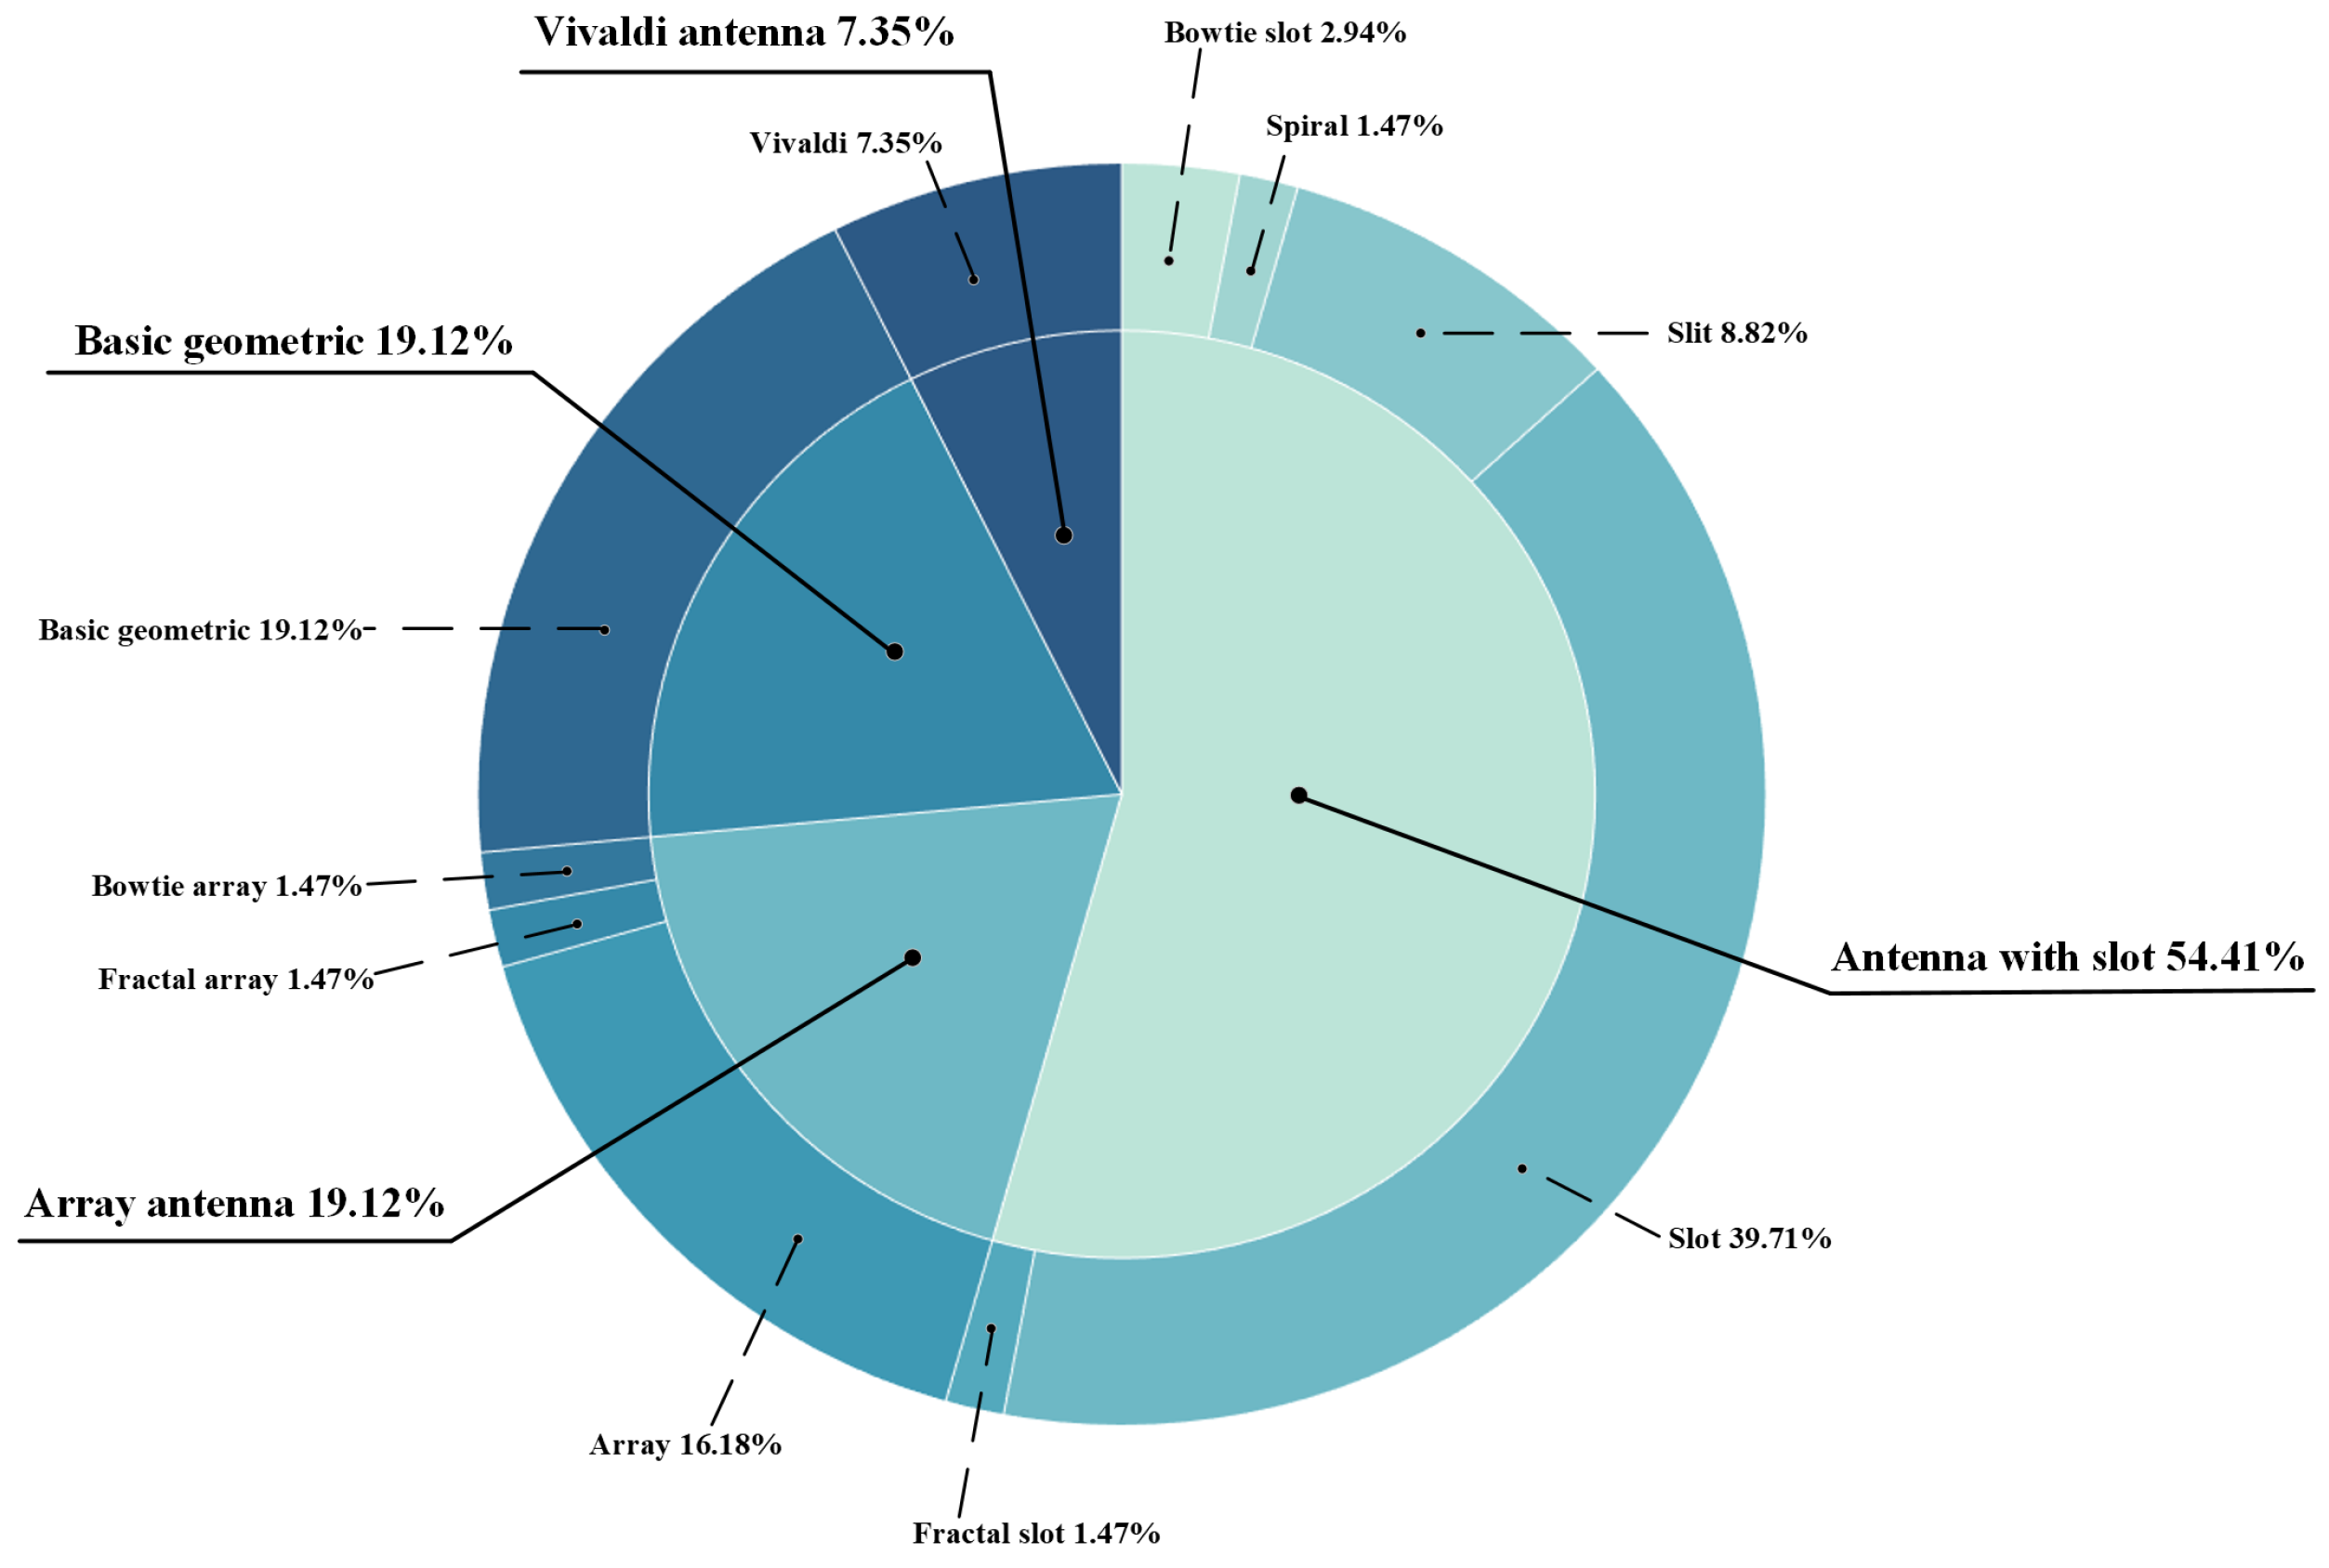
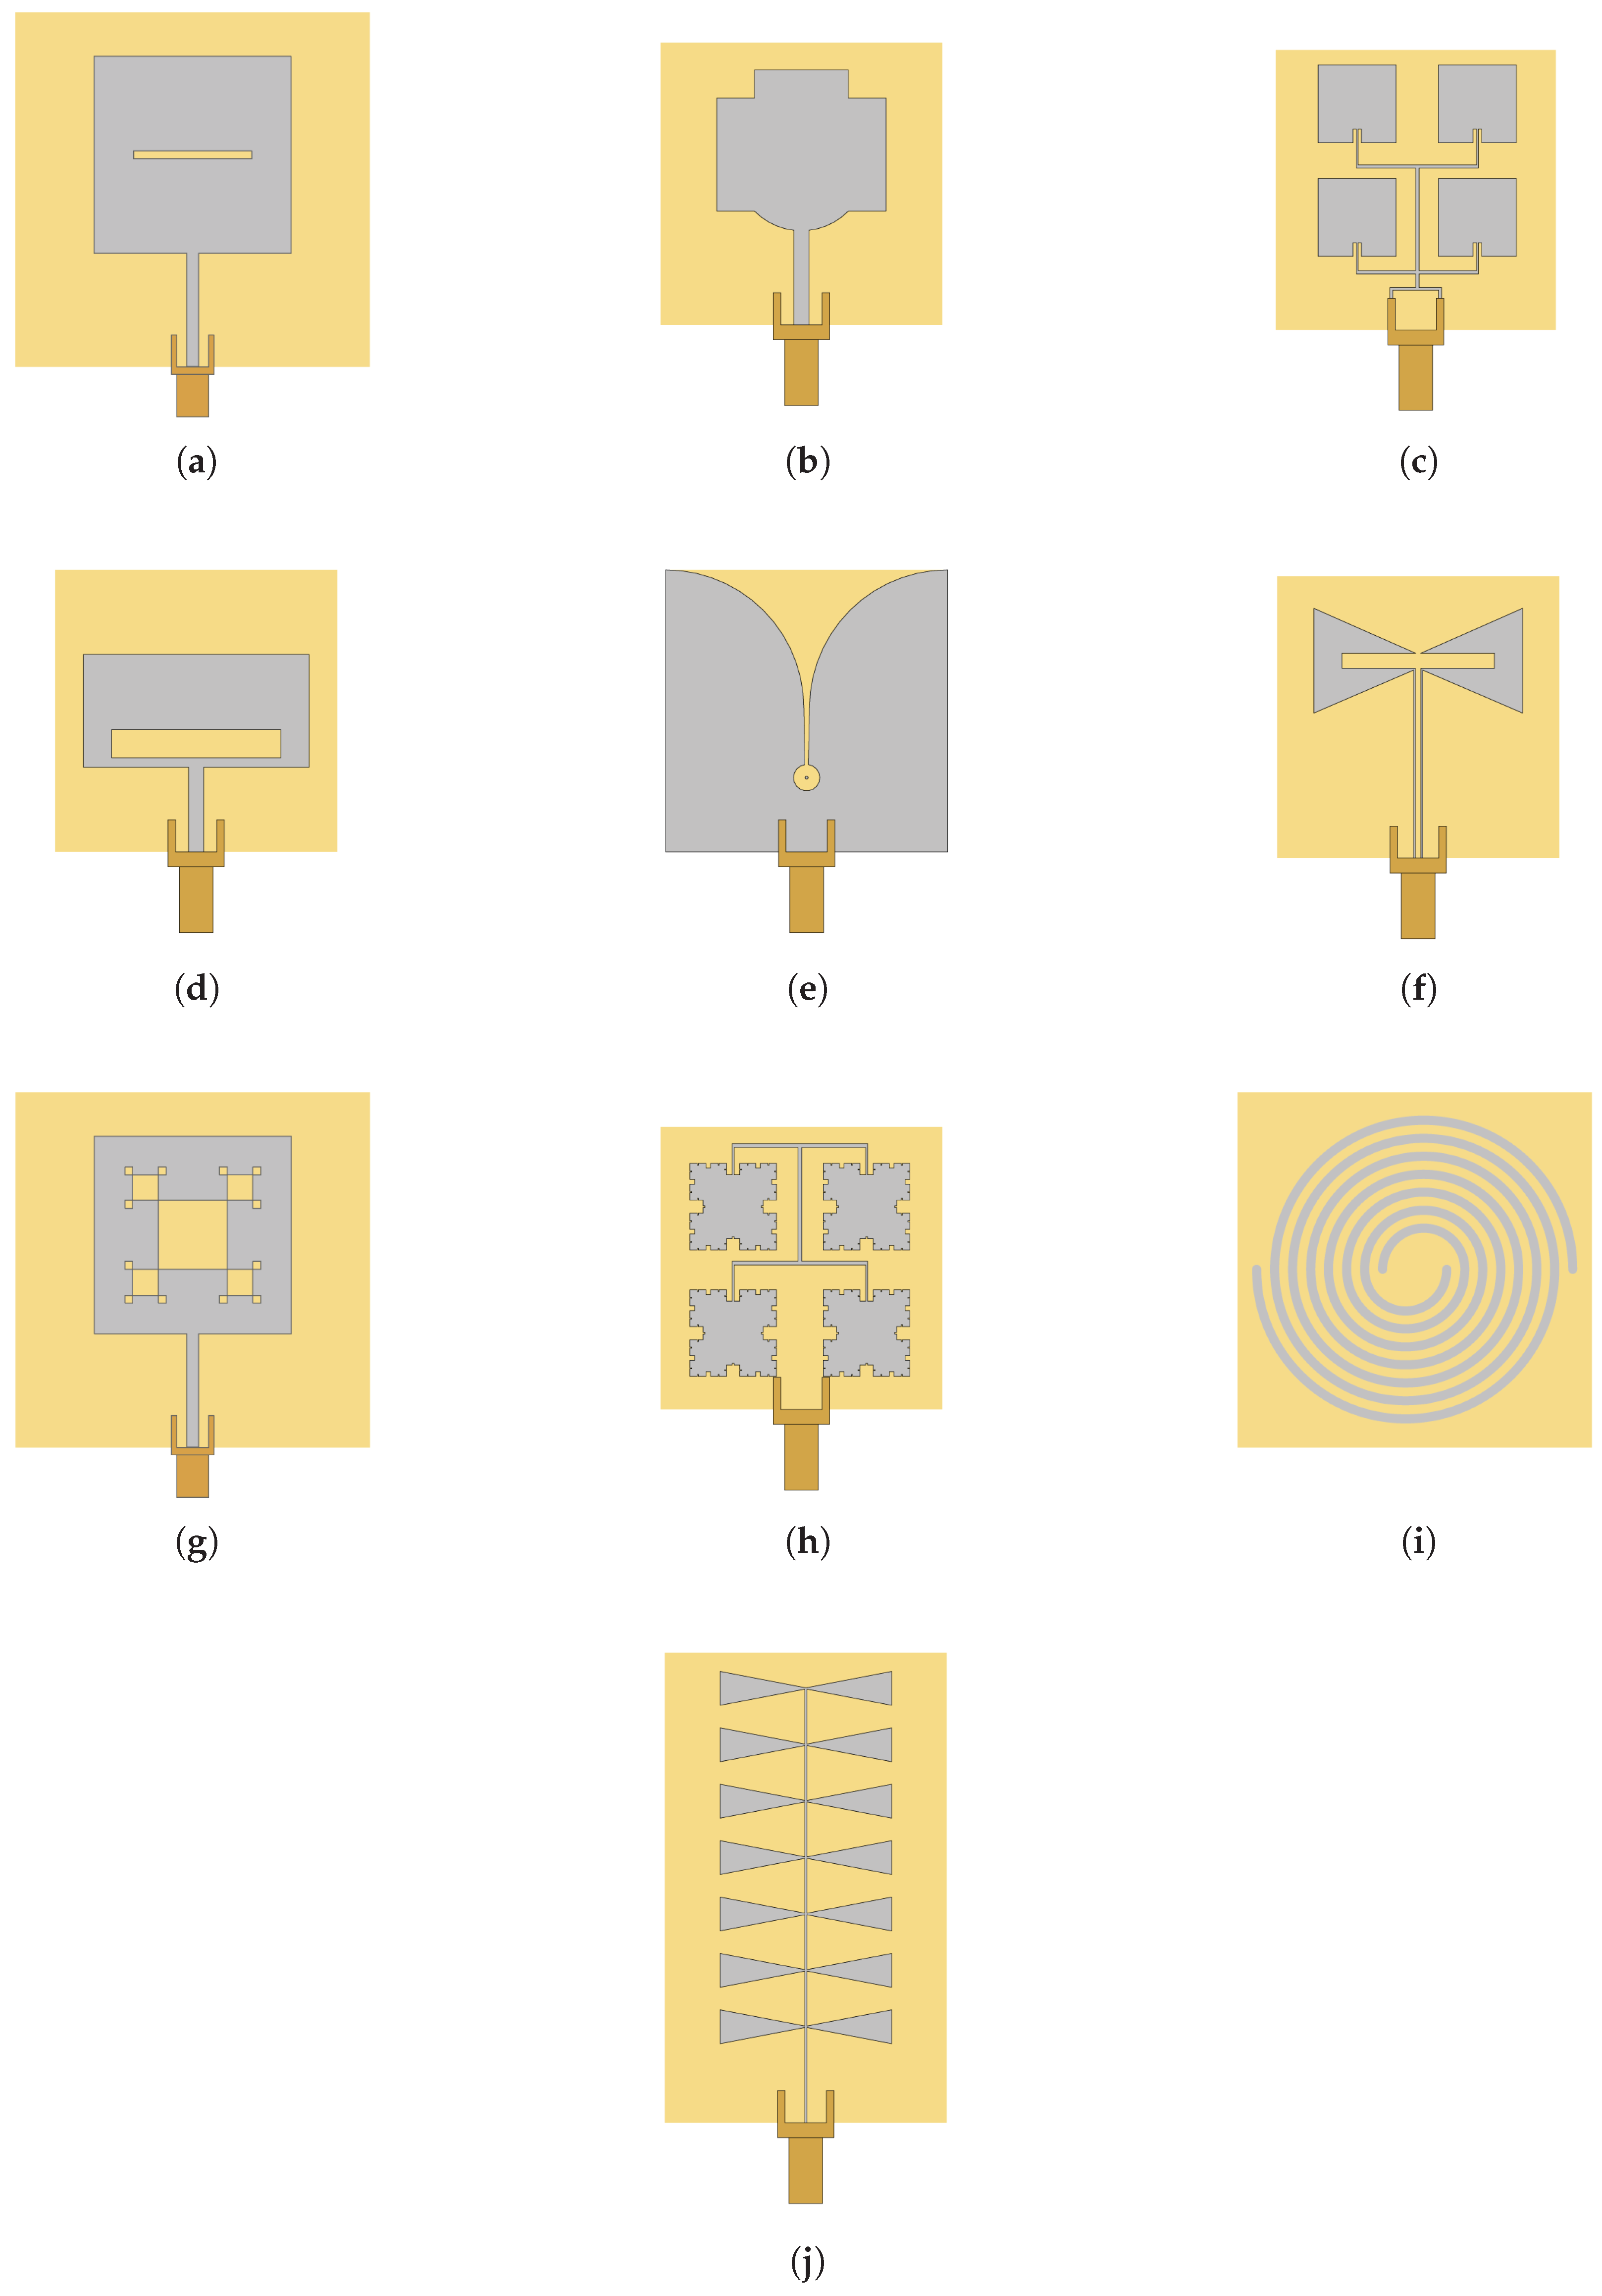
  • Geometries: Predominant shapes included rectangular, circular, and elliptical patches. Some studies also explored more complex designs such as fractal and nature-inspired geometries to enhance performance and adaptability.
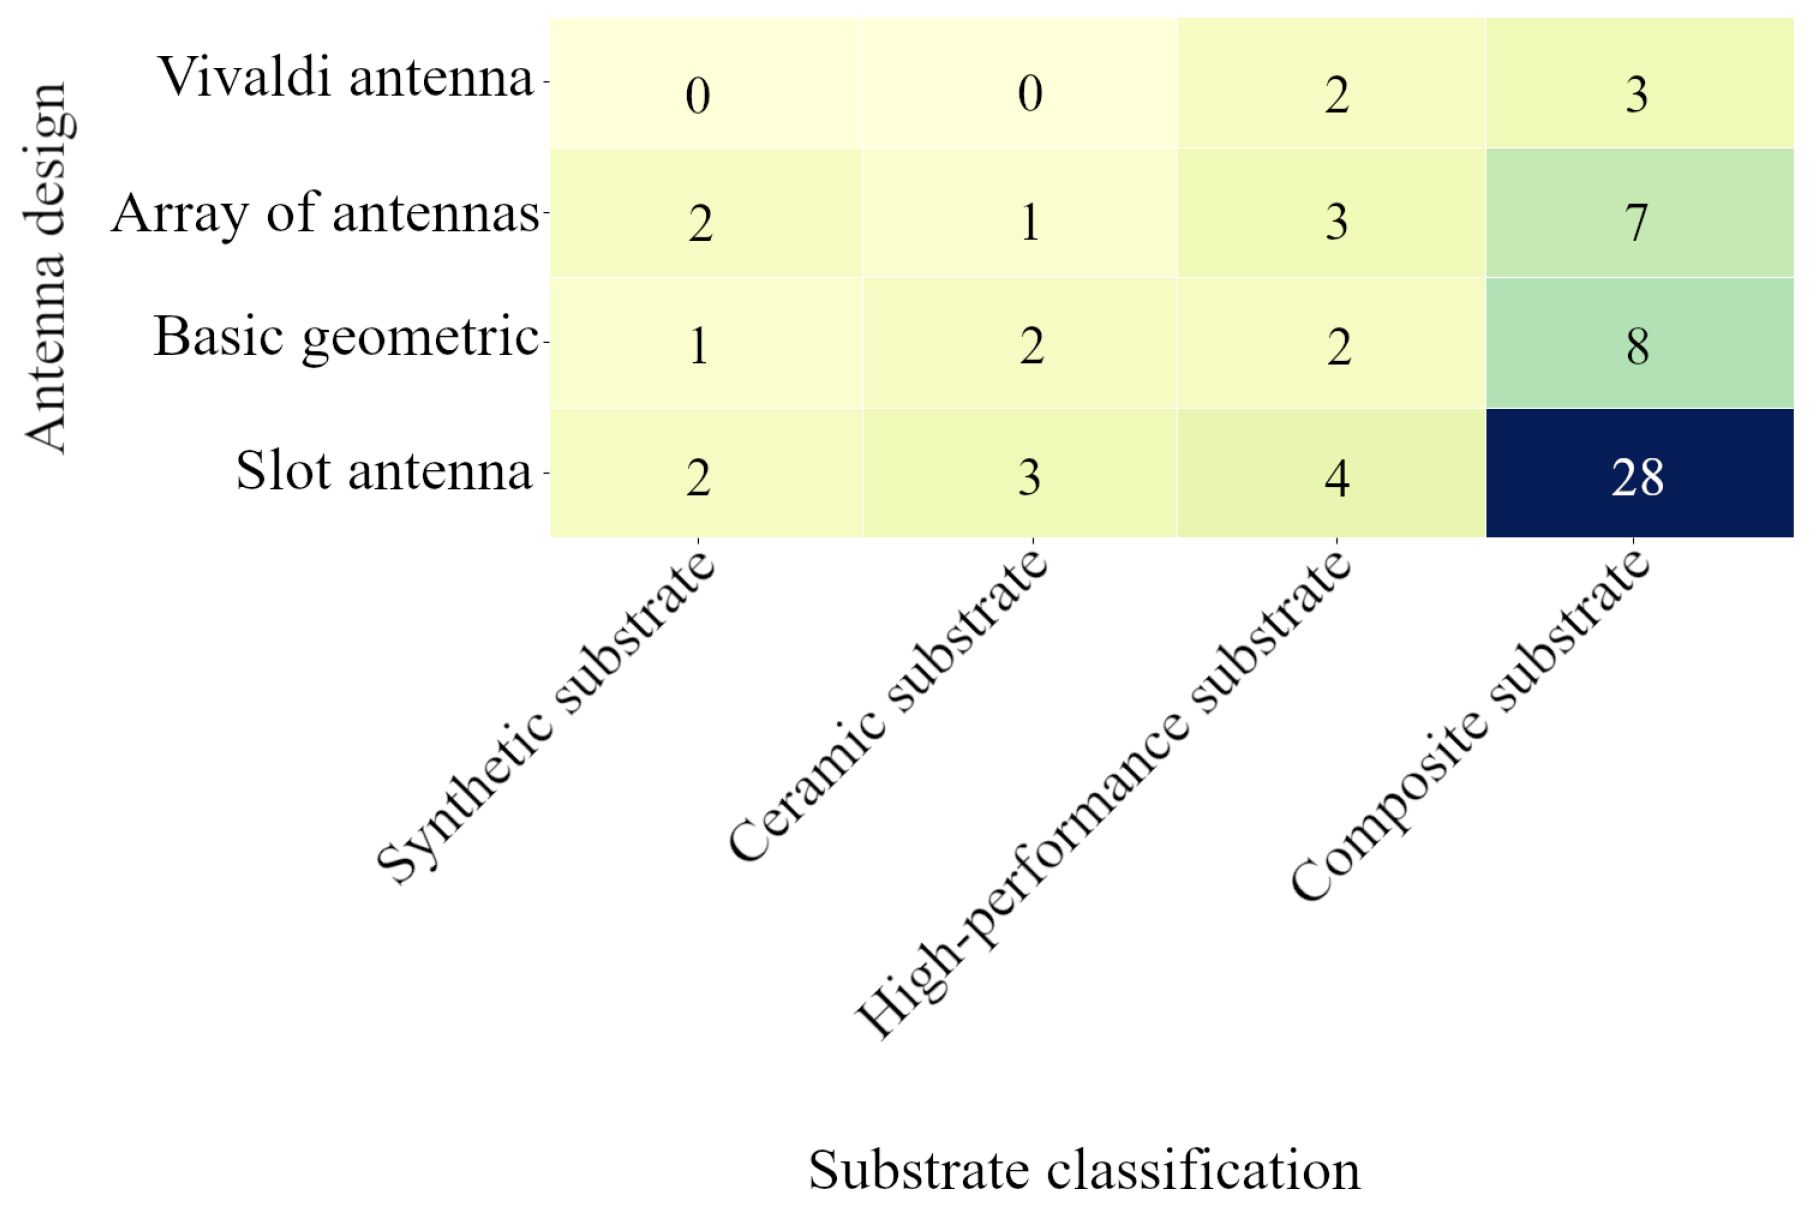
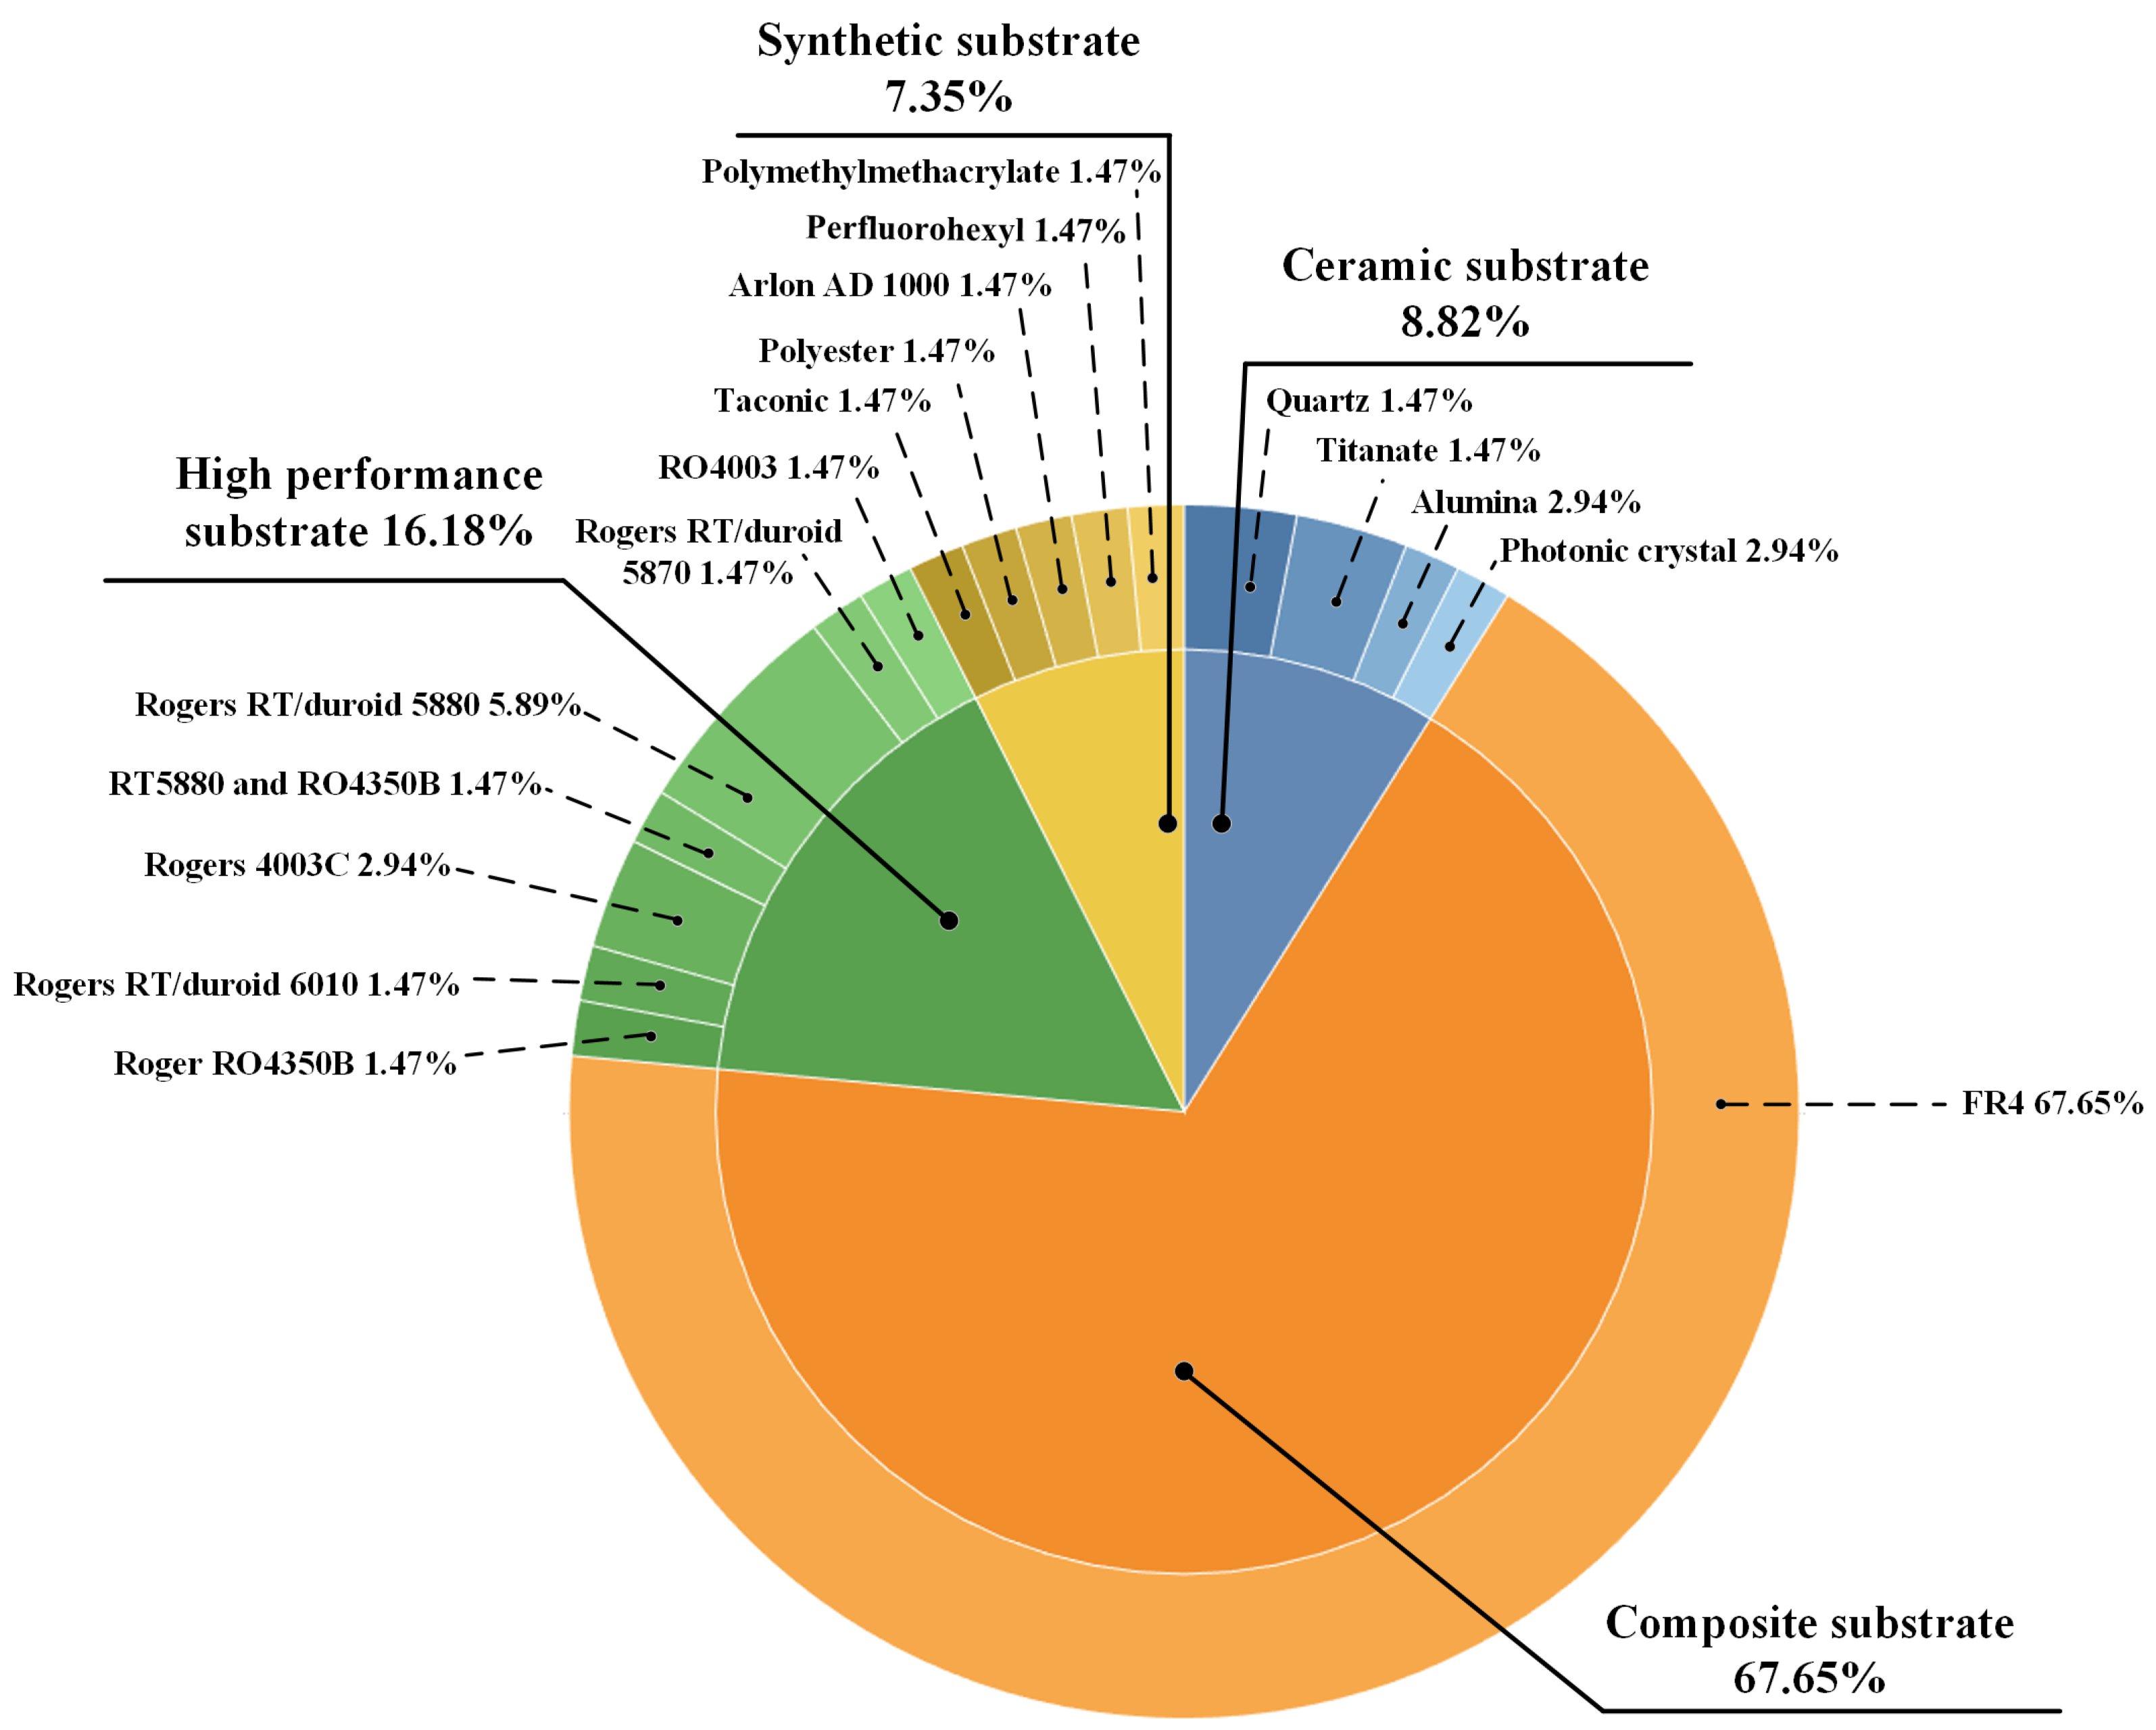
  • Substrate materials: FR4 was the most commonly used substrate due to its low cost and suitable dielectric properties. Other materials included Rogers RT/duroid and various ceramics, which were chosen for their specific electromagnetic characteristics.
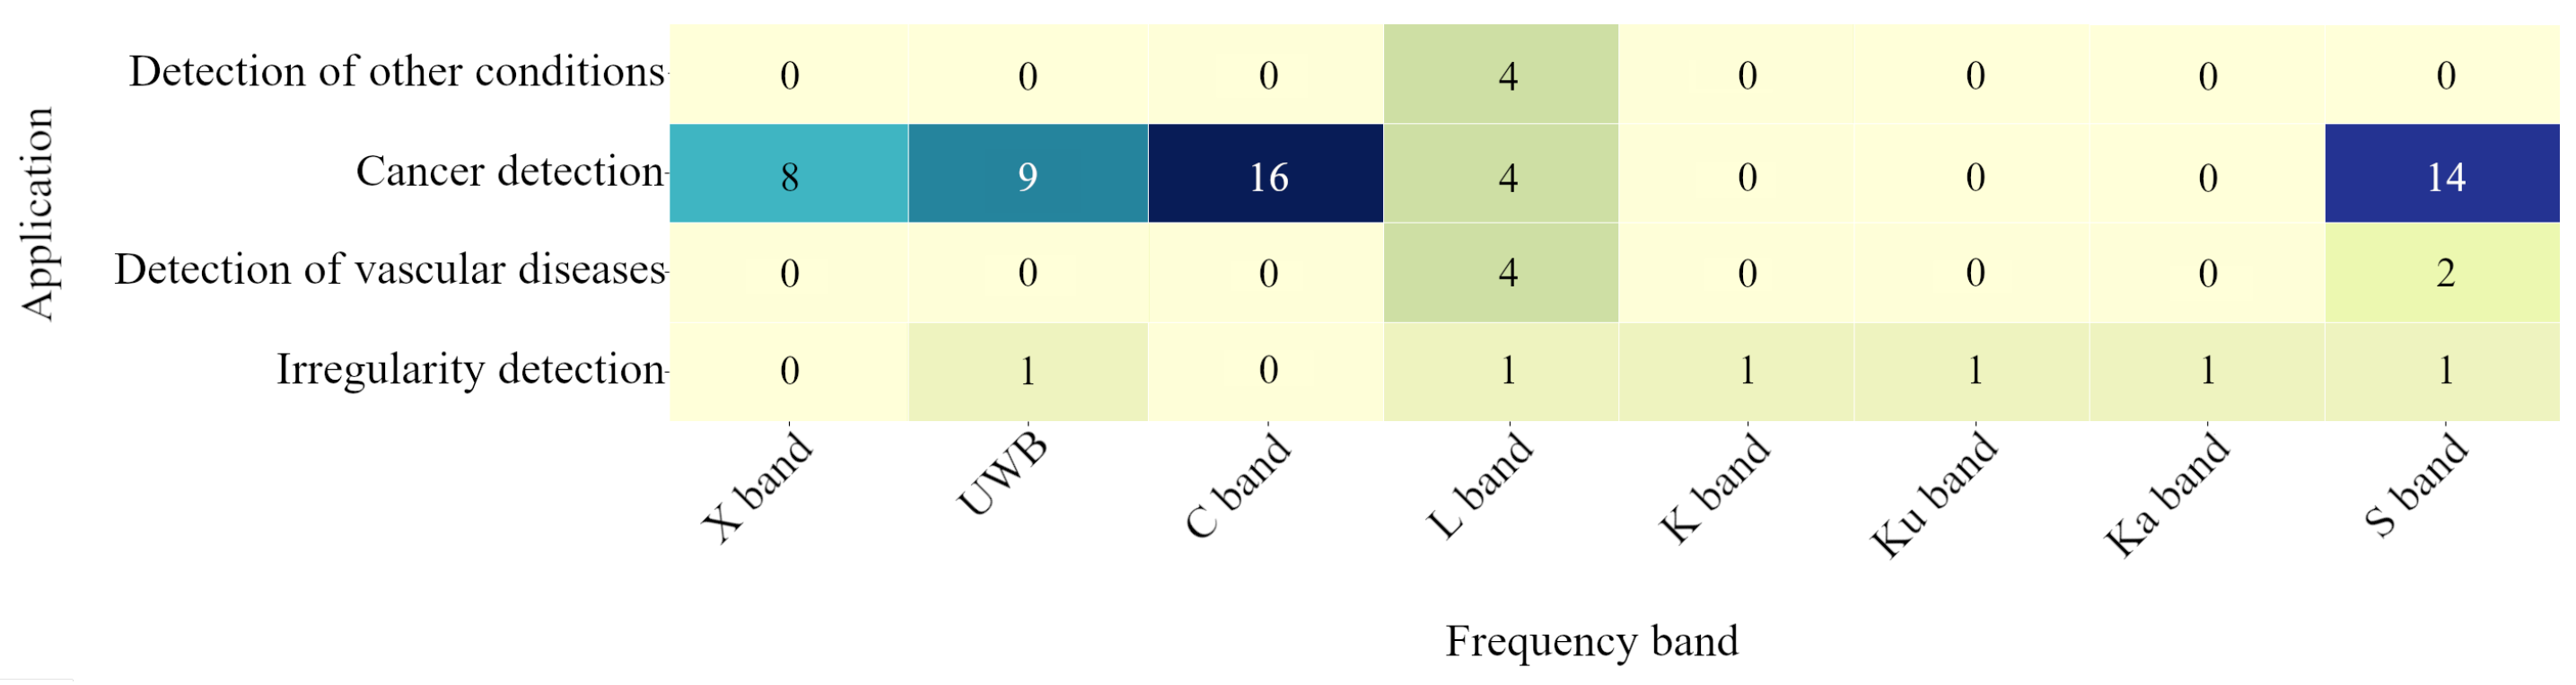
  • Frequency bands: Antennas operated across a wide range of frequencies, spanning from 1 GHz to 30 GHz. The S and C bands were particularly notable for their frequent use in medical applications and offered a balance between penetration depth and resolution.
Understanding design characteristics of microstrip antennas is crucial as they significantly impact antenna performance and the quality of the images obtained. Below, we discuss these design characteristics in detail, focusing on geometric design and the types of substrates used.

4.2. Article Classification by Geometric Design

This criterion identifies the structure type with which microstrip antennas are designed and fabricated, focusing on patch geometric shape and antenna geometric design. In this regard, Figure 4 shows the types classification of patch antenna design where 54.41% (n = 37) are slot antennas, 19.12% (n = 13) are antennas with a basic geometric design, 19.12% (n = 13) are antenna arrays, and 7.34% (n = 5) of articles employ a Vivaldi antenna design. Articles distribution according to structure is shown in more detail in Table 3. In addition, Figure 5 shows reference images of the types of designs identified. These images allow a clearer visual understanding of the designs, although they are only referential since, in their actual dimensions, they are not necessarily functional.
Among the articles on rectangular slot antenna designs (Figure 5a) are the works of Gagandeep and Amanpreet [63] and Mehranpour et al. [60], who propose a U-shaped patch design operating at UWB frequency applied to cancer detection. Samsuzzaman et al. [68] present a U-shaped patch design with a double rectangular slot inside, working on a composite substrate. Meanwhile, Samsuzzaman et al. [97], Hamza et al. [75], and Talukder et al. [84] exhibit a rectangular antenna design incorporating a circular slot in patch center with a circular array of nine antennas. Singh et al. [37] present a patch design with a double circular slot inside and rounded edges on the patch. Lin et al. [61] present a rectangular slot antenna based on a basic monopole with triangular cuts in patch lower corners and some parallel slots. Taleb et al. [42] propose a rectangular antenna design described as a quadratic Bézier spline in which a toroid is inserted into a radiating element with a large radius of 6 mm and a small radius of 2 mm. Meanwhile, Zerrad et al. [93] expose a design consisting of a conical slot, a rectangular slotted patch, and four star-shaped parasitic components. Articles presented by Selvaraj et al. [69], Chouiti et al. [36], and Deepshikha and Rattanadecho [86] describe a patch design with a rectangular geometry and a monopole-type configuration with a rectangular slot inside the patch on an FR4 substrate.
Other slot designs are described by Herrmann et al. [34] and Poorgholam and Zarrabi [90]. They present a simple circular patch design on a synthetic dielectric substrate. Meanwhile, Grover et al. [95] propose a UWB circular antenna that includes a slotted conical key-shaped radiating patch structure. Asok et al. [76] expose a circular patch consisting of two rectangular patches placed on top of each other, with a second patch rotated 45 degrees. A circular ring is added around the structure, which is designed as two concentric circles with different radii.
The article presented by Rokunuzzaman et al. [52] proposes a square antenna design with an inverted F structure, folded and stacked with five layers of FR4 substrate and an additional rectangular cavity at the back. Talukder et al. [64] propose an elliptical patch antenna with multiple rectangular slots on top and a partially slotted ground plane at the substrate bottom. Similarly, Talukder et al. [71] expose an antenna built with a simple elliptical square patch and a modified slotted ground plane to enhance antenna gain. Proposal by Rezaeieh et al. [32] presents a rhombus-shaped design from a traditional wide-slot antenna where four series of ladder-shaped slots are applied on a composite dielectric substrate. The design exposed by Raihan et al. [43] proposes a pentagon-shaped patch structure on an FR4 substrate, where 16 slots were made in a patch to increase the current flow path. Meanwhile, Mahmud et al. [45] expose a broadband antenna designed with a modified oval-shaped patch and a coplanar ground plane with a half-cycle copper strip. Additionally, it incorporates an Artificial Magnetic Conductor (AMC) structure using the coplanar waveguide (CPW) fed radiator.
Subramanian et al. [47] and Zerrad et al. [83] propose a rectangular patch design with a step-shaped slot and a circular slot inside on an FR4 substrate for cancer detection. Article by Alam et al. [85] presents a solid rectangular U-shaped patch antenna loaded with a W-shaped slot on a composite substrate. Nazeri et al. [59] expose an antenna design with several geometric shapes on its patch and two branch strips responsible for resonating at the desired frequencies.
In the second classification, we find articles with rectangular slit antenna designs (Figure 5d) proposed by Mehedi et al. [73], Avşar and Kaya [51], and Asha et al. [79], presenting a rectangular antenna design with slits along the patch contour next to the feed line on a composite substrate. Meanwhile, Komalpreet and Amanpreet [72] exhibit a stacked patch antenna with an inverted U-shaped geometry for an active patch and two L-shaped stubs for a passive patch. The article described by Geetharamani and Aathmanesan [57] presents a design comprising a simple rectangular patch and a rectangular split ring resonator structure at the back with a Perfect Electric Conductor (PEC). Qi et al. [41] propose an antenna with an E-shaped patch structure operating at a frequency of 2.4 GHz applied for anomaly detection.
On the other hand, Ara et al. [80] expose a hybrid design of a Sierpinski fractal circular and rectangular antenna. The antenna consists of a rectangular patch into which a circular patch is inserted and subtracted. The process is repeated for six iterations to obtain the final design.
Alqallaf and Dib [53] and Alqallaf et al. [35] present a bowtie antenna (Figure 5f) created by cutting a triangle in the conductor track center, leaving two symmetrical triangles joined at the base. Feeder starts from the junction center of the two triangles.
In another study, array antennas (Figure 5c) presented by Inum et al. [44], Rezaei et al. [67], and Mohamed Junaid et al. [77] expose a rectangular patch design where the center for both sets is the midpoint line connecting the center of elements with T-shaped junctions. Cicchetti et al. [96] present a series array antenna printed on a Roger dielectric substrate.
An article described by Jamlos et al. [91] proposes an antenna fabricated on reduced graphene oxide (RGO) with a circular shape and a radius of 15 mm. Additionally, there are four circular RGO patches placed on a Taconic substrate. Grover et al. [94] present a patch structure in the form of split rings where two concentric hexagonal structures are added. Additionally, a stepped reduction in the feed line is introduced. Islam et al. [48] expose a UWB antenna composed of a triangular strip feed line and patch connected to four identical SRR (split ring resonator) unit cells. Additionally, a partial ground plane with a rectangular and circular slot is printed on the opposite side of the substrate. Hossain et al. [87] present a stacked structure with three layers, including two air gaps with a spider web-shaped MTM unit cell. Additionally, the main patch is shaped like two triangles in opposite directions.
Jahan et al. [78] present a patch antenna with four octagonal slots extending from outside to inside of the patch. Sreelekshmi and Sankar [88] propose a patch design with a rectangular spiral metamaterial, applying a 45-degree inclined rectangular slot and an outer metal ring. Koutsoupidou et al. [33] expose a triple elliptical patch design with three overlapping ellipses and a “window” with curved corners.
Moussa et al. [89] present a fractal array antenna (Figure 5h) composed of lines, circles, and discs connected in a nested pattern emerging from the feed line. The square shape comprises two opposing ‘E’ shapes and includes a set of connected discs. Additionally, only two discs are connected to the outer strip lines in the outer square.
Naghavi et al. [92] describe a miniaturized bipolar antenna in the shape of a cross with a bowtie patch design (Figure 5j) on a composite substrate. The antenna proposed by Stauffer et al. [31] details a circular antenna with a spiral patch design (Figure 5i) with a diameter of 2.5 cm. Patch antenna designs with geometric shapes (Figure 5b) proposed by Scapaticci et al. [46], Razzicchia et al. [70], and Ahsan et al. [50] present an inverted triangular patch design operating in the L frequency band on an FR4 and Rogers substrate. Sohani et al. [66] propose an isosceles triangular patch design with a fractal ground plane on a composite dielectric substrate.
Articles proposed by Bassi et al. [30], Hammouch and Ammor [56], and Rahman et al. [39] propose a rectangular design with a T-shaped decoupling structure for cancer detection. Naghavi et al. [74] propose a modified elliptical monopole patch antenna fed by CPW, fed vertically by a coaxial port connected to a coplanar waveguide. Meanwhile, Subramanian et al. [81] expose a hexagonal monopole antenna design on a composite dielectric substrate.
The design proposed by Ojaroudi et al. [55] and Ullah et al. [49] present a basic antenna design consisting of a square patch operating in X and L frequency bands, respectively. Hossain et al. [62] expose a semicircular slotted radiating patch along with a trapezoidal ground plane coupled to a conical-shaped microstrip-fed line. Eltigani et al. [40] propose a circular patch design on a titanate substrate.
Finally, articles proposed by Islam et al. [54] and Islam et al. [58] expose a Vivaldi patch design (Figure 5e) with 12 complementary split ring resonator (CSRR) cells and rectangular lateral slots. Gopikrishnan et al. [65] present a Vivaldi antenna with eight slit-shaped slots with an exponential profile to achieve UWB. Meanwhile, Blanco-Angulo et al. [82] and Akhter et al. [38] present a basic Vivaldi design on an FR4 substrate for cancer and anomaly detection, respectively.

Article Classification by Substrate Material

This criterion aims to show different types of substrates that are fundamental in the design and performance of microstrip antennas. A substrate provides structural support and electrically isolates the antenna from its environment, affecting its characteristics. Additionally, its choice depends on several factors such as operating frequency, expected gain, directivity, application medium, among others.
Figure 6 shows article classification by substrate types, where 67.65% (n = 46) are composite substrates, 16.18% (n = 11) are high-performance substrates, 8.82% (n = 6) are ceramic substrates, and 7.35% (n = 5) are synthetic substrates. The details of the articles that belong to each classification are shown in Table 4.
To provide a more comprehensive view of the substrates used in antennas, Table 5 presents a summary of the dielectric substrates employed, the permittivity of each material, and the thickness of each analyzed article.
The most used substrate in patch antenna construction is FR4 due to its low cost and ease of manipulation. While it is common to find works developed with this material, we can identify and highlight some that stand out for how they use FR4 in a multilayer configuration or achieve outstanding performance. Among the works with relevant information about composite substrates is one proposed by Ahdi et al. [32], which references FR4 as a material with good dielectric properties, low cost, and convenient for manufacturing multilayer PCBs. Meanwhile, Grover et al. [95] design a UWB antenna using the FR4 substrate with a dielectric value of 4.4 to improve the operating frequency range. Subramanian and Nirmal [47] use FR4 dielectric substrate of an octagonal antenna design, noting that substrate thickness changes the antenna’s efficiency and gain.
On the other hand, the articles described by Alqallaf et al. [35] and Koutsoupidou et al. [33] use an alumina substrate because it has a dielectric permittivity of 9.4 and a loss tangent of 0.006, used for cancer detection. Sreelekshmi et al. [88] present Arlon AD1000 substrate material with a dielectric value of 10.2, making it an excellent option for portable applications, allowing significant antenna miniaturization. Poorgholam and Zarrabi [90] apply a cylindrical quartz disc with a thickness of 10 mm and a permittivity of 3.75 for skin cancer detection. Rahman et al. [39] used a flexible and biodegradable organic material called perfluorohexyl as a substrate for the designed antenna, aiming to develop an antenna that can be integrated into a wearable bra, taking advantage of its suitable mechanical and electromagnetic properties for cancer detection.
Essential studies on ceramic substrates include those proposed by Geetharamani et al. [57] and Ullah et al. [49], which use a photonic crystal substrate in patch antenna design. It is highlighted that it contains unique properties and offers several advantages for application in breast cancer detection. Meanwhile, the article presented by Lin et al. [61] features an antenna that uses polyester fabrics and conductive copper taffeta fabric on a monopole structure base for detecting bone fractures.
Cicchetti et al. [96] designed a series patch printed on a Roger RO4350B dielectric substrate with a dielectric permittivity of 3.66, a thickness of 30 mm, and a loss tangent of 0.0037, which is applied to a radar system suitable for real-time applications such as monitoring people and objects. Taleb et al. [42] present the RO4003 dielectric substrate with a dielectric permittivity of 3.34 and a thickness of 0.794 mm, where a toroid is inserted into a radiating element for breast cancer detection. Articles by Bassi et al. [30] and Rezaei et al. [67] use a Roger RO4003C laminated substrate in antenna prototype with a dielectric constant of 3.55, 20 mm thick copper coating on substrate top and bottom, and a loss tangent of 0.0027.
Islam et al. [54], Zerrad et al. [93], and Singh et al. [37] use a Rogers RT5880 substrate in antenna structure as an intermediate layer between radiating elements, with a permittivity of 2.2 and a loss tangent of 0.009 for cancer detection. Meanwhile, Razzicchia et al. [70] employ the same Rogers RT5880 dielectric substrate in a triangular antenna design for stroke detection. The Rogers RT/duroid 6010 substrate described by Mehranpour et al. [60] is used in a low-profile aperture-stacked patch antenna (LP-ASP) design with a cavity-backed structure, operating from 2.2 GHz to 13.5 GHz for cancer detection. Jamlos et al. [91] use Taconic substrate material because it improves the directivity and performance of the designed antenna.
The titanate substrate proposed by Eltigani et al. [40] is described as a special material due to its relatively high dielectric constant and low dielectric loss for cancer detection. The article by Herrmann et al. [34] uses a polymethyl methacrylate dielectric substrate to reduce circular antenna diameter to fit the TW primate system (TWPS). Hossain et al. [87] use cost-effective Rogers substrate materials. The top and intermediate layers are made of RT5880, and the bottom layer is made of RO4350B substrate material, achieving high radiation efficiency and gain with a high fidelity factor. Finally, the article described by Islam et al. [58] uses a Rogers RT-duroid 5870 dielectric substrate with a substrate height of 1.57 mm and 35 µm of copper on both sides. Relative permittivity is 2.33, and loss tangent is 0.0012, which reduces the antenna’s dimensions.

4.3. RQ2.Which Algorithms Are Most Commonly Employed for Image Reconstruction Using Microstrip Antennas?

Image acquisition involves a process of data collection from electromagnetic signals that are reconstructed into images. This development is done through image reconstruction algorithms, which are sets of mathematical and computational analyses designed to convert collected signal data into clear and efficient images [98]. These algorithms apply methods or techniques to transform data into 2D or 3D images [99].
In CMI systems, algorithms based on received signals summation are applied and are classified as adaptive data beamforming (DA) algorithms, data-independent beamforming (DI) algorithms, and artifact elimination algorithms [100].
Our review identified several key algorithms frequently used for image reconstruction with microstrip antennas. The most prominent ones include the following.

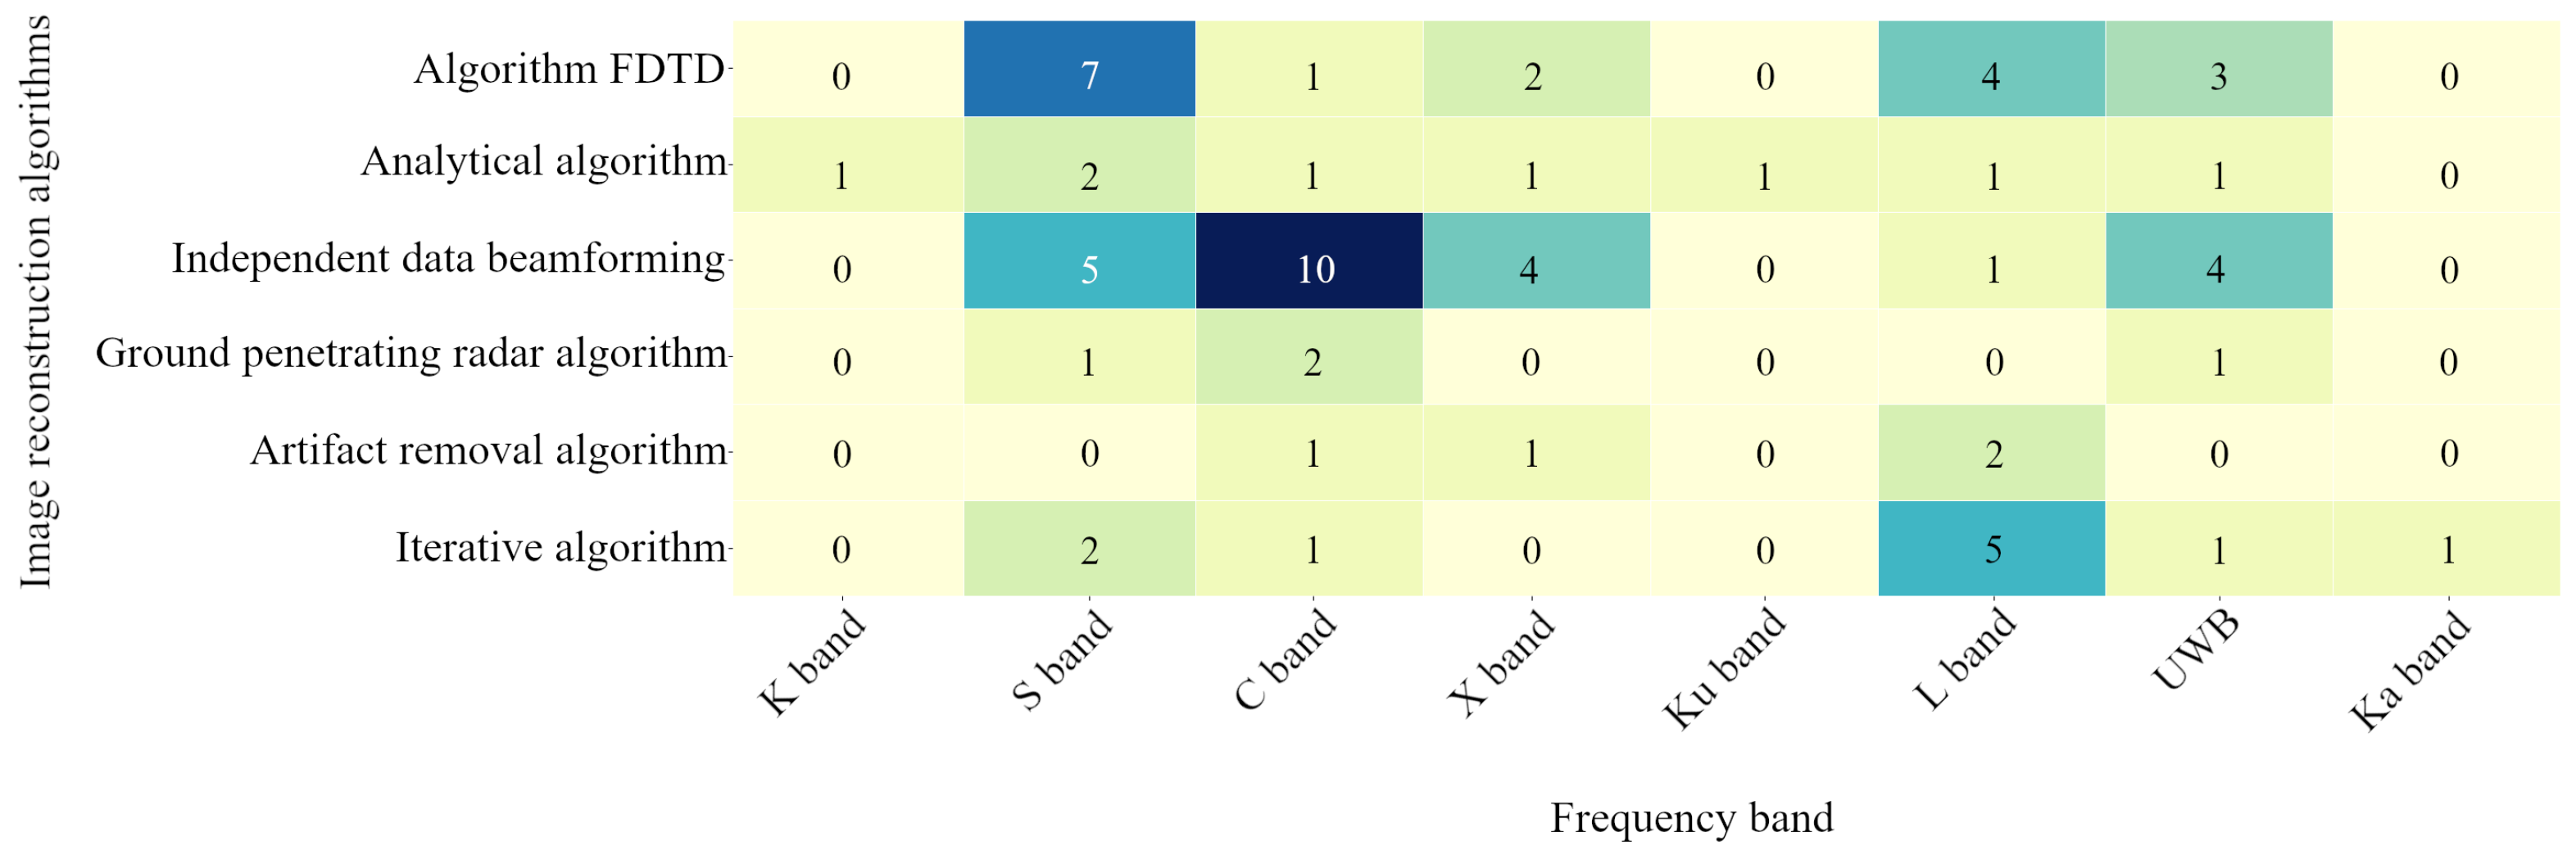
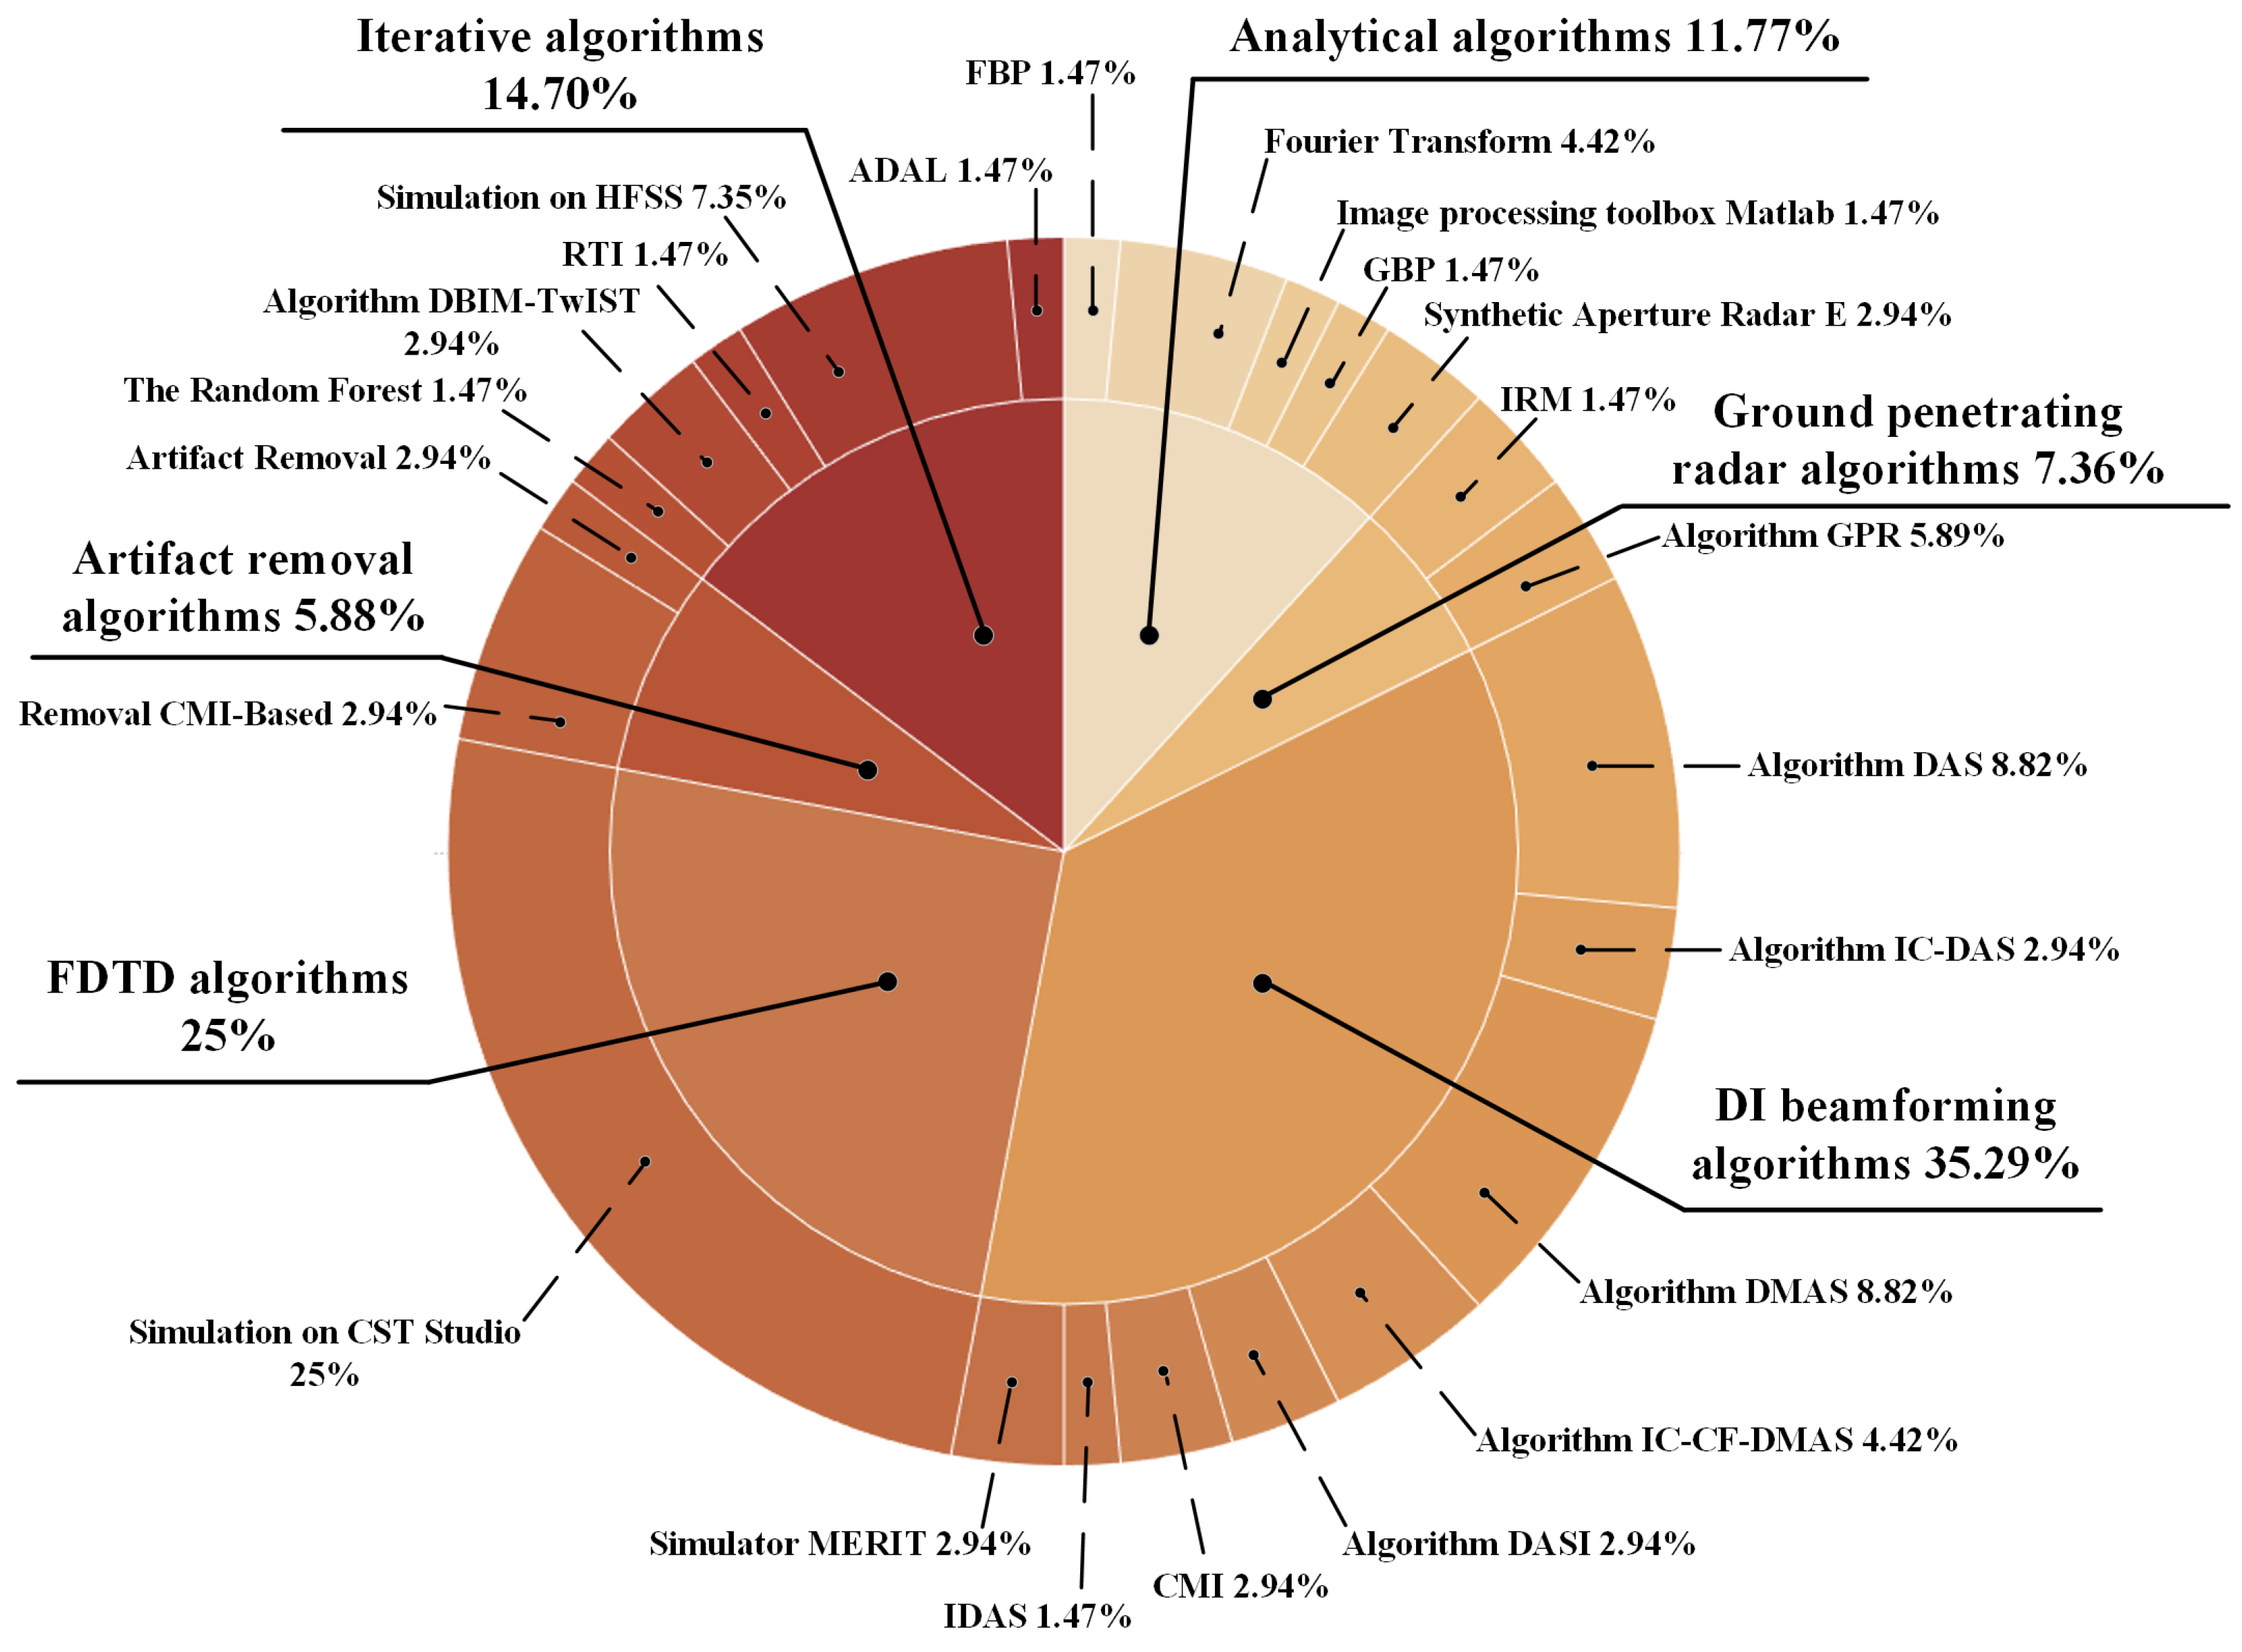
4.3.1. Data-Independent Beamforming (DI) Algorithms

Data-Independent Beamforming (DI) algorithms are used to enhance the quality and resolution of images obtained by forming radiation beams [101]. These algorithms are used to combine signals received by multiple antenna elements to form beams focused in specific directions. By processing them optimally, reconstructed image quality is improved, obtaining the required information [102]. Algorithms in this set include the following:
  • Delay-and-Sum (DAS) algorithm.
It is a synthetic focusing technique that divides into a large number of focal points, where signals are focused at each focal point through temporal alignment, then sums and integrates received signals into an image [101]. DAS algorithm improves the contrast of images obtained by various sensors, allowing for highlighting features of interest in the image as it focuses in a specific direction [103].
DAS algorithm enhances the image contrast obtained from multiple sensors, allowing specific features to be highlighted by focusing in a particular direction. In contrast, the back projection distributes collected signals within a space defined by trajectories to reconstruct complete images, commonly applied in computed tomography. Although both methods share the principle of temporal alignment to improve resolution, DAS is more efficient for real-time processing, whereas the back projection provides higher accuracy at the expense of increased computational cost.
General equation:
I ( r ) = i = 1 M b i ( τ i ( r ) ) 2
where
I ( r ) represents the intensity at the focal point r = ( x , y , z ) .
M denotes the total number of sensors or channels.
b i corresponds to the backscattered signal recorded by sensor i.
τ i ( r ) is the delay time required for the signal to travel back and forth between the focal point r and antenna i.
Delay time:
τ i ( r ) = | | r r i | | c
where
| | r r i | | represents the distance between antenna i and the focal point r.
c denotes the propagation speed of the wave in the medium.
DAS in the Discrete-Time Domain
In an algorithm’s digital implementation, the equation is expressed in terms of temporal discretization:
b ( k T o ) = n = 1 N E a n x n ( k T o M n T i )
where
b ( k T o ) represents the beamformer output at time instant k T o .
a n is a weighting coefficient applied to the signal from sensor n.
x n ( k T o M n T i ) denotes the signal from sensor n delayed by M n T i
  • Delay-Multiply-And-Sum (DMAS) algorithm
The DMAS algorithm is defined as an enhanced variant of the DAS algorithm, which leverages multiple distributed apertures to combine information from various arrays and generate a composite beam [104]. This approach improves resolution and detection capability, making it particularly effective in radar applications that demand high resolution in complex environments [105].
Estimation of the scattered energy signal:
y D M A S [ n ] = i = 1 M j = 1 , j i M x i [ n ] x j [ n ]
where
y D M A S is the estimated energy signal.
M is the total number of observations.
x i is the i-th observation after time alignment according to the focal point.
Definition of temporally aligned observation:
x i [ n ] = x ^ i [ n + τ i ] , i = 1 , , M , 0 n W
x ^ i [ n ] represents the i-th observation before alignment.
τ i denotes the round-trip delay from the transmitting antenna to focal point and back to the receiving antenna.
W is the window length within which the response from the focal point is expected.
Calculation of final output value of DMAS:
O D M A S = n = 1 W y D M A S [ n ] = n = 1 W i = 1 M j i M x i [ n ] x j [ n ]
DMAS considering uncorrelated white noise:
y D M A S [ n ] = i = 1 M j = 1 , j i M s 2 [ n ] + 2 ( M 1 ) s [ n ] i = 1 M n i [ n ] n j [ n ]
Fourth order version of DMAS (DMAS-D4):
y D M A S D 4 [ n ] = i = 1 M j = i + 1 M k = j + 1 M l = k + 1 M x i [ n ] x j [ n ] x k [ n ] x l [ n ]
  • Improved Delay-And-Sum (IDAS) algorithm
The IDAS algorithm enhances DAS algorithm by achieving higher image resolution [106]. It follows the same principle as DAS, delaying signals received by sensor elements before summing them to form the beam. However, it incorporates more advanced and precise calculation methods to determine the necessary time delays for optimal temporal alignment of received signals [103].
General formula for IDAS beamformer:
I ( r ) = Q F ( r ) · 0 T w i n n = 1 M ( M + 1 ) / 2 w n S n ( t τ n ( r ) ) 2 d t
where
Q F ( r ) represents the Quality Factor, which measures the signals coherence at the focal point r.
w n is a weighting factor applied to each signal.
S n ( t τ n ( r ) ) denotes the received signal with a specific delay τ n ( r ) .
T w i n is the time window over which integration is performed.
Calculation of the Quality Factor (QF):
Quality Factor is obtained by fitting a coherent sum energy curve of the received signals to a quadratic function:
y = a x 2 + b x + c
where
Energy curve is normalized using 1 / ( 1 + σ e ) , where σ e represents the standard deviation of the energy.
Coefficient a is selected as the Quality Factor (QF) of the focal point r.
  • Coherence Factor Based Delay-And-Sum (DF-DAS) algorithm
The DF-DAS algorithm scales individual signals, using a weighting factor based on propagation path length between focal point and each antenna [101]. Shorter paths provide a clearer view of focal point, minimizing phase and attenuation effects and reducing the likelihood of encountering heterogeneity [107].
General equation:
S ( r ) = C F ( r ) i = 1 N x i ( t τ i )
where
S ( r ) represents the reconstructed signal at position r.
C F ( r ) is the coherence factor that adjusts each sensor’s contribution.
x i ( t τ i ) denotes the signal received by sensor i with a delay τ i .
N is the total number of sensors.
The coherence factor (CF) can be calculated as follows:
C F ( r ) = i = 1 N x i ( t τ i ) i = 1 N x i ( t τ i )
  • Delay-And-Sum Integration (DASI) algorithm
The DASI algorithm is a monostatic beamforming technique for confocal microwave imaging systems that involves time shifting and summing the signals sent from the object [108]. The result of this process is squared and integrated within a specific time window to recreate a synthetic focus; additionally, if there is a tumor at a focal point, the return signals will sum coherently [101].
Basic equation of the algorithm:
S ( r ) = i = 1 N w i t 0 t f x i ( t τ i ) d t
where
S ( r ) represents the reconstructed signal at position r.
w i denotes the weights applied to each sensor.
x i ( t τ i ) is the signal received by sensor i with a delay τ i .
N is the total number of sensors.
t 0 and t f are the integration limits in the time domain.

4.3.2. Artifact Elimination Algorithms

This algorithm type involves methods used to mitigate unwanted distortions present in reconstructed images. These distortions can arise from various factors during the image acquisition process, such as noise in the input data, interference, or measurement errors, and data regularization [109]. This technique involves image filtering, error correction, and a combination of multiple methods to improve image quality [110].
Several processes are applied until clearer and sharper images are obtained, resulting in a more accurate representation of the original image.
Signal averaging for artifact reduction:
S a v g ( t ) = 1 N i = 1 N S i ( t )
where
S a v g ( t ) represents the averaged signal.
S i ( t ) denotes the signal from sensor i.
N is the total number of sensors or acquisitions.
Independent Component Analysis (ICA) for artifact removal:
X = A S
where
X represents the observed (mixed) signal.
A denotes the mixing matrix.
S corresponds to the source signal without artifacts.
Wavelet-based artifact removal:
S c l e a n ( t ) = k = 1 K w k ψ k ( t )
S c l e a n ( t ) is the signal after artifact removal.
w k represents the wavelet transform coefficients.
ψ k ( t ) are the basis functions of the wavelet transform.

4.3.3. Finite Difference Time (FDTD) Algorithms

The FDTD method is widely used in antenna design, computational optics, and modeling microstructured systems. It is a numerical technique used in electromagnetism to solve partial differential equations in Maxwell’s equations that define wave propagation in a 3D space [111]. This process involves calculating the electric and magnetic fields at each mesh point based on their current values, allowing for the simulation of electromagnetic wave propagation through dispersive media. Due to its versatility, computational efficiency, and ability to solve physical problems, it has become very popular and reliable [112].
In Computed Axial Tomography (CAT) systems, algorithms applied for image reconstruction are based on the back projections and are classified into two categories: analytical algorithms and iterative algorithms.
Electric field:
E x n + 1 ( i , j , k ) = E x n ( i , j , k ) + Δ t ϵ H z n ( i , j , k ) H z n ( i , j 1 , k ) Δ y H y n ( i , j , k ) H y n ( i , j , k 1 ) Δ z
E y n + 1 ( i , j , k ) = E y n ( i , j , k ) + Δ t ϵ H x n ( i , j , k ) H x n ( i , j , k 1 ) Δ z H z n ( i , j , k ) H z n ( i 1 , j , k ) Δ x
E z n + 1 ( i , j , k ) = E z n ( i , j , k ) + Δ t ϵ H y n ( i , j , k ) H y n ( i 1 , j , k ) Δ x H x n ( i , j , k ) H x n ( i , j 1 , k ) Δ y
Magnetic field:
H x n + 1 / 2 ( i , j , k ) = H x n 1 / 2 ( i , j , k ) + Δ t μ E y n ( i , j , k + 1 ) E y n ( i , j , k ) Δ z E z n ( i , j + 1 , k ) E z n ( i , j , k ) Δ y
H y n + 1 / 2 ( i , j , k ) = H y n 1 / 2 ( i , j , k ) + Δ t μ E z n ( i + 1 , j , k ) E z n ( i , j , k ) Δ x E x n ( i , j , k + 1 ) E x n ( i , j , k ) Δ z
H z n + 1 / 2 ( i , j , k ) = H z n 1 / 2 ( i , j , k ) + Δ t μ E x n ( i , j + 1 , k ) E x n ( i , j , k ) Δ y E y n ( i + 1 , j , k ) E y n ( i , j , k ) Δ x
where
E x , E y , E z represent the components of the electric field.
H x , H y , H z denote the components of the magnetic field.
ϵ is the permittivity of the material.
μ represents the permeability of the material.
Δ x , Δ y , Δ z correspond to the spatial step size in each direction.
Δ t is the time step.
n denotes the time index.

4.3.4. Analytical Algorithms

The analytical algorithms method is based on exact formulas for image reconstruction, starting with a mathematical model of microwave propagation through tissues. This involves formulating equations that describe the dielectric properties of tissue, affecting the speed and amplitude of waves, comprising a direct solution to systems of linear equations and back projection [113].
In this method, the Radon transform is applied, which is a set of projections acquired at different angles containing information about the scanned object. These microwave measurements are represented in 2D and 3D projections [114].
In analytical reconstruction, reconstruction algorithms are used to efficiently transform an object into a three-dimensional image of the object in order to invert the acquired projections into a 3D image. This is because it is a mathematical tool used to describe these projections [115]. One of the most commonly applied methods in CMI image reconstruction is the filtered back projection (FBP) algorithm, which involves back projecting the acquired projections and then applying a filter in the frequency domain to improve the reconstructed image resolution and reduce noise.
Additionally, enhanced regularization techniques, as well as artifact correction techniques, can be applied to provide better image quality [116].
General equation for analytical reconstruction (Radon Transform):
f ( x , y ) = 0 π R ( ρ , θ ) | ω | e j 2 π ω ( x cos θ + y sin θ ) d ω d θ
f ( x , y ) represents the reconstructed function in the spatial domain.
R ( ρ , θ ) denotes the Radon transform of the original image.
ω is the frequency in the Fourier domain.
θ corresponds to the projection angle.
Equation for the Filtered Back projection (FBP) algorithm:
f ( x , y ) = 0 π R ( ρ , θ ) H ( ω ) e j 2 π ω ρ d ω d θ
where
H ( ω ) is a reconstruction filter (such as the Ram-Lak filter).
Equation for the Fourier Transform in image reconstruction:
F ( k x , k y ) = f ( x , y ) e j 2 π ( k x x + k y y ) d x d y
where
F ( k x , k y ) represents the image in the Fourier domain.

4.3.5. Iterative Algorithms

Iterative algorithms are an alternative approach to analytical algorithms, where iterations are used to improve the obtained image starting with an initial estimate [117]. This process begins with a density distribution of the object, where this estimate can be an image based on projection data [118].
The process starts with a mathematical model describing the connection between observed X-ray measurements and an object’s density distribution. This allows for formulating a system of equations that relate both parts [119]. In each iteration, the algorithm adjusts the density distribution estimate so that the simulated measurements match the real measurements obtained. This involves solving a system of equations or applying optimization techniques to minimize the differences between them [120].
After each iteration, the density distribution estimate is updated to reflect the corresponding improvements. This involves adjusting the pixel values of the reconstructed image to better match the observed measurements [115]. This iterative process continues until some convergence criterion is met, such as a maximum number of iterations or a significant improvement in the difference between simulated and real measurements, indicating that reconstruction has converged and the final image can be obtained [120].
Another algorithm in this group is the Accelerated Distributed Augmented Lagrangian (ADAL). Systems employ a method called total variation minimization (TV) applied with ADAL algorithm, which combines two approaches: the alternating direction method and the augmented Lagrangian. These methods alternate the search for a direction in space combined with a technique using Lagrange multipliers to convert an unconstrained optimization problem into the objective function [121].
Basic equation:
x ( k + 1 ) = x ( k ) + α · r ( k )
where
x ( k + 1 ) is the updated estimate at iteration k + 1 .
x ( k ) represents the estimate at iteration k.
α is the step size or learning factor.
r ( k ) denotes the residual or correction computed at iteration k.
Residual is defined as
r ( k ) = b A x ( k )
where
A is the system matrix.
b represents the vector of independent terms.
r ( k ) denotes the difference between the estimated solution and the expected result.

4.3.6. Ground Penetrating Radar (GPR) Algorithms

Ground Penetrating Radar (GPR) is a geophysical inspection technique that transmits electromagnetic waves capable of penetrating construction structures. Transmitted waves are reflected by the subsurface where there are electrical properties [122]. There are two types of GPR used depending on their antenna configurations: pulsed radar, which is a short-wavelength pulse signal with UWB, and stepped-frequency continuous wave radar [123]. GPR applications have extended to various areas such as soil characteristic analysis, buried object detection, and damage condition assessment in structures, among others [124]. Techniques play an important role in data interpretation in these applications. Therefore, they can be classified into two parts: signal-based methods and image-based methods [125].
The second method for obtaining images is based on scanning data of received waves through background removal and velocity analysis. Image-based methods have also been applied to C-scan data, where a series of 2D images are transformed into 3D data. Additionally, articles have presented algorithms based on features to create 3D images of buried objects using GPR signals [123,125].
Continuous advancement of microstrip antenna technology has created a growing demand for innovative image reconstruction techniques. These algorithms play a fundamental role in processing the data received by patch antennas, enabling the generation of precise visual representations of objects or scenes of interest. This analysis addresses various methods applied for image reconstruction as identified in reviewed articles, emphasizing the importance of algorithmic innovation in enhancing the capabilities of microstrip antennas for imaging applications.
Electromagnetic wave propagation equation in a medium:
× E = μ H t
× H = ϵ E t + σ E
where
E represents the electric field.
H denotes the magnetic field.
μ is the magnetic permeability.
ϵ corresponds to the dielectric permittivity.
σ represents the conductivity of the medium.
Signal reflection equation at the interface of media with different permittivities:
R = ϵ 2 ϵ 1 ϵ 2 + ϵ 1
where
R is the reflection coefficient.
ϵ 1 and ϵ 2 represent the dielectric permittivities of the adjacent media.
Calculation of the signal return time (Time of Flight, ToF):
t = 2 d v
where
t represents the signal travel time.
d denotes the depth of the detected object.
v is the wave propagation speed in the medium.

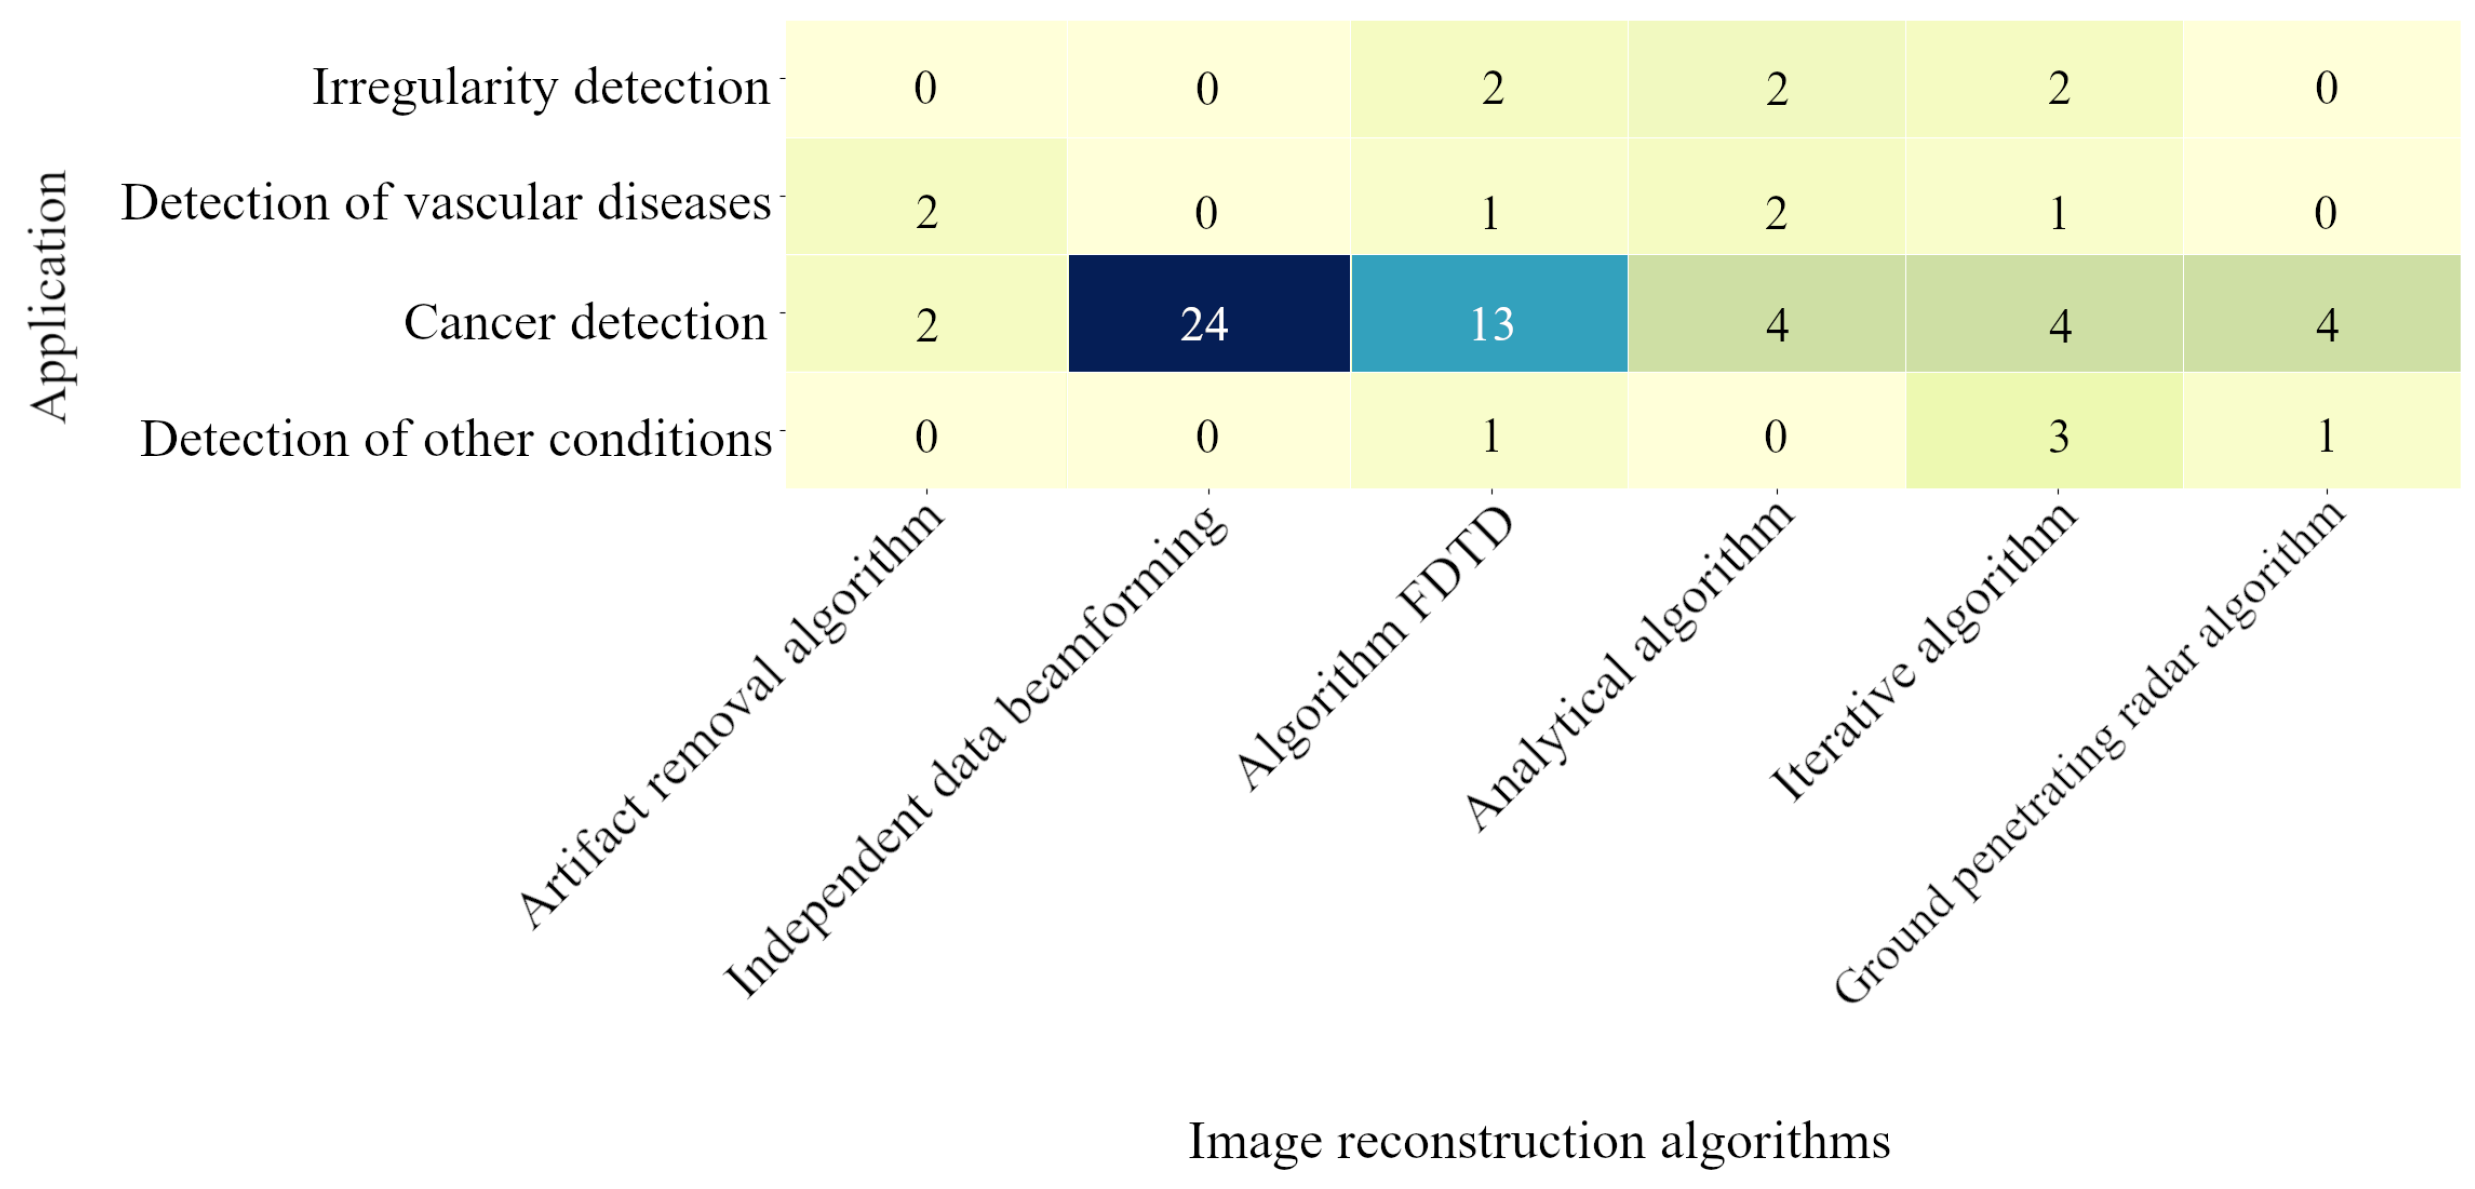
4.3.7. Article Classification by Image Reconstruction Algorithms

One of the most notable aspects of this systematic review is the use of image reconstruction algorithms as they are computational techniques that contribute to image processing. This criterion shows different types of algorithms that can be employed for this purpose. In Figure 7, a distribution is shown where 35.29% (n = 24) are data-independent beamforming (DI) algorithms and 25% (n = 17) are FDTD algorithms, followed by iterative algorithms with 14.71% (n = 10), analytical algorithms with 11.76% (n = 8), GPR algorithms with 7.35% (n = 5), and finally, Artifact Elimination algorithms with 5.88% (n = 4) for image reconstruction. Table 6 provides a more detailed classification of each work according to the specific algorithm employed.
CST Studio Suite (version 2018–2022) simulation software is a tool that facilitates the interpretation of electromagnetic fields, allowing precise simulation and analysis of devices like antennas. Moreover, 25% of reviewed articles use this software to analyze proposed antennas and simulate tissues and tumors in the human body. Notable articles include those proposed by Jahan et al. [78], Subramanian et al. [47], and Zerrad et al. [83], which use CST Studio Suite tool to simulate antenna design and adjust structure parameters to achieve the ideal bandwidth. Meanwhile, the article proposed by Gopikrishnan et al. [65] models a Vivaldi antenna using CST Studio simulator for line stubs, patch slots, and the AZIM cell to provide better performance in operating frequency range.
Another tool used for antenna simulation is High Frequency Structure System (HFSS) (version 2022 R1) software for designing, modeling, and simulating 3D structures. It helps solve complex structure systems that are difficult to model using purely algebraic methods. Notable articles include those presented by Lin et al. [61], which uses HFSS software to simulate the preliminary geometry of an antenna based on a monopole structure. Antenna dimensions are then adjusted to achieve a better S 11 curve. Similarly, Ara et al. [80] design and simulate a circular fractal antenna, simulating a breast model with or without a tumor, which consists of three layers (fat, fibro, and skin), to identify a tumor presence. Ahdi et al. [32] and Stauffer et al. [31] use HFSS software for antenna design and analysis, examining electromagnetic field penetration into breast tissue to detect the tumor.
Studies focused on applying DI beamforming algorithms are those proposed by Gagandeep and Amanpreet [63], Asok et al. [76], and Blanco et al. [82], where data obtained by UWB antenna are processed using DAS algorithm and then plotted in Matlab to form a 2D image representing the tumor’s location coordinates in a breast model. Similarly, Ojaroudi et al. [55] use the DAS algorithm for brain tumor detection as a simple technique for integrating coherent signals to approximate the precise tumor location. Articles by Asok et al. [76] and Alam et al. [85] apply the DAS algorithm for brain tumor detection, reconstructing the tumor using a multistatic antenna arrangement. Additionally, a highly configurable and extensible algorithm set is used for noise reduction. Another commonly applied algorithm is presented by Rahman et al. [39] and Ullah et al. [49], where data obtained are processed using the DMAS algorithm to reconstruct the image in the frequency domain. The image reconstructed by DMAS highlights electromagnetic scattering, showing a clear image of the internal structure of breast models. Meanwhile, Mahmud et al. [45] processed the measured data with the DMAS algorithm and reconstructed the internal structure of the breast phantom, highlighting electromagnetic scattering instead of recovering the dielectric profile.
Articles by Bassi et al. [30] and Samsuzzaman et al. [97] design a rectangular antenna applying DMAS algorithm for cancer detection. Islam et al. [48] develop a microwave imaging system for early breast tumor detection, using DMAS in the proposed system as it provides greater coherence by multiplying individual pairs of delayed signals and summing them as a coherence measure for precise image reconstruction. The algorithm proposed by Jamlos et al. [91], called IDAS, is introduced by applying a smoothing filter. This smoother was implemented in IDAS using Matlab’s built-in mslowess function to obtain high-quality images.
In recent years, new techniques have emerged, such as those proposed by Komalpreet and Amanpreet [72], who use an Iterative Correction (IC) algorithm with a Coherent Factor (CF) DMAS and a Stacked Aperture-coupled Microstrip Patch Antenna (SAMPA), which is designed as a sensor to collect data. Recorded values are used to generate a 2D dielectric profile of the scanned area, identifying locations and size of anomalies. Meanwhile, Hossain et al. [87] and Islam et al. [54] use the IC-DMAS algorithm to collect scattered signal data from a phantom model and process them to generate high-resolution images.
DASI algorithm presented by Taleb et al. [42] and Chouiti et al. [36] is described as an effective image reconstruction method using a UWB microwave imaging system. DASI algorithm involves time shifting and summing the backscattered signals from the breast to create a synthetic focus. It is shown that increasing the number of antenna positions makes detection more accurate. Additionally, it is efficient for detecting and locating breast tumors in two dimensions. A signal processing algorithm proposed by Hossain et al. [62] and Islam et al. [58], called IC-DAS, corrects aberrations introduced by variations in tissue acoustic properties, allowing for clearer and more precise images, facilitating diagnosis. An important technique for tissue design and simulation is presented by Zerrad [93] and Talukder [84], who use MERIT software to merge and process magnetic resonance images, allowing for integrated visualization and better understanding of anatomy.
In articles by Sohani et al. [66] and Scapaticci et al. [46], artifact elimination methods were employed in simulations to reconstruct the image, followed by rotational subtraction artifact elimination. Inum et al. [44] and Alqallaf et al. [35] apply a CMI algorithm, using collected reflection coefficients to generate a 2D image of cancer, which shows the tumor’s presence inside.
Iterative algorithms minimize the difference between calculated and measured projections. Therefore, articles by Ahsan et al. [50] and Razzicchia et al. [70] are based on the distorted Born iterative method, which solves nonlinear scattering problems iteratively by applying a Born approximation in each iteration. An internal DBIM algorithm is used to reconstruct images from acquired data. Meanwhile, an article by Avsar and Mümine [51] presents a method for classifying experimental data obtained from an antenna using the Random Forest algorithm. Based on the classification result, the algorithm can diagnose breast cancer with 94% accuracy.
An article by Rezaei et al. [67] presents a method called TV minimization using the alternate direction method and augmented Lagrangian (ADAL) algorithm. A method combining cross-polarization and co-polarization data was proposed to preserve edges and increase the final image quality. Unlike the article described by Mehedi et al. [73] applies a filtered back projection (FBP) algorithm based on measurements of back projections expressed as the Radon transform of the object. Additionally, image reconstruction was implemented using Matlab programming. Naghavi et al. [92] and Alqallaf and Dib [53] describe a head imaging system based on an E synthetic aperture radar. A received Gaussian pulse is processed using a Hilbert transform, and the reconstructed image detects the target’s location.
Articles by Eltigani et al. [40], Cicchetti et al. [96], and Akhter et al. [38] present Fourier transform method to transform matrix data into an image, converting frequency domain data to the time domain. In addition in article by Grover et al. [94] and Shankar et al. [95], Ground Penetrating Radar (GPR) algorithm in Matlab is proposed, using microwave radar imaging.
A UWB antenna emits a microwave pulse, which is then preprocessed and reconstructed into an image. Naghavi et al. [74] apply a global backprojection (GBP) algorithm in the time domain, described as a coherent summation of raw data measured at different angles along the radar path in each pixel of the reconstructed image. Meanwhile, Qi et al. [41] use a Radio Tomographic Imaging (RTI) algorithm to obtain images of movement through walls and buildings to locate people inside. Additionally, Moussa et al. [89] implement an image processing toolbox available in MathWorks to detect circles in an image. The proposed methodology detects the presence of abnormal tissue within normal tissues.
Finally, the article by Herrmann et al. [34] develops a TWPS to adapt this approach to the functional MRI algorithm of macaques. Resonance images represent the macaque’s brain, with a good representation of gray and white matter mainly in the frontal and parietal lobes, showing the state of the macaque’s brain.

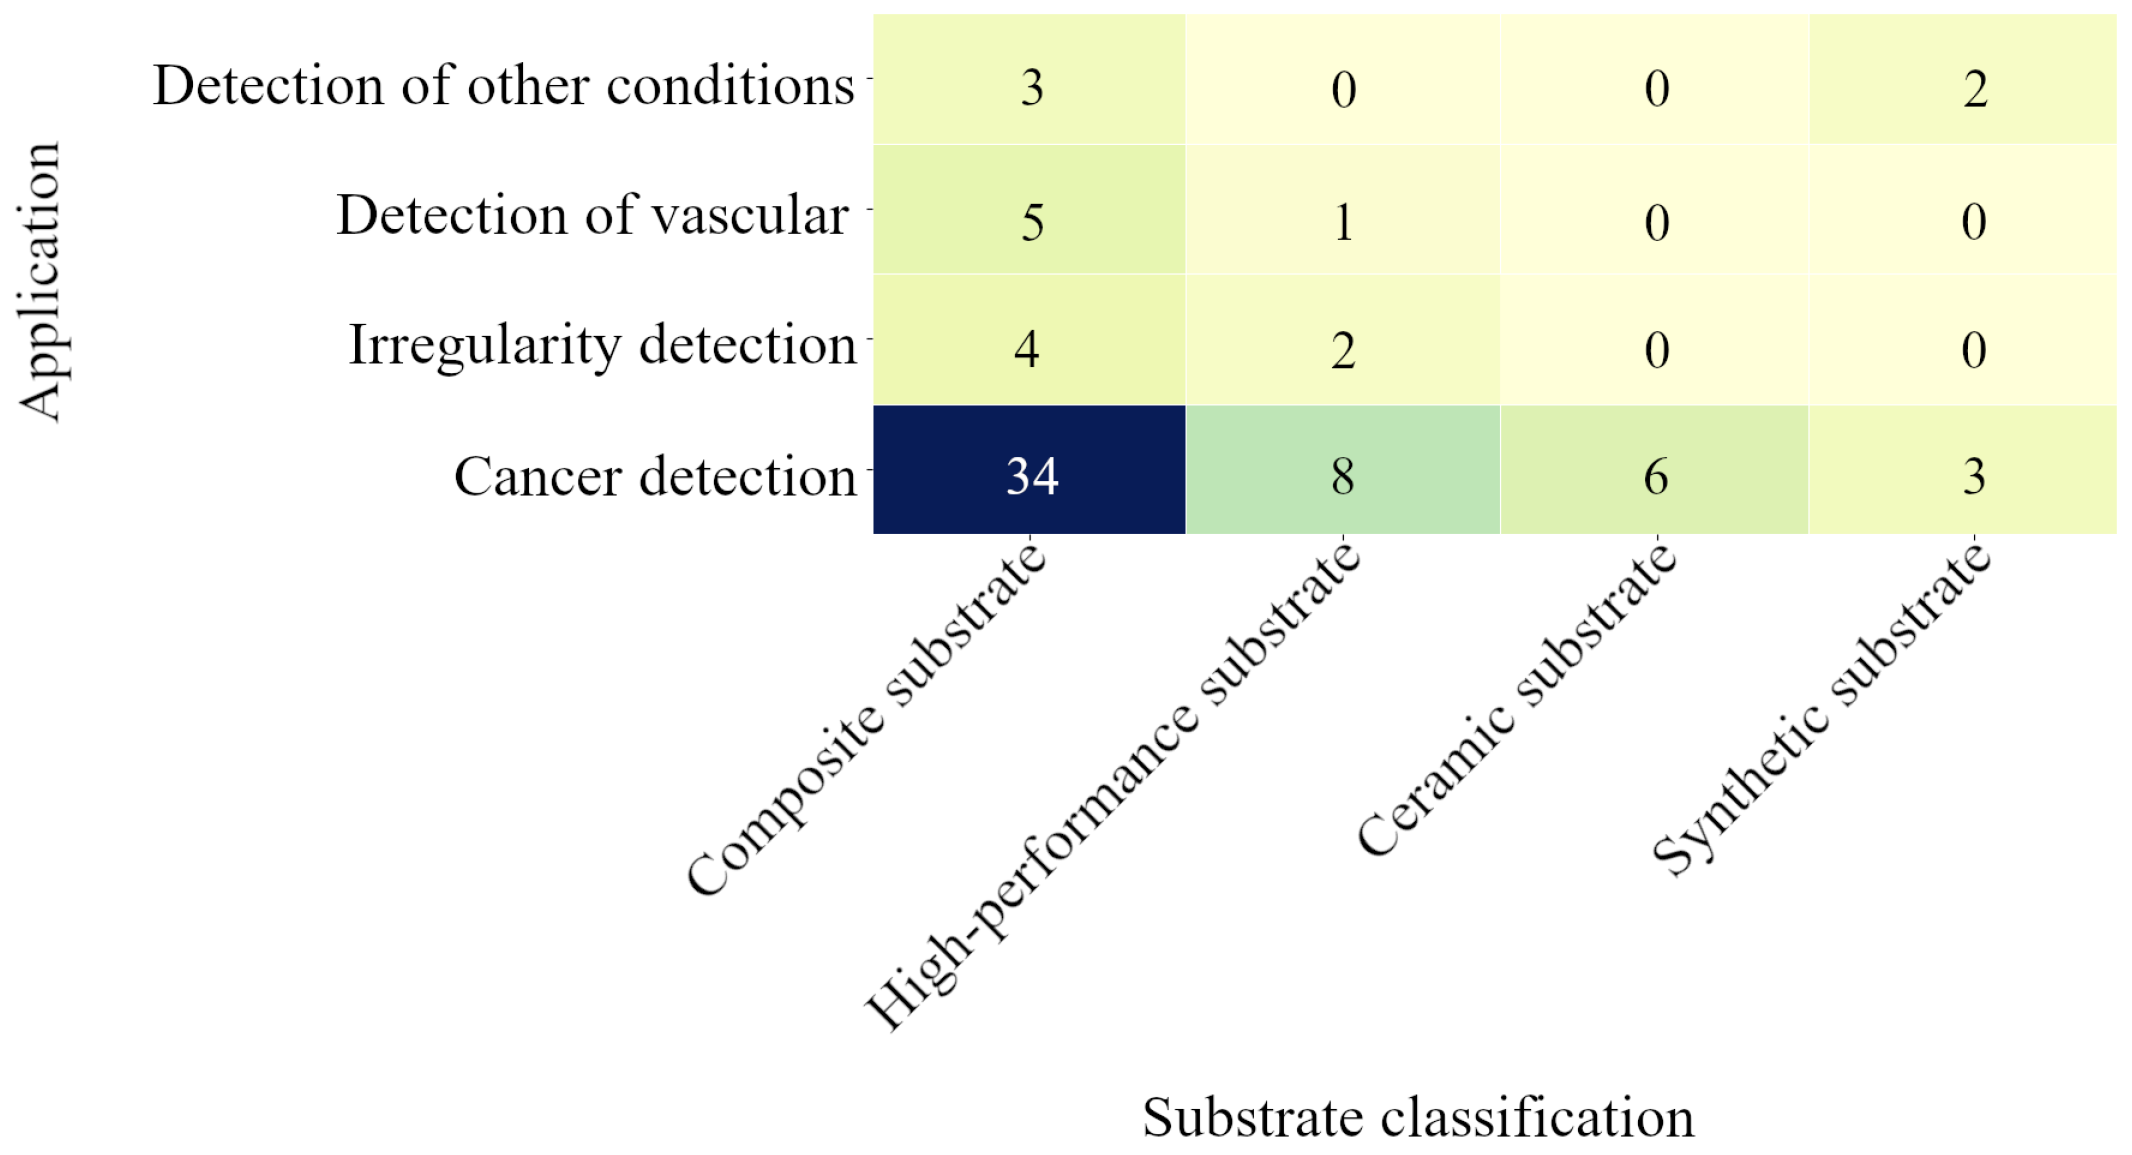
4.4. RQ3. What Are the Primary Applications of Microstrip Antennas in Image Acquisition?

Microstrip antennas have been applied in various fields, with medical imaging being the most significant:
  • Breast Cancer Detection: This accounted for 48.53% of the studies, predominantly using circular and elliptical patches. The high incidence of breast cancer has driven extensive research and development in this area, utilizing microstrip antennas to enhance detection accuracy and imaging quality.
  • Brain Tumor Detection and Vascular Disease Monitoring: These were other notable applications, leveraging the precision and adaptability of microstrip antennas to detect and monitor complex medical conditions.
  • Non-Medical Applications: These included environmental monitoring and security surveillance, showcasing the versatility of microstrip antennas beyond medical uses. In environmental monitoring, they are used for detecting and analyzing changes in various natural phenomena. In security surveillance, they are employed for object detection and recognition, as well as for identifying people, and can be integrated into radar systems [126].
Microstrip antennas are used in a wide variety of applications such as wireless communications, medicine, radar technology, detection, agriculture, security, and many others. In the field of medicine, they are particularly valuable in MRI and CT systems due to their ability to improve image quality, facilitating interpretation [127]. This section details the applications identified within reviewed articles, highlighting the diverse and impactful uses of microstrip antennas across different sectors.

Article Classification by Application Type

In Figure 8, it is shown that 75% (n = 51) are applied to cancer detection, while 8.82% (n = 6) correspond to vascular disease detection. Similarly, an equal percentage of 8.82% (n = 6) is applied to anomaly detection. Finally, 7.35% (n = 5) are used for detecting various conditions. Table 7 provides more details on the types of applications where antennas have been used for image acquisition.
One of the most notable applications addressed in this review is breast cancer detection, accounting for 48.53% of articles, due to the demand for more efficient systems to obtain high-quality images. Among the most prominent studies, those proposed by Selvaraj et al. [69] and Islam et al. [58] focus on breast cancer detection using a circular antenna array due to their high signal transmission effectiveness through tissues and precise tumor localization. Meanwhile, Hammouch and Ammor [56] present a rectangular antenna for breast cancer detection, applying a Tx-Rx array by moving the antenna to different positions covering the entire breast model to obtain a 2D image.
Another application that has received significant attention is brain tumor detection. The interest in this topic is primarily due to disease severity and its impact on health. One of the most relevant articles is by Blanco et al. [82], who present a Vivaldi antenna applied to brain tumor detection, using 16 antennas around the head model to achieve good image resolution. Samsuzzaman et al. [68] and Siam et al. [97] present a circular antenna design with a circular array of 9 antennas for brain tumor detection. Meanwhile, Ojaroudi et al. [55] use a square antenna design with an array of 18 antennas for detecting cancerous tumors and damaged brain tissue due to ischemic or hemorrhagic stroke.
Articles by Kaur et al. [72] and Poorgholam et al. [90] design antennas for skin cancer detection. It is noted that the amount of signal reflected from the phantom in the presence of a tumor is greater compared to healthy tissues due to the difference in electrical properties of tumor tissues. Another interesting article is by Singh et al. [37], where they propose an antenna with an AMC to improve penetration depth for detecting tumors in muscle tissue.
Articles by Naghavi et al. [92], Scapaticci et al. [46], and Razzicchia et al. [70] present stroke detection using a MWI system. Meanwhile, Sohani [66] proposes a wideband antenna design, applying Huygens’ principle and artifact removal to detect hemorrhagic strokes, both in simulation and in a multi-layered head phantom. Naghavi et al. [74] propose a circular array of 12 antennas capable of radiating electromagnetic waves inside the head and operating near tissues. An analysis calculated the minimum power required to detect blood clots in the head; simulations validated the ESAR system’s ability to obtain high-resolution images of the head’s interior.
Antenna applications for object detection have evolved, with a clear example being the proposal by Rezaei et al. [67], who present a rectangular antenna using co-polarization and cross-polarization methods to preserve edges and smooth parts of the image and detect hidden objects. Similarly, Akhter et al. [38] suggest a Vivaldi antenna design used to scan the test object using the imresize function in Matlab to refine the image.
Cicchetti et al. [96] present a rectangular array antenna design applied in a radar system for real-time short-range applications, such as monitoring subjects and objects on train station platforms. Nazeri et al. [59] propose an antenna with multifaceted geometric shapes to investigate the impact of metallic earrings of different sizes on SAR distribution.
Gopikrishnan [65] proposes a wideband antenna for detecting cracks in glacier terrain. It was established that reflection data efficiently identify cracks by detecting the peak of snow ice and airspace regions. Cheng et al. [41] present an E-shaped antenna in RTI systems for detecting wear in building materials. According to patch shape, it avoids impedance mismatches, increasing radiation through the wall and improving localization. By obtaining signal intensity, the location of people inside a building can be determined.
Other articles present applications for special cases in smaller quantities than those previously mentioned. Paul et al. [31] propose a spiral antenna design for head temperature monitoring. A radiometer is used to detect thermal radiation emitted by brain tissue. Radiometer can track changes of 10 °C in simulated brain temperature with a precision and stability of 0.4 °C, reflecting good performance for clinical use. Another interesting article is proposed by Herrmann et al. [34], which developed a TWPS system to obtain images of monkey brains using MRI. A 3D turbo spin echo sequence was used to acquire images, showing high contrast and good tissue homogeneity. Rokunuzzaman et al. [52] present a medical head diagnosis using a compact antenna. A head phantom with three layers, bone, skin, and brain, was made with materials resembling dielectric properties of tissues. Simulations and measurements analyze penetration response and antenna sensitivity with small hematomas at different depths, yielding good results.
Finally, an article by Lin et al. [61] presents a rectangular patch antenna for detecting bone fractures in the human body. A textile antenna was designed using polyester fabrics. Different stages of bone fracture recovery were simulated, highlighting that the UWB textile antenna is promising for medical imaging applications.

5. Antenna Constructive Characteristics: Correlation Analysis

This section analyzes the correlation between applications and algorithms with specific characteristics of antenna structure. Three specific characteristics of antennas have been extracted: antenna size (mm2), bandwidth (GHz), and operating frequency (GHz). This analysis provides a more specific perspective on trends in antenna design characteristics and their relationship with the intended application or the algorithm to be used.

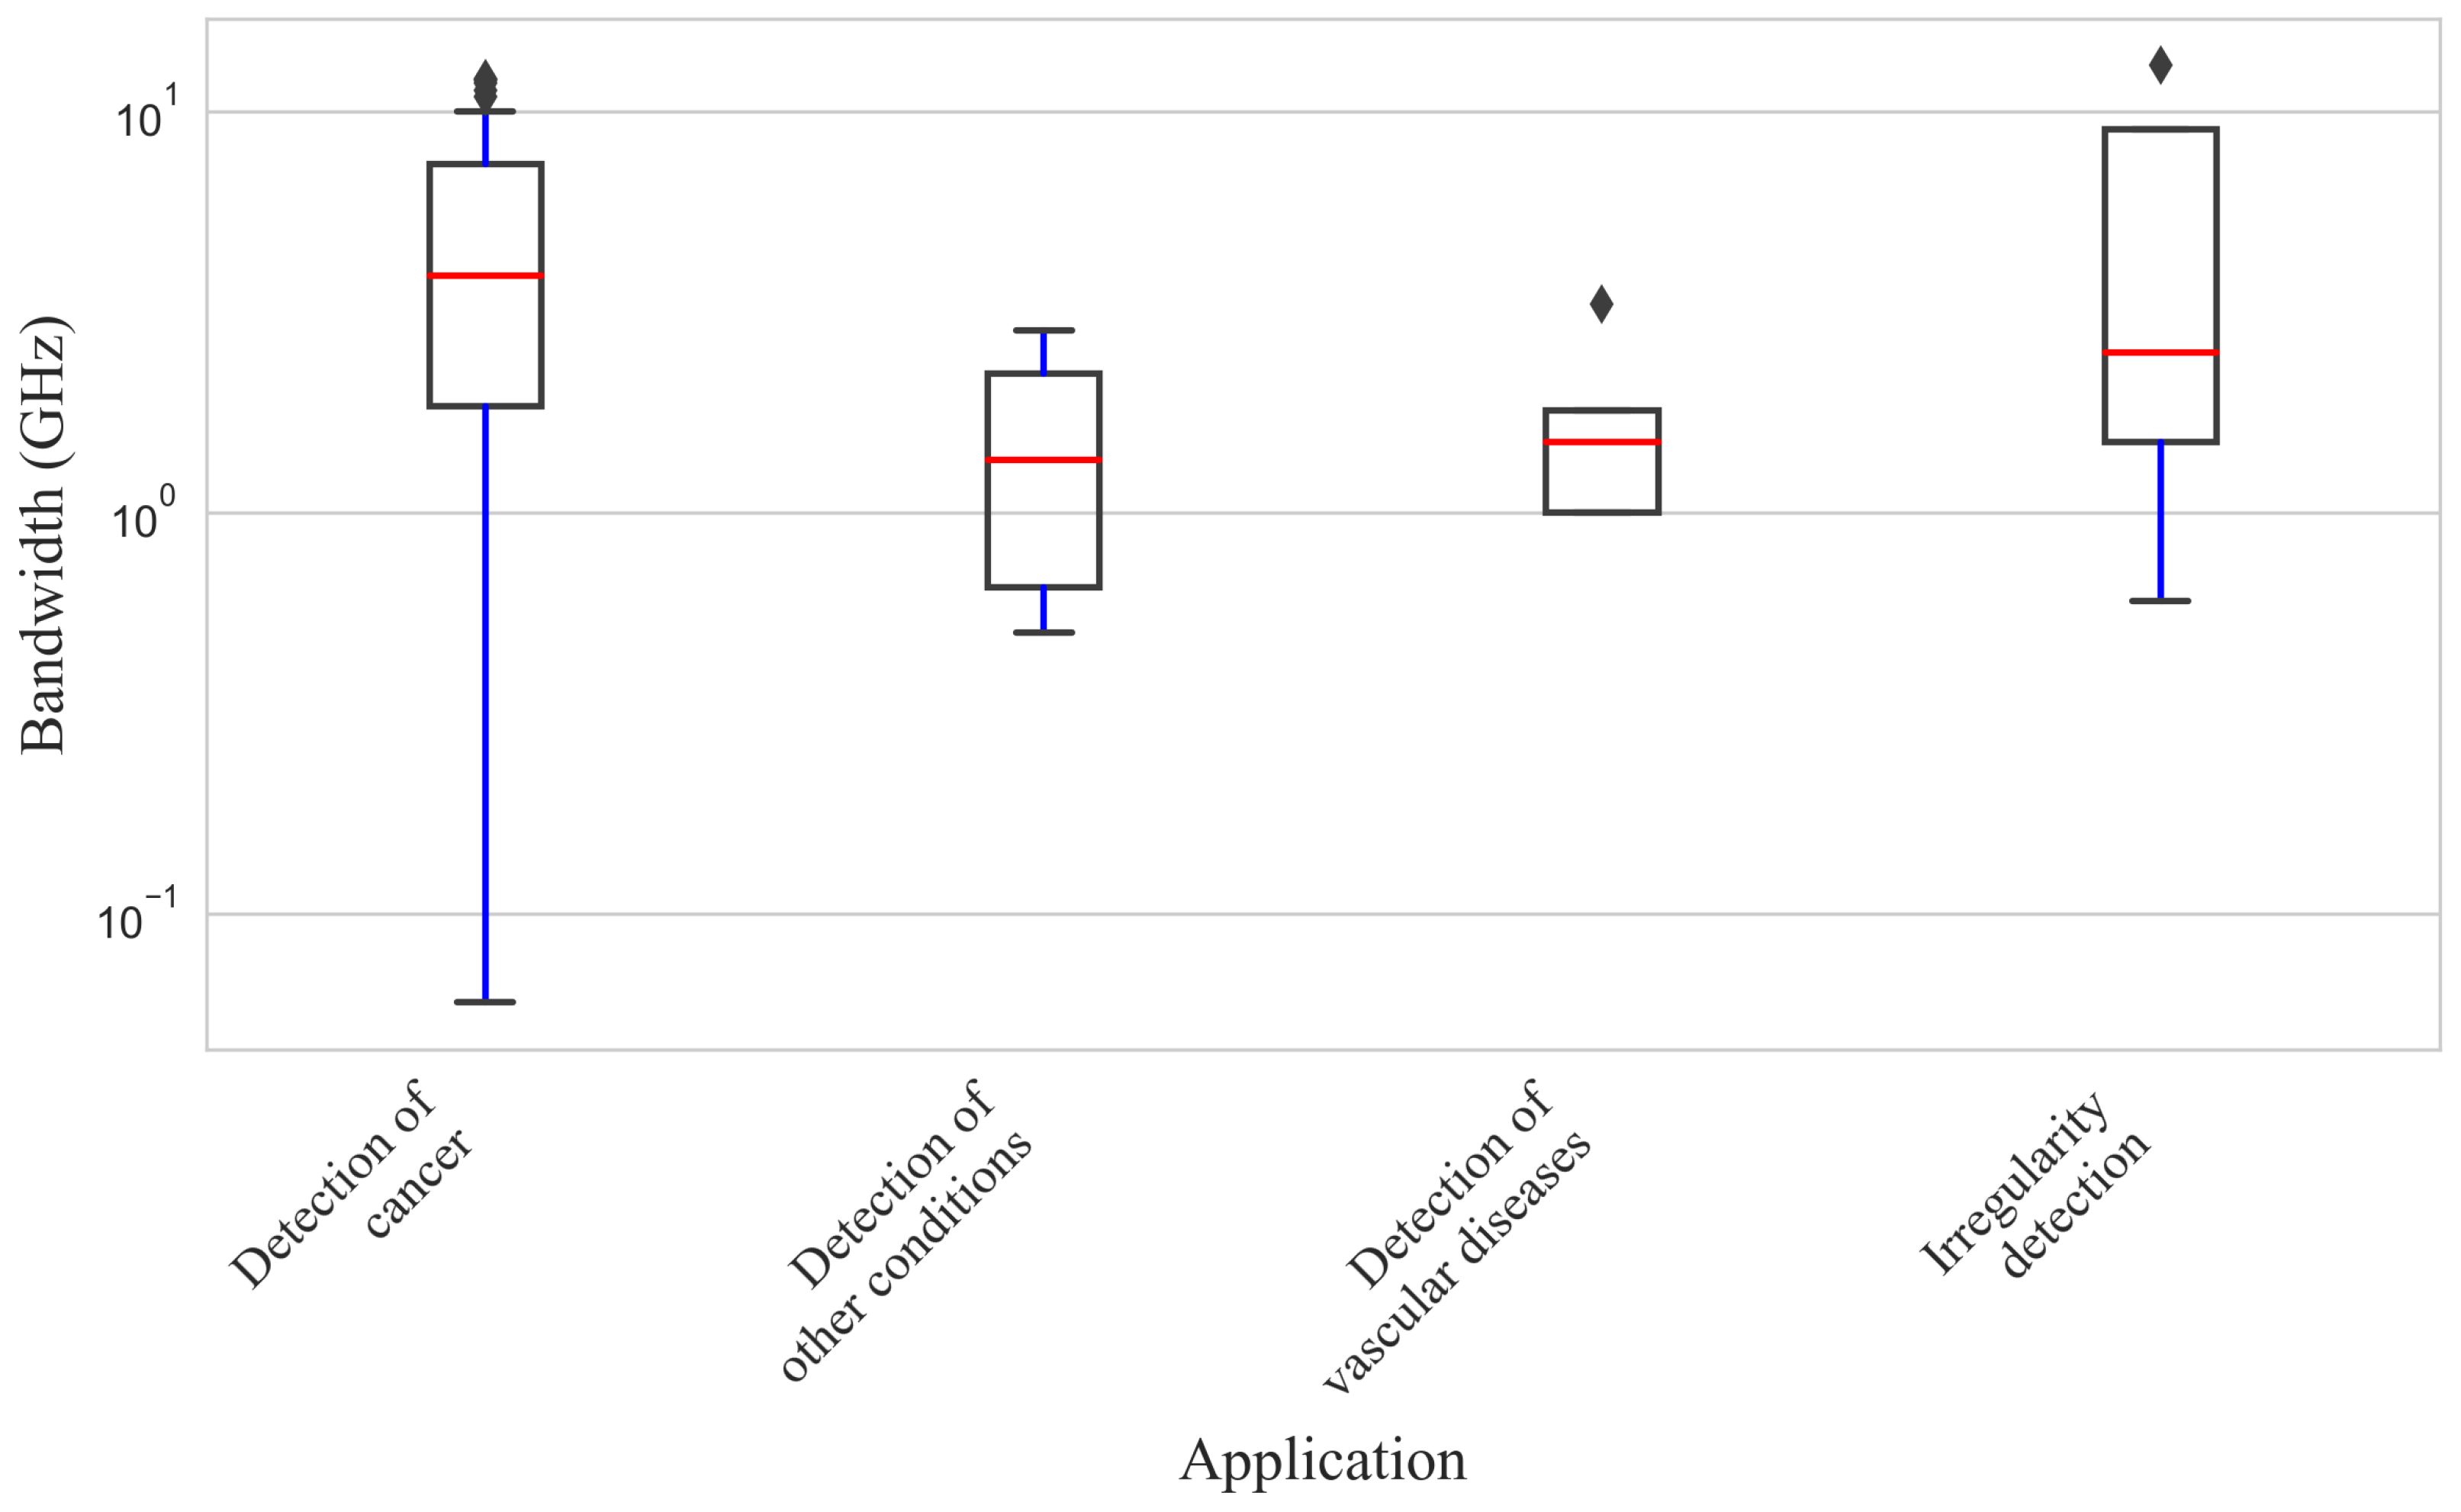
5.1. Analysis of Relationship Between Application and Bandwith

Figure 9 shows a box plot illustrating the bandwidth ranges based on applications. A detailed analysis of bandwidth in various medical diagnostic applications reveals a close relationship between technological capabilities and the specific diagnostic needs of each area.
Cancer detection techniques exhibit a wide variability in the required bandwidth, reflecting the diversity of diagnostic approaches employed. They have the widest bandwidth range, with a median of approximately 5 GHz. There are several outliers, indicating measurements significantly higher than most. From methods based on medical imaging to biological marker analysis, cancer detection demands significant bandwidth capacity, suggesting the need for robust infrastructures to process large volumes of data.
Applications addressing the detection of other conditions exhibit a wide range of bandwidth requirements but are much more limited than those in cancer detection. From monitoring vital signs to evaluating metabolic parameters, these applications require bandwidth adaptability to accommodate various medical data. They show a narrower bandwidth range and a lower median, around 1 GHz. This suggests less variability in the bandwidth used for these detections, and no outliers are present. However, flexibility in bandwidth is essential to ensure comprehensive coverage in diagnosing and monitoring various medical conditions.
Vascular disease detection presents a lower bandwidth profile with moderate to high ranges. This finding underscores the complexity of vascular imaging and blood flow analysis techniques, where data precision and resolution are critical. Appropriate bandwidth is essential to ensure accurate real-time image capture and processing, facilitating an adequate evaluation of a patient’s vascular health. It has a median similar to the detection of other conditions but with a broader Interquartile Range (IQR). There are also outliers, suggesting cases where the bandwidth used is much higher.
Applications dedicated to detecting irregularities, although showing variability in bandwidth, tend to require more specific and focused capabilities. This can be attributed to the nature of irregularities sought, where detailed analysis techniques and expert interpretation play a crucial role. While the bandwidth may be lower compared to other applications, its effectiveness lies in precision and sensitivity to detect subtle anomalies. It has an IQR similar to vascular disease detection, but the median is lower, around 1 GHz. Outliers are also present, indicating that some measurements deviate from the most common range.

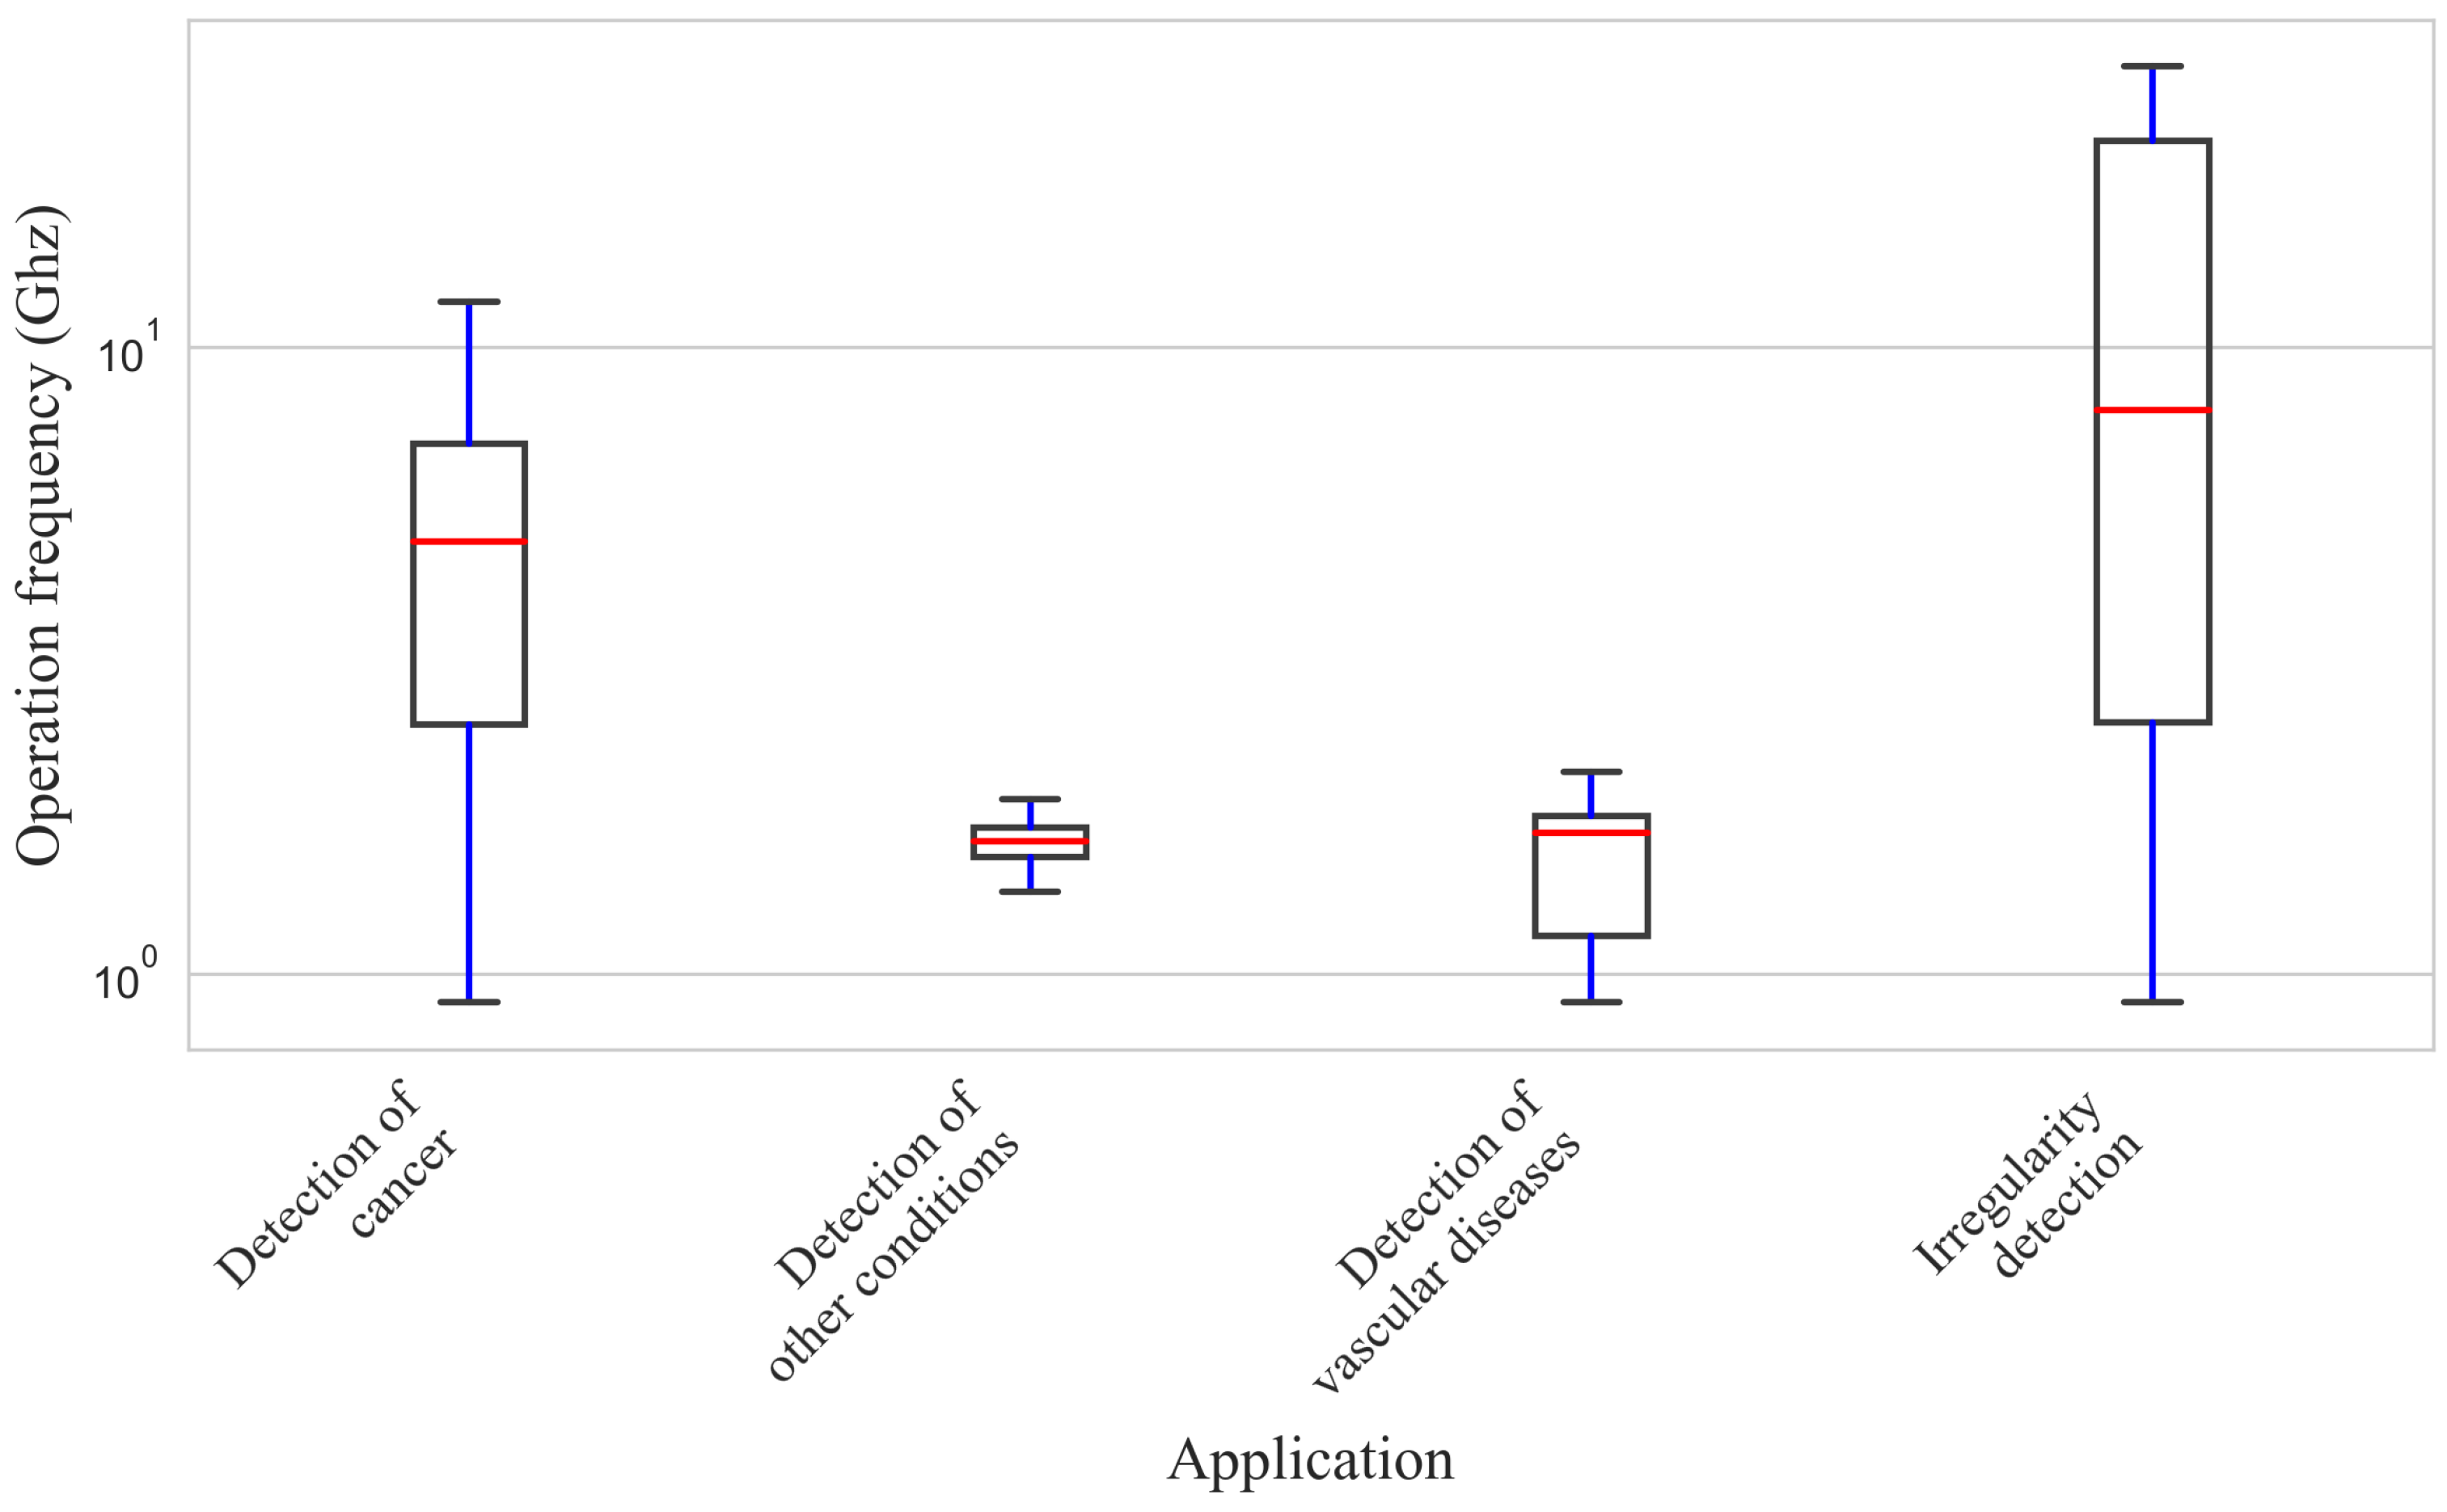
5.2. Analysis of Relationship Between Application and Operating Frequencies

Figure 10 shows the relationship between the operating frequencies of antennas and their designed applications. Operating frequency is critical as it defines both image resolution and electromagnetic wave penetration. Given the wide range of operating frequencies, a logarithmic scale is used in this figure for better visualization.
In relation to cancer detection, Figure 10 shows a median close to 1 GHz with a considerable IQR extending from around 0.3 GHz to approximately 3 GHz. There are no outliers, indicating that all frequency measurements for this application fall within an expected range without significant anomalies. On the other hand, for detecting other conditions, the diagram presents the narrowest IQR and the lowest median, around 0.3 GHz. The compactness of IQR indicates high consistency in operating frequencies, suggesting a well-defined standard for these applications.
Frequencies associated with vascular disease detection show a trend toward medium to high values, indicating a significant demand for imaging and diagnostic technologies related to the vascular system. The diagram shows an IQR similar to other conditions detection but with a slightly higher median, approximately 0.6 GHz. This could reflect a need for slightly higher frequencies for vascular structure resolution.
Frequencies observed in irregularity detection show a varied distribution, suggesting the application of a wide range of diagnostic techniques to identify anomalies in different physiological systems. It has the widest IQR and the highest median of all applications, with a median of around 1 GHz. The range extends from about 0.3 GHz to over 10 GHz. The presence of such a wide range and high median indicates that irregularity detection requires a great variability in operating frequency, possibly to accommodate a diverse range of clinical cases and tissue types to be examined.

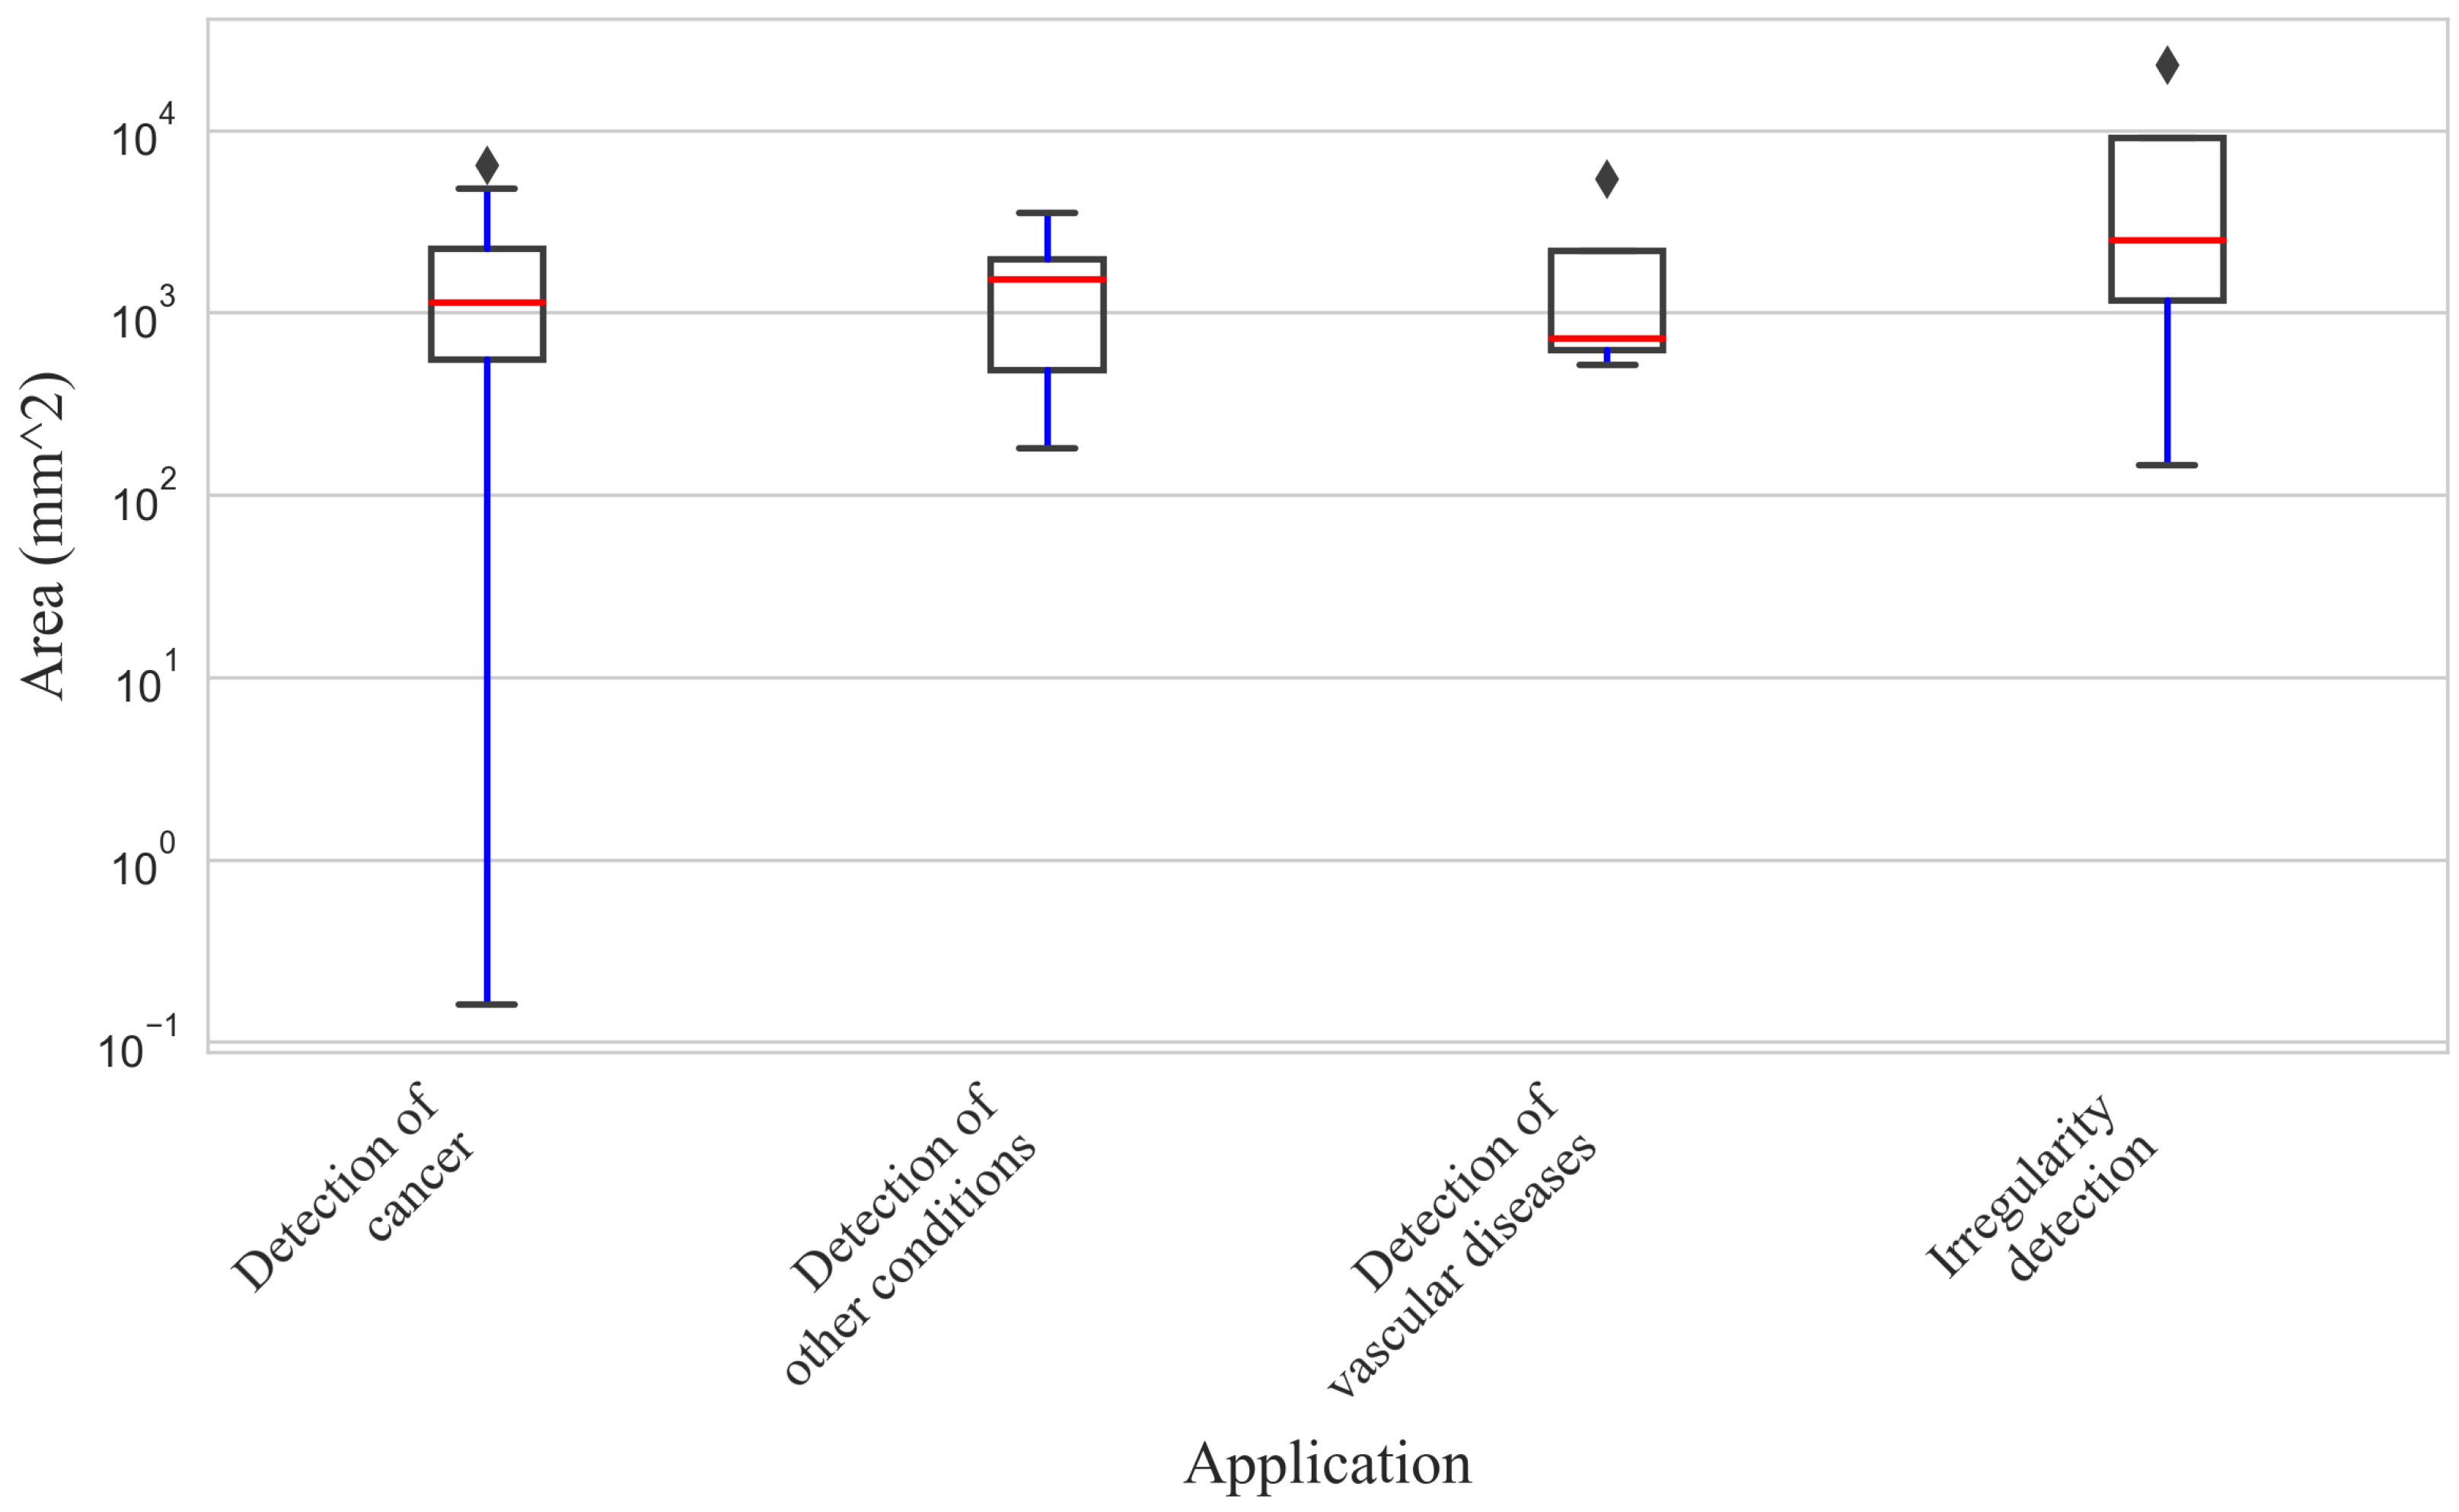
5.3. Analysis of Relationship Between Application and Antenna Size

Figure 11 is a box plot showing the area distribution (in logarithmic units) associated with various applications. Logarithmic scale suggests that areas vary by orders of magnitude, which is common in data spanning very broad ranges. Detailed analysis of antenna size in different detection applications reveals significant trends reflecting the particularities of each application area.
For applications related to cancer detection, the box plot shows a median area seemingly near 100 mm2, with an IQR extending from about 10 mm2 to over 1000 mm2. The “whiskers” range from about 1 mm2 to 10,000 mm2, indicating wide variation in area. Outliers are present and located above the upper whisker, implying that some area observations are extremely high compared to most data in this category. This variability can be attributed to the diverse technological approaches used for early and accurate cancer detection.
Detection of other conditions has the smallest median and IQR of all, with a median around 10 mm2. The whiskers indicate that extreme values do not differ much from IQR, and no outliers are observed, suggesting less variability in detection area for other conditions.
Applications related to vascular disease detection exhibit a larger IQR than other conditions detection, with a median around 10 mm2. Outliers are observed above the upper whisker, indicating that some areas are significantly larger than most. These applications tend to require medium to large antenna sizes, indicating the need for high-resolution detection and diagnostic technologies. The importance of these larger antenna sizes lies in accurately capturing and analyzing the vascular anatomy and blood flow.
Irregularity detection applications present an IQR and median similar to those of vascular disease detection, with outliers both below the lower whisker and above the upper whisker. This implies significant variability in detection areas for this application, suggesting the application of different technological approaches to identify physiological anomalies. Antenna sizes range from 100 mm2 to 4200 mm2.
The presence of outliers in three of the applications suggests that certain circumstances or conditions may require detection areas significantly different from the norm. In statistical analysis, attention should be paid to these outliers to understand the underlying causes of such variations, as they could influence design and optimization decisions in imaging systems. Antenna use and coverage area choice are crucial in imaging as the antennas must be large enough to capture the region of interest but concentrated enough to provide the desired resolution.

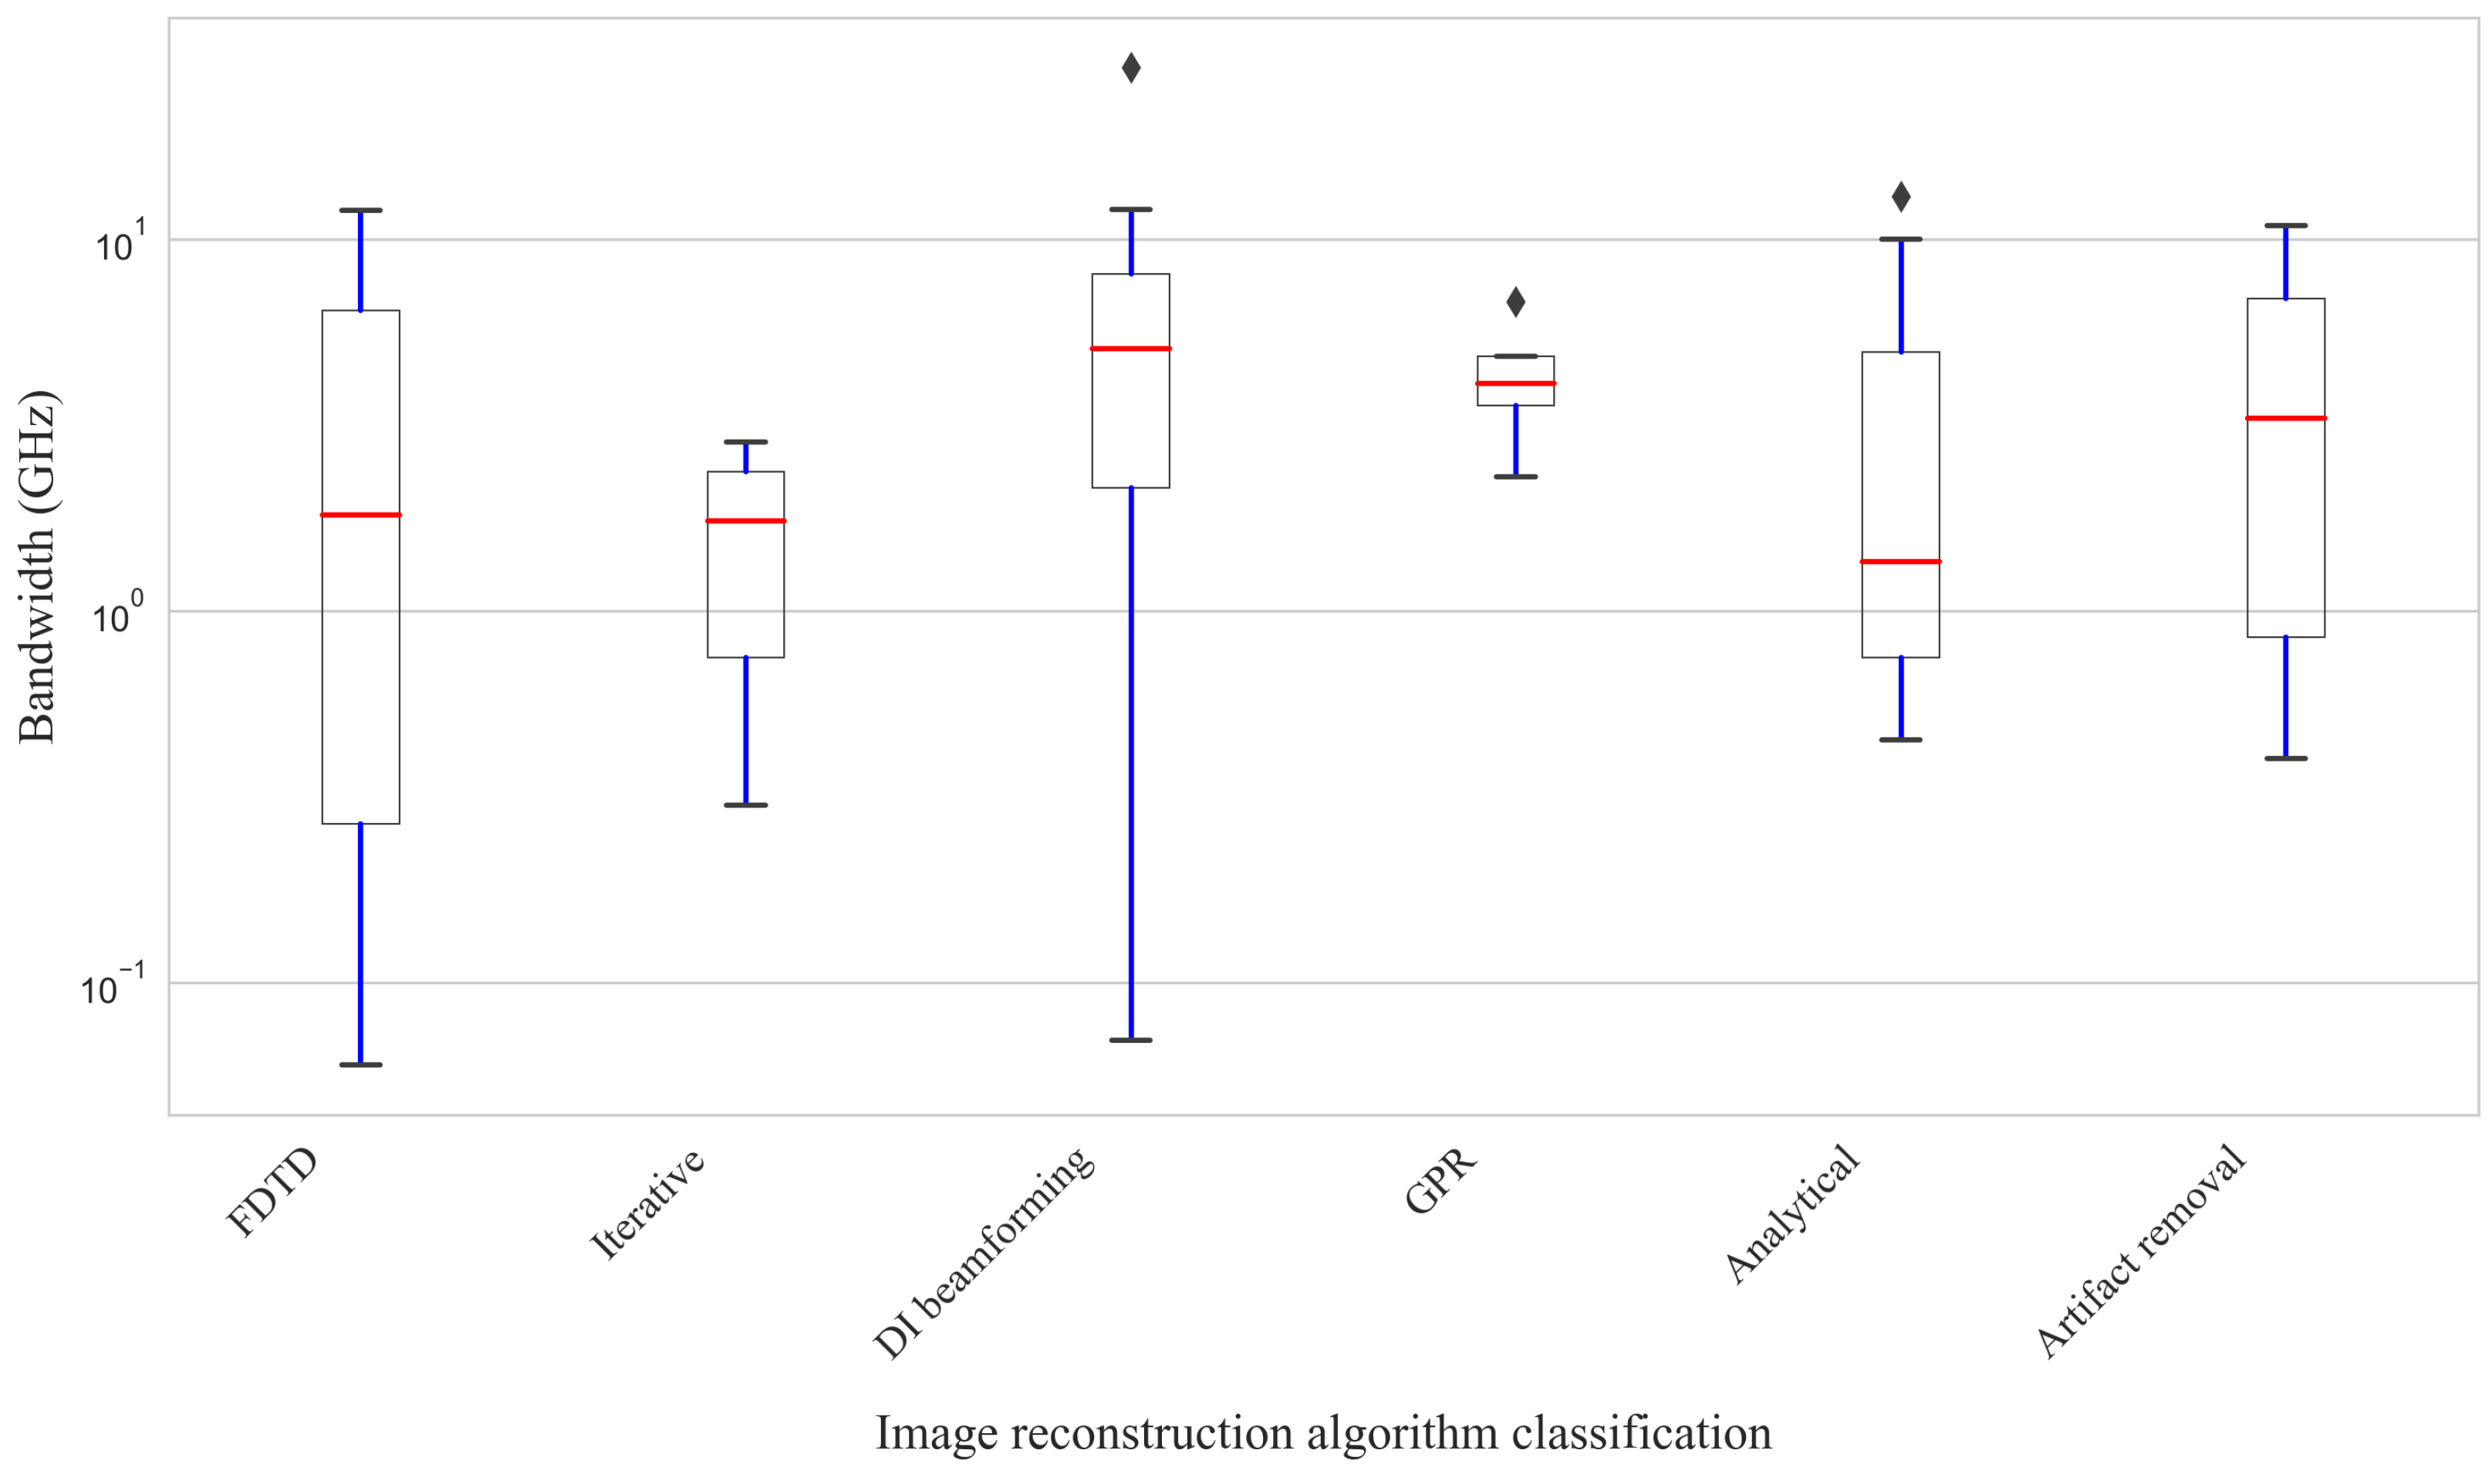
5.4. Analysis of Relationship Between Image Reconstruction Algorithms and Bandwidth

Figure 12 consists of a box plot in logarithmic scale representing the bandwidth (GHz) used by different image reconstruction algorithms. These algorithms are essential for interpreting imaging data and converting it into useful images. Bandwidth influences image resolution and the ability to distinguish between different types of tissue or anomalies.
The FDTD Algorithm presents considerable variability in bandwidth. This algorithm has an IQR extending from just over 1 GHz to about 10 GHz, with a median near 3 GHz. The whiskers extend to about 0.3 GHz and above 10 GHz, showing a wide range of values. There is an outlier above the upper whisker, indicating that, in some cases, an exceptionally high bandwidth is used with this method.
The iterative algorithm presents the narrowest IQR and lowest median, around 1 GHz, indicating a more consistent and precise bandwidth selection. There are no outliers, suggesting reliability in bandwidth choice for this algorithm. In Independent Data Beamforming Algorithms, IQR is slightly wider than the iterative algorithm, and the median is around 1.5 GHz. An outlier above the upper whisker could indicate specific situations where a much larger bandwidth is required.
The GPR Algorithm has a wide IQR, from about 1 GHz to 10 GHz, with a median around 3 GHz. There are outliers above the upper whisker, suggesting the presence of cases where significantly high bandwidths are used. Additionally, analytical algorithms have an IQR and median similar to GPR but with a less extreme outlier. This could reflect less pronounced variability in bandwidth choice for this type of algorithm. However, Artifact Removal Algorithms present an IQR and median similar to the analytical and GPR algorithms, with a median around 3 GHz. Outliers are above the upper whisker, indicating occasions where much higher bandwidth is required for effective artifact removal.
These box plots suggest that, in general, GPR, analytical, and artifact removal algorithms tend to use a similar range of bandwidths, which is quite broad. This could be due to the need to adapt to different scanning conditions or tissue types. On the other hand, iterative algorithms seem to use a more consistent and limited bandwidth, suggesting they are suitable for more standardized applications requiring less adaptability.

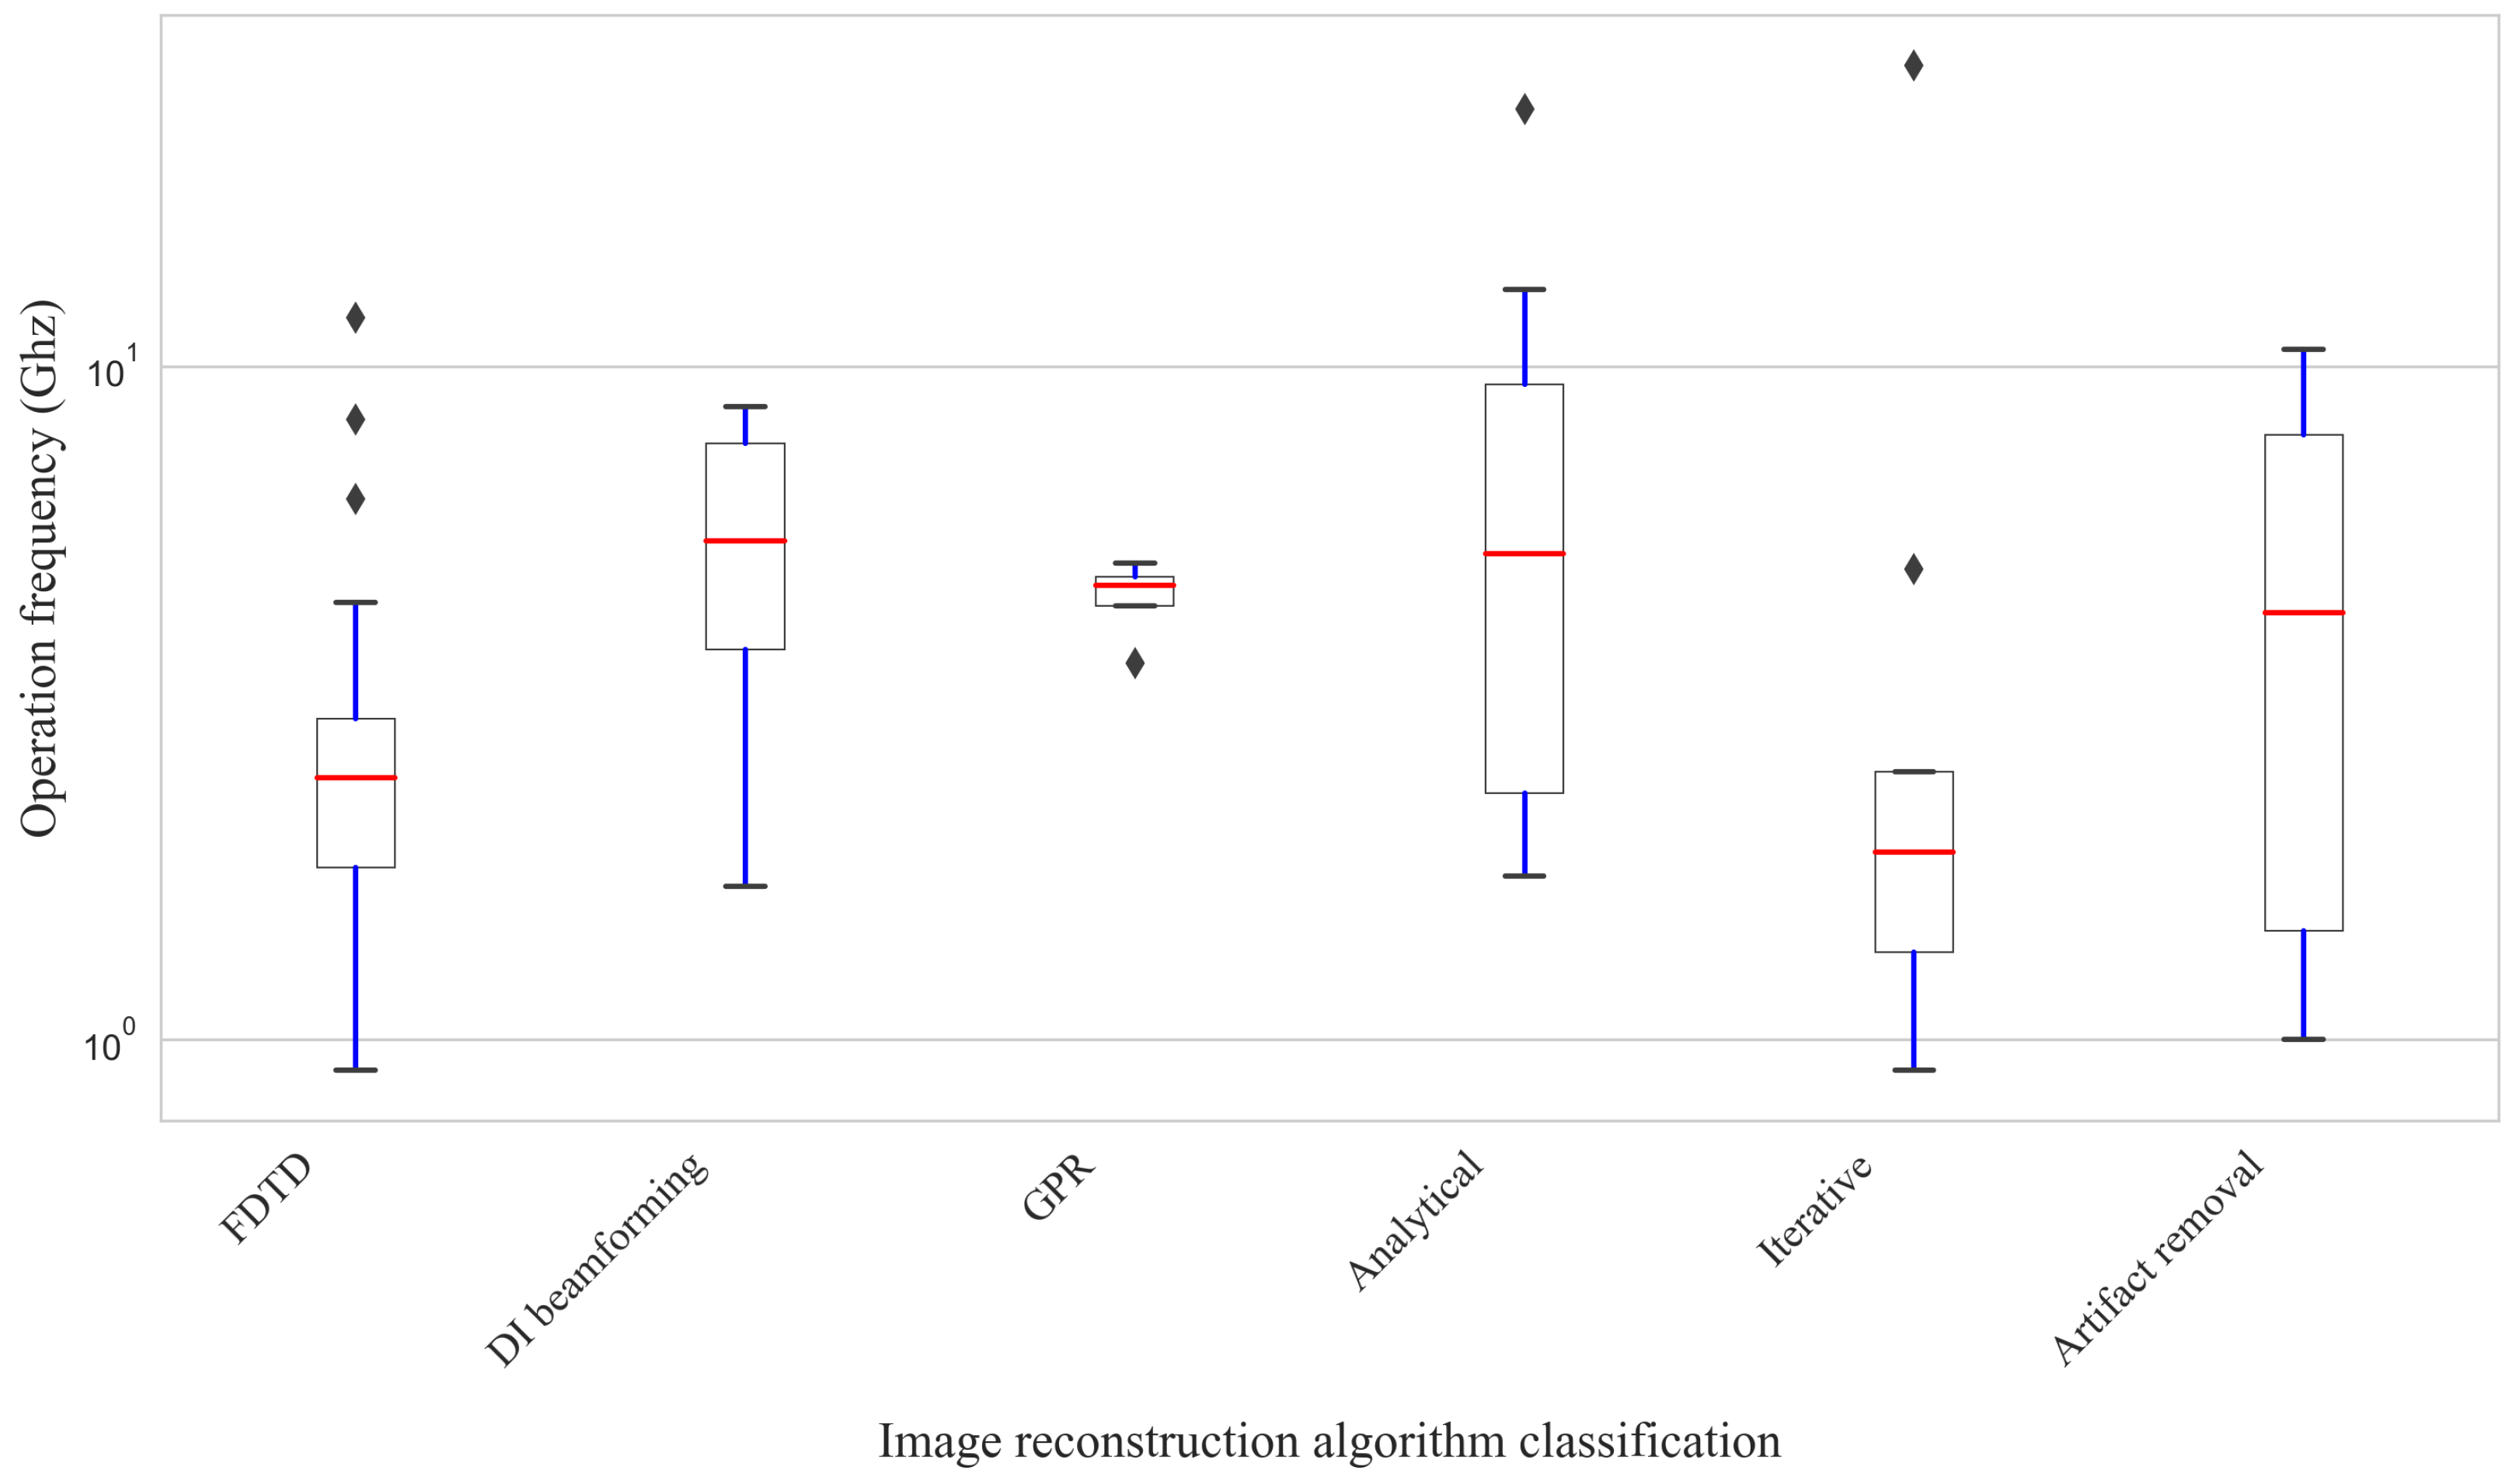
5.5. Analysis of Relationship Between Image Reconstruction Algorithms and Operating Frequency

Figure 13 shows a box plot for operating frequency of various image reconstruction algorithms, using a logarithmic scale for frequency axis (GHz).
FDTD Algorithms present a wide IQR with frequency ranges from about 10 GHz to just over 20 GHz, with a median near 15 GHz. Although most measurements cluster around the median, several outliers suggest versions of algorithm can operate at much higher frequencies. However, Independent Data Beamforming Algorithms show a narrower frequency range, between 10 GHz and 20 GHz, with a median approximately at 14 GHz. The concentration of frequencies near the median indicates less variability in their operational performance.
The GPR Algorithm has a very compact range between 5 GHz and just under 10 GHz, with the median around 7.5 GHz. This narrow grouping of frequencies suggests high specificity in the applications for which these algorithms are appropriate. On the other hand, analytical algorithms have a wide range extending from about 3 GHz to approximately 20 GHz, with a median of around 5 GHz. Broad range and higher outliers indicate a wide diversity in these algorithms’ operational capabilities.
Iterative algorithms present a range from about 4 GHz to over 30 GHz, with a median of around 10 GHz. The presence of upper outliers suggests some iterative algorithms are designed to work efficiently at very high frequencies. However, Artifact Removal Algorithms, with a range from about 2 GHz to over 30 GHz and a median of around 6 GHz, show the most variability in operating frequencies. The outliers indicate that some can be particularly efficient and capable of operating at exceptionally high frequencies.
This analysis of operating frequency for various image reconstruction algorithms reveals significant diversity in their performance. While GPR and Beamforming algorithms show more concentrated and predictable ranges, analytical, iterative, and artifact removal algorithms present wide variability. These differences highlight the importance of choosing the right algorithm for specific application needs, considering both efficiency and specificity in operating frequency.

5.6. Analysis of Relationship Between Image Reconstruction Algorithms and Antenna Size

Figure 14 shows a box plot representing the coverage area in mm2 for different image reconstruction algorithms. The vertical axis is in logarithmic scale to show the coverage area that varies among the different algorithms.
FDTD algorithms vary from areas of about 1 mm2 to over 1000 mm2, with a median around 100 mm2. Upper outliers suggest that in some cases, this algorithm can cover areas much larger than typical. Unlike the above, iterative algorithms show similar variation to FDTD, with areas ranging from 10 mm2 to 1000 mm2, and the median located around 100 mm2. It also presents outliers indicating exceptional coverage capabilities in certain situations.
Independent Data Beamforming Algorithms’ coverage area is quite uniform, with ranges between 10 mm2 and 300 mm2 and a median near 100 mm2. The lack of outliers indicates that the coverage area is more predictable and consistent. Even if GPR algorithms have an area range from around 10 mm2 to 300 mm2, with the median also near 100 mm2. Like independent data algorithms, they show consistency in the coverage area.
Analytical algorithms group shows a range from approximately 30 mm2 to 1000 mm2, with a median around 100 mm2. Upper outliers indicate that some analytical algorithms can expand to areas much larger than the norm. However, Artifact Removal Algorithms present the broadest range of all, from less than 10 mm2 to over 1000 mm2, with the median around 100 mm2. The presence of both lower and upper outliers suggests significant variability in their area coverage performance.
This analysis shows that, while the median antenna coverage area for algorithms is generally similar, variability and outliers reflect significant differences in the coverage capabilities of each algorithm. This is crucial for their application in real-world scenarios where area size is an important consideration.

6. Correlation Analysis Between Variable Classifications

To identify correlation patterns between different categorizations identified in the articles, heat maps were generated, which related the variables in pairs and were based on the number of articles identified for each. This approach is based on the methodology proposed by Guerrero-Vasquez et al. [128] for developing a meta-analysis of the results of a systematic review. This way, it is possible to identify trends in specific research lines and also gaps in topics that have not yet been addressed.
Thus, in the heat map presented in Figure 15, five fundamental dimensions are evaluated: application, image reconstruction algorithms, frequency bands, antenna design, and substrate classification. Higher values, which are represented by darker colors, highlight significant interactions between parameters. For example, the application shows remarkable values for its relationship with antenna design (SD = 7.21) and substrate classification (SD = 8.04), emphasizing its impact on these aspects. This indicates that there is significant variation in the data, which explains why some values may be close to zero, while others show considerably higher values. This variation, which reflects a wide range of data values—some close to zero and others considerably higher—is further explained in Appendix A. The Appendix A includes detailed tables and specific references to the data underlying the heat map.
The observed ratio of (SD = 5.15) between applications and image reconstruction algorithms reflects a moderate degree of interdependence. One fundamental aspect is analyzing which algorithms are most representative of image reconstruction and identifying areas where there is a significant relationship. A notable number of publications address the relationship between cancer detection and implementation of data-independent beamforming algorithms, with a total of 35.2% (n = 24) articles recorded. Additionally, the FDTD algorithm has been the focus of 19.11% (n = 13) publications, highlighting its relevance in this field of study.
Based on a ratio of (SD = 4.14), this analysis studies the relationship between application areas and frequency bands in which they operate, aiming to achieve optimal performance in the design and construction of antennas. It shows that most research focuses on cancer detection, operating in the C frequency band with 23.52% (n = 16) articles, highlighting its good performance and efficiency in this area. Next, 20.58% (n = 14) of articles worked in the S frequency band, indicating a notable interest in operating in this band.
The elevated ratio (SD = 7.21) between applications and antenna design stems from their strong interrelation. Thus, the analysis examines the relationship between antenna design and application types. Shows a significant number of studies focused on cancer detection with 44.11% (n = 30) articles dedicated to slot antenna designs. This figure underscores extensive research focused on implementing slots in antenna patches to enhance performance. Design and construction of antenna arrays applied to cancer detection were addressed in 14.7% (n = 10) studies.
The considerable ratio between substrate classification and application reflects their interdependence in the system. Therefore, the analysis studies the relationship between substrate classification and applications. Shows a large number of studies focused on cancer detection using composite substrates with 50% (n = 34) articles. High-performance substrates are applied in 11.76% (n = 8) and ceramic substrates in 8.82% (n = 6) studies.
When analyzing the correlation between image reconstruction algorithms and frequency bands, there is a particular interest in combining data-independent beamforming algorithms in the C frequency band, with a total of 14.7% (n = 10) articles. This is followed by 7.35% (n = 5) studies employing it in the S band, while the X and UWB frequency bands each show a presence of 5.88% (n = 4) articles.
The relationship between antenna design and frequency bands highlights that slot antennas are most commonly used in the S frequency band with 19.11% (n = 13) and in the C frequency band with 14.7% (n = 10) articles. Additionally, slot antennas are utilized in the L frequency band with 8.82% (n = 6) studies and in the UWB band with 7.35% (n = 5) articles.
Understanding the relationship between antenna design and substrate classification is vital, so highlighting the significant prevalence of articles related to slot antenna designs, representing 41.17% (n = 28) of studies using composite substrates.
Regarding the association between substrate classification and image reconstruction algorithms, there is a significant number of articles that focus on composite substrates, specifically with 20.58% (n = 14) studies related to the FDTD algorithm and 19.11% (n = 13) articles associated with data-independent beamforming algorithms.
Recognizing the interaction between substrate classification and frequency bands highlights studies focusing on composite substrates, representing 22.05% (n = 15) of articles in the S frequency band. Additionally, 16.17% (n = 11) studies operate in the C frequency band. L band has 10.29% (n = 7) articles.
The relationship between antenna design and image reconstruction algorithms highlights a considerable number of articles focusing on slot antennas, particularly with the FDTD algorithm with 19.11% (n = 13) articles and data-independent beamforming algorithm with 17.64% (n = 12) articles.

7. Conclusions

The results of this systematic review provide a comprehensive analysis of the state of the art in image acquisition using microstrip antennas, focusing on the interplay between antenna design, image reconstruction algorithms, and application domains. Our findings highlight several significant trends and opportunities for future research in this field.
Firstly, analysis reveals that microstrip antennas have evolved considerably since their inception, with notable advancements in their design and material properties. The predominant use of substrates like FR4 and Rogers RT/duroid, combined with diverse geometrical designs such as rectangular, circular, and elliptical patches, underscores their versatility and adaptability for various imaging applications.
In addition, our review identifies key algorithms for image reconstruction, with beamforming algorithms (particularly Delay-and-Sum) and FDTD techniques being the most prevalent. These algorithms have demonstrated effectiveness in enhancing image quality and accuracy, particularly in medical diagnostics. However, iterative and analytical methods also play crucial roles in specific contexts, highlighting the importance of selecting appropriate algorithms based on application needs.
Also, the primary application domain for microstrip antennas remains to be medical imaging, particularly in the detection of breast cancer, brain tumors, and vascular diseases. The ability of these antennas to provide high-resolution images makes them invaluable in early disease detection and monitoring. Nonetheless, there is a growing interest in non-medical applications, including environmental monitoring and security surveillance, which presents new opportunities for research and development.
Furthermore, our review highlights several gaps in the current literature. While significant progress has been made in medical imaging, other potential application areas, such as environmental and industrial monitoring, are less explored. Future research should focus on extending the use of microstrip antennas to these domains, leveraging their unique properties to address new challenges.
Future work should focus on evaluating the impact of additional parameters of the transmitted signals beyond frequency, including power, energy, and pulse shape. These elements are essential for improving accuracy and efficiency in image acquisition applications. In addition, the integration of reconfigurable smart systems in microstrip antennas could represent a significant advance, which allows for dynamic adaptability in complex environments. CSI statistical-based designs for smart surfaces, as described in recent studies, could optimize image detection and reconstruction in massive MIMO systems that are assisted by reconfigurable smart systems.

Author Contributions

Conceptualization, L.F.G.-V., B.S.S.-J. and F.T.Z.-L.; methodology, L.F.G.-V., J.O.O.-O. and P.A.C.-P.; validation, L.F.G.-V., J.O.O.-O. and P.A.C.-P.; formal analysis, L.F.G.-V., B.S.S.-J., F.T.Z.-L. and N.A.C.-R.; investigation, B.S.S.-J. and F.T.Z.-L.; data curation, L.F.G.-V., B.S.S.-J. and N.A.C.-R.; writing—original draft preparation, L.F.G.-V., B.S.S.-J. and F.T.Z.-L.; writing—review and editing, L.F.G.-V., J.O.O.-O., P.A.C.-P. and N.A.C.-R.; visualization, L.F.G.-V., B.S.S.-J., F.T.Z.-L. and N.A.C.-R.; supervision, J.O.O.-O. and P.A.C.-P.; project administration, J.O.O.-O. and P.A.C.-P.; funding acquisition, L.F.G.-V., J.O.O.-O. and P.A.C.-P. All authors have read and agreed to the published version of the manuscript.

Funding

This research received no external funding.

Institutional Review Board Statement

Not applicable.

Informed Consent Statement

Not applicable.

Data Availability Statement

The data presented in this study are available on request from the corresponding author.

Conflicts of Interest

The authors declare no conflicts of interest.

Abbreviations

The following abbreviations are used in this manuscript:
CTcomputed tomography
CMIconfocal microwave imaging
PRISMAPreferred Reporting Items for Systematic Reviews and Meta-Analyses
RFIDRadio Frequency Identification
SARSpecific Absorption Rate
EMelectromagnetic
CIConfocal Imaging
DMASDelay-Multiply-and-Sum Algorithm
MSPAMulti-Stacked Patch Antenna
ACMAssociation for Computing Machinery
MDPIMultidisciplinary Digital Publishing Institute
UWBUltra-Wideband
FR4Flame Retardant 4
AMCArtificial Magnetic Conductor
MTMMetamaterials
CPWcoplanar waveguide
CSRRcomplementary split ring resonator
PCBPrinted Circuit Board
LP-ASPlow-profile aperture-stacked patch antenna
DASDelay-and-Sum
FDTDFinite-Difference Time-Domain
DIdata-independent beamforming
GPRGround Penetrating Radar
IC-CF-DMASIterative Correction with Coherent Factor Delay-Multiply-and-Sum
HFSSHigh Frequency Structure System
DBIMdistorted Born iterative method
DASIDelay-And-Sum Imaging
IC-DASIterative Correction Delay-And-Sum
ADALAlternate Direction Augmented Lagrangian
FBPFiltered Backprojection
GBPglobal backprojection
IDASIterative Delay-And-Sum
RTIRadio Tomographic Imaging
IRMIterative Reconstruction Method
AZIMAntenna Zoom Imaging Method
ICIterative Correction
CFCoherent Factor
SAMPAStacked Aperture-Coupled Microstrip Patch Antenna
MERITMedical Electromagnetic Radiation Imaging Tool
ADALalternate direction method and augmented Lagrangian
TWPSTW primate System
MRIMagnetic Resonance Imaging
MWImicrowave imaging
ESAREnhanced Synthetic Aperture Radar
RTIRadio Tomographic Imaging
IQRInterquartile Range

Appendix A

Figure A1. Article classification by application and image reconstruction algorithm.
Electronics 14 01063 g0a1
Figure A2. Article classification by applications and frequency bands.
Electronics 14 01063 g0a2
Figure A3. Article classification by applications and antenna geometry.
Electronics 14 01063 g0a3
Figure A4. Article classification by application and substrate.
Electronics 14 01063 g0a4
Figure A5. Classification of frequency bands and image reconstruction algorithms.
Electronics 14 01063 g0a5
Figure A6. Article classification by antenna geometry and frequency band.
Electronics 14 01063 g0a6
Figure A7. Article classification by antenna geometry and substrate.
Electronics 14 01063 g0a7
Figure A8. Article classification by substrate and image reconstruction algorithms.
Electronics 14 01063 g0a8
Figure A9. Article classification by substrate and frequency band.
Electronics 14 01063 g0a9
Figure A10. Article classification by antenna geometry and image reconstruction algorithm.
Electronics 14 01063 g0a10

References

  1. Badyal, S.; Kumar, N. Suggesting Advance Methods for Obtaining Instantly Recognizable and Accurate Images. VIVECHAN Int. J. Res. 2014, 5, 55–61. [Google Scholar]
  2. Ahmed, S.S.; Schiessl, A.; Gumbmann, F.; Tiebout, M.; Methfessel, S.; Schmidt, L.P. Advanced microwave imaging. IEEE Microw. Mag. 2012, 13, 26–43. [Google Scholar] [CrossRef]
  3. Pozar, D.M. A Review of Aperture Coupled Microstrip Antennas: History, Operation, Development, and Applications; University of Massachusetts at Amherst: Amherst, MA, USA, 1996; pp. 1–9. [Google Scholar]
  4. Gupta, V.R.; Gupta, N. Characteristics of a compact microstrip antenna. Microw. Opt. Technol. Lett. 2004, 40, 158–160. [Google Scholar] [CrossRef]
  5. James, J.R.; Hall, P.S.; Wood, C. Microstrip Antenna: Theory and Design; IET: London, UK, 1986; Volume 12. [Google Scholar]
  6. Liu, Y.; Si, L.M.; Wei, M.; Yan, P.; Yang, P.; Lu, H.; Zheng, C.; Yuan, Y.; Mou, J.; Lv, X.; et al. Some recent developments of microstrip antenna. Int. J. Antennas Propag. 2012, 2012, 428284. [Google Scholar] [CrossRef]
  7. Singh, I.; Tripathi, V.S. Micro strip patch antenna and its applications: A survey. Int. J. Comp. Tech. Appl. 2011, 2, 1595–1599. [Google Scholar]
  8. Yang, F.; Rahmat-Samii, Y. Patch antennas with switchable slots (PASS) in wireless communications: Concepts, designs, and applications. IEEE Antennas Propag. Mag. 2005, 47, 13–29. [Google Scholar] [CrossRef]
  9. Shi, J.; Liu, S.; Zhang, L.; Yang, B.; Shu, L.; Yang, Y.; Ren, M.; Wang, Y.; Chen, J.; Chen, W.; et al. Smart textile-integrated microelectronic systems for wearable applications. Adv. Mater. 2020, 32, 1901958. [Google Scholar] [CrossRef]
  10. Ding, X.; Clifton, D.; Ji, N.; Lovell, N.H.; Bonato, P.; Chen, W.; Yu, X.; Xue, Z.; Xiang, T.; Long, X.; et al. Wearable sensing and telehealth technology with potential applications in the coronavirus pandemic. IEEE Rev. Biomed. Eng. 2020, 14, 48–70. [Google Scholar] [CrossRef] [PubMed]
  11. James, J.R.; Hall, P.S. Handbook of Microstrip Antennas; IET: London, UK, 1989; Volume 1. [Google Scholar]
  12. Nasimuddin, N. Microstrip Antennas; BoD–Books on Demand: Rijeka, Croatia, 2011. [Google Scholar]
  13. Lee, K.F.; Tong, K.F. Microstrip patch antennas—basic characteristics and some recent advances. Proc. IEEE 2012, 100, 2169–2180. [Google Scholar]
  14. Benavides, J.B.; Lituma, R.A.; Chasi, P.A.; Guerrero, L.F. A Novel Modified Hexagonal Shaped Fractal Antenna with Multi Band Notch Characteristics for UWB Applications. In Proceedings of the 2018 IEEE-APS Topical Conference on Antennas and Propagation in Wireless Communications (APWC), Cartagena, Colombia, 10–14 September 2018; pp. 830–833. [Google Scholar] [CrossRef]
  15. Guerrero-Vásquez, L.F.; Jara-Quito, T.A.; Ordoñez-Ordoñez, J.O.; Cevallos-Gonzalez, M.K.; Chasi-Pesantez, P.A. A Novel Multi Band Patch Antenna Based on Plotting Exponential Partial Sums in the Complex Plane. In Proceedings of the 2019 International Conference on Electromagnetics in Advanced Applications (ICEAA), Granada, Spain, 9–13 September 2019; pp. 869–872. [Google Scholar] [CrossRef]
  16. Bai, J.; Shi, S.; Prather, D.W. Modified compact antipodal Vivaldi antenna for 4–50-GHz UWB application. IEEE Trans. Microw. Theory Tech. 2011, 59, 1051–1057. [Google Scholar] [CrossRef]
  17. Burger, W.; Burge, M.J. Digital Image Processing: An Algorithmic Introduction; Springer Nature: Berlin/Heidelberg, Germany, 2022. [Google Scholar]
  18. Acharya, T.; Ray, A.K. Image Processing: Principles and Applications; John Wiley & Sons: Hoboken, NJ, USA, 2005. [Google Scholar]
  19. Nalam, M.; Rani, N.; Mohan, A. Biomedical application of microstrip patch antenna. Int. J. Innov. Sci. Mod. Eng. (IJISME) 2014, 2, 6–8. [Google Scholar]
  20. Dhawan, A.P. Medical Image Analysis; John Wiley & Sons: Hoboken, NJ, USA, 2011. [Google Scholar]
  21. Nag, A.; Kaur, A.; Mittal, D.; Sidhu, E. THz rectangular slitted microstrip patch antenna design for biomedical applications, security purposes & drug detection. In Proceedings of the 2016 International Conference on Automatic Control and Dynamic Optimization Techniques (ICACDOT), Pune, India, 9–10 September 2016; IEEE: Piscataway, NJ, USA, 2016; pp. 755–758. [Google Scholar]
  22. Dhakad, S.K.; Dwivedi, U.; Baudha, S.; Bhandari, T. A slotted microstrip antenna with fractal design for X-band based surveillance applications. Int. J. Control Theory Appl. 2017, 10, 6. [Google Scholar]
  23. Page, M.J.; McKenzie, J.E.; Bossuyt, P.M.; Boutron, I.; Hoffmann, T.C.; Mulrow, C.D.; Shamseer, L.; Tetzlaff, J.M.; Akl, E.A.; Brennan, S.E.; et al. The PRISMA 2020 statement: An updated guideline for reporting systematic reviews. Int. J. Surg. 2021, 88, 105906. [Google Scholar] [CrossRef]
  24. Reig, C.; Avila-Navarro, E. Printed antennas for sensor applications: A review. IEEE Sens. J. 2013, 14, 2406–2418. [Google Scholar] [CrossRef]
  25. Priya, A.; Kumar, A.; Chauhan, B. A review of textile and cloth fabric wearable antennas. Int. J. Comput. Appl. 2015, 116. [Google Scholar] [CrossRef]
  26. Mahmud, M.Z.; Islam, M.T.; Misran, N.; Almutairi, A.F.; Cho, M. Ultra-wideband (UWB) antenna sensor based microwave breast imaging: A review. Sensors 2018, 18, 2951. [Google Scholar] [CrossRef]
  27. Jumaat, H.; Ali, M.T.; Ping, K.H.; Faudzi, N.M.; Miswadi, N.; Yon, H. A review of frequency selection and antenna arrangement system for microwave imaging in early breast cancer detection. J. Phys. Conf. Ser. 2019, 1372, 012004. [Google Scholar] [CrossRef]
  28. Imani, M.; Gollub, J.; Yurduseven, O.; Diebold, A.; Boyarsky, M.; Fromenteze, T.; Pulido-Mancera, L.; Sleasman, T.; Smith, D.R. Review of Metasurface Antennas for Computational Microwave Imaging. IEEE Trans. Antennas Propag. 2020, 68, 1860–1875. [Google Scholar] [CrossRef]
  29. Arora, G.; Maman, P.; Sharma, A.; Verma, N.; Puri, V. Systemic overview of microstrip patch antenna’s for different biomedical applications. Adv. Pharm. Bull. 2021, 11, 439. [Google Scholar] [CrossRef]
  30. Bassi, M.; Caruso, M.; Khan, M.S.; Bevilacqua, A.; Capobianco, A.D.; Neviani, A. An Integrated Microwave Imaging Radar With Planar Antennas for Breast Cancer Detection. IEEE Trans. Microw. Theory Tech. 2013, 61, 2108–2118. [Google Scholar] [CrossRef]
  31. Stauffer, P.R.; Snow, B.W.; Rodrigues, D.B.; Salahi, S.; Oliveira, T.R.; Reudink, D.; Maccarini, P.F. Non-Invasive Measurement of Brain Temperature with Microwave Radiometry: Demonstration in a Head Phantom and Clinical Case. Neuroradiol. J. 2014, 27, 3–12. [Google Scholar] [CrossRef] [PubMed]
  32. Ahdi Rezaeieh, S.; Zamani, A.; Abbosh, A.M. 3-D Wideband Antenna for Head-Imaging System with Performance Verification in Brain Tumor Detection. IEEE Antennas Wirel. Propag. Lett. 2015, 14, 910–914. [Google Scholar] [CrossRef]
  33. Koutsoupidou, M.; Karanasiou, I.S.; Kakoyiannis, C.G.; Uzunoglu, N. Two multiband uniplanar antennas for microwave breast imaging. In Proceedings of the 2015 9th European Conference on Antennas and Propagation (EuCAP), Lisbon, Portugal, 13–17 April 2015. [Google Scholar]
  34. Herrmann, T.; Mallow, J.; Plaumann, M.; Luchtmann, M.; Stadler, J.; Mylius, J.; Brosch, M.; Bernarding, J. The Travelling-Wave Primate System: A New Solution for Magnetic Resonance Imaging of Macaque Monkeys at 7 Tesla Ultra-High Field. PLoS ONE 2015, 10, e0129371. [Google Scholar] [CrossRef]
  35. Alqallaf, A.K.; Dib, R.K.; Mahmoud, S.F. Microwave Imaging Using Synthetic Radar Scheme Processing for the Detection of Breast Tumors. J. Desing 2016, 31, 98–105. [Google Scholar]
  36. Chouiti, S.M.; Merad, L.; Meriah, S.M.; Raimundo, X.; Taleb-Ahmed, A. An Efficient Image Reconstruction Method for Breast Cancer Detection Using an Ultra-Wideband Microwave Imaging System. Electromagnetics 2016, 36, 225–235. [Google Scholar] [CrossRef]
  37. Singh, S.; Sahu, B.; Singh, S.P. Conformal microstrip slot antenna with an AMC reflector for hyperthermia. J. Electromagn. Waves Appl. 2016, 30, 1603–1619. [Google Scholar] [CrossRef]
  38. Akhter, Z.; Bn, A.; Akhtar, M.J. Hemisphere lens-loaded Vivaldi antenna for time domain microwave imaging of concealed objects. J. Electromagn. Waves Appl. 2016, 30, 1183–1197. [Google Scholar] [CrossRef]
  39. Rahman, A.; Islam, M.T.; Singh, M.J.; Kibria, S.; Akhtaruzzaman, M. Electromagnetic Performances Analysis of an Ultra-wideband and Flexible Material Antenna in Microwave Breast Imaging: To Implement A Wearable Medical Bra. Sci. Rep. 2016, 6, 38906. [Google Scholar] [CrossRef]
  40. Eltigani, F.M.; Yahya, M.A.A.; Osman, M.E. Microwave imaging system for early detection of breast cancer. In Proceedings of the 2017 International Conference on Communication, Control, Computing and Electronics Engineering (ICCCCEE), Khartoum, Sudan, 16–18 January 2017; pp. 1–5. [Google Scholar] [CrossRef]
  41. Qi, C.; Hillyard, P.; Al-Husseiny, A.; Patwari, N.; Durgin, G.D. On-Wall, Wide Bandwidth E-Shaped Patch Antenna for Improved Whole-Home Radio Tomography. IEEE J. Radio Freq. Identif. 2017, 1, 22–31. [Google Scholar] [CrossRef]
  42. Taleb, S.; Merad, L.; Meriah, S.M.; Chouiti, S.M.; Boussahla, M. Tumor detection by microwave radar imaging system. In Proceedings of the 2017 Seminar on Detection Systems Architectures and Technologies (DAT), Algiers, Algeria, 20–22 February 2017; pp. 1–5. [Google Scholar] [CrossRef]
  43. Raihan, R.; Bhuiyan, M.S.A.; Hasan, R.R.; Chowdhury, T.; Farhin, R. A wearable microstrip patch antenna for detecting brain cancer. In Proceedings of the 2017 IEEE 2nd International Conference on Signal and Image Processing (ICSIP), Singapore, 4–6 August 2017; pp. 432–436. [Google Scholar] [CrossRef]
  44. Inum, R.; Rana, M.M.; Shushama, K.N.; Quader, M.A. EBG Based Microstrip Patch Antenna for Brain Tumor Detection via Scattering Parameters in Microwave Imaging System. Int. J. Biomed. Imaging 2018, 2018, 1–12. [Google Scholar] [CrossRef]
  45. Mahmud, M.Z.; Islam, M.T.; Misran, N.; Kibria, S.; Samsuzzaman, M. Microwave Imaging for Breast Tumor Detection Using Uniplanar AMC Based CPW-Fed Microstrip Antenna. IEEE Access 2018, 6, 44763–44775. [Google Scholar] [CrossRef]
  46. Scapaticci, R.; Tobon, J.; Bellizzi, G.; Vipiana, F.; Crocco, L. Design and Numerical Characterization of a Low-Complexity Microwave Device for Brain Stroke Monitoring. IEEE Trans. Antennas Propag. 2018, 66, 7328–7338. [Google Scholar] [CrossRef]
  47. Subramanian, S.; Sundarambal, B.; Nirmal, D. Investigation on Simulation-Based Specific Absorption Rate in Ultra-Wideband Antenna for Breast Cancer Detection. IEEE Sens. J. 2018, 18, 10002–10009. [Google Scholar] [CrossRef]
  48. Islam, M.; Samsuzzaman, M.; Islam, M.; Kibria, S. Experimental Breast Phantom Imaging with Metamaterial-Inspired Nine-Antenna Sensor Array. Sensors 2018, 18, 4427. [Google Scholar] [CrossRef]
  49. Ullah, M.A.; Alam, T.; Alam, M.S.; Kibria, S.; Islam, M.T. A unidirectional 3D antenna for biomedical microwave imaging based detection of abnormality in human body. Microsyst. Technol. 2018, 24, 4991–4996. [Google Scholar] [CrossRef]
  50. Ahsan, S.; Guo, Z.; Miao, Z.; Sotiriou, I.; Koutsoupidou, M.; Kallos, E.; Palikaras, G.; Kosmas, P. Design and Experimental Validation of a Multiple-Frequency Microwave Tomography System Employing the DBIM-TwIST Algorithm. Sensors 2018, 18, 3491. [Google Scholar] [CrossRef] [PubMed]
  51. Avşar Aydin, E.; Kaya Keleş, M. UWB Rectangular Microstrip Patch Antenna Design in Matching Liquid and Evaluating the Classification Accuracy in Data Mining Using Random Forest Algorithm for Breast Cancer Detection with Microwave. J. Electr. Eng. Technol. 2019, 14, 2127–2136. [Google Scholar] [CrossRef]
  52. Rokunuzzaman, M.; Ahmed, A.; Baum, T.C.; Rowe, W.S.T. Compact 3-D Antenna for Medical Diagnosis of the Human Head. IEEE Trans. Antennas Propag. 2019, 67, 5093–5103. [Google Scholar] [CrossRef]
  53. Alqallaf, A.; Dib, R. Focused Synthetic Radar Imaging Approach for Multi-tumor Screening. J. Eng. Res. 2019, 7, 232–243. [Google Scholar]
  54. Islam, M.T.; Samsuzzaman, M.; Kibria, S.; Misran, N.; Islam, M.T. Metasurface Loaded High Gain Antenna based Microwave Imaging using Iteratively Corrected Delay Multiply and Sum Algorithm. Sci. Rep. 2019, 9, 17317. [Google Scholar] [CrossRef]
  55. Ojaroudi, M.; Bila, S.; Salimi, M. A Novel Approach of Brain Tumor Detection using Miniaturized High-Fidelity UWB Slot Antenna Array. In Proceedings of the 13th European Conference on Antennas and Propagation (EuCAP), Krakow, Poland, 31 March–5 April 2019. [Google Scholar]
  56. Hammouch, N.; Ammor, H. Microwave Imaging for Early Breast Cancer Detection using CMI. In Proceedings of the 2019 7th Mediterranean Congress of Telecommunications (CMT), Fès, Morocco, 24–25 October 2019; pp. 1–5. [Google Scholar] [CrossRef]
  57. Geetharamani, G.; Aathmanesan, T. Metamaterial inspired THz antenna for breast cancer detection. SN Appl. Sci. 2019, 1, 595. [Google Scholar] [CrossRef]
  58. Islam, M.T.; Mahmud, M.Z.; Islam, M.T.; Kibria, S.; Samsuzzaman, M. A Low Cost and Portable Microwave Imaging System for Breast Tumor Detection Using UWB Directional Antenna array. Sci. Rep. 2019, 9, 15491. [Google Scholar] [CrossRef] [PubMed]
  59. Nazeri, A.; Abdolali, A.; Mehdi, M. An Extremely Safe Low-SAR Antenna with Study of Its Electromagnetic Biological Effects on Human Head. Wirel. Pers. Commun. 2019, 109, 1449–1462. [Google Scholar] [CrossRef]
  60. Mehranpour, M.; Jarchi, S.; Keshtkar, A.; Ghorbani, A.; Araghi, A.; Yurduseven, O.; Khalily, M. Robust Breast Cancer Imaging Based on a Hybrid Artifact Suppression Method for Early-Stage Tumor Detection. IEEE Access 2020, 8, 206790–206805. [Google Scholar] [CrossRef]
  61. Lin, X.; Chen, Y.; Gong, Z.; Seet, B.C.; Huang, L.; Lu, Y. Ultrawideband Textile Antenna for Wearable Microwave Medical Imaging Applications. IEEE Trans. Antennas Propag. 2020, 68, 4238–4249. [Google Scholar] [CrossRef]
  62. Hossain, A.; Islam, M.T.; Islam, M.T.; Chowdhury, M.E.H.; Rmili, H.; Samsuzzaman, M. A Planar Ultrawideband Patch Antenna Array for Microwave Breast Tumor Detection. Materials 2020, 13, 4918. [Google Scholar] [CrossRef]
  63. Kaur, G.; Kaur, A. Breast tissue tumor detection using “S” parameter analysis with an UWB stacked aperture coupled microstrip patch antenna having a “+” shaped defected ground structure. Int. J. Microw. Wirel. Technol. 2020, 12, 635–651. [Google Scholar] [CrossRef]
  64. Talukder, M.S.; Samsuzzaman, M.; Hasan, M.M.; Islam, M.T.; Azim, R.; Sahar, N.M. Multiple Rectangular Slotted Elliptical Shaped Patch Antenna For Microwave-Based Head Imaging. In Proceedings of the 2020 IEEE International Women in Engineering (WIE) Conference on Electrical and Computer Engineering (WIECON-ECE), Bhubaneswar, India, 26–27 December 2020; pp. 263–266. [Google Scholar] [CrossRef]
  65. Gopikrishnan, G.; Akhter, Z.; Bhadouria, V.S.; Akhtar, M.J. Microwave imaging of hidden crevasse in glacier terrain using metamaterial loaded eight-slot Vivaldi antenna. J. Electromagn. Waves Appl. 2020, 34, 259–274. [Google Scholar] [CrossRef]
  66. Sohani, B.; Khalesi, B.; Ghavami, N.; Ghavami, M.; Dudley, S.; Rahmani, A.; Tiberi, G. Detection of haemorrhagic stroke in simulation and realistic 3-D human head phantom using microwave imaging. Biomed. Signal Process. Control 2020, 61, 102001. [Google Scholar] [CrossRef]
  67. Rezaei, M.; Zamani, H.; Fakharzadeh, M.; Memarian, M. Quality Improvement of Millimeter-Wave Imaging Systems Using Optimized Dual Polarized Arrays. IEEE Trans. Antennas Propag. 2021, 69, 6848–6856. [Google Scholar] [CrossRef]
  68. Samsuzzaman, M.; Fakeeh, K.A.; Talukder, M.S.; Hasan, M.M.; Rahman, M.H.; Alam, M.M.; Shaik, M.S.; Islam, M.T. A double hollow rectangular-shaped patch and with the slotted ground plane monopole wideband antenna for microwave head imaging applications. Int. J. Commun. Syst. 2021, 34, e4958. [Google Scholar] [CrossRef]
  69. Selvaraj, V.; Baskaran, D.; Rao, P.; Srinivasan, P.; Krishnan, R. Breast Tissue Tumor Analysis Using Wideband Antenna and Microwave Scattering. IETE J. Res. 2021, 67, 49–59. [Google Scholar] [CrossRef]
  70. Razzicchia, E.; Lu, P.; Guo, W.; Karadima, O.; Sotiriou, I.; Ghavami, N.; Kallos, E.; Palikaras, G.; Kosmas, P. Metasurface-Enhanced Antennas for Microwave Brain Imaging. Diagnostics 2021, 11, 424. [Google Scholar] [CrossRef] [PubMed]
  71. Talukder, M.S.; Samsuzzaman, M.; Islam, M.T.; Azim, R.; Mahmud, M.Z.; Islam, M.T. Compact ellipse shaped patch with ground slotted broadband monopole patch antenna for head imaging applications. Chin. J. Phys. 2021, 72, 310–326. [Google Scholar] [CrossRef]
  72. Kaur, K.; Kaur, A. In vitro detection of skin cancer using an UWB stacked micro strip patch antenna with microwave imaging. Int. J. RF Microw. Comput.-Aided Eng. 2022, 32, e23407. [Google Scholar] [CrossRef]
  73. Mehedi, I.M.; Rao, K.P.; Al-Saggaf, U.M.; Alkanfery, H.M.; Bettayeb, M.; Jannat, R. Intelligent Tomographic Microwave Imaging for Breast Tumor Localization. Math. Probl. Eng. 2022, 2022, 4090351. [Google Scholar] [CrossRef]
  74. Naghavi, A.H.; Hassani, H.R.; Oloumi, D. Investigation and Analysis of EM Pulse Propagation Inside Human Head for High-Resolution UWB Elliptical SAR Imaging. IEEE J. Electromagn. RF Microwaves Med. Biol. 2022, 6, 485–493. [Google Scholar] [CrossRef]
  75. Hamza, M.N.; Abdulkarim, Y.I.; Saeed, S.R.; Altıntaş, O.; Mahmud, R.H.; Appasani, B.; Ravariu, C. Low-Cost Antenna-Array-Based Metamaterials for Non-Invasive Early-Stage Breast Tumor Detection in the Human Body. Biosensors 2022, 12, 828. [Google Scholar] [CrossRef]
  76. Asok, A.O.; Gokul Nath, S.J.; Vidhya, S.J.; Kunju, N.; Dey, S. Brain Tumor Detection with Compact Monopole Antennas using Microwave Medical Imaging. In Proceedings of the 2022 IEEE Microwaves, Antennas, and Propagation Conference (MAPCON), Bangalore, India, 12–16 December 2022; pp. 439–443. [Google Scholar] [CrossRef]
  77. Mohamed Junaid, K.; Sheela, J.J.J.; Logeshwaran, M. Design and Analysis of Novel Face Shaped Microstrip Array Antenna of UWB for Early Breast Tumor Detection. In Proceedings of the 2022 Sixth International Conference on I-SMAC (IoT in Social, Mobile, Analytics and Cloud) (I-SMAC), Dharan, Nepal, 10–12 November 2022; pp. 424–429. [Google Scholar] [CrossRef]
  78. Jahan, I.; Faruk Noman, M.O.; Ahasan Kabir, M. Design of a Slotted Patch Circular Antenna Array for Breast Tumor Identification. In Proceedings of the 2022 4th International Conference on Sustainable Technologies for Industry 4.0 (STI), Dhaka, Bangladesh, 17–18 December 2022; pp. 1–6. [Google Scholar] [CrossRef]
  79. M, A.B.S.; K, N.K.; M, M.F.; Vasan S, M.S.S. Design of Microstrip Patch Antenna for the Detection of Malignant Tumor. In Proceedings of the 2022 4th International Conference on Inventive Research in Computing Applications (ICIRCA), Coimbatore, India, 21–23 September 2022; pp. 1–8. [Google Scholar] [CrossRef]
  80. Ara, A.; Sheikh, J.A.; Khan, U.R.; Ali, B.; Javeed, S. Fractal Antenna Design with Slotted Partial Ground For Breast Tumor Detection. In Proceedings of the 2022 5th International Conference on Multimedia, Signal Processing and Communication Technologies (IMPACT), Aligarh, India, 26–27 November 2022; pp. 1–6. [Google Scholar] [CrossRef]
  81. Subramanian, S.; Sundarambal, B.; Karthikeyini, C.; Bommi, R.M.; Jacintha, V. Investigation on SAR in Hexagonal Shape Monopole Ultra-Wideband Antenna to Identify Female Breast Cancer. In Proceedings of the 2022 6th International Conference on Devices, Circuits and Systems (ICDCS), Coimbatore, India, 21–22 April 2022; pp. 125–129. [Google Scholar] [CrossRef]
  82. Blanco-Angulo, C.; Martínez-Lozano, A.; Juan, C.G.; Gutiérrez-Mazón, R.; Arias-Rodríguez, J.; Ávila Navarro, E.; Sabater-Navarro, J.M. Validation of an RF Image System for Real-Time Tracking Neurosurgical Tools. Sensors 2022, 22, 3845. [Google Scholar] [CrossRef]
  83. Zerrad, F.e.; Taouzari, M.; Makroum, E.M.; El Aoufi, J.; Islam, M.T.; Özkaner, V.; Abdulkarim, Y.I.; Karaaslan, M. Multilayered metamaterials array antenna based on artificial magnetic conductor’s structure for the application diagnostic breast cancer detection with microwave imaging. Med. Eng. Phys. 2022, 99, 103737. [Google Scholar] [CrossRef]
  84. Talukder, M.S.; Alam, M.M.; Islam, M.T.; Moniruzzaman, M.; Azim, R.; Alharbi, A.G.; Khan, A.I.; Moinuddin, M.; Samsuzzaman, M. Rectangular slot with inner circular ring patch and partial ground plane based broadband monopole low SAR patch antenna for head imaging applications. Chin. J. Phys. 2022, 77, 250–268. [Google Scholar] [CrossRef]
  85. Alam, M.M.; Talukder, M.S.; Samsuzzaman, M.; Khan, A.I.; Kasim, N.; Mehedi, I.M.; Azim, R. W-shaped slot-loaded U-shaped low SAR patch antenna for microwave-based malignant tissue detection system. Chin. J. Phys. 2022, 77, 233–249. [Google Scholar] [CrossRef]
  86. Bhargava, D.; Rattanadecho, P. Microwave imaging of breast cancer: Simulation analysis of SAR and temperature in tumors for different age and type. Case Stud. Therm. Eng. 2022, 31, 101843. [Google Scholar] [CrossRef]
  87. Hossain, A.; Islam, M.T.; Beng, G.K.; Kashem, S.B.A.; Soliman, M.S.; Misran, N.; Chowdhury, M.E.H. Microwave brain imaging system to detect brain tumor using metamaterial loaded stacked antenna array. Sci. Rep. 2022, 12, 16478. [Google Scholar] [CrossRef] [PubMed]
  88. Sreelekshmi, S.; Sankar, S.P. Design and analysis of novel miniaturised triple band antenna for breast cancer detection. Microsyst. Technol. 2022, 28, 1715–1726. [Google Scholar] [CrossRef]
  89. Moussa, M.N.; Madi, M.A.; Kabalan, K.Y. Breast Tumor Detection, Sizing and Localization Using a 24-Element Antenna Array. IEEE J. Biomed. Health Inform. 2022, 26, 5109–5121. [Google Scholar] [CrossRef]
  90. Poorgholam-Khanjari, S.; Zarrabi, F.B. Dual-band THz antenna with SNG loads for biosensing and early skin cancer detection with Fano response: A numerical study. Proc. Inst. Mech. Eng. Part L J. Mater. Des. Appl. 2022, 236, 2326–2335. [Google Scholar] [CrossRef]
  91. Jamlos, M.A.; Jamlos, M.F.; Mustafa, W.A.; Othman, N.A.; Rohani, M.N.K.H.; Saidi, S.A.; Sarip, M.S.M.; Mohd Nawi, M.A.H. Reduced Graphene Oxide UWB Array Sensor: High Performance for Brain Tumor Imaging and Detection. Nanomaterials 2022, 13, 27. [Google Scholar] [CrossRef] [PubMed]
  92. Naghavi, A.H.; Hassani, H.R.; Oloumi, D. Improving the Probability of Stroke Detection inside the Human Head Using Wideband Polarimetric Synthetic Aperture Radar Imaging. Int. J. RF Microw. Comput.-Aided Eng. 2023, 2023, 5644220. [Google Scholar] [CrossRef]
  93. Zerrad, F.e.; Taouzari, M.; Makroum, E.M.; Aoufi, J.E.; Qanadli, S.D.; Karaaslan, M.; Al-Gburi, A.J.A.; Zakaria, Z. Microwave Imaging Approach for Breast Cancer Detection Using a Tapered Slot Antenna Loaded with Parasitic Components. Materials 2023, 16, 1496. [Google Scholar] [CrossRef]
  94. Grover, P.; Singh, H.S.; Kumar Sahu, S. Simulation Study of a Compact UWB Antenna for Detection of Breast Tumors using Microwave Imaging Technique. In Proceedings of the 2023 International Conference on Device Intelligence, Computing and Communication Technologies, (DICCT), Dehradun, India, 17–18 March 2023; pp. 150–154. [Google Scholar] [CrossRef]
  95. Grover, P.; Singh, H.S.; Sahu, S.K. Simulation Study of a Miniaturized UWB Antenna loaded with FSS Reflector for Breast Tumor Detection. In Proceedings of the 2023 International Conference on Recent Advances in Electrical, Electronics, Ubiquitous Communication, and Computational Intelligence (RAEEUCCI), Chennai, India, 19–21 April 2023; pp. 1–5. [Google Scholar] [CrossRef]
  96. Cicchetti, R.; Pisa, S.; Piuzzi, E.; Testa, O. A Double Fourier-Transform Imaging Algorithm for a 24 GHz FMCW Short-Range Radar. Sensors 2023, 23, 4119. [Google Scholar] [CrossRef]
  97. Samsuzzaman, M.; Siam Talukder, M.; Alqahtani, A.; Alharbi, A.G.; Azim, R.; Soliman, M.S.; Tariqul Islam, M. Circular slotted patch with defected grounded monopole patch antenna for microwave-based head imaging applications. Alex. Eng. J. 2023, 65, 41–57. [Google Scholar] [CrossRef]
  98. Yushchenko, V.; Edvabnik, V.; Gofman, O.; Duluba, T.; Legkii, V. Method of object image reconstruction using a circular antenna array. Optoelectron. Instrum. Data Process. 2020, 56, 614–622. [Google Scholar] [CrossRef]
  99. Dastres, R.; Soori, M. Advanced image processing systems. Int. J. Imagining Robot. 2021, 21, 27–44. [Google Scholar]
  100. Elahi, M.A. Confocal Microwave Imaging and Artifact Removal Algorithms for the Early Detection of Breast Cancer. Ph.D. Thesis, University of Galway, Galway, Ireland, 2018. [Google Scholar]
  101. Elahi, M.A.; O’Loughlin, D.; Lavoie, B.R.; Glavin, M.; Jones, E.; Fear, E.C.; O’Halloran, M. Evaluation of image reconstruction algorithms for confocal microwave imaging: Application to patient data. Sensors 2018, 18, 1678. [Google Scholar] [CrossRef] [PubMed]
  102. Mucci, R. A comparison of efficient beamforming algorithms. IEEE Trans. Acoust. Speech Signal Process. 1984, 32, 548–558. [Google Scholar] [CrossRef]
  103. O’Halloran, M.; Byrne, D.; Elahi, M.A.; Conceição, R.C.; Jones, E.; Glavin, M. Confocal Microwave Imaging. In An Introduction to Microwave Imaging for Breast Cancer Detection; Springer International Publishing: Cham, Switzerland, 2016; pp. 47–73. [Google Scholar]
  104. Karam, S.A.S.; O’Loughlin, D.; Asl, B.M. A novel sophisticated form of DMAS beamformer: Application to breast cancer detection. Biomed. Signal Process. Control 2022, 74, 103516. [Google Scholar]
  105. Lim, H.B.; Nhung, N.T.T.; Li, E.P.; Thang, N.D. Confocal microwave imaging for breast cancer detection: Delay-multiply-and-sum image reconstruction algorithm. IEEE Trans. Biomed. Eng. 2008, 55, 1697–1704. [Google Scholar]
  106. Byrne, D.; O’Halloran, M.; Glavin, M.; Jones, E. Data independent radar beamforming algorithms for breast cancer detection. Prog. Electromagn. Res. 2010, 107, 331–348. [Google Scholar] [CrossRef]
  107. Elahi, M.A.; Lavoie, B.; Porter, E.; Olavini, M.; Jones, E.; Fear, E.; O’Halloran, M. Comparison of radar-based microwave imaging algorithms applied to experimental breast phantoms. In Proceedings of the 2017 XXXIInd General Assembly and Scientific Symposium of the International Union of Radio Science (URSI GASS), Montreal, QC, Canada, 19–26 August 2017; IEEE: Piscataway, NJ, USA, 2017; pp. 1–4. [Google Scholar]
  108. Chouiti, S.M.; Merad, L.; Meriah, S.M.; Raimundo, X. Microwave imaging of embedded object using an enhanced image reconstruction algorithm. Telecommun. Radio Eng. 2015, 74. [Google Scholar] [CrossRef]
  109. Kolenderska, S.M.; Szkulmowski, M. Artefact-removal algorithms for Fourier domain quantum optical coherence tomography. Sci. Rep. 2021, 11, 18585. [Google Scholar] [CrossRef] [PubMed]
  110. Elahi, M.A.; Glavin, M.; Jones, E.; O’Halloran, M. Artifact removal algorithms for microwave imaging of the breast. Prog. Electromagn. Res. 2013, 141, 185–200. [Google Scholar] [CrossRef]
  111. Oufi, A.A. Computer Modeling Using The Finite-Difference Time-Domain (FDTD) Method for Electromagnetic Wave Propagation; The University of Maine: Orono, ME, USA, 2021. [Google Scholar]
  112. Nagel, J.R. The Finite-Difference Time-Domain (FDTD) Algorithm; Department of Electrical and Computer Engineering, University of Utah: Salt Lake City, UT, USA, 2010. [Google Scholar]
  113. Bruyant, P.P. Analytic and iterative reconstruction algorithms in SPECT. J. Nucl. Med. 2002, 43, 1343–1358. [Google Scholar] [PubMed]
  114. Defrise, M.; Gullberg, G.T. Image reconstruction. Phys. Med. Biol. 2006, 51, R139. [Google Scholar] [CrossRef]
  115. Messali, Z.; Chetih, N.; Serir, A.; Boudjelal, A. A Comparative Study of Analytical, Iterative and Bayesian Reconstruction Algorithms in Computed Tomography (CT). Int. J. Comput. Commun. Eng. 2012, 1, 222–226. [Google Scholar] [CrossRef]
  116. Desai, S.D.; Kulkarni, L. A quantitative comparative study of analytical and iterative reconstruction techniques. Int. J. Image Process. (IJIP) 2010, 4, 307. [Google Scholar]
  117. Geyer, L.L.; Schoepf, U.J.; Meinel, F.G.; Nance, J.W., Jr.; Bastarrika, G.; Leipsic, J.A.; Paul, N.S.; Rengo, M.; Laghi, A.; De Cecco, C.N. State of the art: Iterative CT reconstruction techniques. Radiology 2015, 276, 339–357. [Google Scholar] [CrossRef]
  118. Bertsekas, D.P.; Tsitsiklis, J.N. Some aspects of parallel and distributed iterative algorithms—A survey. Automatica 1991, 27, 3–21. [Google Scholar] [CrossRef]
  119. Schafer, R.W.; Mersereau, R.M.; Richards, M.A. Constrained iterative restoration algorithms. Proc. IEEE 1981, 69, 432–450. [Google Scholar] [CrossRef]
  120. Patino, M.; Fuentes, J.M.; Singh, S.; Hahn, P.F.; Sahani, D.V. Iterative reconstruction techniques in abdominopelvic CT: Technical concepts and clinical implementation. Am. J. Roentgenol. 2015, 205, W19–W31. [Google Scholar] [CrossRef]
  121. Wang, Y.; Yang, J.; Yin, W.; Zhang, Y. A new alternating minimization algorithm for total variation image reconstruction. SIAM J. Imaging Sci. 2008, 1, 248–272. [Google Scholar] [CrossRef]
  122. Tong, Z.; Gao, J.; Yuan, D. Advances of deep learning applications in ground-penetrating radar: A survey. Constr. Build. Mater. 2020, 258, 120371. [Google Scholar] [CrossRef]
  123. Li, S.; Gu, X.; Xu, X.; Xu, D.; Zhang, T.; Liu, Z.; Dong, Q. Detection of concealed cracks from ground penetrating radar images based on deep learning algorithm. Constr. Build. Mater. 2021, 273, 121949. [Google Scholar] [CrossRef]
  124. Kobashigawa, J.S.; Youn, H.s.; Iskander, M.F.; Yun, Z. Classification of buried targets using ground penetrating radar: Comparison between genetic programming and neural networks. IEEE Antennas Wirel. Propag. Lett. 2011, 10, 971–974. [Google Scholar] [CrossRef]
  125. Economou, N.; Benedetto, F.; Bano, M.; Tzanis, A.; Nyquist, J.; Sandmeier, K.J.; Cassidy, N. Advanced ground penetrating radar signal processing techniques. Signal Process. 2017, 132, 197–200. [Google Scholar] [CrossRef]
  126. Chen, H.D.; Tsao, Y.H. Low-profile PIFA array antennas for UHF band RFID tags mountable on metallic objects. IEEE Trans. Antennas Propag. 2010, 58, 1087–1092. [Google Scholar] [CrossRef]
  127. Grabssi, W.; Izza, S.; Azrar, A. Design and analysis of a microstrip patch antenna for medical applications. In Proceedings of the 2017 5th International Conference on Electrical Engineering-Boumerdes (ICEE-B), Boumerdes, Algeria, 29–31 October 2017; IEEE: Piscataway, NJ, USA, 2017; pp. 1–6. [Google Scholar]
  128. Guerrero-Vásquez, L.F.; López-Nores, M.; Pazos-Arias, J.J.; Robles-Bykbaev, V.E.; Bustamante-Cacao, K.C.; Jara-Quito, H.J.; Bravo-Torres, J.F.; Campoverde-Jara, P.X. Systematic Review of Technological Aids to Social Interaction in Autistic Spectrum Disorders from Transversal Perspectives: Psychology, Technology and Therapy. Rev. J. Autism Dev. Disord. 2022, 11, 459–488. [Google Scholar] [CrossRef]
Figure 1. PRISMA method scheme.
Electronics 14 01063 g001
Figure 4. Article classification by geometry design.
Electronics 14 01063 g004
Figure 5. Types of antenna designs, including (a) Slot insertion, (b) Basic geometry, (c) Array antenna, (d) Slit insertion, (e) Vivaldi geometry, (f) Bowtie slot, (g) Fractal slot (h) Fractal array (i) Spiral (j) Bowtie Array. Each design has unique characteristics related to image adquisition applications. These are representative figures of antennas, intended as a visual reference for the design type, but not necessarily functional with the current dimensions.
Electronics 14 01063 g005
Figure 6. Article classification by substrates used in microstrip antennas.
Electronics 14 01063 g006
Figure 7. Article classification by image reconstruction algorithms.
Electronics 14 01063 g007
Figure 8. Article classification by application type.
Electronics 14 01063 g008
Figure 9. Article classification by application type and antenna bandwidth.
Electronics 14 01063 g009
Figure 10. Article classification by application type and antenna operating frequency.
Electronics 14 01063 g010
Figure 11. Article classification by application type and antenna size.
Electronics 14 01063 g011
Figure 12. Article classification by reconstruction algorithms and antenna bandwidth.
Electronics 14 01063 g012
Figure 13. Article classification by reconstruction algorithms and antenna operating frequency.
Electronics 14 01063 g013
Figure 14. Article classification by reconstruction algorithm and antenna area.
Electronics 14 01063 g014
Figure 15. Standard deviation values of different dimensions of our review.
Electronics 14 01063 g015
Table 1. Summary of related works.
Ref.ApproachMethodologyLimitations
[24]Review on the use of printed antennas in sensors. Applicability in telecommunications, biomedical devices, and environmental detection.Review of scientific databases, classifying antennas based on their characteristics, materials, and applications.Lack of experimental data in certain applications and the need for further studies on antenna miniaturization.
[25]Review of textile-based wearable antennas, analyzing their design, applications in telecommunications, and biomedical monitoring.Comparative study of wearable antennas reported in the literature, evaluating radiation efficiency, flexibility, and materials used.High production cost and challenges in integrating flexible antennas into clothing without compromising electromagnetic performance.
[26]Exploration of portable antennas used in body-centric communications, highlighting advantages and limitations.Analysis of academic literature on advancements in wearable antennas, classified by material type, coupling efficiency, and body absorption level.Limitations in transmission efficiency due to proximity to the human body, affecting antenna performance under various conditions.
[27]Exploration of microwave-based imaging techniques applied to anomaly detection in biomedical structures and industrial materials.Study of recent image reconstruction methods, comparing different microstrip antenna architectures and their effects on image quality.Lack of experimental validation for some proposed models and reliance on computational simulations.
[28]Review on the use of metasurface antennas in microwave image reconstruction, emphasizing computational techniques.Analysis of recent literature on metasurface antennas, highlighting advances in imaging algorithms and improvements in antenna directivity.Challenges in real-time reconstruction algorithm implementation and limitations in transmission efficiency.
[29]Analysis of flexible and textile antennas used in biomedical applications and portable wireless communications.Comparison of flexible antennas based on innovative materials, classified by radiation efficiency, flexibility, and adaptability to different environments.High variability in electromagnetic response due to bending and compression of textile material.
Table 2. Summary of articles included in the review.
IdentifierAuthorSourceYearCountry
[30]Bassi et al.Web Of Science2013Italy
[31]Stauffer et al.SAGE2014United States
[32]Rezaeieh et al.Web Of Science2015Australia
[33]Koutsoupidou et al.IEEE2015Greece
[34]Herrmann et al.Scopus2015Germany
[35]Alqallaf et al.Web Of Science2016Kuwait
[36]Mohammed et al.Taylor and Francis2016Algeria
[37]Singh et al.Taylor and Francis2016India
[38]Akhter et al.Taylor and Francis2016India
[39]Rahman et al.Springer2016Malaysia
[40]Eltigani et al.IEEE2017Sudan
[41]Qi et al.IEEE2017United States
[42]Taleb et al.IEEE2017Algeria
[43]Raihan et al.IEEE2017Bangladesh
[44]Inum et al.Web Of Science2018Bangladesh
[45]Mahmud et al.Web Of Science2018Bangladesh
[46]Scapaticci et al.IEEE2018Italy
[47]Subramanian et al.IEEE2018India
[48]Islam et al.MDPI2018Malaysia
[49]Ullah et al.Springer2018Malaysia
[50]Ahsan et al.Scopus2018Basel
[51]Aydin and KelesWeb Of Science2019Turkey
[52]Rokunuzzaman et al.Web Of Science2019Australia
[53]Alqallaf and DibWeb Of Science2019Kuwait
[54]Islam et al.Web Of Science2019Bangladesh
[55]Ojaroudi et al.IEEE2019France
[56]Hammouch and AmmorIEEE2019Morocco
[57]Geetharamani and AathmanesanSpringer2019India
[58]Islam et al.Springer2019Malaysia
[59]Nazeri et al.Springer2019Iran
[60]Mehranpour et al.Web Of Science2020Iran
[61]Lin et al.Web Of Science2020New Zealand
[62]Hossain et al.Web Of Science2020Malaysia
[63]Kaur and KaurWeb Of Science2020India
[64]Talukder et al.IEEE2020Bangladesh
[65]Gopikrishnan et al.Taylor and Francis2020India
[66]Sohani et al.ScienceDirect2020United Kingdom
[67]Rezaei et al.Web Of Science2021Iran
[68]Samsuzzaman et al.Web Of Science2021Bangladesh
[69]Selvaraj et al.Web Of Science2021India
[70]Razzicchia et al.MDPI2021United Kingdom
[71]Talukder et al.ScienceDirect2021Bangladesh
[72]Kaur and KaurHindawi2022India
[73]Mehedi et al.IEEE2022Saudi Arabia
[74]Naghavi et al.Web Of Science2022Iran
[75]Hamza et al.Web Of Science2022Iraq
[76]Asok et al.IEEE2022India
[77]Mohamed et al.IEEE2022India
[78]Jahan et al.IEEE2022Bangladesh
[79]Vasan et al.IEEE2022India
[80]Ara et al.IEEE2022India
[81]Subramanian et al.IEEE2022India
[82]Blanco-AnguloMDPI2022Spain
[83]Zerrad et al.ScienceDirect2022Morocco
[84]Talukder et al.ScienceDirect2022Bangladesh
[85]Alam et al.ScienceDirect2022Saudi Arabia
[86]Bhargava and RattanadechoScienceDirect2022Thailand
[87]Hossain et al.Springer2022Malaysia
[88]Sreelekshmi and SankarSpringer2022India
[89]Moussa et al.Scopus2022Lebanon
[90]Poorgholam and ZarrabSAGE2022France
[91]Jamlos et al.Web Of Science2023Malaysia
[92]Naghavi et al.Web Of Science2023Iran
[93]Zerrad et al.Web Of Science2023Morocco
[94]Grover et al.IEEE2023India
[95]Grover et al.IEEE2023India
[96]Cicchetti et al.MDPI2023Italy
[97]Samsuzzaman et al.ScienceDirect2023Bangladesh
Table 3. Article classification by geometry design.
Geometric DesignReferences
Slot[32,34,36,37,42,43,45,47,52,59,60,61,63,64,68,69,71,75,76,83,84,85,86,90,93,95,97]
Basic geometric[30,39,40,46,49,50,55,56,62,66,70,74,81]
Array[33,44,48,67,77,78,87,88,91,94,96]
Slit[41,51,57,72,73,79]
Vivaldi[38,54,58,65,82]
Bowtie slot[35,53]
Fractal slot[80]
Fractal array[89]
Spiral[31]
Bowtie array[92]
Table 4. Article classification by substrate material.
SubstratesReferences
FR4[31,32,36,38,41,43,44,45,46,47,48,50,51,52,53,55,56,59,62,63,64,65,66,68,69,71,72,73,74,75,76,77,78,79,80,81,82,83,84,85,86,89,92,94,95,97]
Rogers RT/Duroid 5880[37,54,70,93]
Alumina[33,35]
Photonic crystal[49,57]
Rogers 4003C[30,67]
Arlon AD 1000[88]
Quartz[90]
Perfluorohexyl[39]
Polyester[61]
Polymethylmethacrylate[34]
RO4003[42]
Roger RO4350B[96]
Rogers RT/duroid 6010[60]
Rogers RT5880 and RO4350B[87]
Rogers RT/duroid 5870[58]
Taconic[91]
Titanate[40]
Table 5. Article classification by substrate characteristics.
ReferencesSubstrates ε r Thickness (mm)
[30]Roger RO4003C3.551.524
[31]FR44.41.6
[32]FR44.41.6
[33]Alumina9.41.57
[34]Polymethylmethacrylate2.8–3.00.1–5
[35]Alumina4.00.1287
[36]FR43.340.794
[37]Rogers RT/Duroid 58802.20.508
[38]FR44.41.6
[39]Perfluorohexy2.641.6
[40]Titanate500–20001
[41]FR43.663.2
[42]RO40033.340.794
[43]FR44.350.8
[44]FR44.41.6
[45]FR44.61.6
[46]FR44.31.6
[47]FR44.41.6
[48]FR44.61.6
[49]Photonic crystal12
[50]FR44.41.6
[51]FR44.71.6
[52]FR44.31.6
[53]FR44.41.6
[54]Rogers RT/Duroid 58802.21.57
[55]FR44.40.8
[56]FR44.31.58
[57]Photonic crystal1–40.03–0.3
[58]Rogers RT/duroid 58702.331.57
[59]FR44.31.65
[60]Rogers RT/duroid 601091.27
[61]Polyester2.1930.5
[62]FR44.41.6
[63]FR44.41.57
[64]FR44.31.6
[65]FR44.31
[66]FR44.71.6
[67]Rogers 4003C3.60.508
[68]FR44.31.5
[69]FR44.41.6
[70]Rogers RT/Duroid 588010.21.27
[71]FR44.41.57
[72]FR44.41.6
[73]FR44.41.6
[74]FR44.41.6
[75]FR44.41.6
[76]FR44.41.6
[77]FR44.41.6
[78]FR44.41.6
[79]FR44.51.6
[80]FR44.41.6
[81]FR44.41.6
[82]FR44.41.52
[83]FR44.41.6
[84]FR44.31.5
[85]FR44.41.6
[86]FR43.340.794
[87]Rogers RT5880 and RO4350B2.2, 3.661.575, 1.524
[88]Arlon AD 100010.23.175
[89]FR44.41.6
[90]Quartz3.7510
[91]Taconic2.21.58
[92]FR44.42.0
[93]Rogers RT/Duroid 58802.21.575
[94]FR44.31.6
[95]FR44.41.6
[96]Roger RO4350B3.660.762
[97]FR44.41.5
Table 6. Article classification by image reconstruction algorithms.
AlgorithmsReferences
Simulation on CST Studio[37,43,47,52,57,59,64,65,68,71,75,77,78,79,81,83,90]
Algorithm DAS[55,60,63,76,82,85]
Algorithm DMAS[30,39,45,48,49,97]
Simulation on HFSS[31,32,33,61,80]
Algorithm GPR[69,88,94,95]
Fourier Transform[38,40,96]
Algorithm IC-CF-DMAS[54,72,87]
Simulator MERIT[84,93]
Algorithm DBIM-TwIST[50,70]
Artifact Removal[46,66]
Algorithm DASI[36,42]
Algorithm IC-DAS[58,62]
Synthetic Aperture Radar E[53,92]
CMI[35,44]
Removal CMI-Based[56,86]
ADAL[67]
FBP[73]
GBP[74]
IDAS[91]
The Random Forest[51]
Image processing toolbox Matlab[89]
RTI[41]
IRM[34]
Table 7. Article classification by application type.
ApplicationsReferences
Breast Cancer Detection[30,33,35,36,39,40,42,47,48,49,51,53,54,56,57,58,60,63,69,73,75,77,78,79,80,81,83,86,88,89,93,94,95]
Brain Tumors[32,43,44,45,55,62,68,71,76,82,84,85,87,91,97]
Cerebrovascular Accidents[46,64,66,70,92]
Object Detection[38,59,67,96]
Medical Diagnosis[50,52]
Skin Cancer[72,90]
Wear in Construction Materials[41]
Bone fractures in the human body[61]
Tumor in muscle tissue[37]
Detection of cracks in glacier terrain[65]
Head temperature monitoring[31]
Pulse propagation within the head[74]
MRI in monkey brains[34]
Disclaimer/Publisher’s Note: The statements, opinions and data contained in all publications are solely those of the individual author(s) and contributor(s) and not of MDPI and/or the editor(s). MDPI and/or the editor(s) disclaim responsibility for any injury to people or property resulting from any ideas, methods, instructions or products referred to in the content.

