Article

Multi-Agent Reinforcement Learning-Based Control Method for Pedestrian Guidance Using the Mojiko Fireworks Festival Dataset

1
Faculty of Advanced Science and Technology, Kumamoto University, 2-39-1 Kurokami, Chuo-ku, Kumamoto-shi 860-8555, Kumamoto, Japan
2
Q-NET Security Company Ltd., 4-19-1 Obiyama, Chuo-ku, Kumamoto-shi 862-0924, Kumamoto, Japan
*
Author to whom correspondence should be addressed.
Electronics 2025, 14(6), 1062; https://doi.org/10.3390/electronics14061062
Submission received: 12 February 2025 / Revised: 3 March 2025 / Accepted: 5 March 2025 / Published: 7 March 2025
(This article belongs to the Special Issue AI-Based Pervasive Application Services)

Abstract

:
With increasing incidents due to congestion at events, effective pedestrian guidance has become a critical safety concern. Recent research has explored the application of reinforcement learning to crowd simulation, where agents learn optimal actions through trial and error to maximize rewards based on environmental states. This study investigates the use of reinforcement learning and simulation techniques to mitigate pedestrian congestion through improved guidance systems. We employ the Multi-Agent Deep Deterministic Policy Gradient (MA-DDPG), a multi-agent reinforcement learning approach, and propose an enhanced method for learning the Q-function for actors within the MA-DDPG framework. Using the Mojiko Fireworks Festival dataset as a case study, we evaluated the effectiveness of our proposed method by comparing congestion levels with existing approaches. The results demonstrate that our method successfully reduces congestion, with agents exhibiting superior cooperation in managing crowd flow. This improvement in agent coordination suggests the potential for practical applications in real-world crowd management scenarios.

1. Introduction

The scale of public events has expanded in recent years, partially due to the spread of social networking services (SNSs). This growth in scale has exacerbated the problem of congestion from large concentrations of people. Congestion causes pedestrian stagnation, prolonged overcrowding, and accidents, including some fatal accidents due to overcrowding. The key to solving these problems is human flow guidance. Research has been conducted on using deep learning to predict people flow [1], using data assimilation to reproduce pedestrian flow [2,3,4,5,6], and applying multi-modal machine learning for adaptive human interactions [7]. Research is also underway to apply artificial intelligence techniques, especially reinforcement learning [8] and simulation, to the study of people guidance with traffic lights [9,10]. These studies have been conducted against a background of the further development of simulation technology and the emergence of artificial intelligence that surpasses humans in games such as Go, Shogi, and chess [11,12]. Pedestrian guidance at the Mojiko Fireworks Festival [13] is currently conducted by incorporating the model predictive control framework [14] in control engineering. However, there has not been much research on using machine learning techniques such as reinforcement learning to guide pedestrian flow at events.
In our research, we focus on reinforcement learning techniques and aim to reduce congestion when guiding pedestrians during events. We achieve this by offering guidance at multiple points along the large-scale flow of people at the Mojiko Fireworks Festival. Guides need to receive information on congestion at each location and cooperate with other guides to function effectively. The focus of this study is on multi-agent reinforcement learning due to the existence of multiple guidance points and the need for cooperation [15,16].
We begin by applying MA-DDPG [17], a multi-agent reinforcement learning method, to crowd guidance in a crowd simulator. In MA-DDPG, the actor outputs a probability distribution that sums to 1 for each guidance, and then the guidance value is determined by sampling from the probability distribution. However, a mechanism that outputs actions based on probabilities is not sufficient for learning to take actions with high Q-functions.
Inspired by the use of Q-learning in a DQN (deep Q-network) [18] to facilitate reinforcement learning, we propose a method for learning Q-functions for MA-DDPG actors. In our method, the actor predicts the Q-function from its own local information and outputs it. Meanwhile, a critic outputs the Q-function from the information of all agents. In multi-agent reinforcement learning, an actor needs to cooperate with other agents while taking local information as input. In the proposed method, agents perform cooperative learning while using local information by comparing the Q-function output from the critic to the Q-function of the actor from the information of all agents.
The remainder of this paper is structured as follows. Related research on multi-agent reinforcement learning is discussed in Section 2. In Section 3, we provide details of our proposed multi-agent reinforcement learning method. In Section 4, we give an overview of the experimental environment. In Section 5, we present the experimental results and discuss the performance of our system. Finally, we present our conclusions in Section 6.

2. Related Work

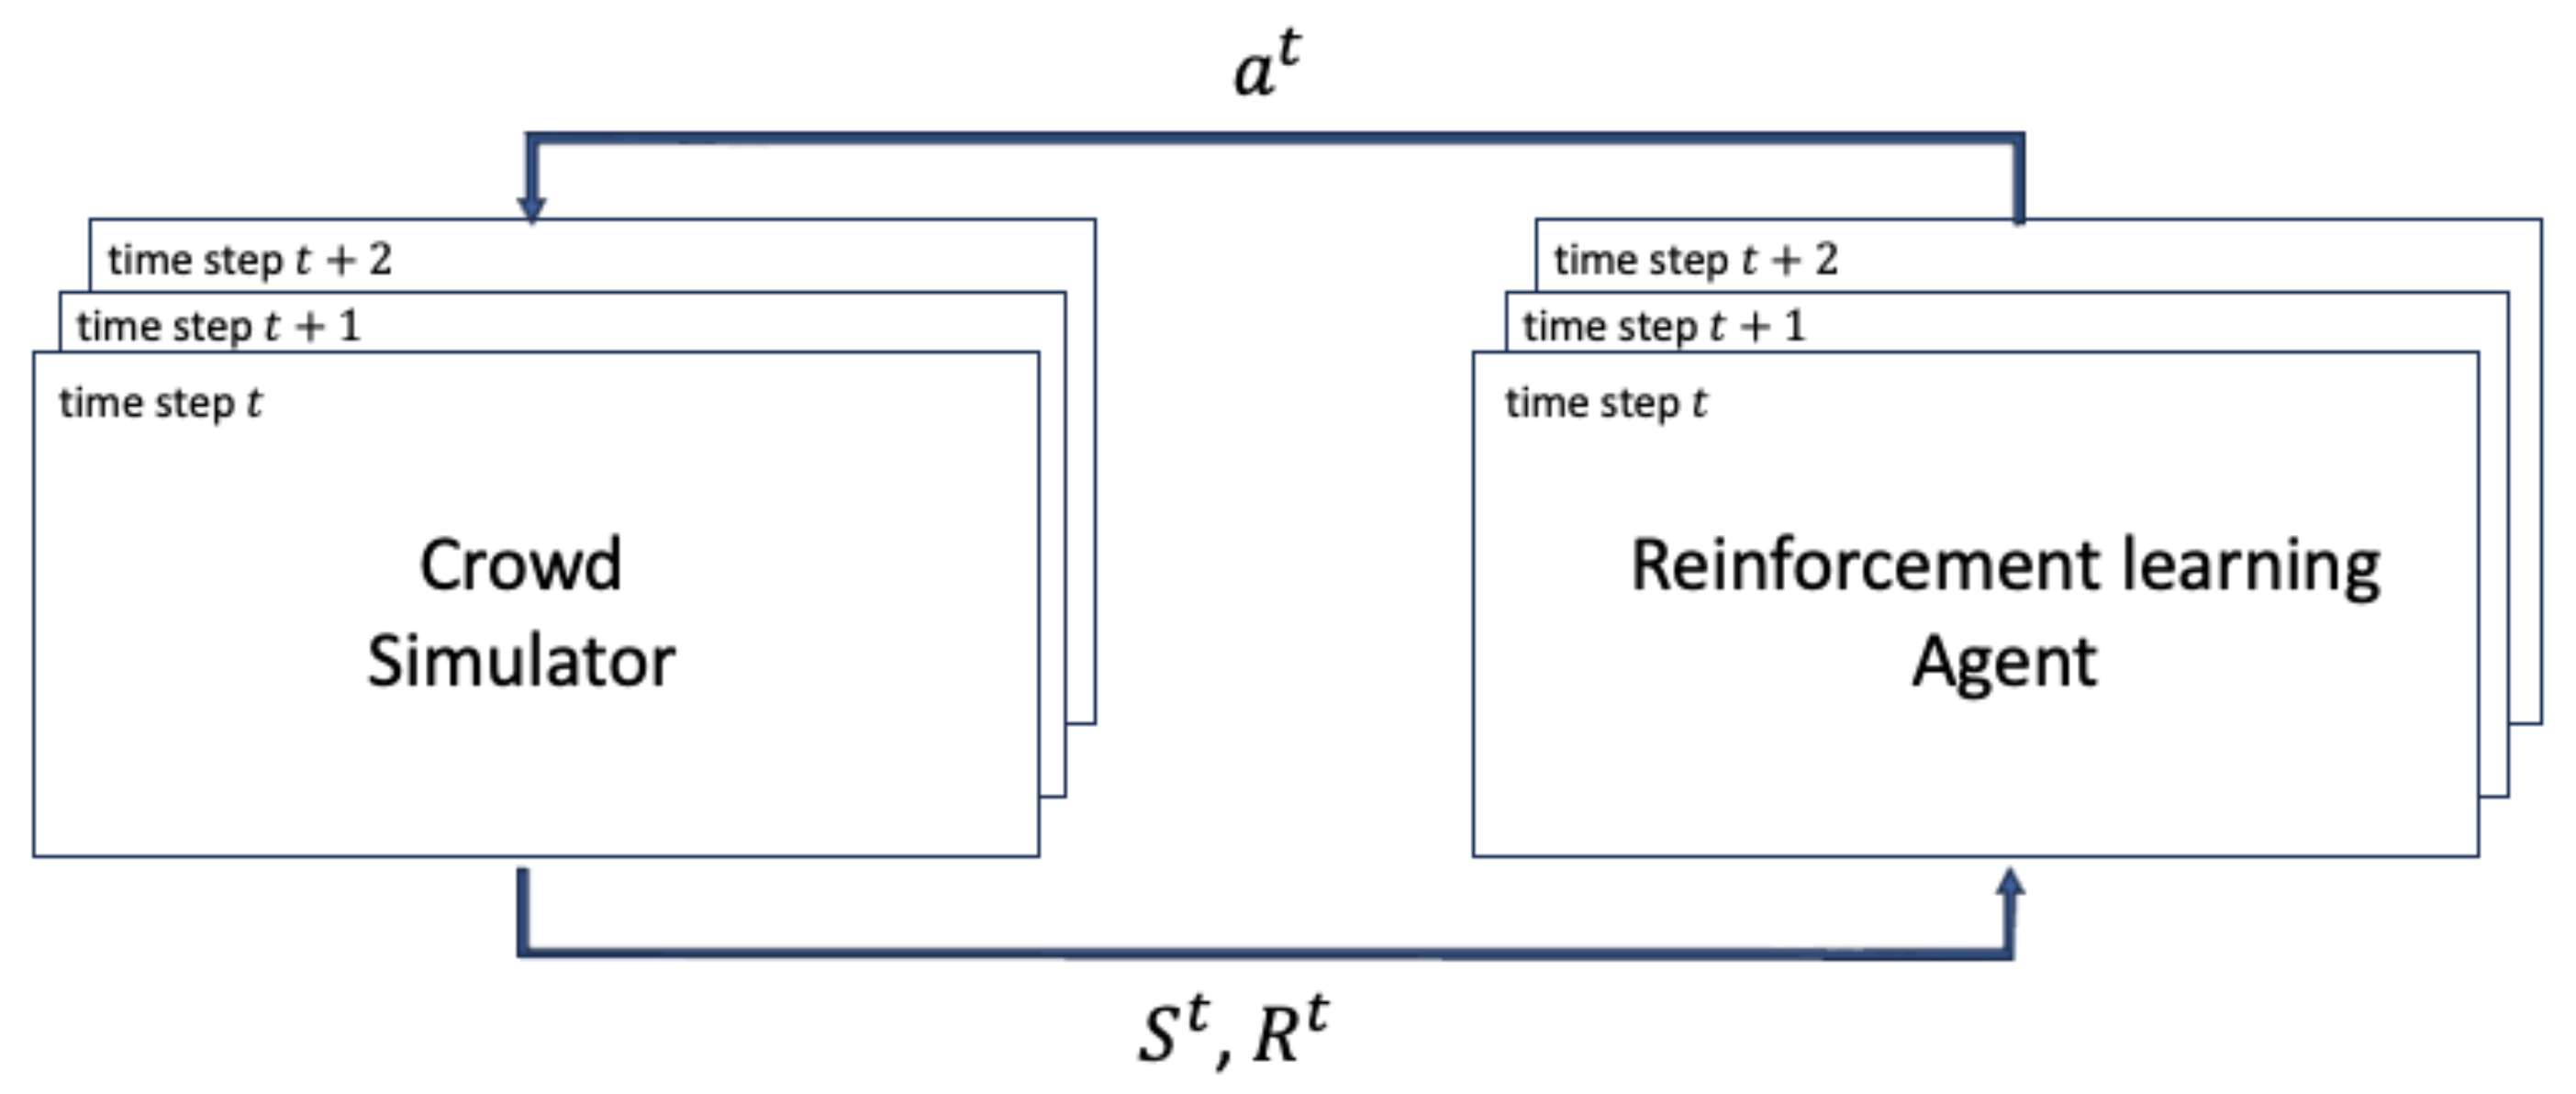
2.1. Multi-Agent Reinforcement Learning Framework

In multi-agent reinforcement learning, agents learn by interacting with simulators and other environments. Let S n t denote the states observed by the agent n at time step t, and let R n t be the reward. Let S t and R t denote the vectors of states and rewards summarized at each step for all agents. The agents receive S t and R t from the environment. Agent n then outputs the action a n t and the Q-function Q n ( S t , a t ) from S n t . Let a t and Q ( S t , a t ) denote the sums of these for each step and for all agents. The a t is sent to the simulator as actions, and Q ( S t , a t ) is used to train the agents. The simulator receives the actions output by the agents. The simulator and agents repeat these operations at each time step. The relationship between the agents and the simulator is illustrated in Figure 1.

2.2. MA-DDPG

MA-DDPG is an extension of the DDPG (deep deterministic policy gradient) [19], a method for performing single-agent reinforcement learning, that can be applied to multi-agent reinforcement learning. MA-DDPG consists of two main components: an actor and a critic. The actor outputs actions based on its own information. The critic outputs a Q-function based on the observed information of all agents and the actions output by the actor. In this paper, the input to the actor is referred to as local information and the input to the critic is referred to as global information. In MA-DDPG, both actor and critic models are trained during training, and only actor models are used for guidance during testing. Figure 2 illustrates a schematic of the actor and critic models in MA-DDPG. The actor and critic models are processed in the order shown in the figure.
The loss function used by the critic during learning is
L θ n = E s , a , r , s Q n μ s , a 1 , , a N r i + γ Q n μ s , a 1 , , a N a j = μ j s j 2
where a n is the action output by agent n at a certain step, s is the agent’s observation information at a certain step, r n is the reward obtained at the next step, γ is the discount rate in reinforcement learning, s is the agent’s observation information at the next step, μ is the continuous policy, and Q n μ s , a 1 , , a N is the Q-function.
The actor learns parameters using the policy gradient theorem [20]. The loss function used by the actor during learning is
θ n J θ n = E θ n log π n a n s n Q n π s , a 1 , , a N
where θ n is the parameter of agent n, J θ n is the expected cumulative reward, and π is the policy. MA-DDPG learns through exploration by performing actions in an establishing manner, but it becomes difficult to find the correct Q-function when all of the action probabilities are similar.

2.3. Cooperative Multi-Agent Reinforcement Learning
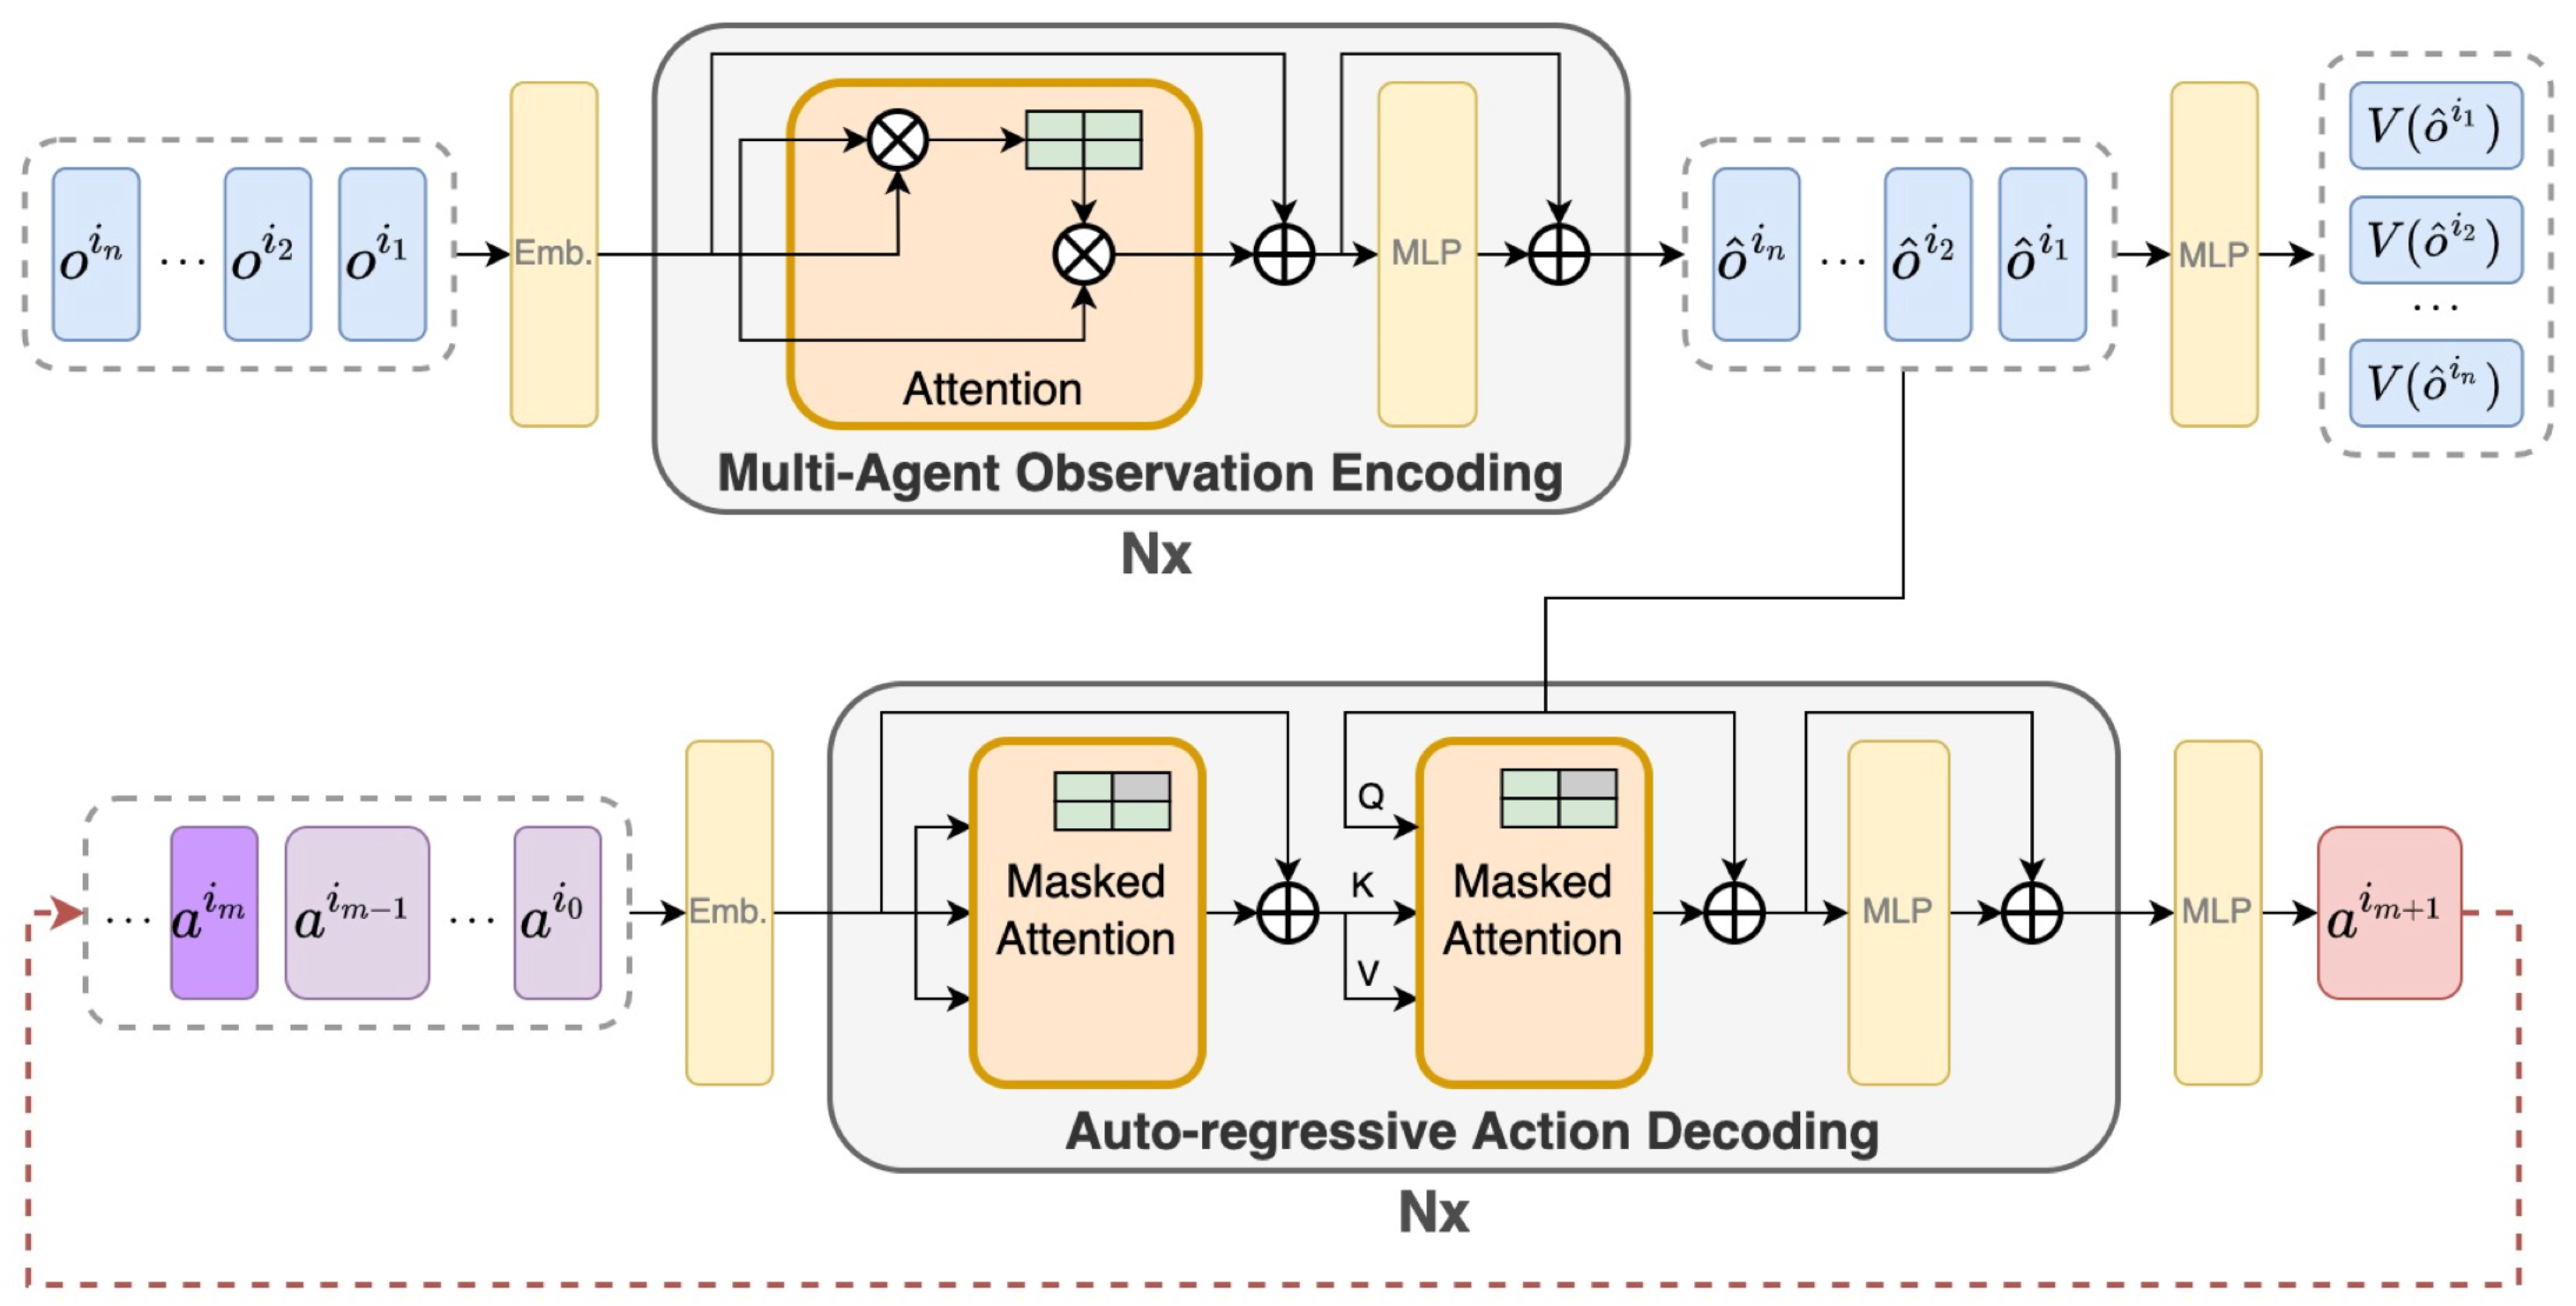
In cooperative multi-agent reinforcement learning with a single joint reward signal, the reward is given by
R 1 = R 2 = R 3 = = R n
where R n is the reward for agent n. In this framework, the rewards for all models are the same, so the maximum reward sum for each agent always maximizes the reward for all agents.
Research on cooperative multi-agent reinforcement learning with a single joint reward signal has been active as an extension of MA-DDPG. However, these methods assume that each agent has the same reward and, consequently, cannot assign different rewards to different agents. Furthermore, it is assumed that the direction of the gradient in the reward of each agent always coincides with the direction of the gradient in the reward of all agents. In other words, the equation that cooperative multi-agent reinforcement learning with a single joint reward signal must satisfy is
Q t o t Q a 0 , a
where Q a is the reward for each agent, and Q t o t is the sum of the rewards of all agents. Equation (4) cannot be used when agents may inhibit each other’s reward acquisition or when the overall reward gradient may differ from the reward gradient of a particular agent.

2.4. MAT

An overview of the decision-making process in MAT [21] is given in Figure 3. MAT considers each agent’s decisions as a sequence, and an agent decides its action based on the current observed state and the previously determined actions of other agents. This model incorporates the attention mechanism used for time series data to perform multi-agent reinforcement learning.
An outline of MAT as a whole is given in Figure 4. MAT treats actions as a sequence, so the first agent to make a decision cannot obtain information about the actions of subsequent agents.

3. Methodology

This section describes the details of our proposed method, which is illustrated in Figure 5. Our method is inspired by DQN, a single-agent reinforcement learning method. Furthermore, it inherits the same actor–critic structure from MA-DDPG, as described in Section 2.2. The actor outputs a Q-function Q n ( S n t , a n t ) for each action a n t from local information S n t , while the critic outputs a Q-function Q n ( S t , a t ) from global information S t and the actions of all agents a t .

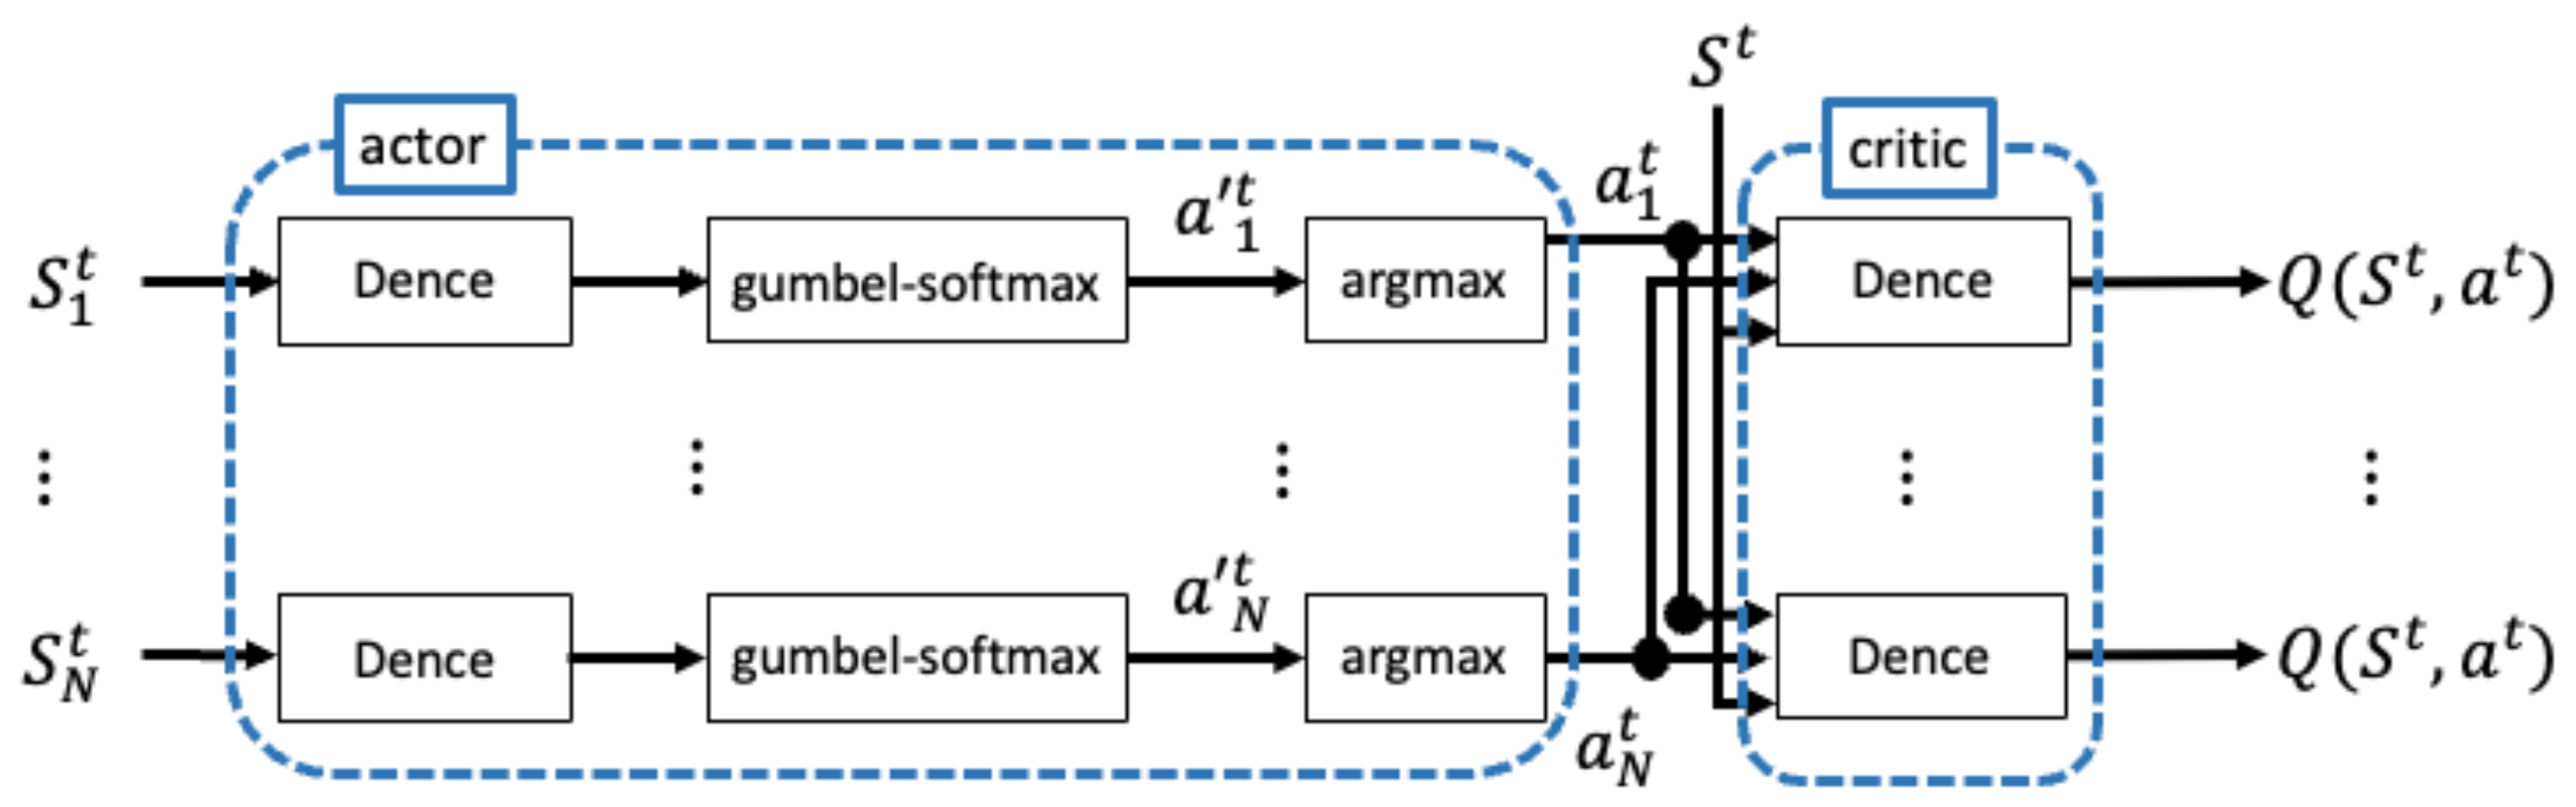
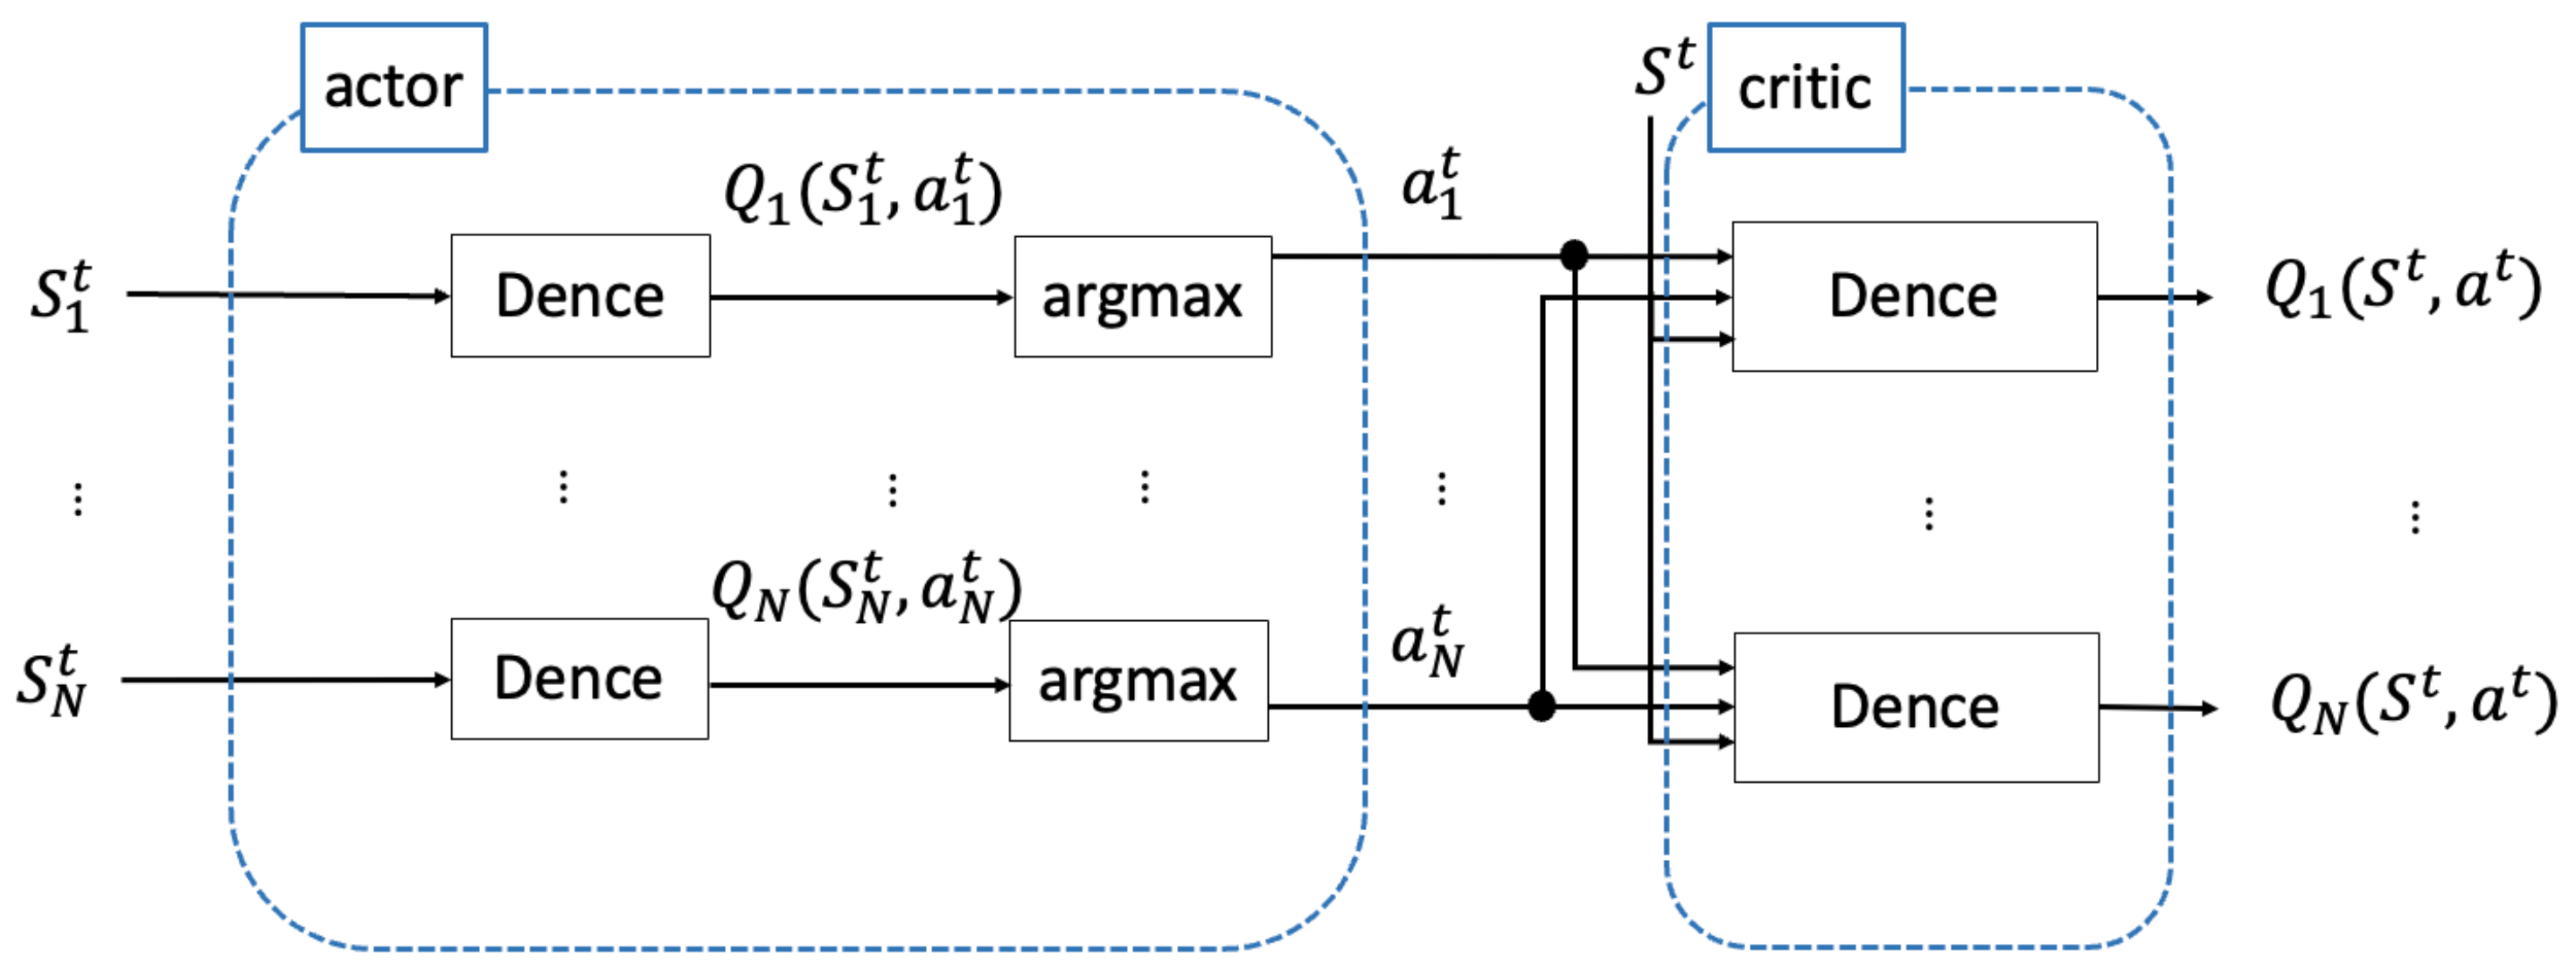
3.1. Actor–Critic Structure
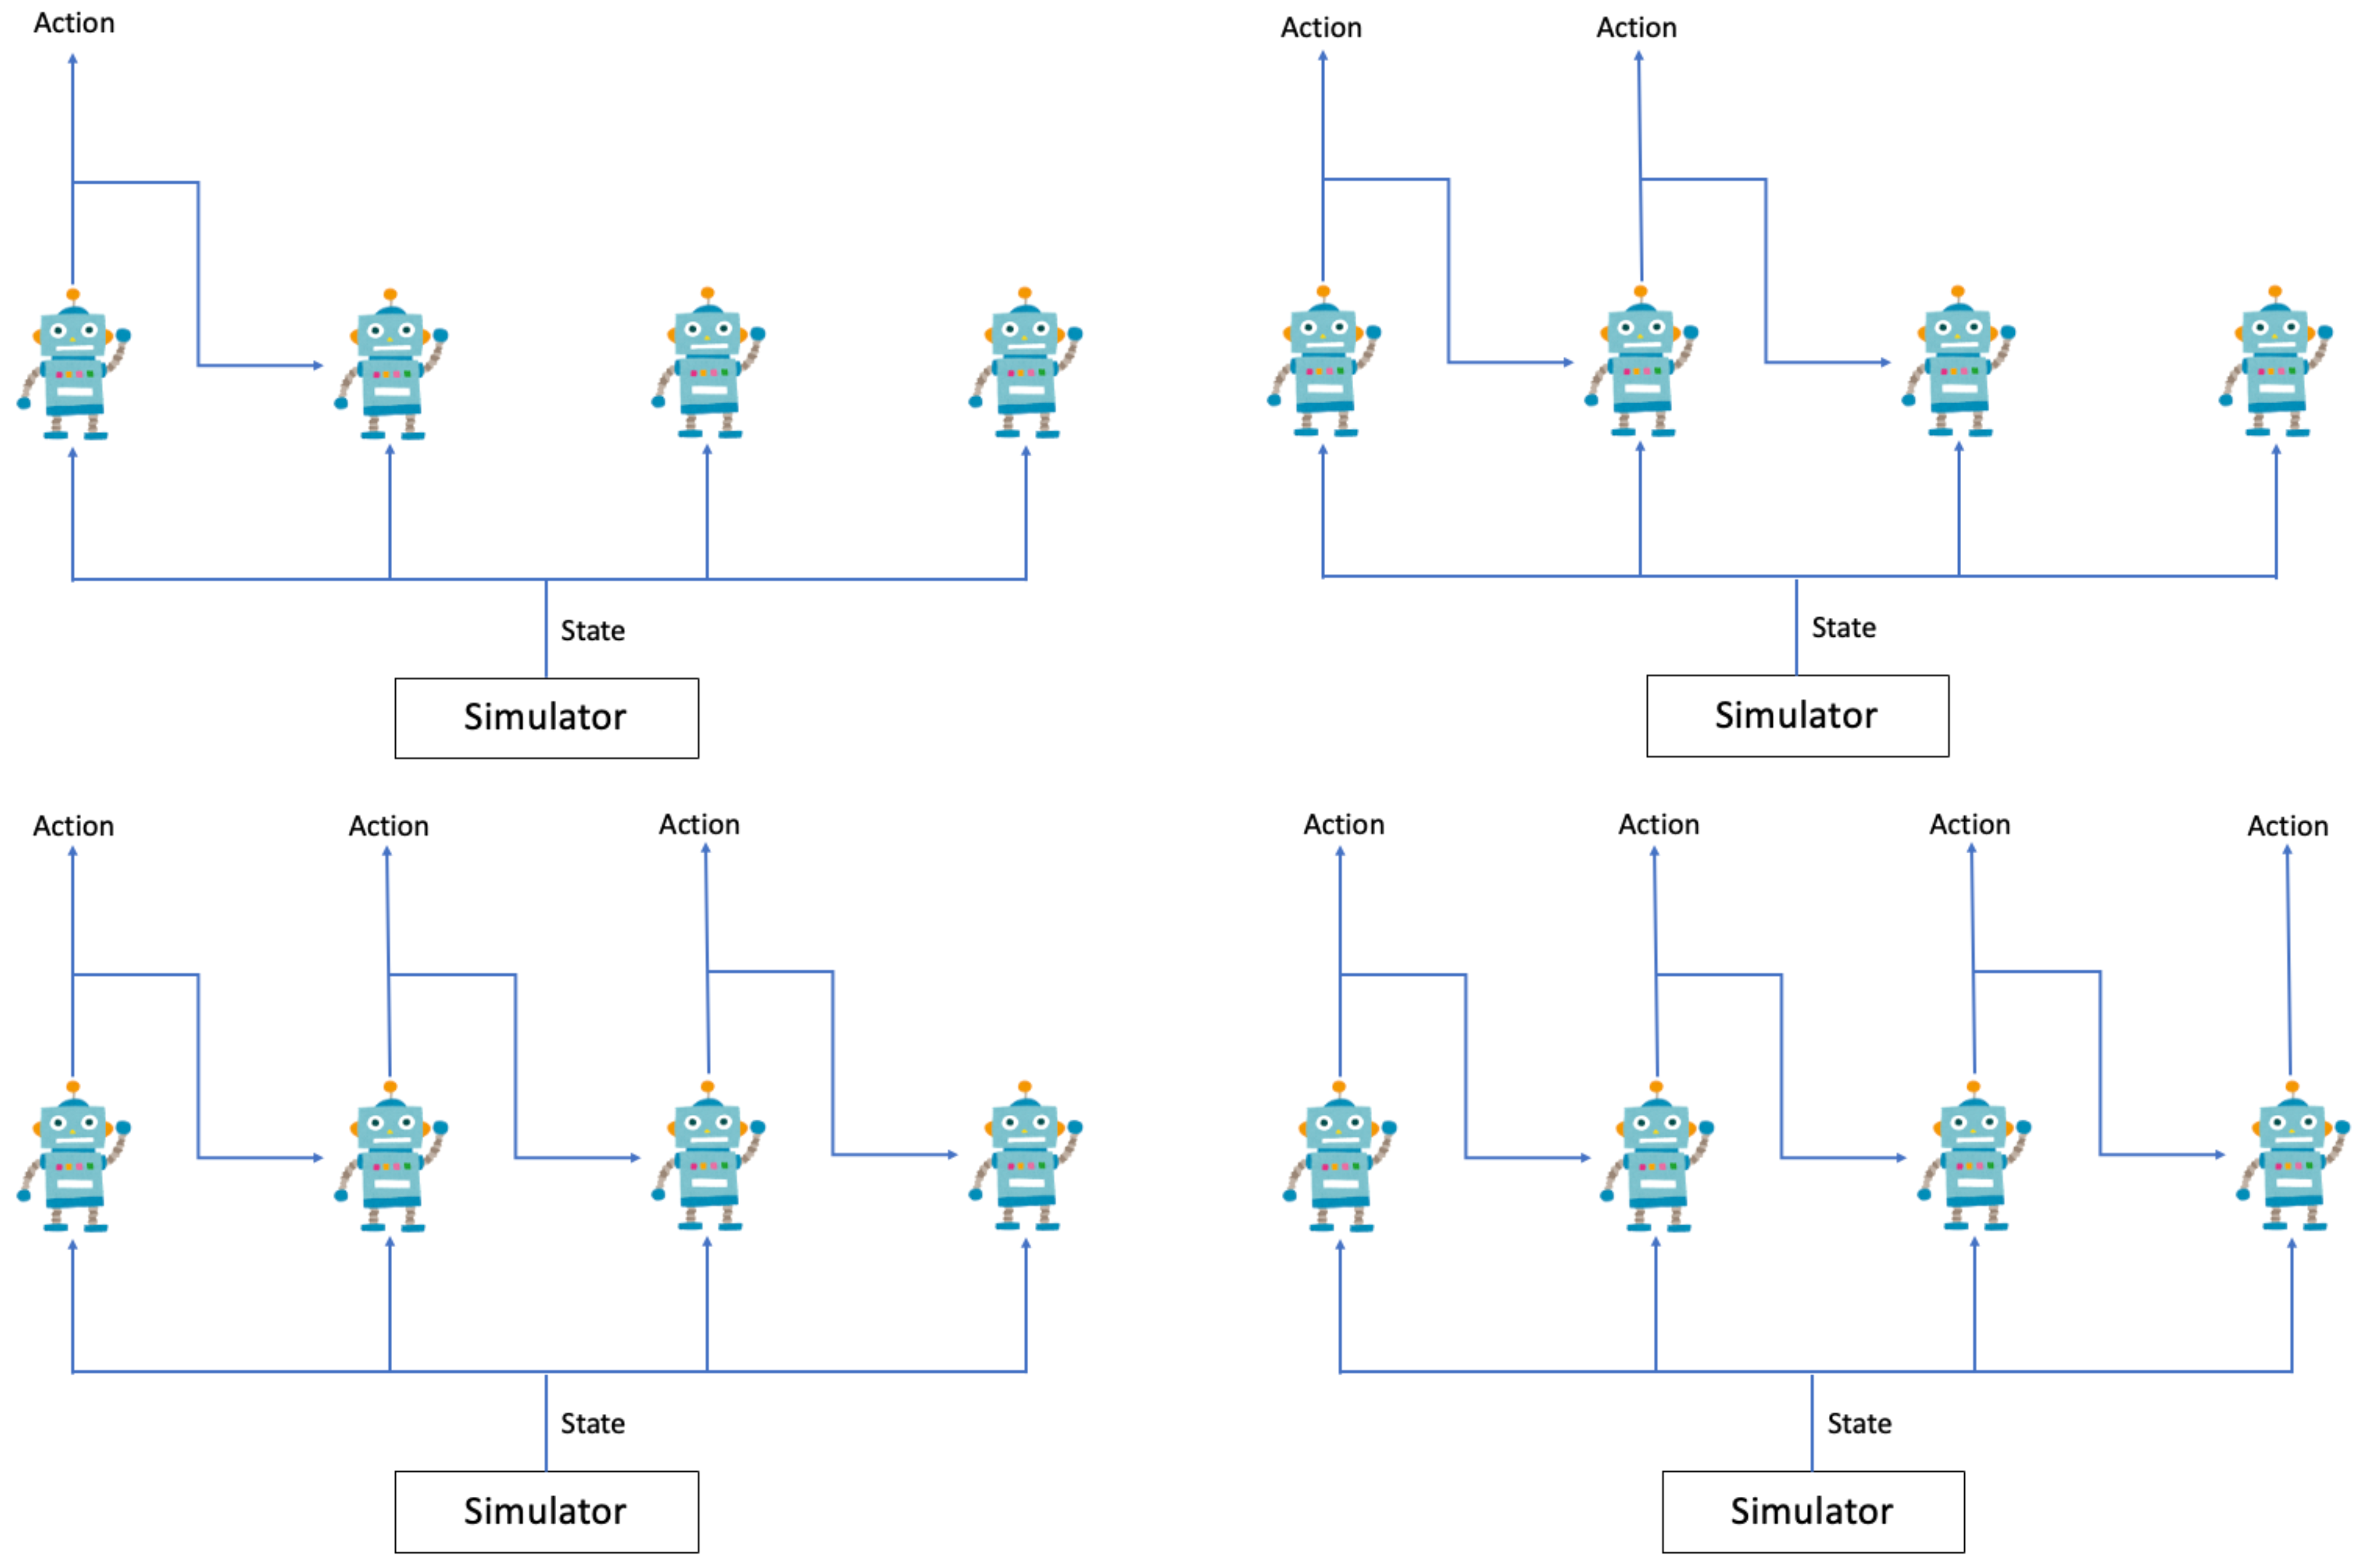
In our method, the inputs and outputs of the critic, the structure of the model, and the learning method are the same as those used in MA-DDPG. On the other hand, the actor is changed so that it outputs a Q-function for each action taken by the agent. Both the actor and critic output a Q-function, but they differ in that the actor outputs a Q-function based only on local information S n t , whereas the critic outputs a Q-function based on global information S t and the actions a t of all other agents.
The loss function for the actor to output a Q-function from local information only is
( Q n ( S t , a t ) Q n ( S n t , a n t ) ) 2
where Q n ( S t , a t ) is the Q-function output by the critic, and Q n ( S n t , a n t ) is the Q-function output by the actor. The actor uses the loss function in Equation (5) to train the Q-function of the critic as teaching data. The critic then outputs the Q-function from global information. This loss function effectively allows the actor to output a Q-function that communicates with other agents while not directly communicating with them.

3.2. Exploration

MA-DDPG uses Gumbel-Softmax to perform exploration, but our method does not, so another exploration method is needed. We use the ϵ -greedy [22] method, which is the basic exploration method for DQN. In the ϵ -greedy method, the exploration probability is given by
α = max ( ϵ min , ϵ max ( N fin N now ) N fin )
where ϵ max is the initial exploration probability, ϵ min is the final exploration probability, N fin is the number of simulations to be performed before the exploration probability reaches its final value, and N now is the number of current simulations. The exploration probability determines whether to provide random guidance or guidance according to the Q-function output by the model.

4. Experimental Environment
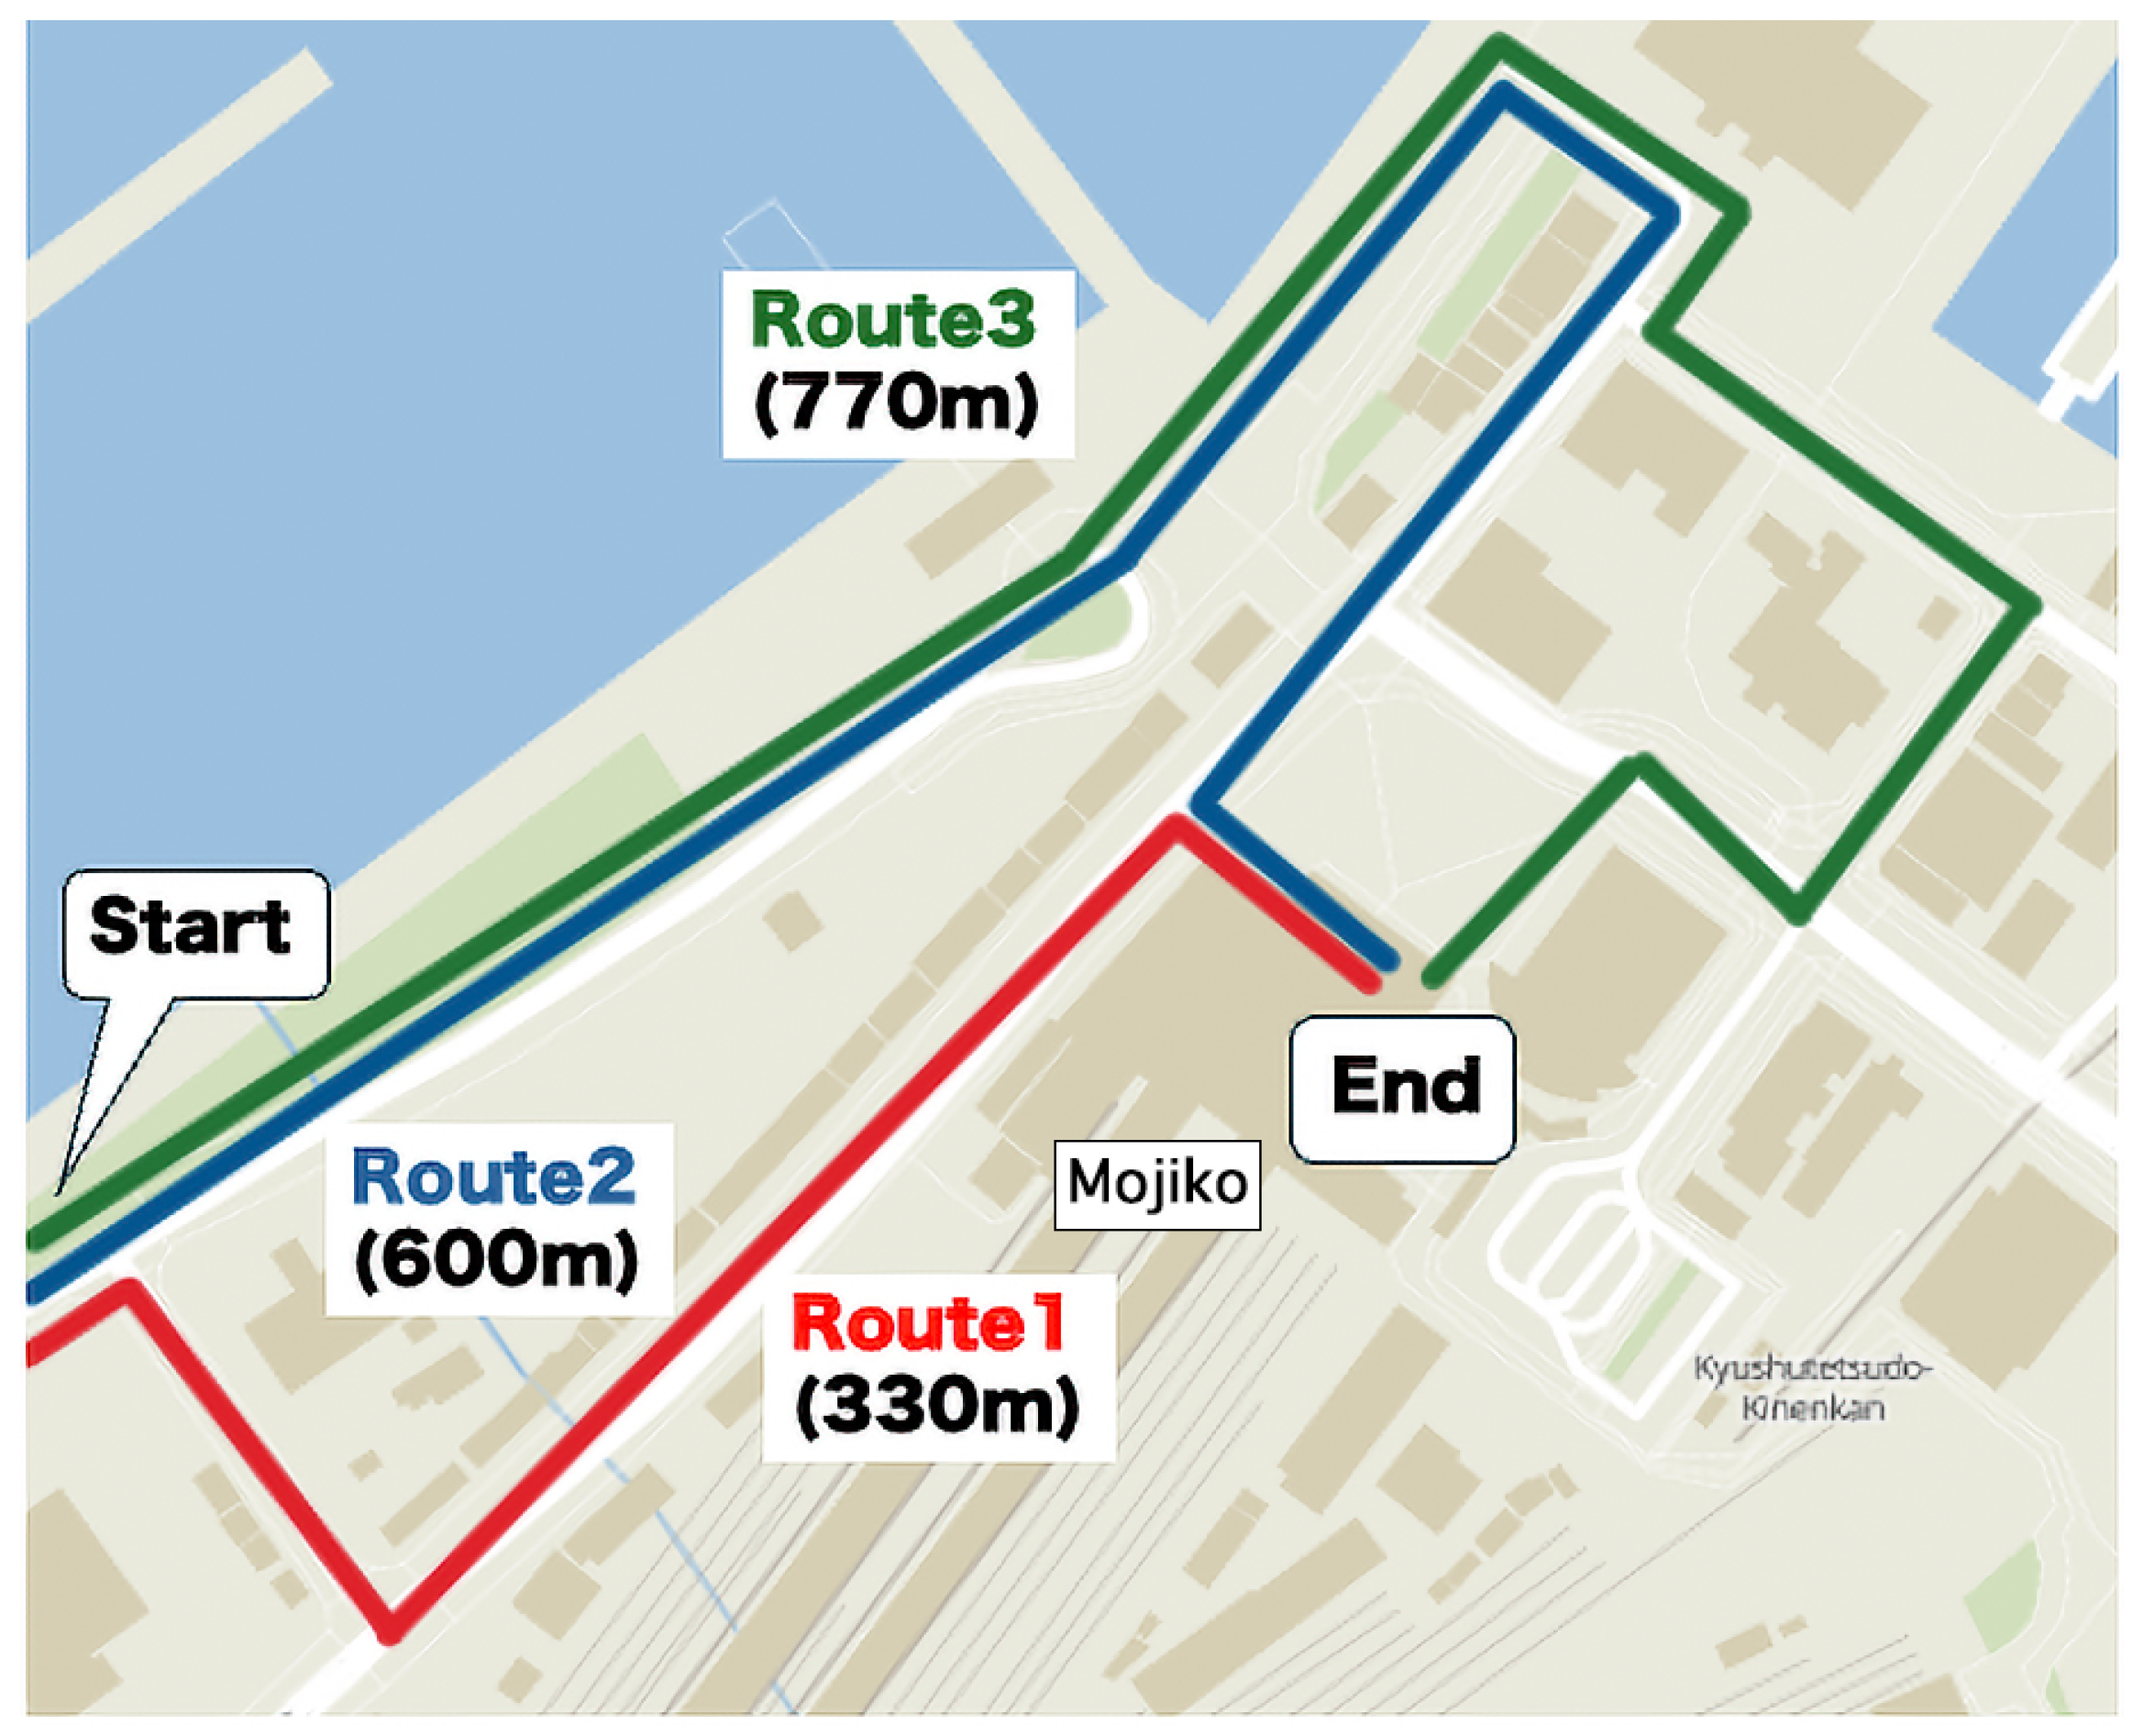
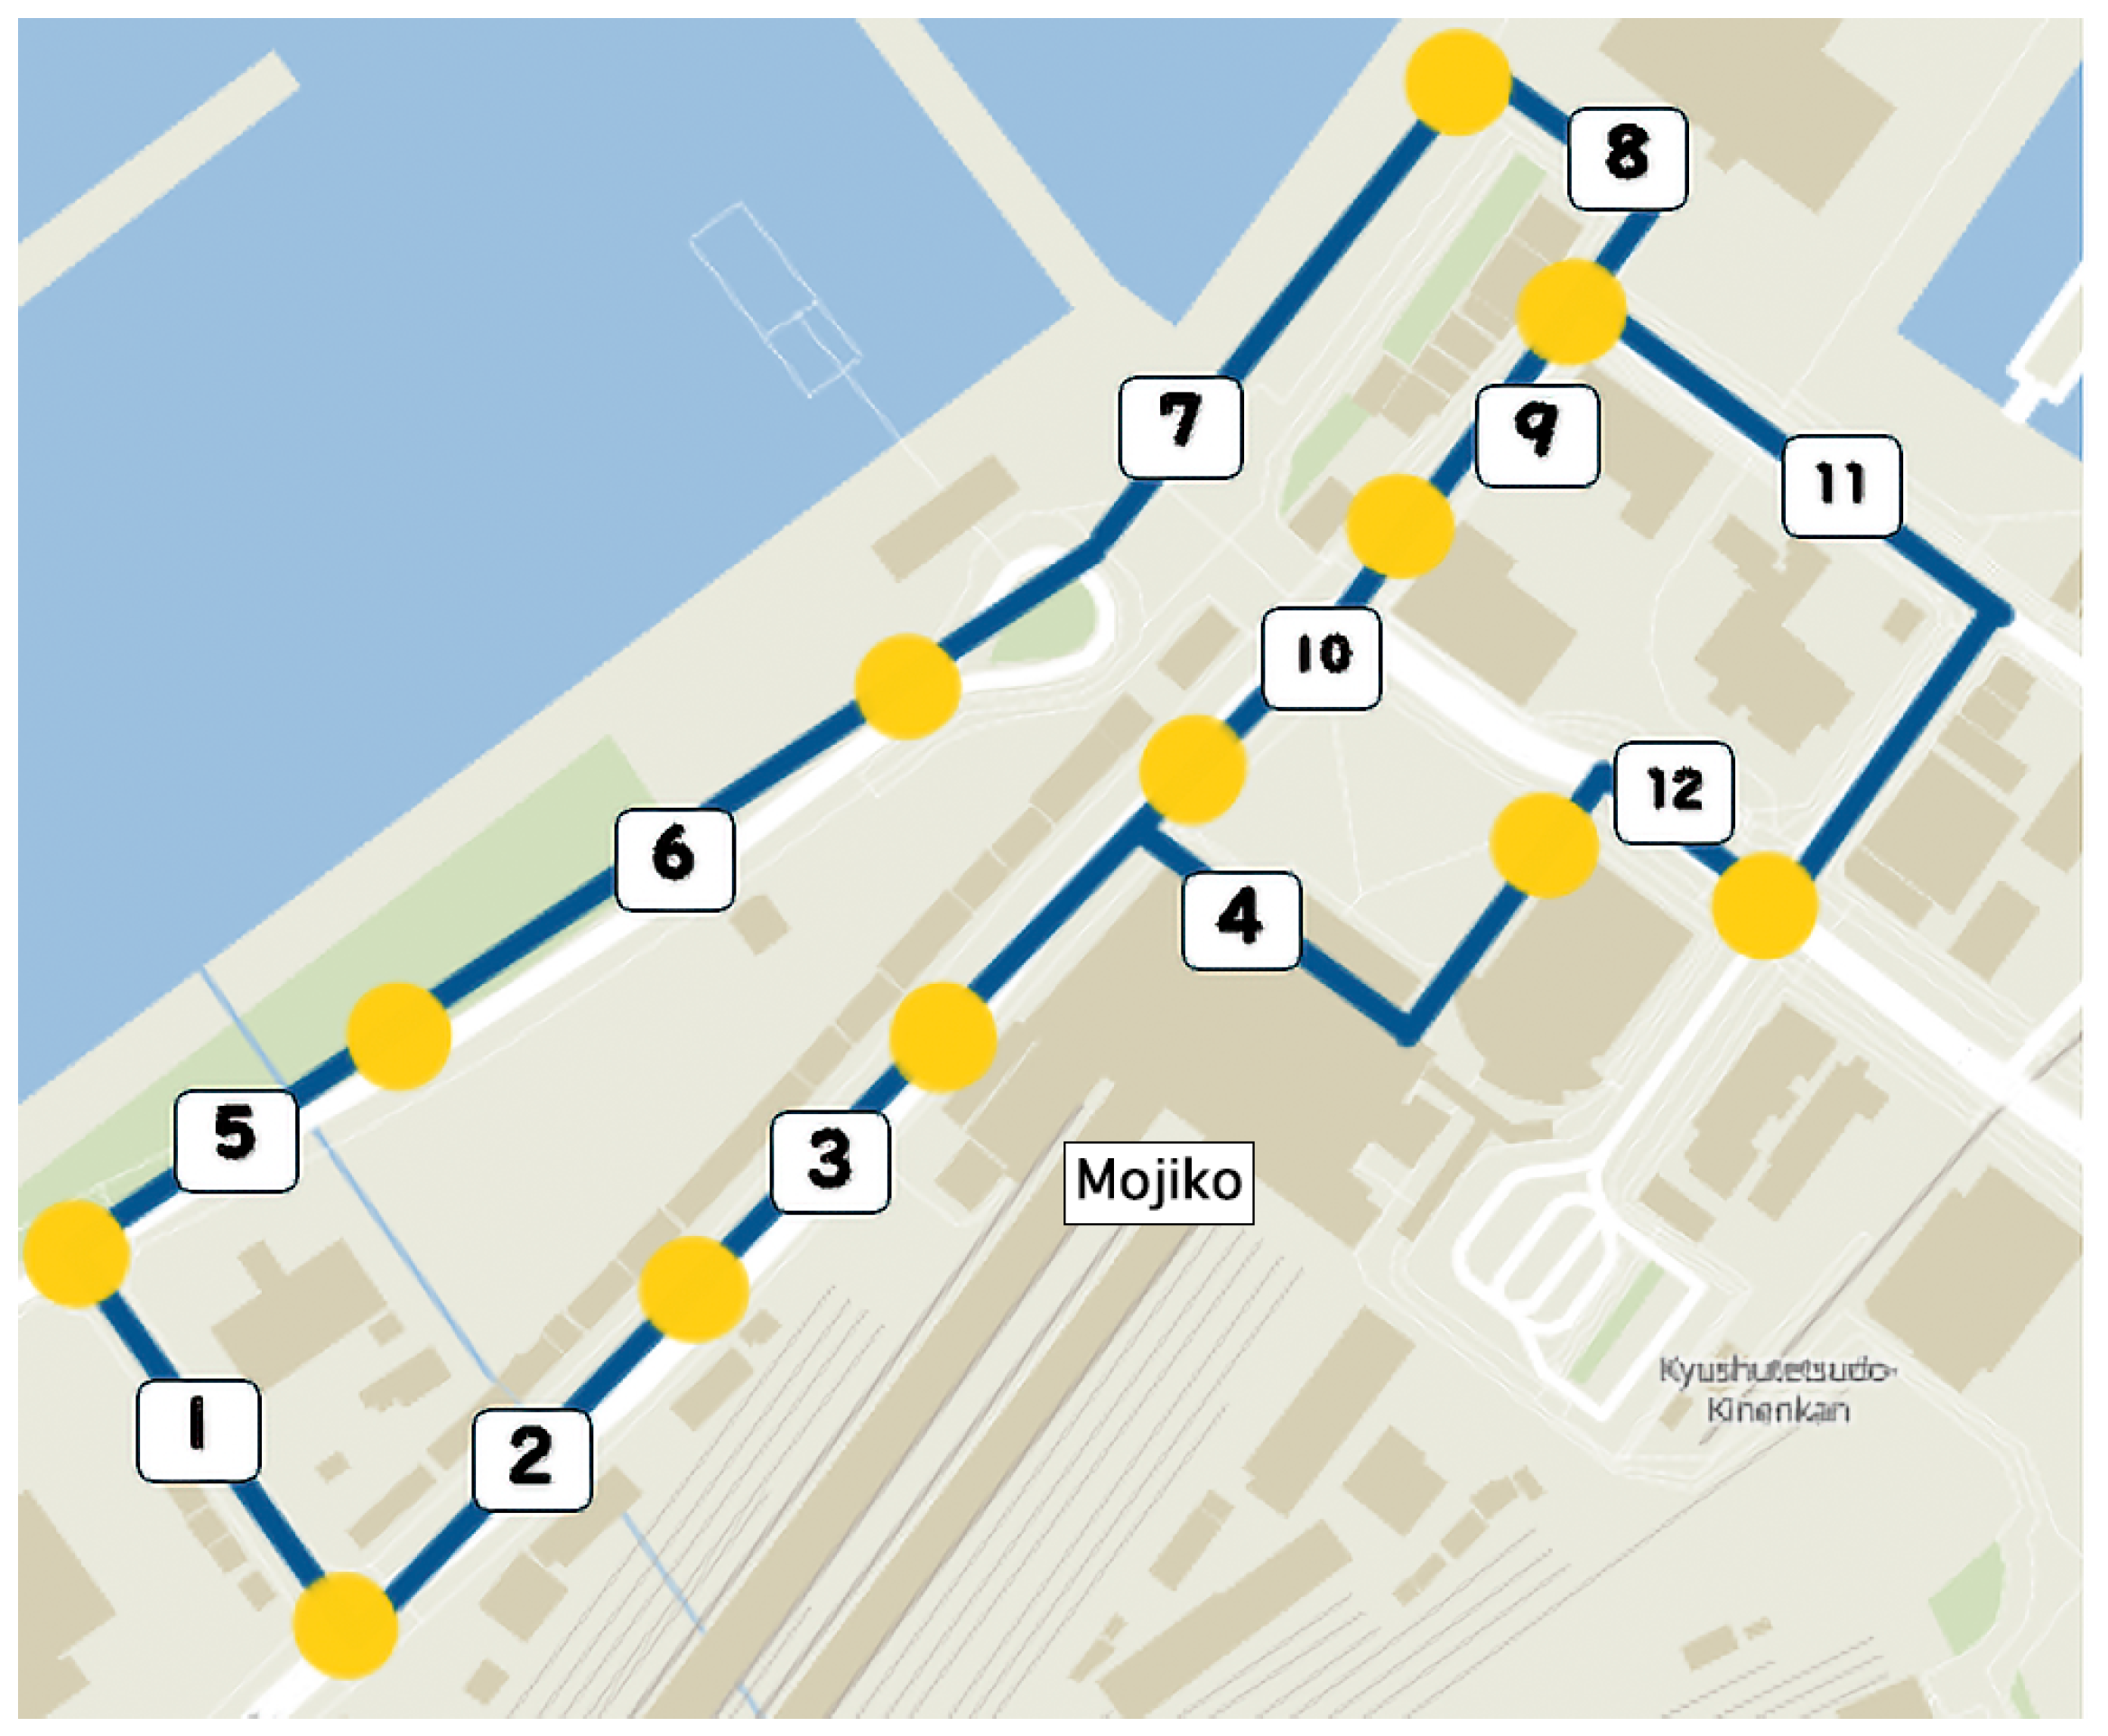
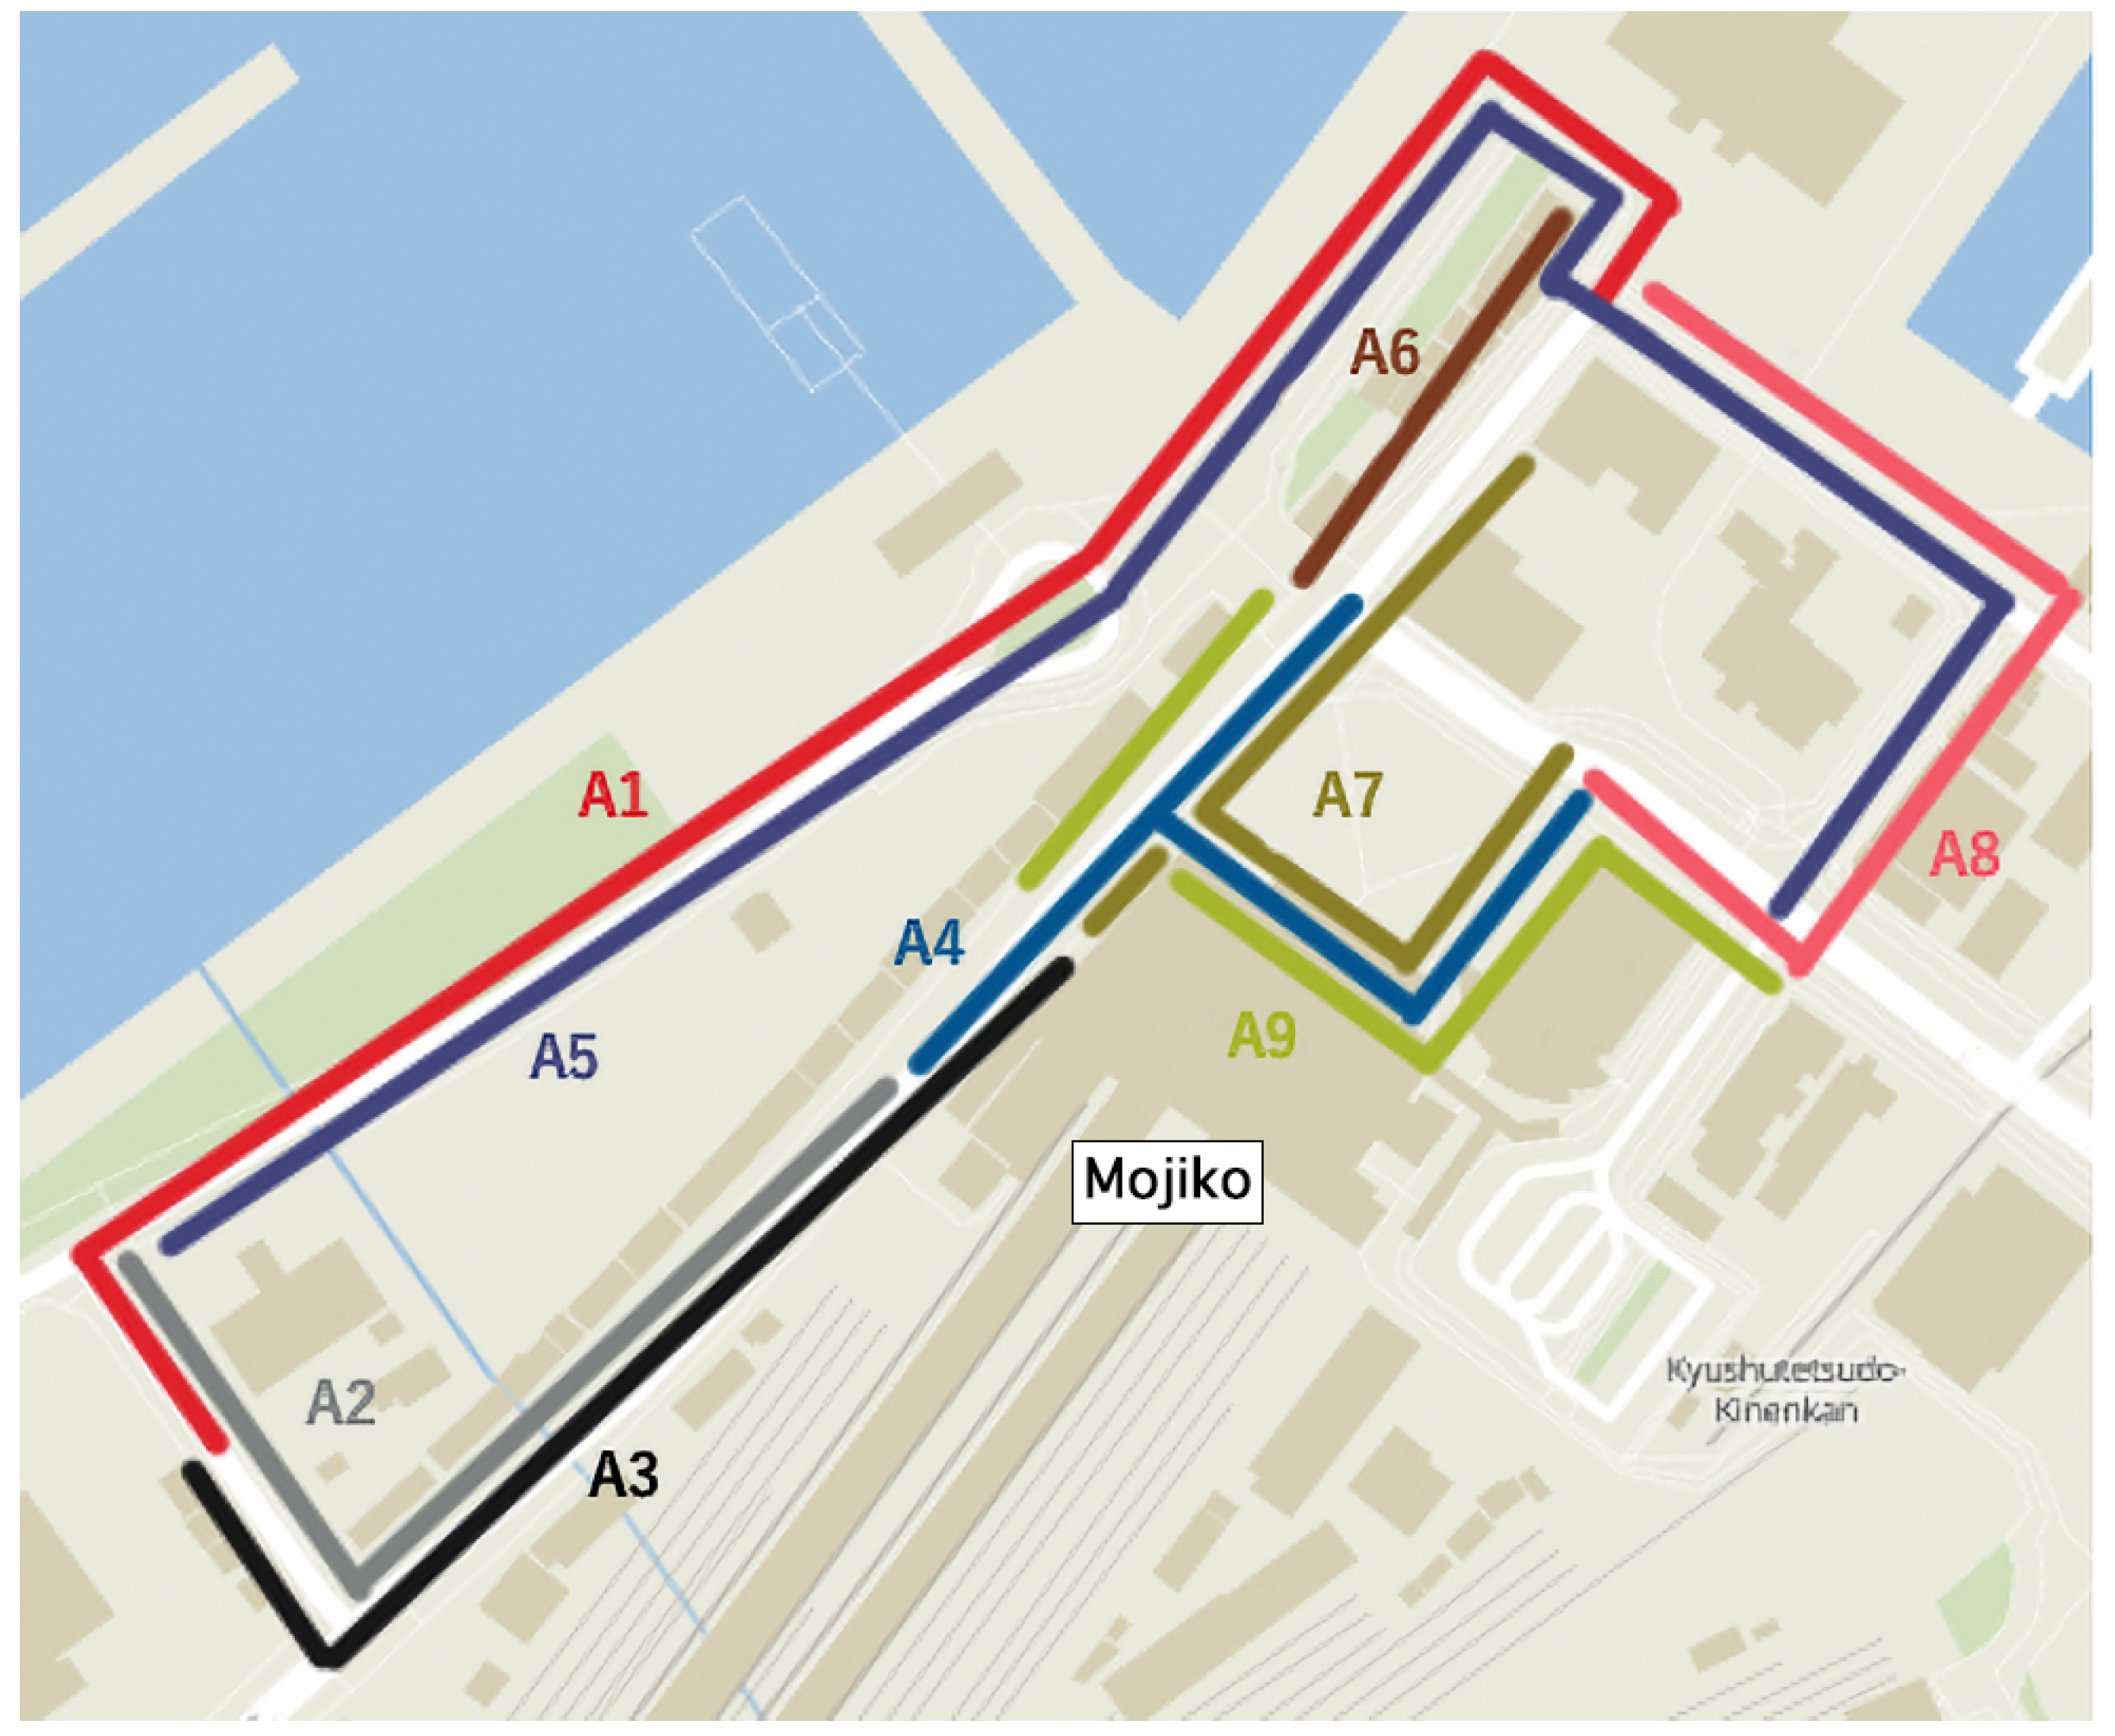
4.1. Dataset

We used the MAS-BENCH dataset [23] to simulate pedestrian flow. It lacks real-time sensor feedback components that would be available in actual deployment scenarios; integrating such sensor data (e.g., from cameras or pressure sensors) would likely enhance the adaptability of our approach. Previously, we developed a simulator [2] based on the social force model [24] and evaluated its accuracy for data assimilation. In this experiment, we used our crowd simulator for the evaluation of our method.
The MAS-BENCH dataset comprises data from the Mojiko Fireworks Festival. The topographic information used for the crowd simulation is illustrated in Figure 6, which shows Moji Port, Fukuoka Prefecture, Japan. The data specifically concern pedestrians returning home from the Mojiko Fireworks Festival. People travel from the start point to the end point, which correspond to the fireworks display site and Mojiko Station, respectively. There are three routes that pedestrians can take to the station and nine guides along them. Consequently, the number of agents in the multi-agent reinforcement learning is also nine.

4.2. Evaluation Metrics

We evaluated two aspects of crowd movement, safety and efficiency [25]. We used level of service (LOS) [26] as an evaluation metric for safety, and the average travel time of pedestrians [27] as an evaluation metric for efficiency.
LOS measures pedestrian congestion and is given by
D = N n S n
where D is the pedestrian density, N n is the number of pedestrians in the n-th section, and S n is the area of the n-th section. The classification of areas in LOS is illustrated in Figure 7. The correspondence between pedestrian density and LOS ratings is shown in Table 1. As the density increases, the LOS becomes more dangerous. A to C ratings are stable and safe for pedestrians, a D rating is close to an unstable flow for pedestrians, and an E rating is an unstable flow for pedestrians. The F rating corresponds to a danger zone for the flow of pedestrians. The area is delimited by yellow circles, 12 in total.
The average travel time of pedestrians is given by
T m e a n = T s u m N a l l ,
where T s u m is the total travel time for all pedestrians, and N a l l is the total number of pedestrians.

4.3. State and Reward in Reinforcement Learning

Each agent receives the density of pedestrians on the road as a state. The roads observed by each agent are shown in different colors in Figure 8. Each agent is given a reward corresponding to the road with the greatest density among the observed roads. The densities and rewards are given in Table 2. If the density is greater than 1, the simulation is considered very crowded, and the reward is set to 5 . The simulation is then terminated at that point even if the full 5 h has not elapsed. If the induction of all participants has not been completed after 5 h, the simulation is terminated with a reward of 5 .
The parameters related to MAT are shown in Table 3, those related to MA-DDPG are shown in Table 4, and those related to our method are shown in Table 5.

4.4. Hyperparameters

We experimented with different parameters for each method and ultimately used the one that was most successful in alleviating congestion.
We performed hyperparameter optimization for each method using Optuna [28], an automatic hyperparameter optimization software framework, to systematically search for the parameter configurations that most effectively alleviate congestion. This approach allowed us to efficiently explore the parameter space and identify optimal settings that maximize performance across our evaluation metrics.
For our method, the initial value in the search for ϵ -greedy was usually close to 1 (e.g., 0.9). However, since each agent’s strategy affects the other agents in the model, the initial value was set close to 0 (e.g., 0.1) to increase the probability that the model would determine the best strategy and reduce the probability of random behavior.

5. Results and Discussion

5.1. Comparison with MA-DDPG

First, we compare our method to MA-DDPG. Table 6 shows the results of the evaluation of congestion. The congestion of our method is the smallest, indicating that the learning of the Q-function for the actor is effective. Table 7 shows that the agent rewards for MA-DDPG differ from those in our method. In MA-DDPG, certain agents receive more rewards than others. Compared with our method, MA-DDPG agents compete among each other to relieve congestion in the areas they are observing. On the other hand, our method has high rewards for the agents as a whole, and there is no difference in rewards among them, indicating that our method is able to alleviate congestion in all sections.
In Table 7, we see the agents’ rewards for each route. In MA-DDPG, the agents’ rewards are lower for each path as pedestrians approach the goal. This can be seen in Table 7, where the reward of the other agents are lower than that of Agent 1. On the other hand, in our method, the reward is the same for each agent, which is higher than that of MA-DDPG. This indicates that agents upstream of the route are alleviating congestion, thus receiving higher rewards, while agents downstream of the route are causing congestion, resulting in lower rewards.
Table 7 shows that the reward for Agents 2, 3, and 4 along Path 1; Agents 5, 6, and 7 along Path 2; and Agents 5, 8, and 9 along Path 3 are lower than that for Agent 1 upstream in the route. This can be seen from the degree of congestion in each section in Table 6. Comparing the congestion in Sections 4, 9, 10, and 12 near the goal with the congestion in Sections 1, 5, 6, 7, and 8—the observation areas of Agent 1—we see that MA-DDPG has higher congestion near the goal, and consequently, the LOS rating is no longer an A. On the other hand, our method maintains an A rating in the LOS evaluation even near the goal.

5.2. Analysis of Route Confluence Points

Next, we look at the confluence points along each route. It is necessary to decide whether to guide pedestrians to the confluence section by considering the congestion levels in other agents’ sections while reducing the congestion level near the agent’s own section. Comparing our method with MA-DDPG at route confluences, we observe several differences. In Table 7, for MA-DDPG, the reward for Agent 4 is about 40 points lower than for Agents 7 and 9, indicating that Route 1 is more congested than Routes 2 and 3. In contrast, in our method, the reward is consistent at the confluence of routes. In MA-DDPG, agents act to reduce their own congestion in route confluence sections, which may result in increased congestion for other agents. This effect is evident in Table 6, where the degree of congestion in Sections 3, 10, and 12 shows a difference of 0.15.

5.3. Comparison with MAT

MAT shows distinct characteristics compared to our method in terms of congestion management. MAT exhibits higher congestion near the goal, resulting in a lower LOS rating, similar to MA-DDPG’s performance. Specifically, in MAT’s results, congestion at Section 11 and Section 12 along route 3 is relatively low (0.09 and 0.14, respectively), while Section 8 and Section 9 along route 2 show high congestion (0.38 and 0.66, respectively), reaching a C rating in LOS. This indicates MAT’s tendency to guide pedestrians unevenly across routes.
In contrast, our method maintains more balanced congestion levels: Section 9 and Section 10 along route 2 show low congestion (0.03 and 0.04, respectively), while Section 11 and Section 12 along route 3 maintain acceptable levels (0.26 and 0.23, respectively), maintaining an A rating in LOS throughout.
While both methods guide pedestrians toward specific routes to reduce congestion and obtain rewards, their approaches differ significantly. Our method achieves lower overall congestion across all sections, whereas MAT results in higher congestion in certain sections. Table 8 reveals that MAT achieves shorter travel times compared to our method. These results suggest that MAT prioritizes quick pedestrian movement and overall congestion reduction while accepting localized congestion. Our method, though requiring longer travel times, maintains consistent A ratings in the LOS across all sections.

6. Conclusions

Efficiently guiding pedestrians is a matter of increasing importance due to accidents that have been caused at events by congestion. We proposed a method of learning Q-functions for actors in MA-DDPG. In our experiment, we used data from the Mojiko Fireworks Festival in 2017 and evaluated congestion and the average travel time of pedestrians. Compared with MAT and MA-DDPG, our method was able to reduce congestion the most and resulted in the second shortest average travel time after MAT. Our method also showed almost the same rewards among the agents compared with MA-DDPG. This indicates that each agent was able to cooperate without causing congestion in parts of the system when our method was used.
We suggest the following future work:
  • A detailed analysis of computational requirements and optimization remains an important direction.
  • These findings must be validated with real-world pedestrian data or controlled field experiments to assess model performance under truly dynamic crowd behaviors, extreme congestion situations, safety risk, and unpredictable factors not fully captured in simulations.
  • Future deployment must address ethical concerns including privacy implications of sensor systems, potential biases in crowd management algorithms, and clear responsibility frameworks for safety outcomes.
  • Alternative exploration strategies must be explored beyond ϵ -greedy, such as Gumbel-Softmax, to potentially enhance the learning process and convergence properties of our approach.
  • The social force model has limitations in its ability to perfectly reproduce actual pedestrian behavior, which may affect the results. Therefore, we explore a more sophisticated model [29].

Author Contributions

Conceptualization, M.K.; writing—review and editing, T.O.; supervision, M.A. All authors have read and agreed to the published version of the manuscript.

Funding

This research received no external funding.

Data Availability Statement

The original data presented in the study are openly available in a GitHub repository at https://github.com/MAS-Bench/MAS-Bench (accessed on 4 March 2025).

Acknowledgments

We would like to thank Kazuya Miyazaki from Kumamoto university for valuable advice on the interpretation of data.

Conflicts of Interest

Author Toshiaki Okamoto was employed by the company Q-NET Security Company Ltd. The remaining authors declare that the research was conducted in the absence of any commercial or financial relationships that could be construed as a potential conflict of interest.

References

  1. Pang, Y.; Kashiyama, T.; Yabe, T.; Tsubouchi, K.; Sekimoto, Y. Development of people mass movement simulation framework based on reinforcement learning. Transp. Res. Part C Emerg. Technol. 2020, 117, 102706. [Google Scholar] [CrossRef]
  2. Miyazaki, K.; Amagasaki, M.; Kiyama, M.; Okamoto, T. Acceleration of data assimilation for Large-scale human flow data. IEICE Tech. Rep. 2022, 122, 178–183. [Google Scholar]
  3. Shigenaka, S.; Onishi, M.; Yamashita, T.; Noda, I. Estimation of Large-Scale Pedestrian Movement Using Data Assimilation. IEICE Trans. 2018, J101-D, 1286–1294. [Google Scholar]
  4. Matsubayasi, T.; Kiyotake, H.; Koujima, H.; Toda, H.; Tanaka, Y.; Mutou, Y.; Shiohara, H.; Miyamoto, M.; Shimizu, H.; Otsuka, T.; et al. Data Assimilation and Preliminary Security Planning for People Crowd. IEICE Trans. 2019, 34, 1–11. [Google Scholar]
  5. Kalman, R.E. A new approach to linear filtering and prediction problems. Trans. ASME J. Basic Eng. 1960, 82, 35–45. [Google Scholar] [CrossRef]
  6. Gordon, N.J.; Salmond, D.J.; Smith, A.F.M. Novel approach to nonlinear/non-Gaussian Bayesian state estimation. Radar Signal Process. 1993, 140, 107–113. [Google Scholar] [CrossRef]
  7. Chen, H.; Zendehdel, N.; Leu, M.C.; Yin, Z. Fine-grained activity classification in assembly based on multi-visual modalities. J. Intell. Manuf. 2024, 35, 2215–2233. [Google Scholar] [CrossRef]
  8. Kaelbling, L.P.; Littman, M.L.; Moore, A.W. Reinforcement Learning: A Survey. J. Articial Intell. Res. 1996, 4, 237–285. [Google Scholar] [CrossRef]
  9. Chen, C.; Wei, H.; Xu, N.; Zheng, G.; Yang, M.; Xiong, Y.; Xu, K.; Li, Z. Toward A Thousand Lights: Decentralized Deep Reinforcement Learning for Large-Scale Traffic Signal Control. Proc. Assoc. Adv. Artif. Intell. Conf. Artif. Intell. 2020, 34, 3414–3421. [Google Scholar] [CrossRef]
  10. Li, Z.; Yu, H.; Zhang, G.; Dong, S.; Xu, C.Z. Network-wide traffic signal control optimization using a multi-agent deep reinforcement learning. Transp. Res. Part C Emerg. Technol. 2021, 125, 103059. [Google Scholar] [CrossRef]
  11. Silver1, D.; Huang, A.; Maddison, C.J.; Guez, A.; Sifre, L.; Driessche, G.V.D.; Schrittwieser, J.; Antonoglou, I.; Panneershelvam, V.; Lanctot, M.; et al. Mastering the game of Go with deep neural networks and tree search. Nature 2016, 529, 484–489. [Google Scholar] [CrossRef] [PubMed]
  12. Antonoglou, I.; Schrittwieser, J.; Ozair, S.; Hubert, T.; Silver, D. Planning in stochastic environments with a learned model. In Proceedings of the 10th International Conference on Learning Representations, Virtual, 25 April 2022. [Google Scholar]
  13. Gao, R.; Zha, A.; Shigenaka, S.; Onishi, M. Hybrid Modeling and Predictive Control of Large-Scale Crowd Movement in Road Network. In Proceedings of the 24th International Conference on Hybrid Systems: Computation and Control, Nashville, TN, USA, 19–21 May 2021; pp. 1–7. [Google Scholar]
  14. Richalet, J.; Eguchi, G.; Hashimoto, Y. Why Predictive Control? J. Soc. Instrum. Control. Eng. 2004, 43, 654–664. [Google Scholar]
  15. Tan, M. Multi-Agent Reinforcement Learning: Independent vs. Cooperative Agents. In Proceedings of the Tenth International Conference on International Conference on Machine Learning, Amherst, MA, USA, 27–29 July 1993; pp. 330–337. [Google Scholar]
  16. Foerster, J.N.; Assael, Y.M.; Freitas, N.D.; Whiteson, S. Learning to Communicate with Deep Multi-Agent Reinforcement Learning. In Proceedings of the 30th International Conference on Neural Information Processing Systems, Barcelona, Spain, 5–10 December 2016; pp. 2145–2153. [Google Scholar]
  17. Lowe, R.; Wu, Y.; Tamar, A.; Harb, J.; Abbeel, P.; Mordatch, I. Multi-Agent Actor-Critic for Mixed Cooperative-Competitive Environments. In Proceedings of the 31st Conference on Neural Information Processing Systems, Long Beach, CA, USA, 4–9 December 2017; pp. 6382–6393. [Google Scholar]
  18. Mnih, V.; Kavukcuoglu, K.; Silver, D.; Rusu, A.A.; Veness, J.; Bellemare, M.G.; Graves, A.; Riedmiller, M.; Fidjeland, A.K.; Ostrovski, G.; et al. Human-level control through deep reinforcement learning. Nature 2015, 518, 529–533. [Google Scholar] [CrossRef] [PubMed]
  19. Lillicrap, T.P.; Hunt, J.J.; Pritzel, A.; Heess, N.; Erez, T.; Tassa, Y.; Silver, D.; Wierstra, D. Continuous control with deep reinforcement learning. In Proceedings of the 4th International Conference on Learning Representations, San Juan, Puerto Rico, 2–4 May 2016. [Google Scholar]
  20. Silver, D.; Lever, G.; Heess, N.; Degris, T.; Wierstra, D.; Riedmiller, M. Deterministic Policy Gradient Algorithms. In Proceedings of the 31st International Conference on Machine Learning, Beijing, China, 21–26 June 2014; Volume 32, pp. I-387–I-395. [Google Scholar]
  21. Wen, M.; Kuba, J.G.; Lin, R.; Zhang, W.; Wen, Y.; Wang, J.; Yang, Y. Multi-Agent Reinforcement Learning is A Sequence Modeling Problem. arXiv 2022, arXiv:2205.14953. [Google Scholar]
  22. Sutton, R.S.; Barto, A.G. Reinforcement Learning: An Introduction; MIT Press: Cambridge, MA, USA, 1998. [Google Scholar]
  23. Shusuke, S.; Shunki, T.; Shuhei, W.; Yuki, T.; Yoshihiko, O.; Masaki, O. MAS-Bench: Parameter Optimization Benchmark for Multi-Agent Crowd Simulation. In Proceedings of the 20th International Conference on Autonomous Agents and MultiAgent Systems, Virtual, 3–7 May 2021; pp. 1652–1654. [Google Scholar]
  24. Helbing, D.; Molnar, P. Social force model for pedestrian dynamics. Phys. Rev. E 1995, 51, 4282. [Google Scholar] [CrossRef] [PubMed]
  25. Nishida, R.; Shigenaka, S.; Kato, Y.; Onishi, M. Recent Advances in Crowd Movement Space Design and Control using Crowd Simulation. Jpn. Soc. Artif. Intell. 2022, 37, 1–16. [Google Scholar] [CrossRef]
  26. Fruin, J.J. Designing for pedestrians:A level-of-service concept. In Proceedings of the 50th Annual Meeting of the Highway Research Board, No.HS-011999, Washington, DC, USA, 18–22 January 1971. [Google Scholar]
  27. Abdelghany, A.; Abdelghany, K.; Mahmassani, H.; Alhalabi, W. Modeling framework for optimal evacuation of large-scale crowded pedestrian facilities. Eur. J. Oper. Res. 2014, 237, 1105–1118. [Google Scholar] [CrossRef]
  28. Akiba, T.; Sano, S.; Yanase, T.; Ohta, T.; Koyama, M. Optuna: A Next-generation Hyperparameter Optimization Framework. In Proceedings of the 25th ACM SIGKDD International Conference on Knowledge Discovery and Data Mining, Anchorage, AK, USA, 4–8 August 2019; pp. 2623–2631. [Google Scholar]
  29. Charalambous, P.; Pettre, J.; Vassiliades, V.; Chrysanthou, Y.; Pelechano, N. GREIL-Crowds: Crowd Simulation with Deep Reinforcement Learning and Examples. ACM Trans. Graph. (TOG) 2023, 42, 1–15. [Google Scholar] [CrossRef]
Figure 1. Relationship between the agent and the simulator. The simulator sends S t and R t to the agent. The agent then outputs the guidance and Q-function.
Electronics 14 01062 g001
Figure 2. Diagram of the actor and critic in MA-DDPG. The actor receives local information and outputs actions. The critic receives global information and outputs a Q-function.
Electronics 14 01062 g002
Figure 3. Overview of the decision-making process in MAT. An agent determines its action based on the current observed state and the previously determined actions of other agents.
Electronics 14 01062 g003
Figure 4. Diagram of how MAT functions [21]. The agent makes a guidance decision with reference to guidance from a i 0 to a i m .
Electronics 14 01062 g004
Figure 5. The actor–critic model structure used in our method. This is the same actor–critic structure used in MA-DDPG. However, it differs in that the actor outputs a Q-function for each action.
Electronics 14 01062 g005
Figure 6. Topographic information of Mojiko, Fukuoka Prefecture. Pedestrians take one of three routes to the end point, and guidance is administered at nine locations.
Electronics 14 01062 g006
Figure 7. Classification of LOS. The area is divided into 12 spatial divisions called Sections. The area numbered 1 is referred to as Section 1.
Electronics 14 01062 g007
Figure 8. Roads observed by each agent. Agent 1 is shown as A1.
Electronics 14 01062 g008
Table 1. Correspondence between pedestrian density and LOS ratings.
LOSPedestrian Density
A<0.31
B0.31–0.43
C0.43–0.72
D0.72–1.08
E1.08–2.17
F>2.17
Table 2. Correspondence between rewards and pedestrian density.
RewardPedestrian Density
1.0<0.31
0.60.31–0.43
0.20.43–0.72
−0.20.72–1.00
Table 3. Hyperparameters in MAT.
ParameterValue
buffer size10,000,000
actor lr5.00  × 10 5
critic lr5.00  × 10 5
gamma0.99
batch size40
optimizerAdam
ppo clip0.05
ppo epochs10
entropy coef0.001
Reward−5 when Pedestrian Density > 1
Table 4. Hyperparameters in MA-DDPG.
ParameterValue
buffer size100,000
actor lr0.01
hidden layer dim in actor(64, 8)
critic lr0.01
hidden layer dim in critic(64, 8)
gamma0.99
batch size1024
optimizerAdam
update frequency of the target network30
soft-update0.1
Table 5. Hyperparameters in our model.
ParameterValue
buffer size100,000
actor lr0.01
hidden layer dim in actor(128, 32)
critic lr0.01
hidden layer dim in critic(128, 32)
gamma0.99
batch size1024
optimizerAdam
update frequency of the target network30
ϵ max 0.1
ϵ min 0
N fin 800
Table 6. Evaluation of congestion.
SectionMATMA-DDPGOurs
Section 10.270.330.27
Section 20.450.290.25
Section 30.710.360.30
Section 40.500.570.21
Section 50.220.340.24
Section 60.260.340.24
Section 70.260.340.24
Section 80.260.290.24
Section 90.380.510.03
Section 100.660.480.04
Section 110.090.240.26
Section 120.140.420.23
Table 7. Reward earned by each agent.
AgentMA-DDPGOurs
Agent 11176.21188.0
Agent 21175.81188.0
Agent 31130.21188.0
Agent 41125.81188.0
Agent 51165.81188.0
Agent 61169.81188.0
Agent 71167.81188.0
Agent 81164.61188.0
Agent 91167.41188.0
Table 8. Evaluation of average pedestrian travel time.
MATMA-DDPGOurs
Average travel time (s)489538530
Disclaimer/Publisher’s Note: The statements, opinions and data contained in all publications are solely those of the individual author(s) and contributor(s) and not of MDPI and/or the editor(s). MDPI and/or the editor(s) disclaim responsibility for any injury to people or property resulting from any ideas, methods, instructions or products referred to in the content.

