1. Introduction
Critical National Infrastructure (CNI) refers to a group of systems, services, and assets that are so essential that their continuous and uninterrupted operation is vital to ensure public health and safety, national security, the economy, and the functioning of daily activities and businesses. This includes systems such as transportation, telecommunications, national health services, police systems, commerce, and utilities like electricity, clean water, and gas. Every minute counts for CNI, so even minor disruptions can pose significant risks to the system.
The emergence of Industry 4.0 [
1] and the increasing connectivity of devices associated with Critical National Infrastructure (CNI), along with the integration of traditional computer networks and CNI, has expanded the attack surface of these critical assets. Despite the tremendous importance of CNI, cybersecurity issues in this sector have often been inadequately addressed, resulting in an increase in both the frequency and impact of cyberattacks.
Criminals and state-sponsored hackers—those who are directly or indirectly supported by states through their militaries and government agencies—are increasingly targeting CNI to disrupt society.
For instance, in 2016, Verizon Security Solutions reported that a control system in a water utility was hacked, leading to changes in the chemicals used to treat tap water. The incident was dubbed the Kemuri Water Company (KWC) hack, though its location was never disclosed [
2]. In March 2019, the Post Rock Water District in Ellsworth, Kansas, was the target of a cyberattack that threatened drinking water safety. The hacker, a former employee, used previously granted credentials to remotely access the company’s computer system and disable the sterilizing procedures that make water drinkable, as his access had not been revoked when he left the organization [
3].
Machine Learning (ML) methods have proven effective in detecting both known and unknown attacks with high accuracy, particularly when dealing with large datasets. These mathematical models are built by analyzing patterns in data, which are then used to make predictions on new input. ML approaches for anomaly detection have become a rapidly growing area of research in both academia and industry, applied in fields ranging from traditional computer networks, to wireless networks, the Internet of Things (IoT), and Critical National Infrastructure. This includes applications such as phishing detection [
4], fake news detection [
5], IoT attack detection [
6], Android malware detection [
7], wireless network attack detection [
8], Industrial Control System (ICS) attack detection [
9], and water service attack detection [
10].
However, ML techniques are known to be vulnerable to adversarial attacks, where criminals exploit adversarial perturbations to manipulate a model, causing it to misclassify data. For instance, they can trick a model into classifying malicious events as benign, and vice versa, leading to detection evasion and system disturbances that can cause the entire model to fail [
11]. These exploitations can occur during both the training and testing phases. To develop robust ML models that are capable of detecting anomalies with high accuracy, it is essential to incorporate adversarial examples during both training and testing. This approach has been validated by prior research in the field [
12,
13].
The research presented in this paper focuses on adversarial attacks against a supervised, energy-based anomaly detection algorithm applied to a clean water treatment system. In terms of the required testbed and dataset for this research, SWaT [
14], a multistage water purification plant, and WADI [
15], a consumer distribution network testbed, along with their associated datasets, are the closest existing systems to our work. The majority of studies in the field of cybersecurity analysis for clean water supply and treatment systems rely on these two testbeds, either by having direct access to them, or by using the datasets generated from them.
However, since our focus is on the energy consumption of the system’s components for both anomaly detection and adversarial attack scenarios, these two testbeds and their associated datasets are not suitable for our research, as they do not include energy-based features. Consequently, in this study, we employ our previously developed testbed, the Virtual Napier Water Treatment System (VNWTS) [
16], along with its associated energy-based dataset. The VNWTS simulates the water chlorination process in a clean water treatment system. The goal of this research is to assess the robustness of the previously captured dataset against adversarial examples.
The contributions of this paper are as follows:
We apply label noise adversarial attacks (both random label flipping and targeted label flipping) against binary-class Logistic Regression (LR) and a Support Vector Machine (SVM).
We generate adversarial examples, using the Fast Gradient Sign Method (FGSM), against binary and multiclass Logistic Regression (LR) and Artificial Neural Networks (ANNs).
We employ the Jacobian-based Saliency Map Attack (JSMA), which uses feature selection to minimize the number of features modified while causing misclassification, against binary and multiclass Logistic Regression (LR) and Artificial Neural Networks (ANNs).
The remainder of this paper is organized as follows. In
Section 2, we review the related work in the field, followed by the methodology in
Section 3.
Section 4 presents the implementation and results. Finally,
Section 5 concludes the paper and offers suggestions for future work.
2. Related Work
This section reviews related work on Adversarial Machine Learning (AML) attacks targeting Critical National Infrastructure (CNI), with a particular focus on power grids and water systems.
In [
17], the authors examined the impact of adversarial attacks, specifically Limited-memory Broyden–Fletcher–Goldfarb–Shanno (L-BFGS) and Jacobian-based Saliency Map Attack (JSMA), against a machine learning approach: Multilayer Perceptron (MLP). They employed MLP to detect False Data Injection Attacks (FDIAs) in power systems. The results showed a significant reduction in accuracy in detecting FDIAs due to the implementation of these adversarial attacks.
In [
18], the authors utilized a domain-specific deep learning and testing framework to analyze the resilience of ML-based prediction models in power distribution networks. They also integrated an anomaly detection model to identify adversarial machine learning, specifically stealthy adversarial attacks targeting the predictor. The results showed a significant negative impact of such attacks on smart grid predictions, even under partial network compromise.
In [
19], the authors proposed a general formulation of white-box attacks, where adversaries disturb the external time series observed by the controller in power grids, aiming to maximize any differentiable function, whether or not related to the control cost. They validated their technique using synthetic Autoregressive Integrated Moving Average (ARIMA) and real-world electricity demand patterns. The proposed attack increased the cost by an average of 8500%, which was not apparent to the human eye when observing the electricity pattern, and raised the energy constraints by 13% on real electricity demand time series.
In [
20], the authors systematically compared the effects of various adversarial attacks, including the FGSM, One-Target Class Modification (OTCM), JSMA, and Limited-memory Broyden–Fletcher–Goldfarb–Shanno (L-BFGS), on machine learning algorithms used for classification, forecasting, and control problems in power systems. They also examined various defense mechanisms to enhance the performance of machine learning algorithms under different adversarial attacks. Their results indicated that the proposed machine learning models for power systems were vulnerable to adversarial attacks, with Generative Adversarial Networks (GANs) emerging as the most effective defense mechanism across all tested power systems.
In [
21], the authors proposed a framework for preparing adversarial attacks targeting data-driven invariant checkers in water treatment systems by employing the SWaT physical testbed. Their attacks successfully increased the system’s false alarms by up to 80%. They developed nine axiomatic design-driven invariant checkers to detect adversarial attacks. The results showed that these checkers did not raise false alarms (false positives), indicating robustness against adversarial attacks. However, they were unable to detect the attacks themselves.
In [
22], the authors proposed two algorithms for poisoning neural network-based cyberattack detectors in clean water treatment systems. Using the SWaT testbed, they employed artificial and real testbed data to evaluate their proposed algorithms, which demonstrated successful poisoning of the neural network-based detectors. They also presented a method for applying their poisoning algorithms to dynamic systems.
In [
23], the authors proposed a Bayesian training method to protect deep learning-based load forecasting models against adversarial attacks in power systems. They theoretically proved that their approach enhances the robustness of load forecasting against adversarial attacks without compromising prediction performance. They also employed an approximation-based training scheme to reduce computational burden, making the method more practical.
In contrast, there is existing work on defenses against adversarial machine learning algorithms. We briefly address some of them here. The general approaches to defense against adversarial machine learning include adversarial training, input pre-processing, certified defenses, defensive distillation, and tensor factorization. For instance, in adversarial training, the adversarial samples are generated using different techniques, and then these samples are used to train the model to learn and recognize potential attacks, enhancing its robustness. Furthermore, in input pre-processing, transformations such as noise addition or dimensionality reduction are applied to input data to make the model more resilient against adversarial machine learning.
The authors of [
24] propose an analytical framework to describe the stochastic dynamics of cyber-threat propagation in a collection of heterogeneous sub-networks, each characterized by different attributes and involving two adversaries: an attacker, who launches attacks across the networks, and a defender, who tries to mitigate the attacks by delivering suitable countermeasures. Similarly, the authors of [
25] investigate the resistance of a network under a Denial of Service (DoS) attack using a Stackelberg game approach, which characterizes the non-cooperative competition between the attacker and the controller. The authors of [
26] present a systematic adversarial machine learning threat analysis for the Open Radio Access Network (O-RAN).
As the defense against adversarial machine learning is not the focus of this paper, we did not consider defense mechanisms in our experiments. Our focus is to assess the performance of the chosen machine learning algorithm on an energy-based dataset against adversarial machine learning. The defense against such attacks is one of the goals for our future research.
In this paper, we study the impact of various adversarial machine learning attacks on our proposed supervised, energy-based anomaly detection algorithm for a CNI application: a clean water treatment system. The work in this paper differs from existing studies, particularly those focusing on water services, such as [
21,
22], for the following reasons:
This paper examines the impact of adversarial machine learning attacks for the first time on a supervised, energy-based anomaly detection algorithm in a clean water treatment system. Although the model is proposed for a clean water treatment system, the concept of using a system’s energy profile for anomaly detection can be extended to other CNI applications (e.g., energy sector and transportation systems). Therefore, it is not limited to a single application. Additionally, the research is conducted on the authors’ implemented testbed, the Virtual Napier Water Treatment System (VNWTS), which models the water chlorination process for a clean water treatment system, using a uniquely collected dataset. Existing datasets, such as those from SWaT [
14] and WADI [
15], are not suitable for this work, as they do not include energy consumption metrics in benign and malicious scenarios. Furthermore, this paper studies the impact of four different adversarial attacks: random label flipping, targeted label flipping, the Fast Gradient Sign Method (FGSM), and Jacobian-based Saliency Map Attack (JSMA), on three popular machine learning algorithms: Logistic Regression (LR), Support Vector Machines (SVMs), and Artificial Neural Networks (ANNs). In contrast, existing work typically implements only one or two attacks/algorithms.
Table 1 provides an overview of related work on adversarial machine learning targeting CNI.
3. Methodology
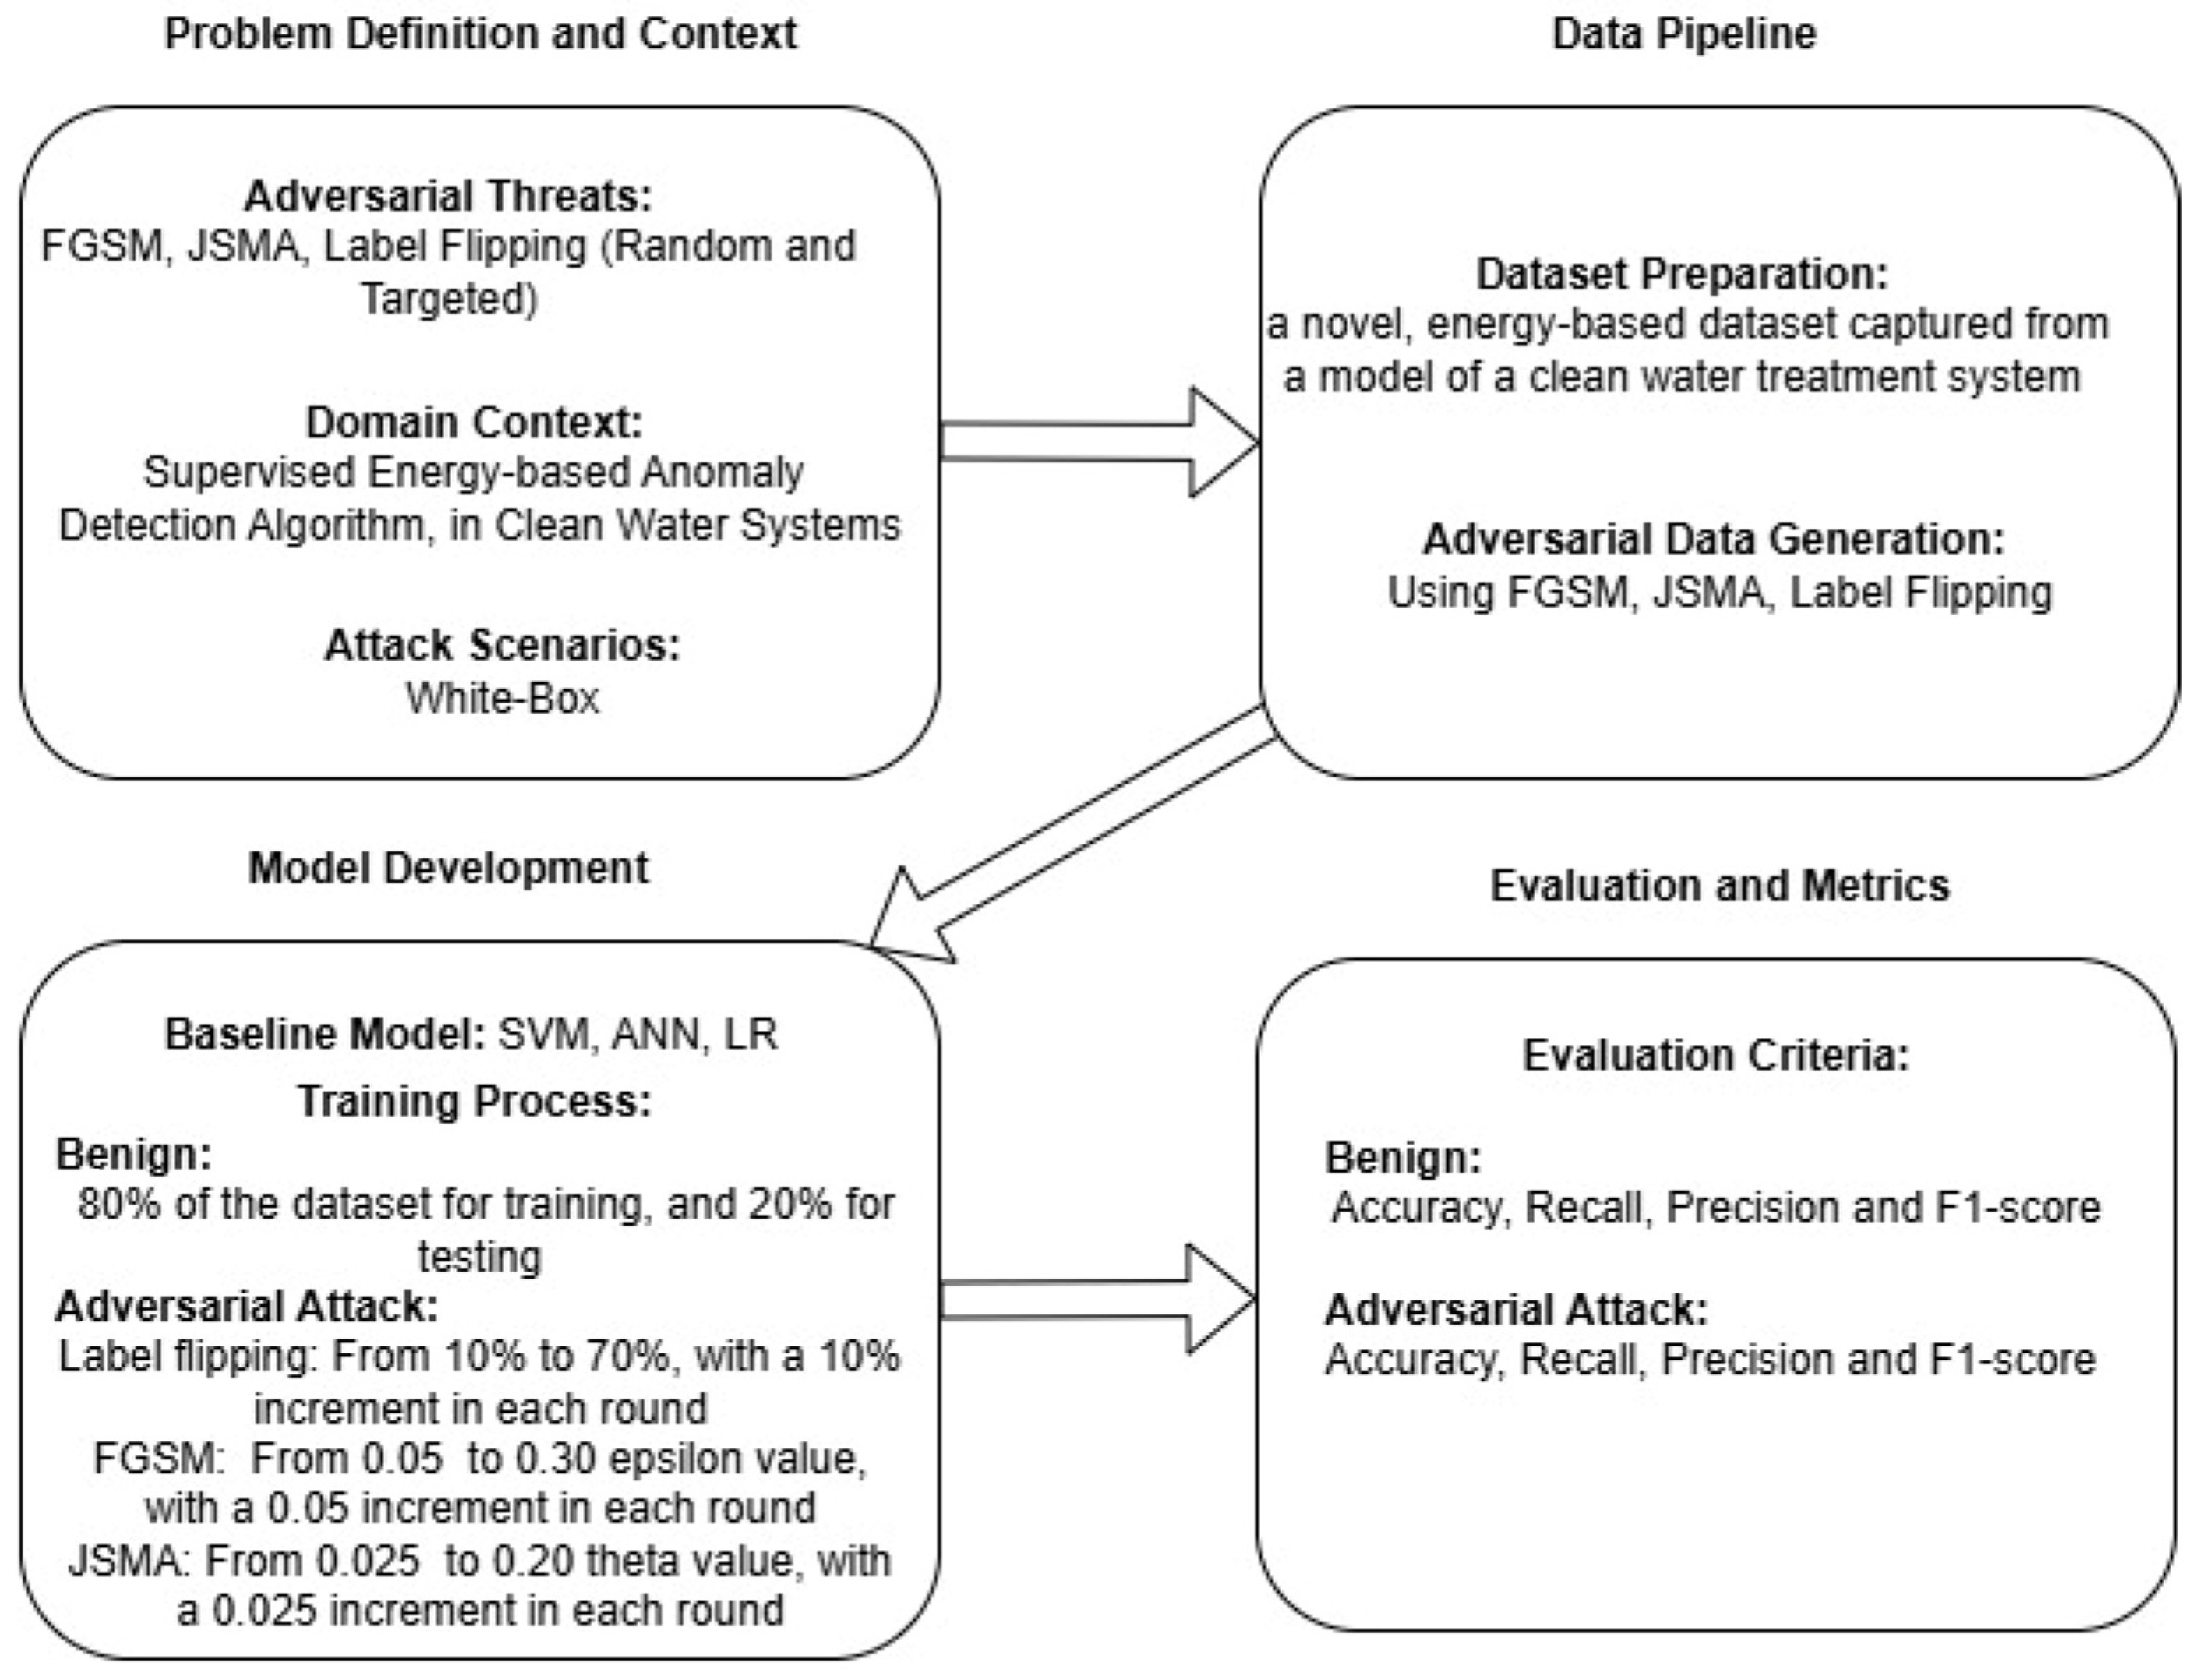
In this section, we explain the methodology that we have employed for the research conducted in this paper. A summary of our methodological framework is depicted in
Figure 1.
3.1. VNWTS Testbed Design and Implementation
We employed the VNWTS testbed (
Figure 2 [
16]), which represents a clean water treatment system that we previously designed, implemented, and evaluated during the UK COVID-19 lockdown, when access to our physical testbed was restricted. The testbed comprises sensors, actuators, a Programmable Logic Controller (PLC), a Supervisory Control and Data Acquisition (SCADA) system, a Human–Machine Interface (HMI), and Python 3.12.4 code to facilitate communication between the system components. The virtual process of the testbed (
Figure 3 [
16]) was implemented in Simulink [
27], a graphical programming environment in MATLAB (R2024b), and mirrors the characteristics and dynamics of the physical components represented in the MPA PS Festo Rig (
Figure 4 [
28]). This virtual process emulates the chlorine treatment of drinking water, and includes components such as pipes, a pressure vessel, two pumps, a proportional valve, a water reservoir tank, two flow sensors, and two water supplies. The MPA PS Festo Rig is a scaled-down version of a unique water treatment system, making it an ideal choice for this project.
In the VNWTS testbed, we utilized SIMATIC S7-PLCSIM Advanced V3.0 software to emulate the SIMATIC S7-1500 PLC and its internal components, including inputs, outputs, working memory, and network functionalities. The emulated PLC is connected to, and communicates with, the virtual clean water treatment system in the VNWTS testbed. Additionally, we implemented two PI controllers—a control mechanism based on mechanical and electronic controllers—and a Python communication module to facilitate data exchange between system components (e.g., between the PLC and Simulink).
The VNWTS testbed simulates a water treatment system in general, with a specific focus on the water chlorination process. In the virtual process (
Figure 3 [
16]), a cold-water reservoir, equipped with a cold-water pump, represents a natural water tank requiring treatment before distribution to a client’s tap. Similarly, a hot-water reservoir, equipped with a hot-water pump, represents a chlorine tank used to treat the cold water. To simulate the chlorine dosing process, we employed a similar dosing ratio, replacing the chlorine with hot water to ensure the simulation provided an adequate representation of clean water treatment.
To enhance the realism of the testbed, we implemented a week-long water demand model for a small city, inspired by a real UK energy consumption model, as detailed in our previous work [
29]. This demand model is integrated into the proportional valve of the VNWTS virtual process, and is regulated based on the simulated water demand. For instance, high water demand is represented by a fully open valve, which consumes more energy, while low water demand is represented by a partially open valve, consuming less energy. The pump speeds adjust accordingly—accelerating during high demand and decelerating during low demand—to maintain the reservoir tank’s water level.
3.2. Dataset Overview
In this paper, we focus on the energy consumption of a clean water treatment system model for two purposes: anomaly detection and adversarial machine learning. Therefore, existing datasets such as SWaT [
14] and WADI [
15] are not suitable for our work, as they do not include energy-related features. Furthermore, to the best of our knowledge, no existing studies utilize an energy consumption-based dataset to investigate adversarial machine learning attacks on clean water treatment systems.
For our dataset, we selected eight features to define the VNWTS testbed based on its energy consumption: (1) cold flow rate, (2) hot flow rate, (3) temperature, (4) tank level, (5) voltage in the hot-water pump, (6) voltage in the cold-water pump, (7) current in the hot-water pump, and (8) current in the cold-water pump. In addition to these eight features, the dataset includes two classification features:
Class: A binary classification feature, where the label is 0 for benign events and 1 for attack events. All types of attacks are labeled as 1.
Type of attack: A multiclass classification feature with three categories: (1) attack on the level setpoint, (2) attack on the temperature setpoint, and (3) attack on multiple sensors. Benign events are labeled as 0 for this feature. The VNWTS features are described in detail in
Table 2.
We then ran the testbed based on our chosen water demand model, along with different episodes of malicious events, to collect an energy consumption-based dataset. These events targeted the fixed memory space vulnerabilities present in the Siemens S7-1500 PLC. The fixed memory space, allocated to the input and output memory of the PLC, can be overwritten by an attacker. This allows an intruder to modify or rewrite values, such as the water temperature, leading to disturbances in the water chlorination process.
Our implemented attacks include attacks on level and temperature sensors, attacks on the hot and cold pump controllers, and attacks on the PLC memory, including changes to the level and temperature setpoints in the working memory of the Siemens S7-1500 PLC. These vulnerabilities are fully explained in our previous work [
16]. For easier management of the VNWTS dataset, we categorized the malicious events into three types: (1) attacks on the level setpoint, (2) attacks on the temperature setpoint, and (3) attacks on multiple sensors.
During the runtime of our experiments, we captured 3,132,651 events, including both malicious and benign cases, which formed a unique energy-based dataset for the clean water treatment system application. Given our limited resources, and to expedite the experiments, we selected approximately 4% of the VNWTS dataset, resulting in a total of 120,000 records of benign and malicious traffic. Of these 120,000 events, we used 80% (96,000 records) for training and 20% (24,000 records) for testing.
Table 3 presents the overall values for each category, including both attack and benign events for the testing and training phases.
3.3. Planning Attacks Against Machine Learning Models
This phase has two stages: Stage (1): development of trusted models, and Stage (2): generation of adversarial examples. In order to assess the impact of adversarial machine learning attacks on the selected performance metrics—accuracy, precision, recall, and F1-scores—the first stage involves implementing base models. This stage is crucial, as it provides a valid performance comparison between trusted models and the manipulated ones resulting from the attacks. Therefore, popular machine learning models, such as linear SVM, LR, and ANN, are selected. ANN is chosen for its ability to test, train, and evaluate data more efficiently compared to Long Short-Term Memory Networks (LSTMs) and Recurrent Neural Networks (RNNs). The second stage focuses on generating adversarial examples for the aforementioned models.
For example, label noise adversarial attacks (both random label flipping and targeted label flipping) are used against binary-class SVM and LR, as these traditional ML models are more vulnerable to label noise compared to feature noise attacks. In random label flipping, as the name suggests, a random portion of labels (or classes) is selected and reversed, and the SVM and LR models are then trained using these poisoned data. The random portion of data is gradually increased from 0% to 70%, in increments of ten, and is expected to demonstrate an incremental reduction in the models’ performance. However, given that label flipping might have a small impact, particularly in the lower ranges (e.g., 10% and 20%), when it is random, targeted label flipping is also employed on the SVM and LR binary classification models. For targeted label flipping, the absolute distance between the two models and the datapoints (labels or classifications) is calculated. Labels with the longest absolute distance from the model are then selected and flipped (i.e., from 0 to 1, and vice versa). The percentage of flipping is gradually increased from 0% to 70%, in increments of ten. The results should indicate an incremental reduction in the performance of the models. It is expected that targeted label flipping will result in a more negative impact on the models’ performance, particularly in the lower ranges, compared to the random label flipping technique.
Additionally, the FGSM and JSMA methods are used against binary and multiclass LR and ANNs. The label noise adversarial attacks against SVM and LR models, explained above, assume that the attackers have access to the training data and can manipulate them. However, the FGSM and JSMA methods assume that attackers have access to testing data, allowing them to evade the binary and multiclass LR and ANN models after deployment. An IBM-provided library called the Adversarial Robustness Toolbox (ART) [
30] was used to create the adversaries for the testing data against the models, following the working principles of the FGSM described in [
31], and of JSMA described in [
32].
For the FGSM, the degree to which the test samples are perturbed, known as epsilon, is varied between 0.05 and 0.3. For each epsilon, a new testing set is created from the original test set and used as a test set for the developed models. It is expected that higher epsilons will result in a greater decline in the models’ performance. For JSMA, unlike the FGSM, it is possible to select a fraction of the test features to be perturbed. In this research, a fixed fraction of 0.1 is used, while the perturbation rates of JSMAs vary between 0.02 and 0.2. Therefore, for each perturbation rate, and with a fixed fraction of 0.1, a new test set is created from the original test set and used for testing the binary and multiclass LR and ANN models.
3.4. Evaluation Criteria
In general, accuracy, recall, precision, F1-score, and the confusion matrix are common metrics used to compare the performance of machine learning models. Using various metrics for performance evaluation and comparison is extremely important, as it can further improve a model during the testing phase, and provide an opportunity to choose the most suitable model for deployment. True positive (TP) is the number of positive events correctly classified as positive by the model. True negative (TN) is the number of negative events correctly classified as negative by the model. False positive (FP) is the number of negative events incorrectly classified as positive by the model. False negative (FN) is the number of positive events incorrectly classified as negative by the model.
Accuracy is the ratio of the total number of true (positive and negative) predictions to the total number of true (positive and negative) and false (positive and negative) predictions.
Recall is the ratio of the total number of true positive predictions to the total number of true positive and false negative predictions.
Precision is the ratio of the total number of true positive predictions to the total number of true positive and false positive predictions.
F1-score is the ratio of 2 times the precision times the recall, to the sum of precision and recall.
The confusion matrix is a visual representation of true and false (positive and negative) predictions.
In this paper, to evaluate the results, the adversarial examples are compared with the trusted models for binary and multiclass classifications. For example, this includes LR, SVM, and ANN trusted models, which contain no data manipulation, compared against the same models after adversarial attacks. Accuracy, recall, precision, F1-scores, and the confusion matrix are used to evaluate all the models before and after the adversarial impact. The recall metric is a key metric in comparison with precision in this research, given the sensitivity of clean water treatment systems, where false negatives are more costly than false positives. This means that a decrease in recall results from an increased number of false negatives, allowing hackers to launch attacks against the system without being detected. Additionally, the confusion matrix is used to represent the incorrect classifications for both binary and multiclass categories for each trusted model.
4. Implementation and Results
This section focuses on the implementation and the analysis of results, which includes a reflection on the data preparation, the creation of the trusted models, and the adversarial examples.
4.1. Data Pre-Processing
Data pre-processing was employed to improve the quality of the data in the VNWTS dataset. This is a vital phase of any machine learning project. For instance, using feature reduction to identify redundant features and remove them from a dataset can decrease the computational costs of building a predictive model. This also increases the model’s overall performance and reduces the chance of overfitting.
For the data pre-processing phase of the VNWTS dataset, normalization and three popular feature selection techniques—Information Gain, Chi-Square, and Pearson’s Correlation—have been chosen in this paper. Employing these feature selection techniques reduced the total number of features from eight to four. The chosen features to remain were Temperature, Tank Level, Cold Flow Rate, and Voltage in the Cold-Water Pump, along with the Class Feature and the three types of attack. Therefore, Hot Flow Rate, Voltage in the Hot-Water Pump, Current in the Hot-Water Pump, and Current in the Cold-Water Pump have been removed. All the features are fully explained in the previous section. As clarified earlier, nearly 4% of the original VNWTS dataset was selected for the experiments, with a split of 80% for training and 20% for testing.
The VNWTS data are all numerical, so no encoding is needed. However, the data types differ between the features. For example, the Class Feature is binary (either 0 for benign or 1 for attack), while the Type of Attack is an integer (either 0 for benign events, 1 for attacks on the level setpoint, 2 for attacks on the temperature setpoint, or 3 for attacks on multiple sensors). Additionally, Temperature, Tank Level, Cold Flow Rate, and Voltage in the Cold-Water Pump are floating-point numbers distributed between 0 and 1. Therefore, normalization is required, as the data have variable scales (i.e., binary, integer, and float). Normalization gives equal weight to the data, so that no feature skews the model’s performance simply because it has a larger value. For this, MinMaxScaler was used to scale the data between 0 and 1.
After applying pre-processing techniques (i.e., feature selection and normalization) to the original dataset, the machine learning algorithms, SVM, LR, and ANN, were trained. The pre-processed dataset is called the trusted dataset, as it has not been manipulated during training or testing, allowing the models to perform at their best. The performance of these models was then compared with those whose datasets were manipulated using techniques such as random and targeted label flipping, the FGSM, and JSMA.
4.2. Trusted and Untrusted Models
In this paper, accuracy, recall, precision, F1-score, and confusion matrix are used to evaluate and compare the performance of all implemented scenarios, including those with and without adversarial examples, for both binary and multiclass classifications. Label noise adversarial attacks, such as random label flipping and targeted label flipping, were applied against Logistic Regression (LR) and a Support Vector Machines (SVM) in binary classification. Additionally, FGSM and JSMA attacks were performed on LR and artificial neural networks (ANN) for both binary and multiclass classifications.
We first analyze the impact of the implemented adversarial attacks on the confusion matrix and Receiver Operating Characteristic (ROC) curve for the LR, SVM, and ANN models by assessing their performance before and after the attacks. We then compare the performance of these models under various adversarial attack scenarios to determine which model demonstrates greater resilience against adversaries. For this analysis, we use evaluation metrics such as accuracy, recall, precision, and F1-score.
4.2.1. LR Trusted Models vs. Adversarial Examples
For the Logistic Regression (LR) trusted model, the default LR implementation and parameters from the Scikit-Learn package were used, except for the maximum iteration parameter (max_iter), which was set to 1000 instead of the default value of 100.
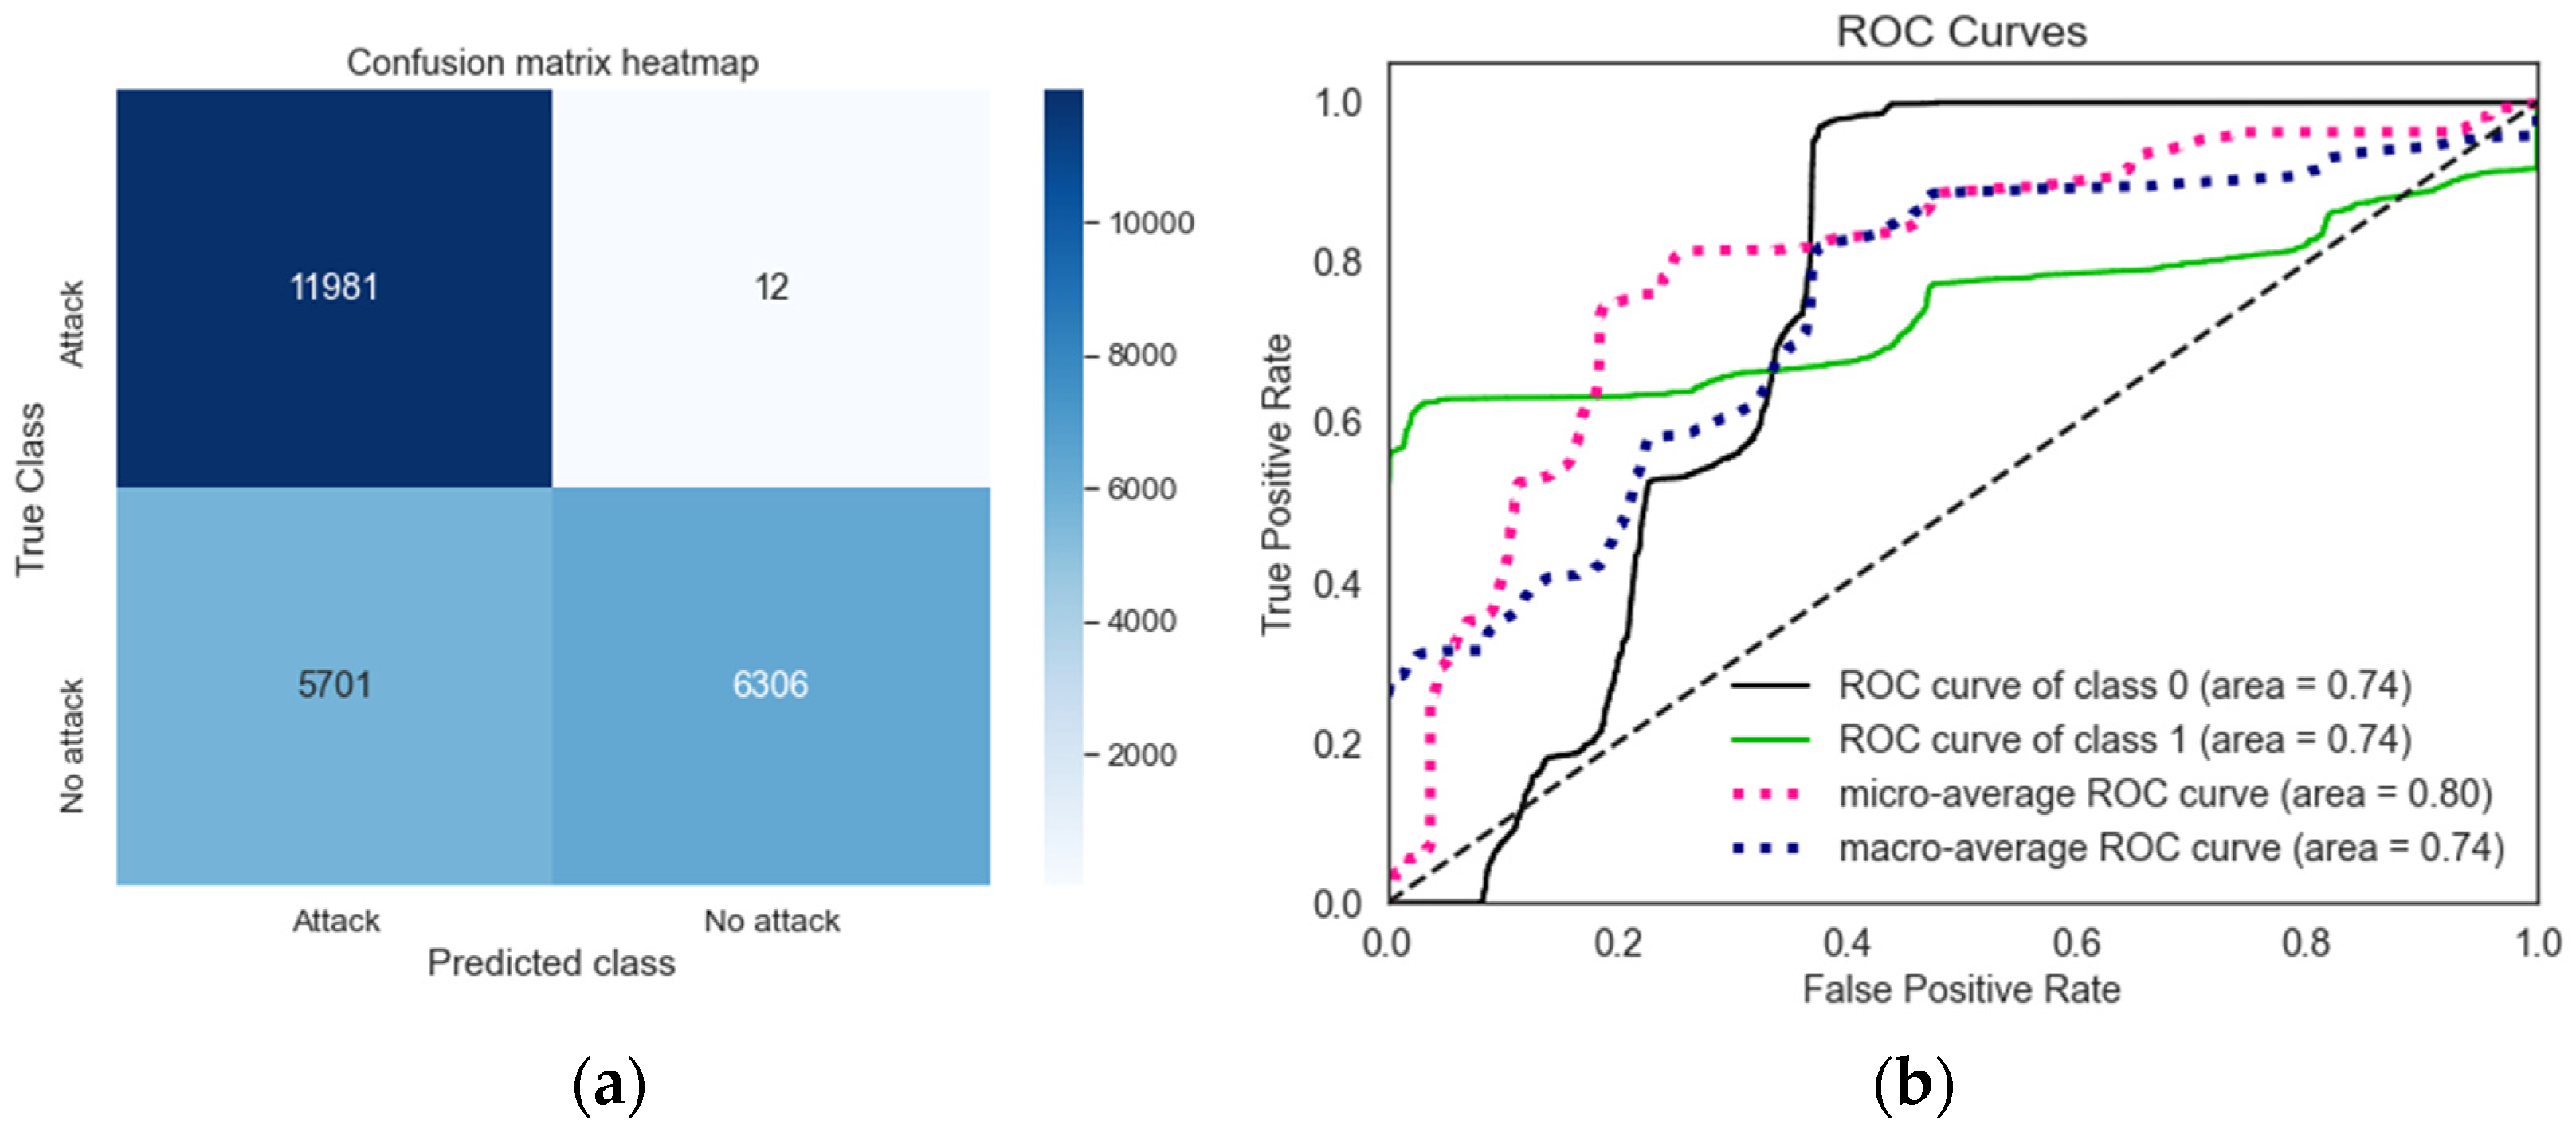
The confusion matrix and ROC curve for the LR trusted model in binary classification, where no adversarial attack is present, are shown in
Figure 5. The corresponding figures for the LR model under random and targeted label flipping attacks are presented in
Figure 6 and
Figure 7, respectively.
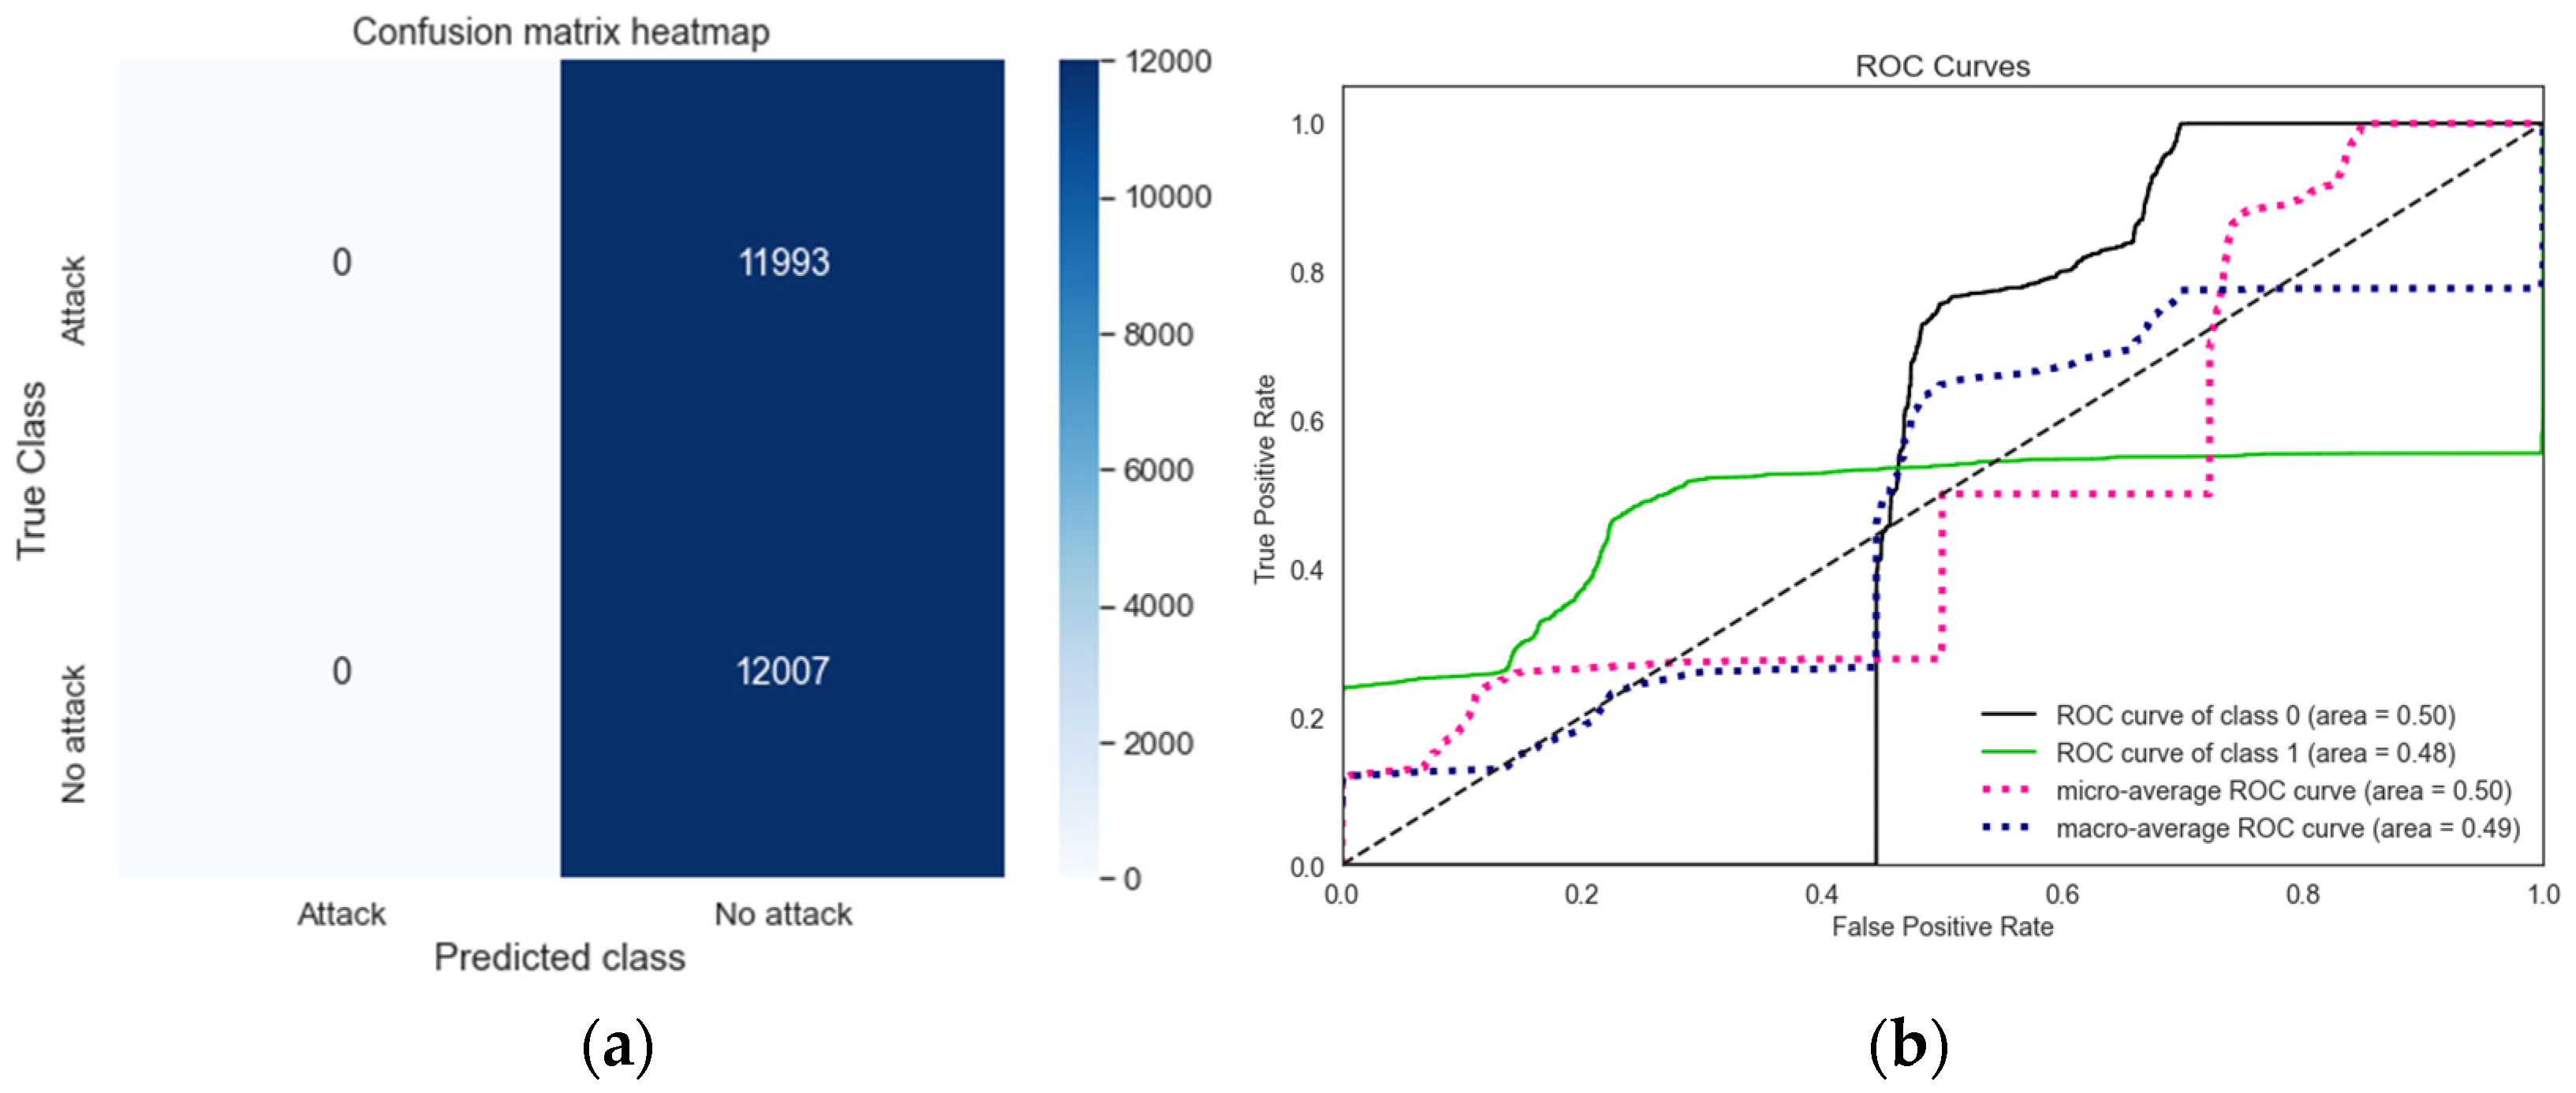
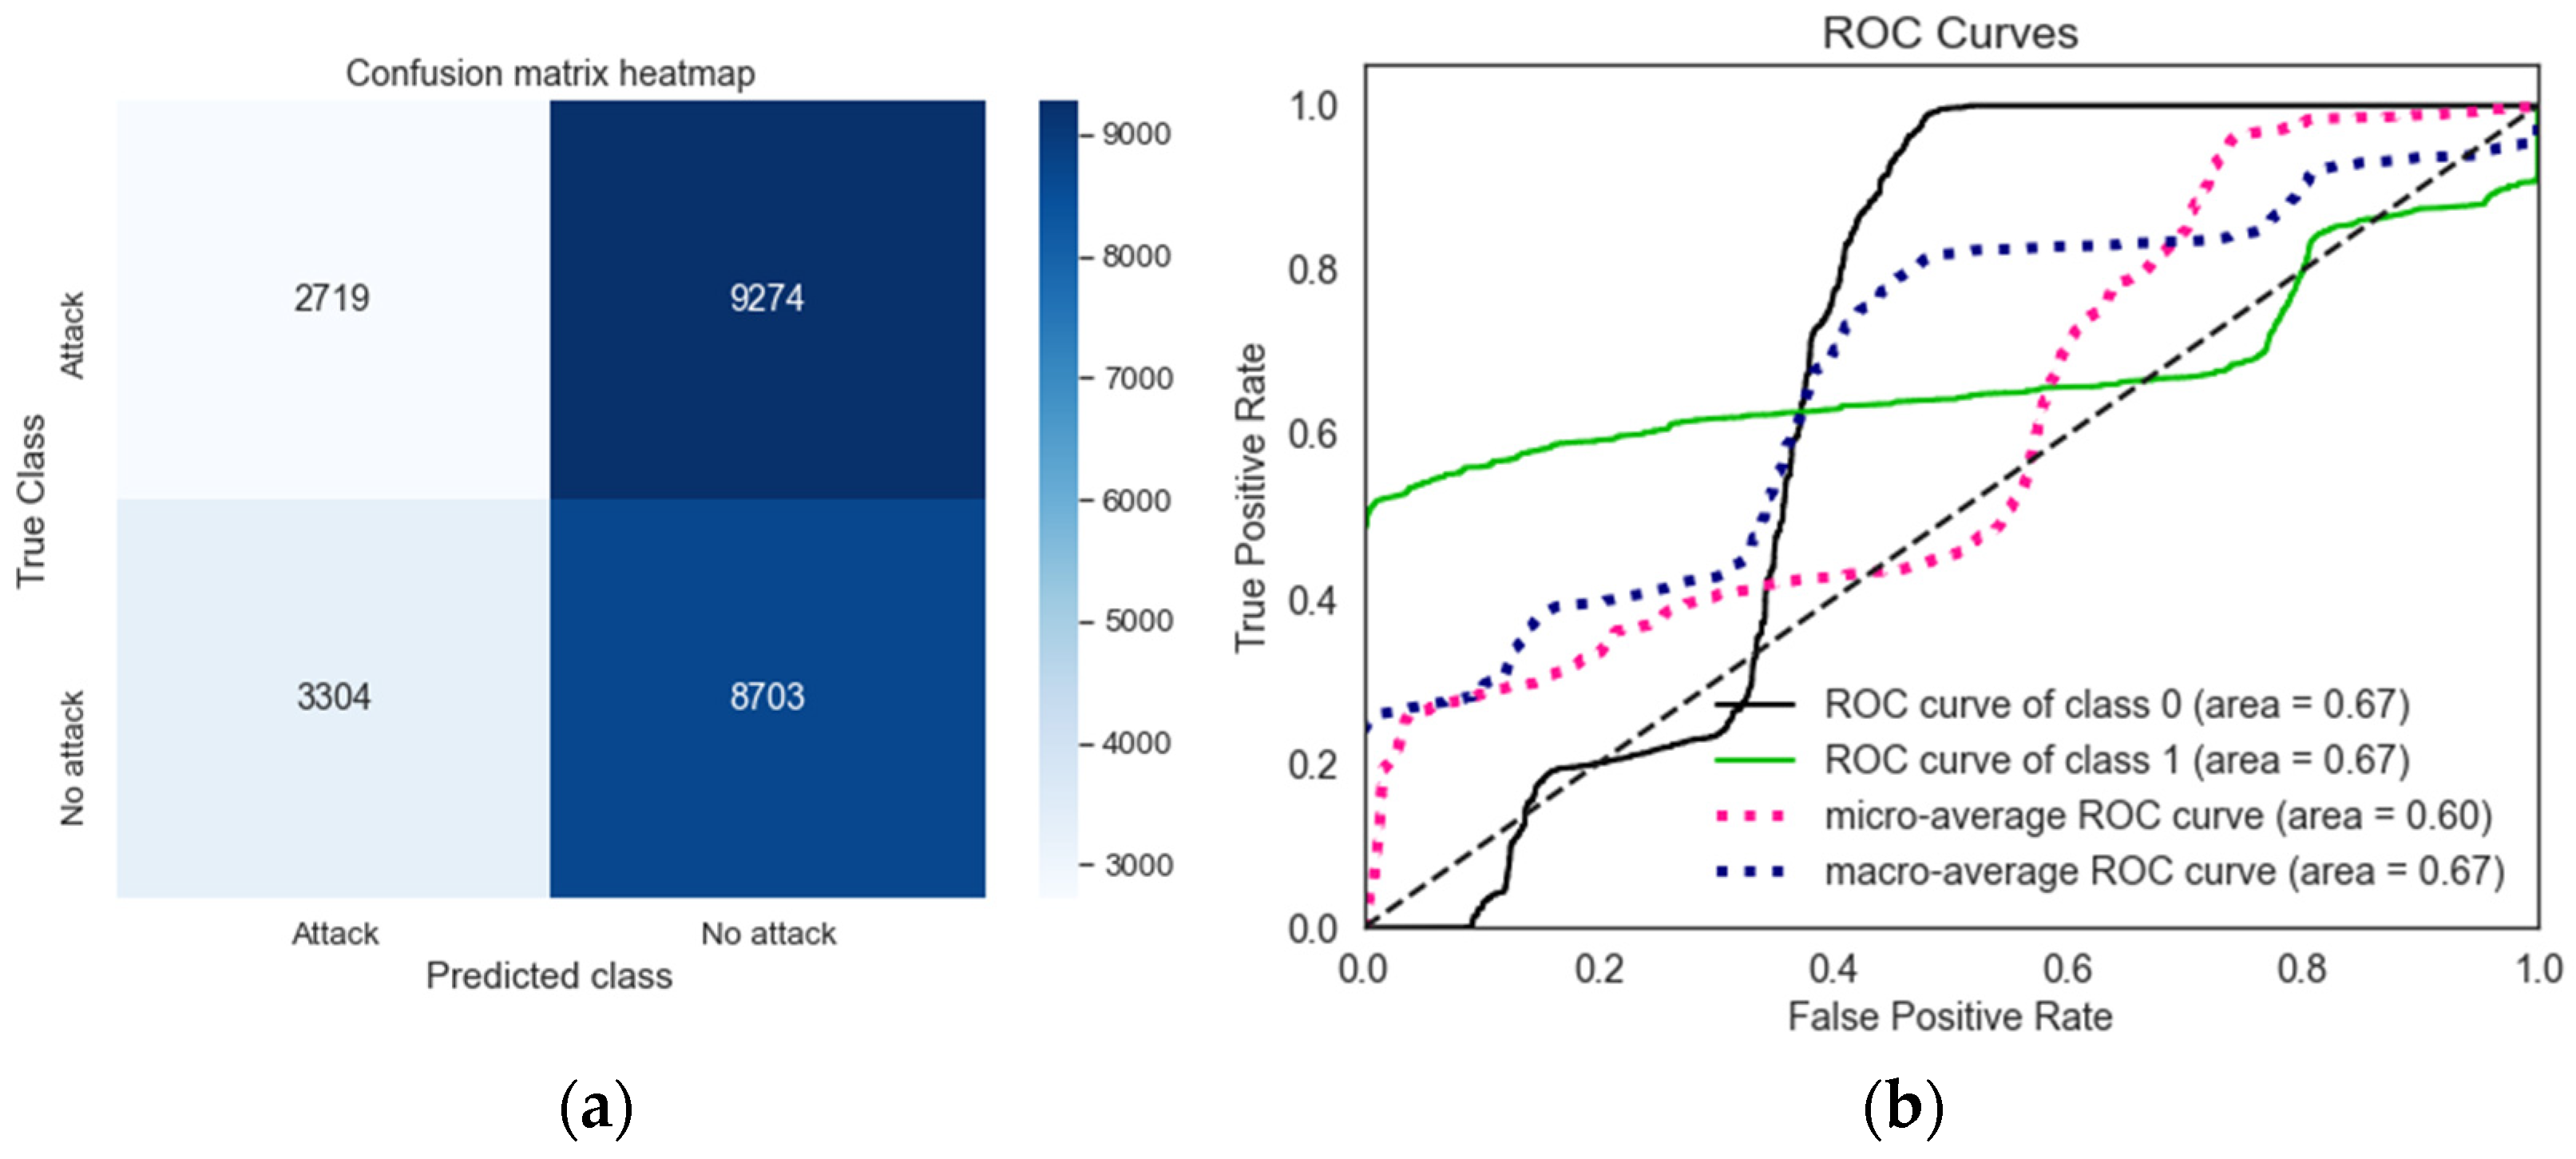
Figure 5a shows that the LR trusted model misclassified 12 attack events as benign. However,
Figure 6a and
Figure 7a reveal that this number increases to 11,993 under random label flipping attacks and 9683 under targeted label flipping attacks, respectively. Furthermore,
Figure 6a demonstrates that under the random label flipping attack, the LR model fails to correctly classify any attack events, resulting in zero correct attack classifications. These observations indicate that the random label flipping attack has a more significant impact on the LR model by increasing the false negative rate compared to the targeted label flipping attack.
The ROC curve and Area Under the Curve (AUC) score further highlight the model’s performance. The LR trusted model achieves an average AUC score of 0.755, indicating its ability to distinguish between attack and benign events, as shown in
Figure 5b. In contrast, the AUC scores drop to 0.49 and 0.655 under random and targeted label flipping attacks, as shown in
Figure 6b and
Figure 7b, respectively.
The confusion matrix and ROC curve for the LR model in binary classification under JSMA and FGSM attacks are presented in
Figure 8 and
Figure 9, respectively. Analyzing both figures reveals that, for the LR binary classification model, the FGSM attack has a slightly greater impact on reducing the model’s true positive rate and increasing its false positive rate compared to the JSMA.
However, compared to the trusted model, both attacks significantly reduce the true positive rate and considerably increase the false negative rate for the attack events. Additionally, the ROC curve and AUC score decrease from 0.755 in the LR trusted model (
Figure 5b) to 0.7025 under the JSMA (
Figure 8b), and further drop to 0.4225 under the FGSM attack (
Figure 9b).
The confusion matrix and ROC curve for the LR multiclass classification model are presented in
Figure 10. In the confusion matrix, the highest misclassifications, where the model incorrectly classifies true attacks as benign events, occur for attacks on the level setpoint and temperature setpoint, respectively.
Regarding the ROC curve and AUC score, the LR trusted model for multiclass classification demonstrates the ability to distinguish attack events from benign events, achieving an average AUC score of 0.843.
4.2.2. SVM Trusted Models vs. Adversarial Examples
For the Support Vector Machine (SVM) trusted model, due to speed limitations, a Keras Quasi-SVM model [
33] was developed. This model incorporates a Random Fourier Features layer, configured with a Gaussian kernel, to kernelize linear models by applying a non-linear transformation to the input features, followed by training a linear model on the transformed features.
The confusion matrix and ROC curve for SVM binary classification without adversarial attacks are presented in
Figure 11. Compared to the LR trusted model (
Figure 5), the SVM model demonstrates superior performance, with a higher number of true positives and true negatives, and a lower number of false positives and false negatives. This improvement is reflected in the ROC curve and AUC score, which increases from 0.755 in the LR binary classification model (
Figure 5b) to 0.802 in the SVM binary classification model (
Figure 11b).
Similarly to the LR model, the highest misclassification in the SVM model involves benign events being incorrectly classified as malicious. However, unlike the LR model, the SVM model achieves zero misclassifications of attack events as benign. The confusion matrix and ROC curve for SVM binary classification under random and targeted label flipping attacks are shown in
Figure 12 and
Figure 13, respectively. Compared to the confusion matrix of the SVM trusted model (
Figure 11a), both random and targeted label flipping attacks significantly reduce the true positive rate and substantially increase the false negative rate for attack events (
Figure 12a and
Figure 13a).
The random label flipping attack has a more severe impact, reducing the true positive rate for attack events to zero. In contrast, under the targeted label flipping attack, the number of correctly predicted attack events decreases by 9274. Similarly, these attacks reduce the ROC curve and AUC score from 0.802 for the SVM trusted model to 0.4925 and 0.6525 under random and targeted label flipping attacks, respectively, as shown in
Figure 12b and
Figure 13b.
The confusion matrix and ROC curve for SVM multiclass classification are presented in
Figure 14. The results indicate that the model can distinguish attack events from benign events, with an average AUC score of 0.81. However, this is slightly lower than the LR equivalent, which achieves an AUC score of 0.843. Overall, the SVM multiclass classification model performs better in terms of fewer misclassifications, with most categories having zero misclassifications, except for attacks on the temperature setpoint.
4.2.3. ANN Trusted Models vs. Adversarial Examples
For the Artificial Neural Network (ANN) trusted model, four layers were used. The first three layers utilize ReLU activation, while the final layer uses softmax activation. The four layers consist of 32, 16, 8, and 4 neurons, respectively. The ANN model was compiled with the Adam optimizer, binary_crossentropy for loss calculation, and accuracy as the evaluation metric, as shown in
Figure 15. The model was trained for 30 epochs.
The confusion matrix and ROC curve for the ANN trusted model in binary classification are presented in
Figure 16. Compared to the LR model (
Figure 5a) and the SVM model (
Figure 11a), the ANN binary classification model performs better, particularly in terms of a lower number of benign events misclassified as malicious. This number is approximately six times higher in the SVM model and nine times higher in the LR model. Consequently, the ANN model achieves an improved ROC curve and AUC score of 0.99 (
Figure 16b), compared to 0.755 (
Figure 5b) for LR and 0.802 (
Figure 11b) for SVM.
The confusion matrices and ROC curves for the ANN model under JSMA and FGSM attacks are shown in
Figure 17a and
Figure 18a, respectively. Compared to the ANN trusted model, both attacks significantly reduce the true positive and true negative rates, while drastically increasing the false positive and false negative rates for both malicious and benign events.
However, JSMA has a greater impact on reducing the true positive rate for malicious events and increasing the false positive rate for benign events. In contrast, the FGSM has a more substantial impact on increasing the false negative rate for malicious events and reducing the true positive rate for benign events. The ANN model’s ROC curve and AUC score decrease from 0.99 (
Figure 16b) to 0.72 (
Figure 17b) under the JSMA, and to 0.7425 (
Figure 18b) under the FGSM attack.
The confusion matrix and ROC curve for the ANN multiclass classification model are presented in
Figure 19. These results demonstrate that the model is highly capable of detecting attacks over benign events, with an average AUC score of 0.993, compared to 0.843 for LR and 0.81 for SVM, respectively. The biggest improvement with the ANN multiclass classification model is seen in the true classification of level setpoint attacks, which is approximately six times higher than in the LR model, and four times higher than in the SVM model.
4.3. LR vs. SVM vs. ANN Against Adversarial Examples
In this section, we compare the performance of the LR, SVM, and ANN models across various adversarial attack scenarios, which include the following: (1) label noise adversarial attacks (e.g., random label flipping and targeted label flipping attacks) performed against LR and SVM for binary classification; and (2) FGSM and JSMA attacks performed against LR and ANN for both binary and multiclass classifications. For this comparison, we use evaluation metrics such as accuracy, recall, precision, and F1-score.
As discussed earlier, in the random label flipping attack, an arbitrary portion of the labels is selected and reversed (i.e., a label of 0, representing a benign event, is flipped to 1, representing a malicious event, and vice versa). In the targeted label flipping attack, the labels with the longest absolute distance from the model’s predictions are selected and flipped. The flipped percentage for both random and targeted attacks starts at 0% and increases to 70%, in increments of 10%. It is expected that this incremental increase will result in a gradual reduction in the model’s performance. Additionally, the performance reduction is expected to be less in the lower ranges (e.g., 10% and 20%) compared to the higher ranges (e.g., 60% and 70%). Furthermore, a greater negative impact on the model’s performance (i.e., higher performance reduction) is expected in the targeted label flipping attack compared to the random label flipping attack.
Figure 20 illustrates the accuracy, recall, precision, and F1-score for LR vs. SVM binary classification after random and targeted label flipping attacks. The False Negative (FN) rate is proportional to the recall score, meaning that as the number of FNs increases, the recall score decreases, and vice versa. In the case of random label flipping, the accuracy decreases more rapidly than the recall. This indicates that the number of False Positives (FPs), which is proportional to the accuracy score, is increasing faster than the number of FNs. The increased FP rate will create more overhead for a system or security administrator within an organization. However, the opposite is true in the case of targeted label flipping, where recall decreases more rapidly and remains lower than accuracy, meaning the number of FNs increases faster than the number of FPs. The increased FN rate is the most dangerous scenario for an organization’s Intrusion Detection System (IDS), as it misidentifies an attack as benign. This leads to the IDS failing to detect attacks, with the FN rate rising gradually as the flipped percentage increases.
Therefore, in the binary classification scenario, hackers are more likely to succeed with a targeted label flipping attack compared to a random label flipping attack. This is because the former enables evasion, while the latter increases the number of system lockouts for legitimate users. Additionally, on average, the SVM demonstrates a longer resistance to the targeted label flipping attack compared to LR. However, both algorithms show almost identical performance against the random label flipping attack. It was expected that the gradual increase in the flipped percentage would result in a progressive decrease in model performance. This trend is only observed in the case of the targeted label flipping attack. Furthermore, for this attack, the performance reduction begins at lower percentages (i.e., before flipping 50% of the data), while in the random label flipping attack, it starts later. This indicates that, despite the random label flipping attack, hackers can significantly reduce the IDS’s performance by flipping a relatively low percentage of the data when performing the targeted label flipping attack. This demonstrates that the targeted label flipping attack is more effective from a hacker’s perspective (e.g., it takes less time).
In this paper, the random and targeted label flipping attacks are implemented under the assumption that hackers have access to the training data and can manipulate it. However, as previously explained, for the FGSM and JSMA, it is assumed that hackers have access to the testing data in order to evade detection in both binary and multiclass classification scenarios. In the FGSM, the degree of perturbation applied to the testing data ranges from 0.05 to 0.3, while in JSMA, the fraction of test features to be perturbed varies between 0.02 and 0.2. The expectation is that a higher perturbation rate in the FGSM (i.e., epsilon) and a larger fraction size in JSMA will result in a greater decline in the model’s performance, and that the ANN will demonstrate greater resistance to FGSM and JSMA attacks compared to LR.
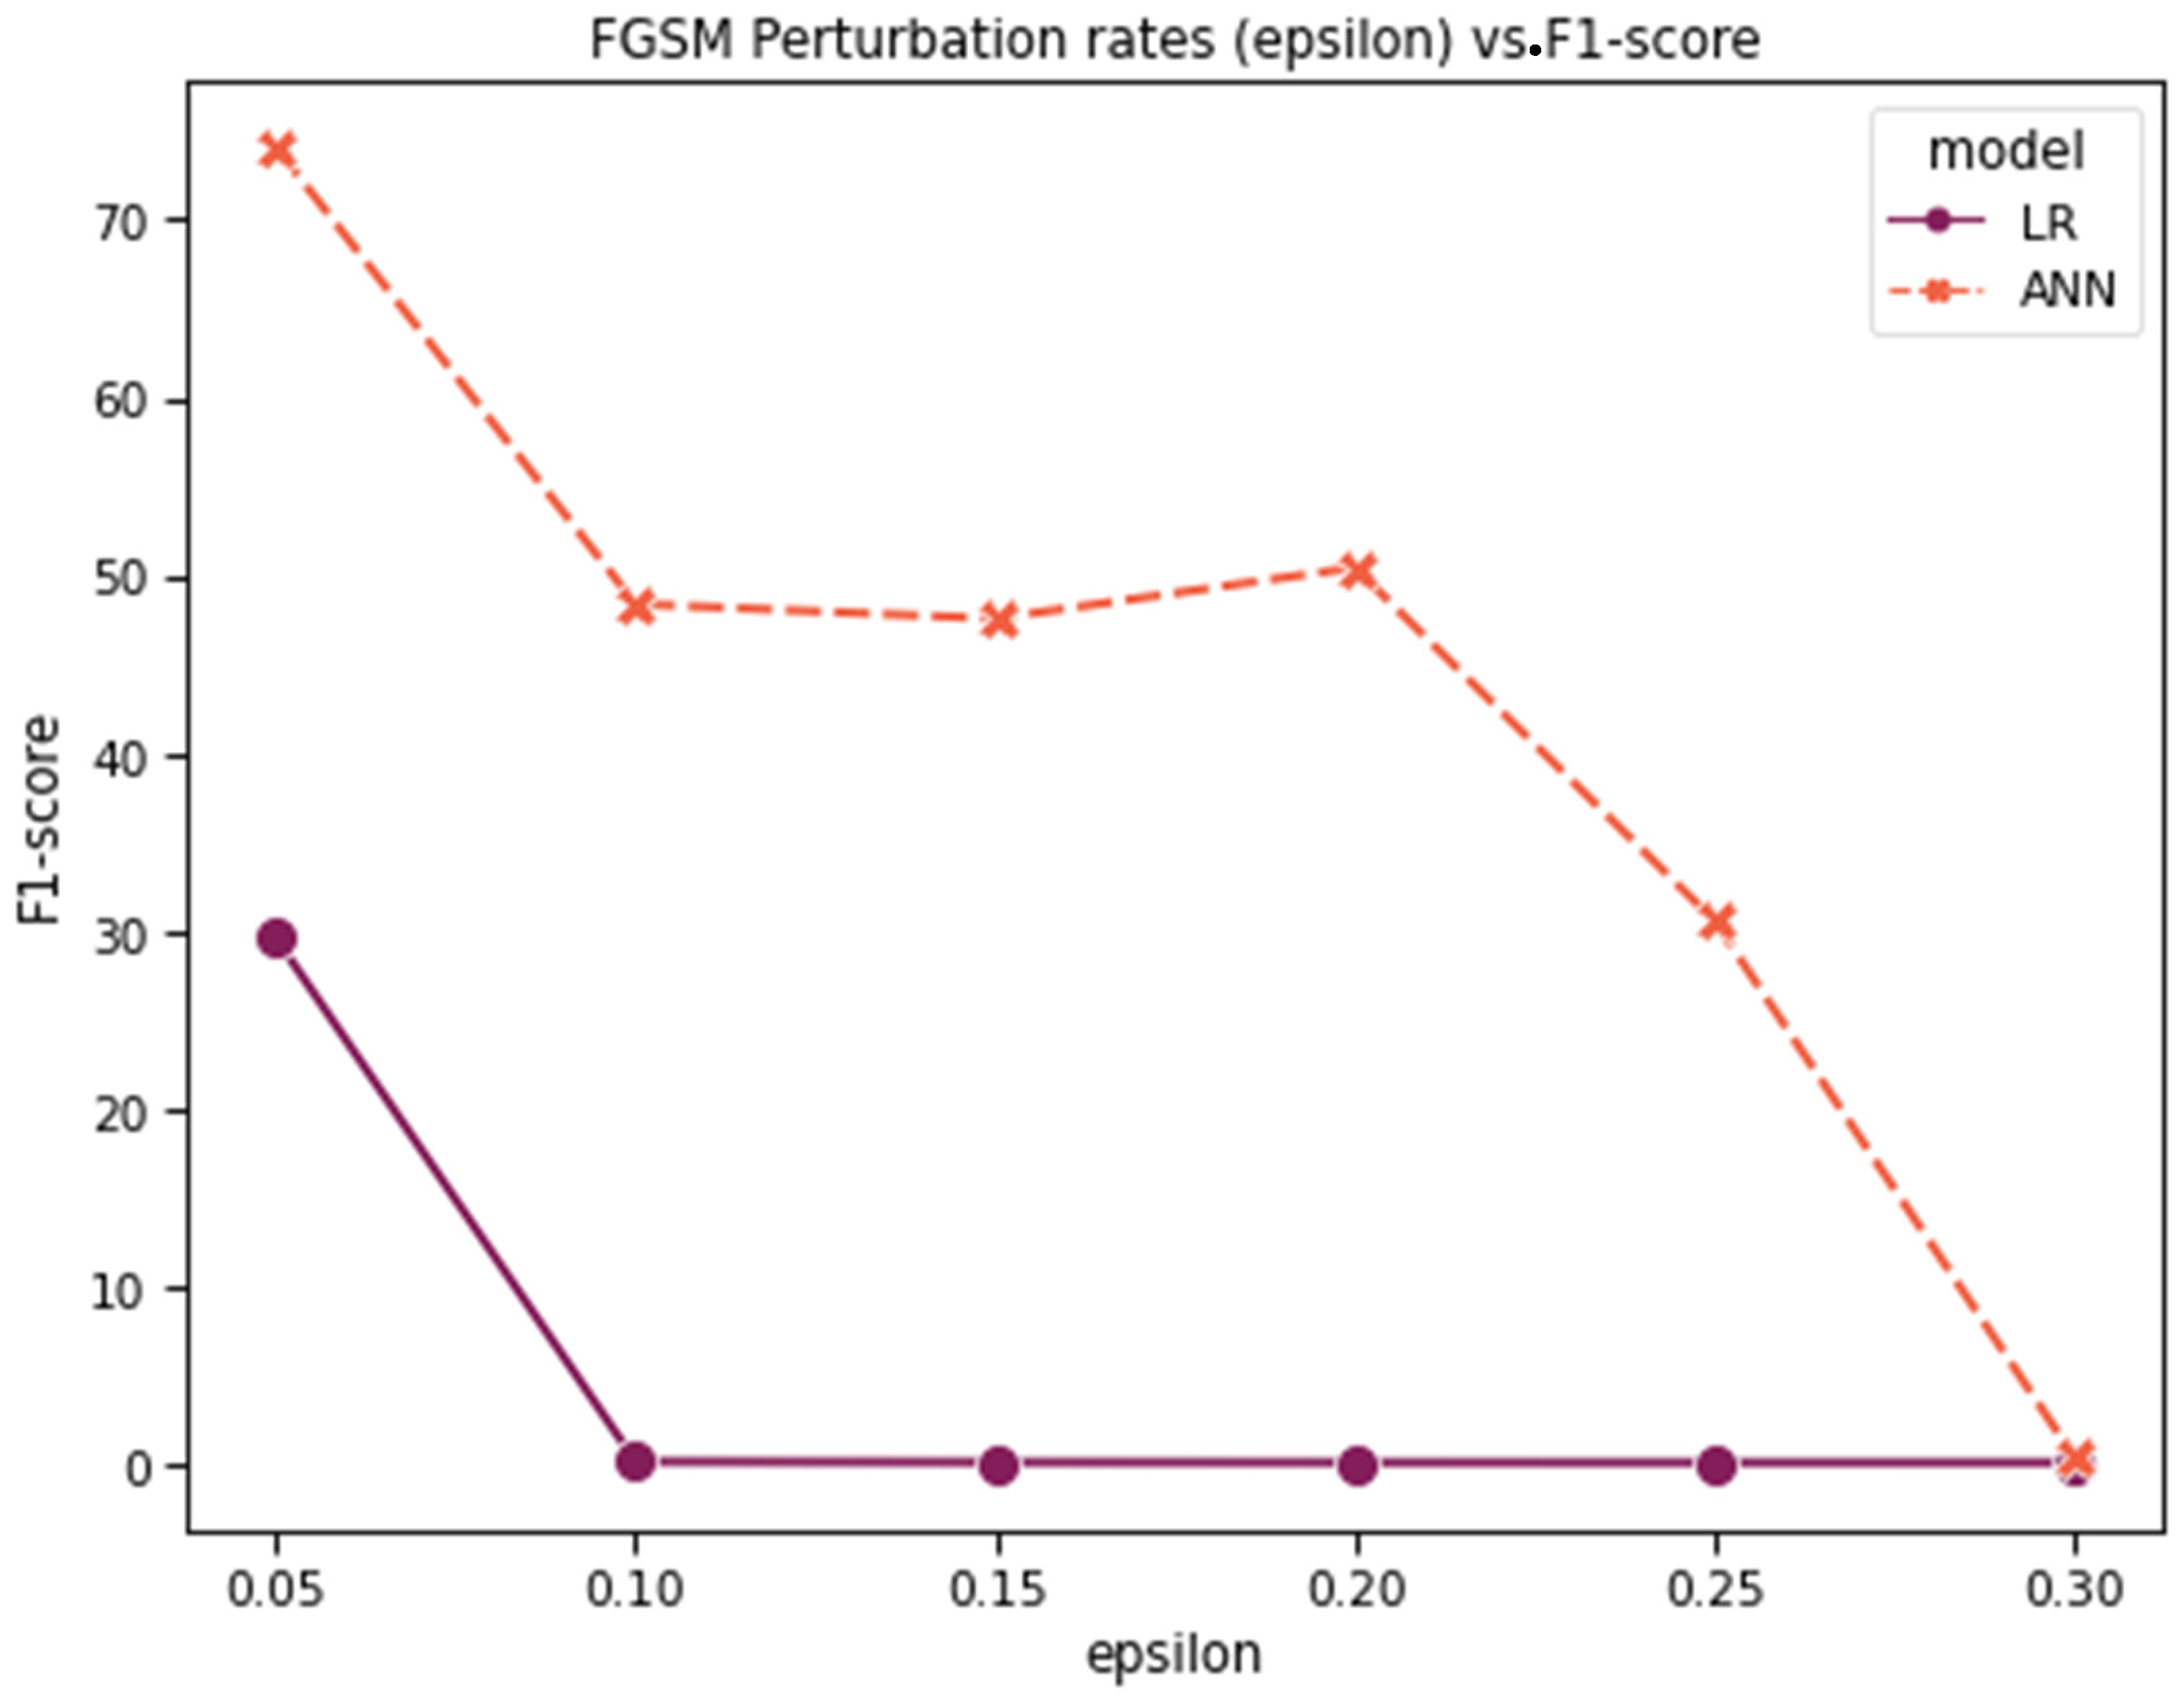
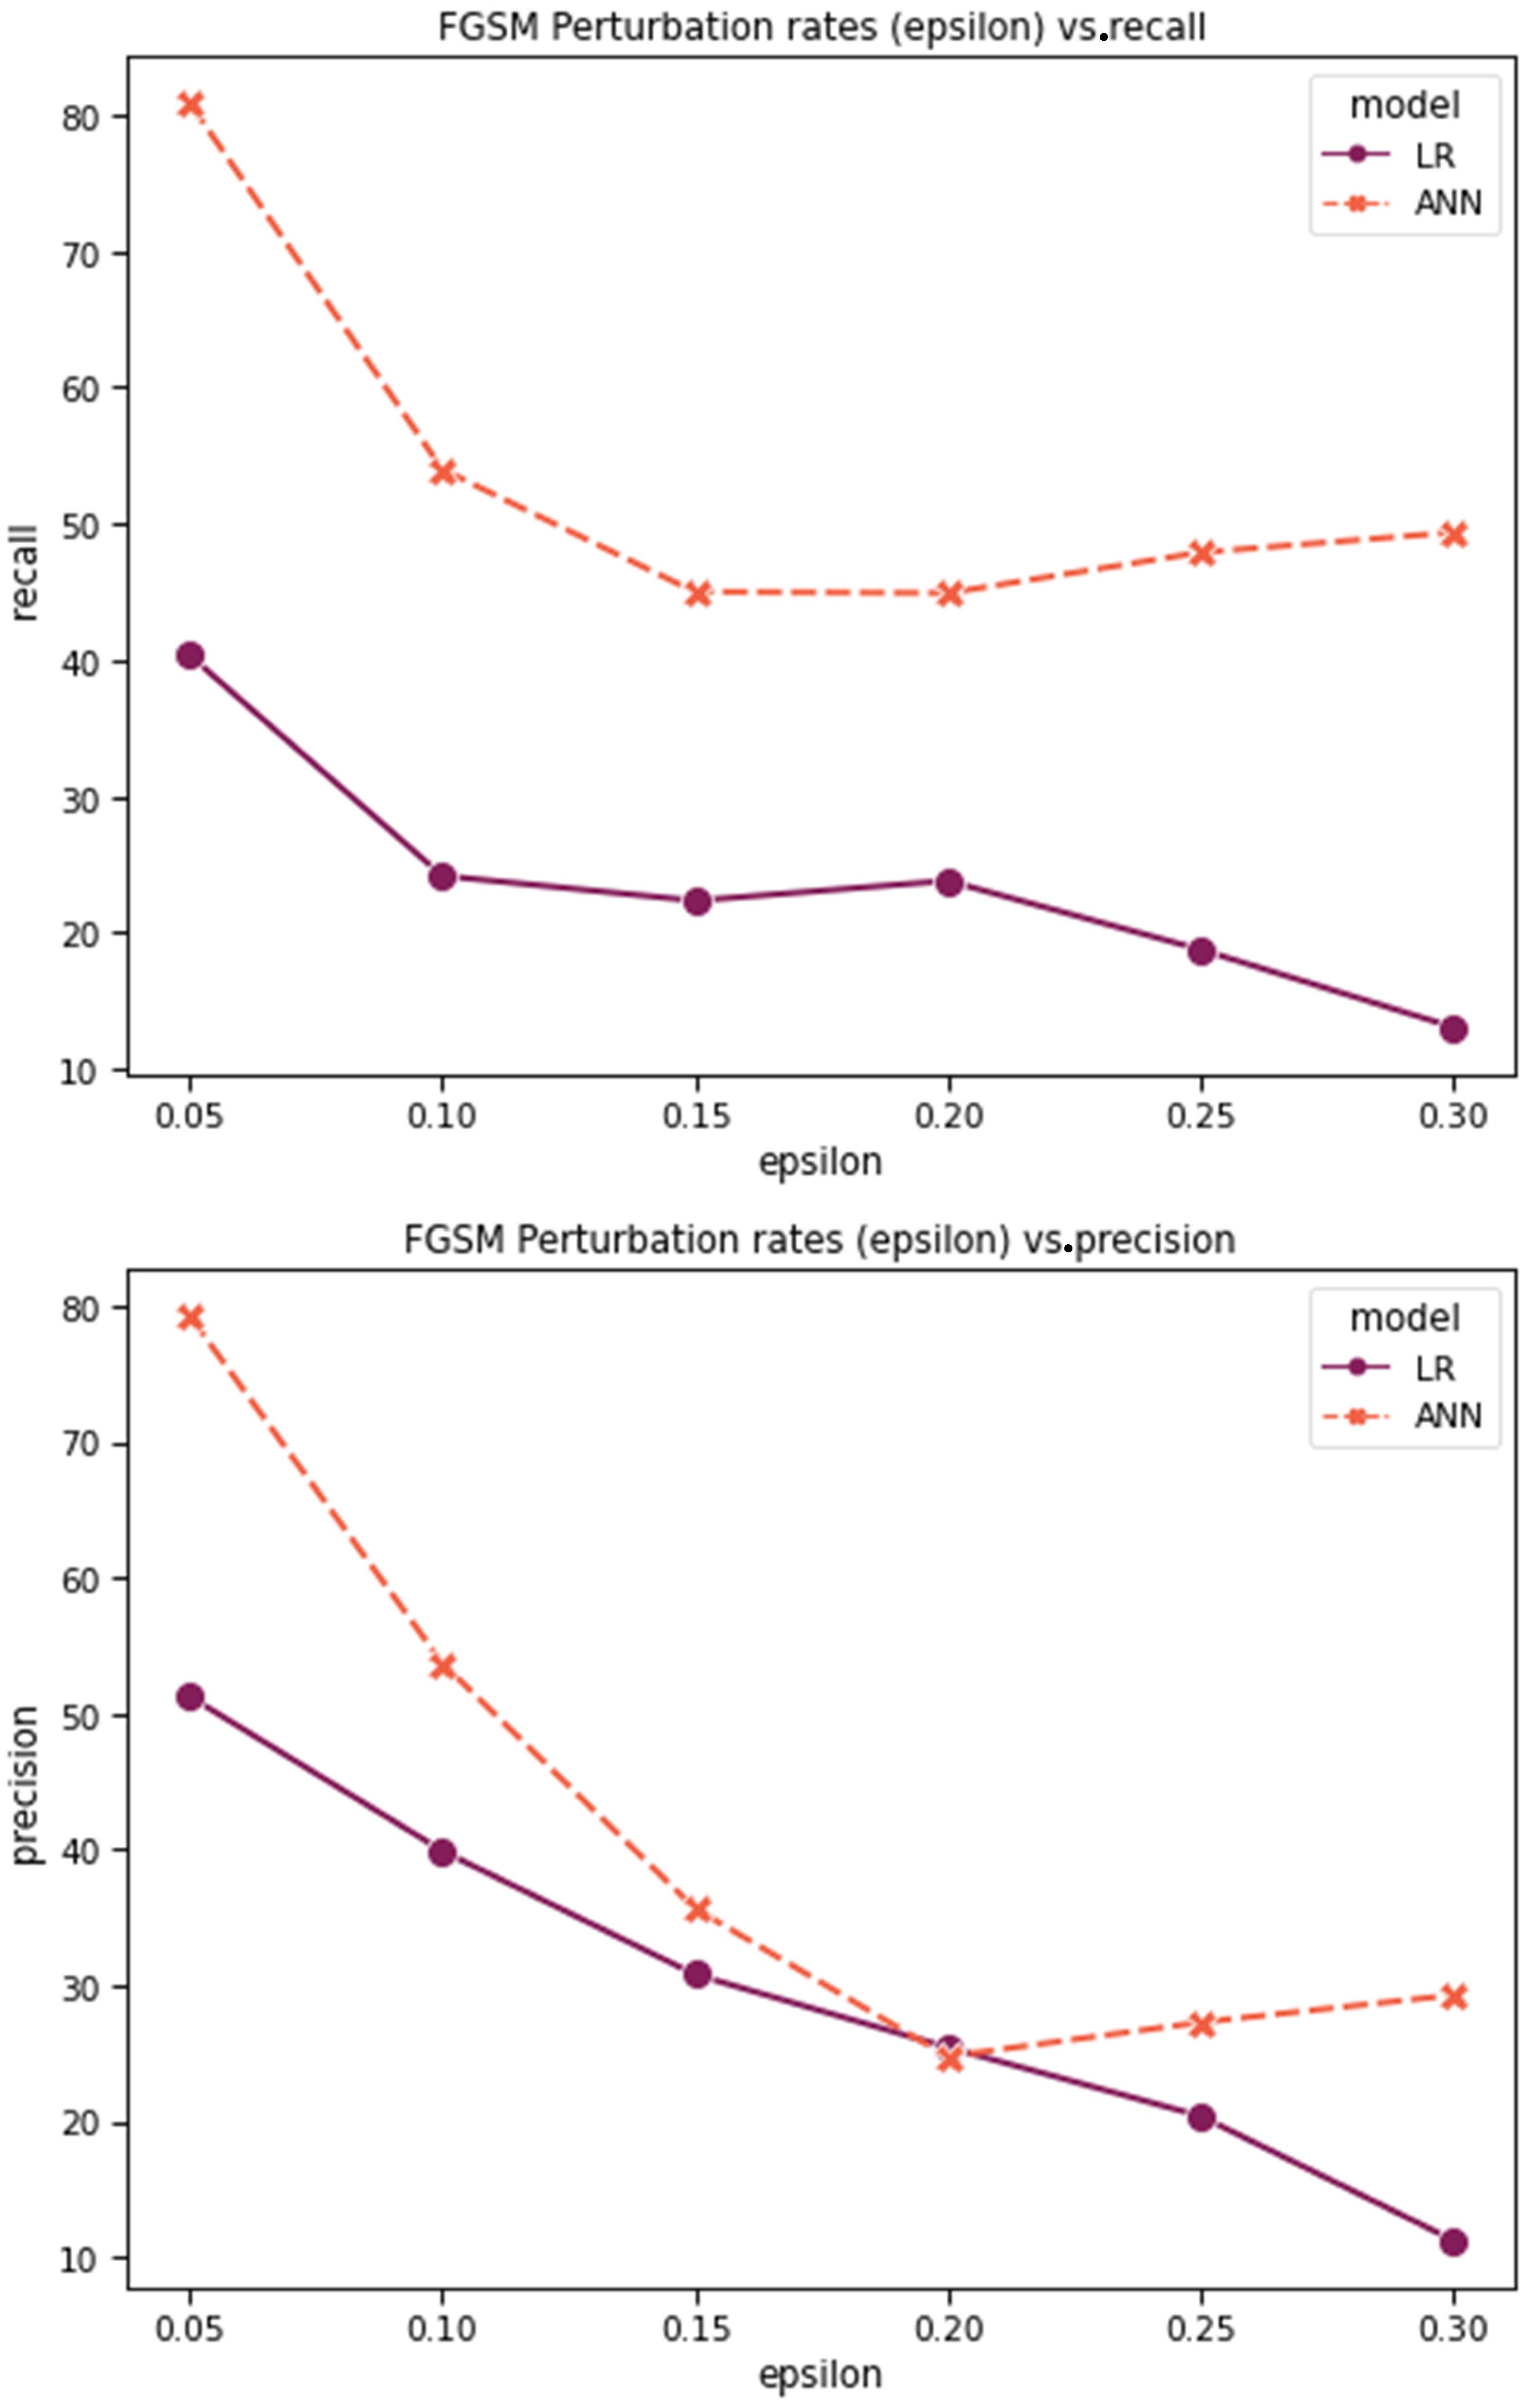
Figure 21 shows the accuracy, recall, precision, and F1-score for LR vs. ANN binary classification after the FGSM attack, while
Figure 22 presents these comparison metrics for the JSMA. As expected, LR performs weaker than the ANN against both FGSM and JSMA attacks, as its accuracy drops more quickly. However, in the case of the FGSM, recall decreases faster than accuracy, in contrast to the JSMA. This indicates that the FN rate increases faster than the FP rate during the FGSM attack. Therefore, an attacker is likely to have more success by performing the FGSM attack on the testing data in the binary classification scenario.
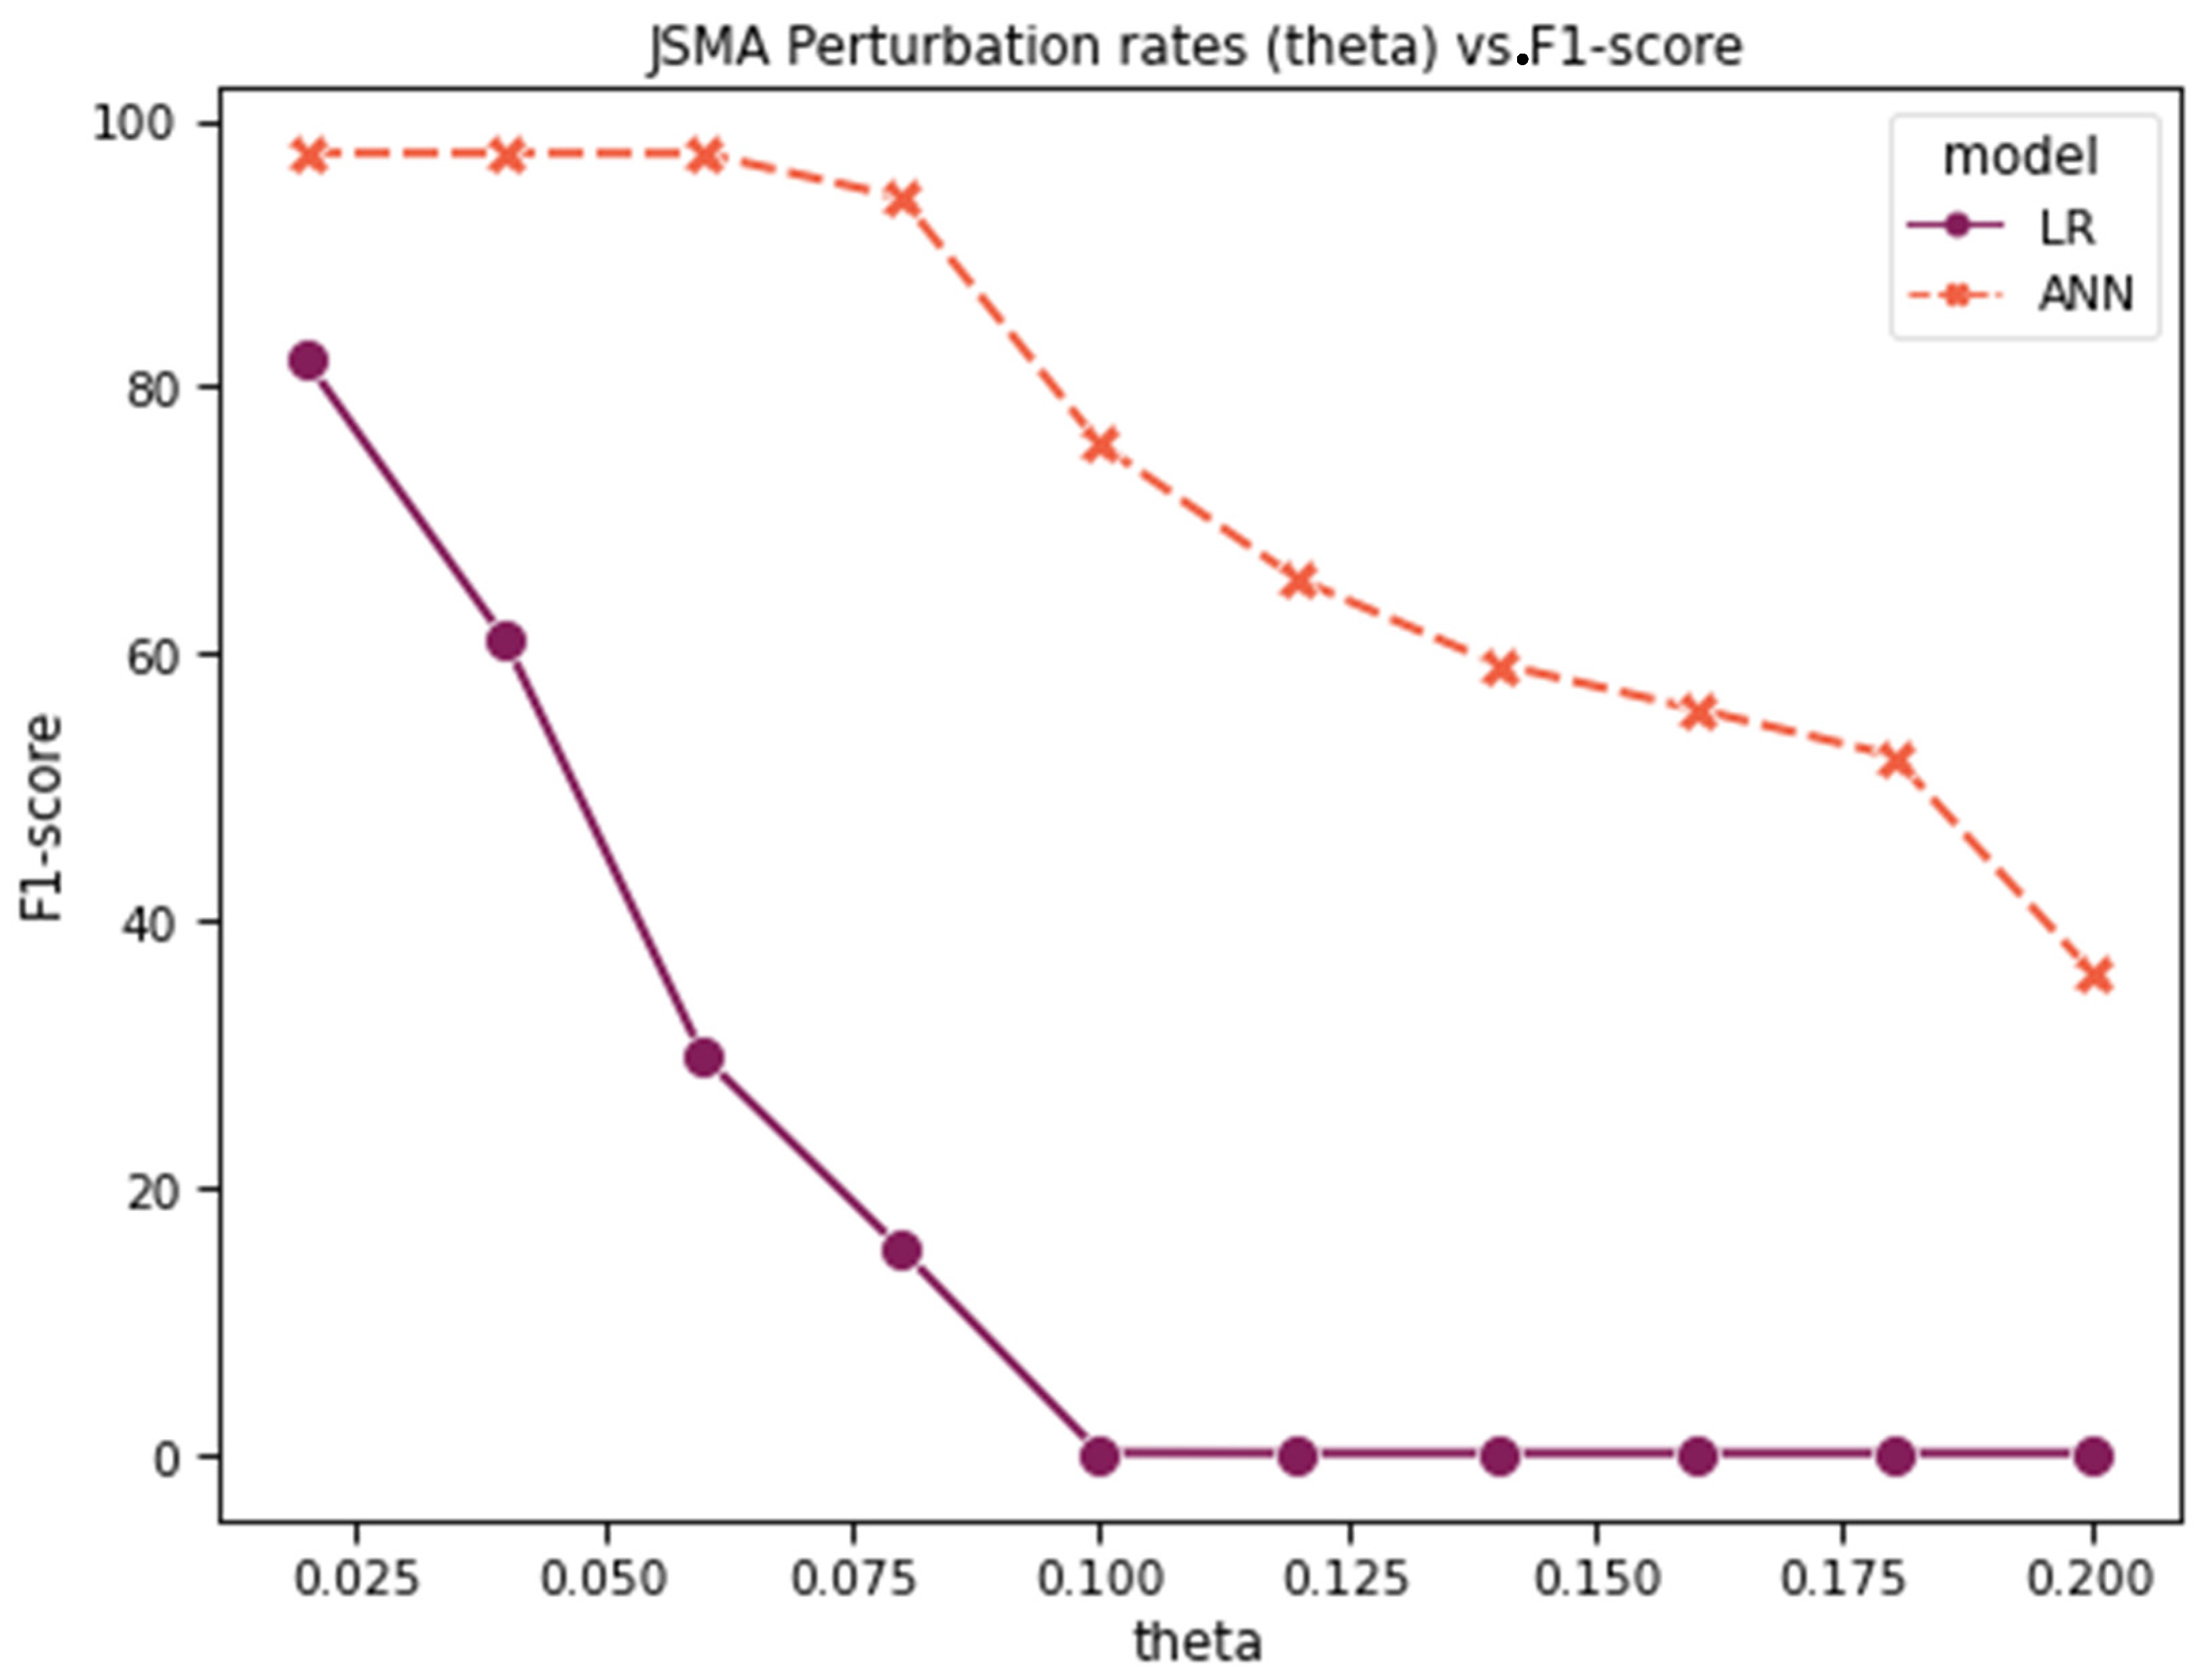
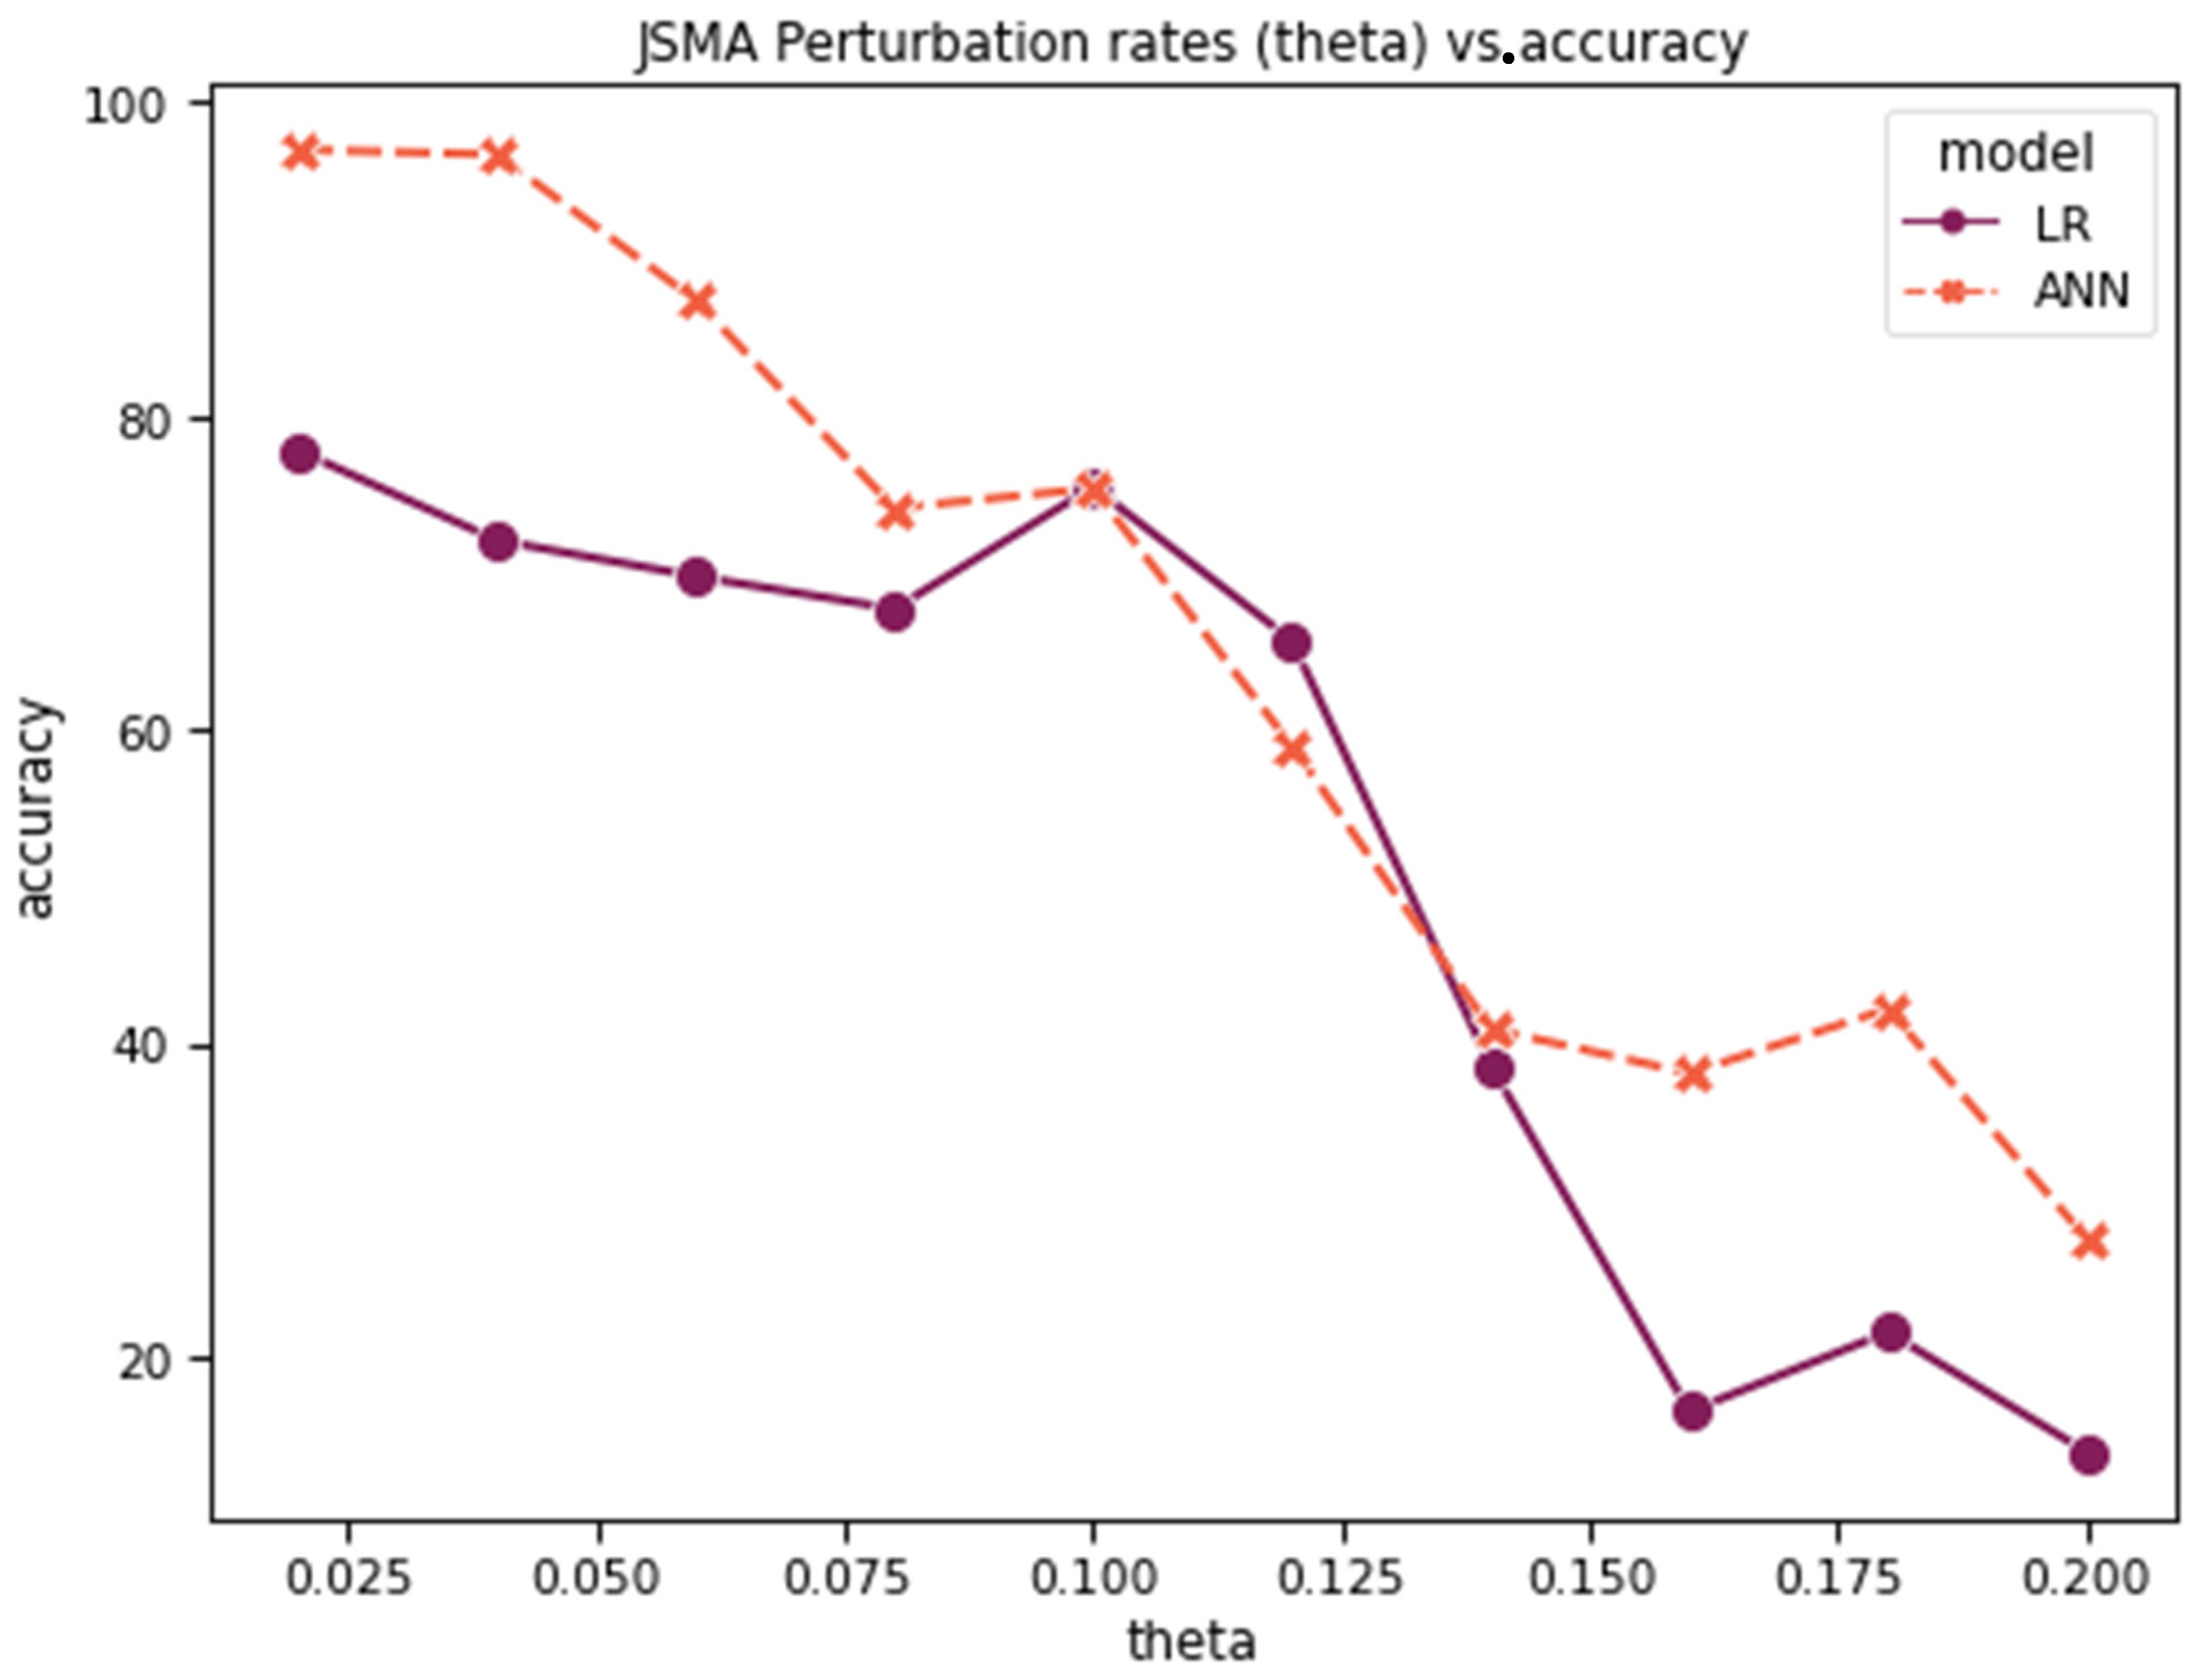
Figure 23 and
Figure 24 show the accuracy, recall, precision, and F1-score for LR vs. ANN multiclass classification after the FGSM and JSMA attacks, respectively. As with the previous experiments, LR demonstrates weaker resistance to both attacks compared to the ANN.
5. Conclusions
The work in this paper aims to provide a deeper understanding of adversarial attacks against both traditional and state-of-the-art machine learning algorithms, such as Support Vector Machines (SVMs), Logistic Regression (LR), and Deep Learning techniques such as Artificial Neural Networks (ANNs). It focuses on Industry 4.0 applications, with particular interest in Critical National Infrastructure (CNI), specifically a clean water treatment system. The study considers four popular adversarial attack categories: random label flipping, targeted label flipping, the Fast Gradient Sign Method (FGSM), and Jacobian-based Saliency Map Attack, targeting either training or testing data.
The paper then evaluates the robustness of a novel, energy-based dataset, captured from a model of a clean water treatment system, against these four attacks, taking into account both binary and multiclass classifications. For instance, random and targeted label flipping are applied to binary-class Logistic Regression (LR) and a Support Vector Machine (SVM), while the Fast Gradient Sign Method (FGSM) is applied to binary and multiclass Logistic Regression (LR) and Artificial Neural Networks (ANNs). Similarly, Jacobian-based Saliency Map Attack (JSMA) is evaluated against binary and multiclass Logistic Regression (LR) and Artificial Neural Networks (ANNs).
The paper employs four comparison metrics: F1-score, accuracy, recall, and precision, to assess the impact of adversarial attacks on the performance of the chosen machine learning algorithms.
Regarding the binary classification results, the targeted label flipping attack has a more significant impact on performance reduction compared to the random label flipping attack. The observed outcome is attributed to the nature of the attack. As the name suggests, the targeted flipping attack selects events that have the most significant impact on the outcome of the machine learning algorithm. By choosing these events and flipping their labels, the attack exerts a greater negative effect on the final outcome. This contrasts with random label flipping, where events are selected arbitrarily, and their labels are flipped without considering the overall importance of each event for the predicted outcome.
Additionally, the SVM and ANN demonstrate greater resilience against targeted label flipping, the FGSM, and JSMA when compared to Logistic Regression. However, the SVM and LR show almost identical performance against the random label flipping attack. In multiclass classification, the ANN shows more resistance against the FGSM and JSMA compared to LR. In general, this observation aligns with what we expected from the SVM and ANN when they are under targeted label flipping, FGSM, and JSMA attacks. The SVM and ANN outperform LR due to their non-linear nature, robust feature representation, and strength in integrating advanced defense mechanisms. For example, the model complexity and non-linearity of SVM and ANN, compared to LR, provide greater resilience. LR is a linear model, and this lack of complexity makes it easier for adversarial attacks to shift predictions, making it more susceptible to adversarial manipulations. Other factors include a lack of margin and robustness, as well as limited capacity to generalize when adversarial noise is present.
The novelty of the research in this paper lies in evaluating the robustness of a novel energy-based machine learning mechanism, derived from a model of a clean water treatment system, to detect anomalies in such systems. This approach has the potential to be expanded to other domains, such as transportation and energy sectors. Future work will focus on using a physical testbed modeling a clean water treatment system, as opposed to a simulation, along with the implementation and evaluation of potential countermeasures against adversarial machine learning attacks. The effectiveness of these countermeasures will also be studied on the aforementioned testbed. Our third goal is to consider additional metrics beyond energy consumption to identify how we could strengthen anomaly detection by combining energy consumption with other important metrics, such as network and communication metrics, system performance metrics, user behavior metrics, sensor data metrics, time series metrics, event-based metrics, and application-specific metrics. This may require eliminating some energy features during the feature reduction stage, and broadening the feature set.


